Attached files
| file | filename |
|---|---|
| 8-K - CHINA FUND INC | fp0007311_8k.htm |
|
Apr 30, 2013
|
Monthly Insight
The China Fund, Inc. (CHN)
|
|
Investment Objective
|
The investment objective of the Fund is to achieve long term capital appreciation. The Fund seeks to achieve its objective through investment in the equity securities of companies and other entities with significant assets, investments, production activities, trading or other business interests in China or which derive a significant part of their revenue from China.
The Fund has an operating policy that the Fund will invest at least 80% of its assets in China companies. For this purpose, ‘China companies’ are (i) companies for which the principal securities trading market is in China; (ii) companies for which the principal securities trading market is outside of China or in companies organized outside of China, that in both cases derive at least 50% of their revenues from goods or services sold or produced, or have a least 50% of their assets in China; or (iii) companies organized in China. Under the policy, China will mean the People’s Republic of China, including Hong Kong, and Taiwan. The Fund will provide its stockholders with at least 60 days’ prior notice of any change to this policy.
|
Performance Overview
|
|
Performance History
|
1 month
|
3 months
|
YTD
|
1 Year
|
3 Years
(p.a.) |
5 Years
(p.a.) |
10 Years
(p.a.) |
Since
Inception |
|
NAV (%)
|
1.59
|
0.04
|
4.69
|
8.99
|
1.02
|
2.78
|
18.56
|
10.82
|
|
Market price (%)
|
0.29
|
-6.23
|
-1.59
|
6.45
|
1.65
|
3.31
|
17.72
|
9.77
|
|
Benchmark (%)
|
2.31
|
-2.52
|
0.83
|
9.72
|
5.16
|
0.60
|
13.92
|
N/A
|
|
Performance History
|
2012
|
2011
|
2010
|
2009
|
2008
|
2007
|
2006
|
2005
|
|
NAV (%)
|
12.07
|
-24.37
|
27.25
|
72.82
|
-46.95
|
86.20
|
57.10
|
6.09
|
|
Market price (%)
|
20.46
|
-27.51
|
23.60
|
72.19
|
-40.65
|
50.24
|
65.67
|
-21.51
|
|
Benchmark (%)
|
22.65
|
-18.36
|
13.60
|
67.12
|
-49.37
|
37.97
|
39.50
|
10.27
|
Source: State Street Bank and Trust Company. Source for index data: MSCI as at April 30, 2013.
|
Portfolio Analysis
|
|
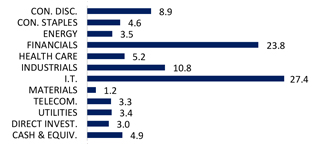
Sector allocation (%)
|
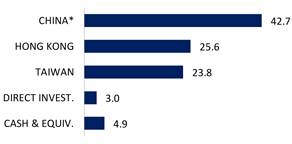
Country allocation (%)
|
 |
 |
|
Source: State Street Bank and Trust Company as at April 30, 2013.
|
* China includes A-shares (6.2%), A-share equity linked securities (7.4%),
B-shares (0.0%), H-shares (13.0%) and Red-chips (16.1%).
|

The China Fund, Inc. (CHN)
|
Portfolio Analysis (continued)
|
| Top 10 Holdings | Sector | % |
|
HAND ENTERPRISE SOLUTIONS CO., LTD.
|
I.T.
|
6.2
|
|
TAIWAN SEMICONDUCTOR MANUFACTURING CO., LTD.
|
I.T.
|
6.1
|
|
INDUSTRIAL & COMMERCIAL BANK OF CHINA
|
FINANCIALS
|
5.7
|
|
CHINA EVERBRIGHT INTERNATIONAL, LTD.
|
INDUSTRIALS
|
5.6
|
|
SUN HUNG KAI PROPERTIES, LTD.
|
FINANCIALS
|
4.9
|
|
ENN ENERGY HOLDINGS, LTD.
|
UTILITIES
|
3.4
|
|
CHINA MOBILE, LTD.
|
TELECOM
|
3.3
|
|
CHINA MEDICAL SYSTEM HOLDINGS, LTD.
|
HEALTHCARE
|
3.1
|
|
CHINA RESOURCES LAND, LTD.
|
FINANCIALS
|
2.6
|
|
DIGITAL CHINA HOLDINGS, LTD.
|
I.T.
|
2.5
|
| Total | 43.4 |
|
Direct Investments
|
Sector
|
%
|
|
GOLDEN MEDITECH HOLDINGS, LTD. 15.0%, 5/16/13
|
OTHERS
|
1.5
|
|
GOLDEN MEDITECH HOLDINGS, LTD. 15.0%, 11/16/13
|
OTHERS
|
1.5
|
|
Total
|
3.0
|
|
Source: State Street Bank and Trust Company as at April 30, 2013.
|
Fund Details
|
|
NAV
|
$23.64
|
|
Market price
|
$21.07
|
|
Premium/Discount
|
-10.87%
|
|
Market cap
|
US$330.4m
|
|
Shares outstanding
|
15,682,029
|
|
Exchange listed
|
NYSE
|
|
Listing date
|
July 10, 1992
|
|
Benchmark
|
MSCI Golden Dragon Index (Total Return)
|
|
Fund Manager
|
Christina Chung
|
|
Listed and direct investment manager
|
RCM Asia Pacific Limited
|
Source: State Street Bank and Trust Company as at April 30, 2013.
|
Dividend History (10 years)
|
|
Declaration
date
|
Ex-dividend
date
|
Record
date
|
Payable
date
|
Dividend/
Share
|
Income
|
Long-term Capital
|
Short-term Capital
|
|
10 Dec 2012
|
20 Dec 2012
|
24 Dec 2012
|
28 Dec 2012
|
3.2517
|
0.3473
|
2.9044
|
0.0000
|
|
8 Dec 2011
|
21 Dec 2011
|
23 Dec 2011
|
29 Dec 2011
|
2.9964
|
0.1742
|
2.8222
|
0.0000
|
|
8 Dec 2010
|
21 Dec 2010
|
24 Dec 2010
|
29 Dec 2010
|
2.2742
|
0.3746
|
1.8996
|
0.0000
|
|
9 Dec 2009
|
22 Dec 2009
|
24 Dec 2009
|
29 Dec 2009
|
0.2557
|
0.2557
|
0.0000
|
0.0000
|
|
8 Dec 2008
|
22 Dec 2008
|
24 Dec 2008
|
23 Jan 2009
|
5.8174
|
0.4813
|
5.3361
|
0.0000
|
|
7 Dec 2007
|
19 Dec 2007
|
21 Dec 2007
|
25 Jan 2008
|
12.1200
|
0.2800
|
9.0000
|
2.8400
|
|
8 Dec 2006
|
19 Dec 2006
|
21 Dec 2006
|
29 Dec 2006
|
4.0117
|
0.2996
|
2.7309
|
0.9812
|
|
9 Dec 2005
|
19 Dec 2005
|
21 Dec 2005
|
29 Dec 2005
|
2.5119
|
0.2172
|
2.2947
|
0.0000
|
|
13 Dec 2004
|
20 Dec 2004
|
22 Dec 2004
|
7 Jan 2005
|
3.5701
|
0.1963
|
3.2664
|
0.1074
|
|
19 Dec 2003
|
29 Dec 2003
|
31 Dec 2003
|
15 Jan 2004
|
1.7800
|
0.0700
|
0.6700
|
1.0400
|
Source : State Street Bank and Trust Company as at December 31, 2012
2
The China Fund, Inc. (CHN)
The China Fund Inc. NAV Performance of USD $10,000 since inception (with dividends reinvested at NAV price)

Past performance is not a guide to future returns.
Source: State Street Bank and Trust Company as at April 30, 2013.
The China Fund Inc. Premium / Discount

Past performance is not a guide to future returns.
Source: State Street Bank and Trust Company as at April 30, 2013.
3
The China Fund, Inc. (CHN)
Manager’s Commentary
Market Review
In April, the Hong Kong equity market continued to consolidate in the first half of the month. The market was mostly driven by China’s macroeconomic data and the reversion of sentiment, globally. Investors were also disappointed by China’s lower-than-expected 1Q13 GDP of 7.7%. Geopolitical concerns in the Korean peninsula, spreading bird flu in Shanghai areas, and a substantial sell-off in global commodities also dampened market sentiment. However, market sentiment was later lifted by the global stimulus package as well as the positive news flow around a new batch of RQFIIs, and widely reported discussions between the China Securities Regulatory Commission and MSCI on the eventual inclusion of A-shares in the MSCI Emerging Market index. Yet, a broader re-rating of the market still hinges on the structural reform agenda in China.
In Taiwan, the MSCI Taiwan rose 4.0%, outperforming both the MSCI APAC ex-Japan (2.4%) and MSCI EM indices (0.4%). The local index, the Taiwan Stock Exchange Weighted Index, rose 2.2% and closed at 8,094, up 5.1% year to date. Major drivers of the month included the return of the manufacturing sector’s total inventory to an upward trend and a pick-up in gross fixed capital investment. Expectations rose that export growth will pick up gradually on the back of a recovery of demand from China and the US.
Fund review
The Fund underperformed relative to the benchmark in April, mainly due to stock selection. Our stock selection in the financials, consumer discretionary, and staples sectors hurt the performance by partially offsetting the contributions from our stock selection in the industrials sector.
The top contributor for the month continued to be China Everbright International. The share price held up in April, driven by high revenue visibility of its new projects. Another contributor was Advantech, as the company released strong first quarter results, supporting the share price performance. On the negative side, one of the top detractors was Gree Electrical Appliances. Its share price was undermined by weaker than expected sales figures; however, the valuations were only at a low double-digit level.
Outlook
After a period of consolidation, the market appears oversold and we feel we should see some share price recovery in the short-term. In the absence of news flow relating to reform initiatives in China, we believe the China equity market will remain in a trading range.
For the Taiwan market, as first quarter GDP came in way below expectations, we continue to be cautious on macro risks. We will focus on selective opportunities in the sectors which can benefit from rising 3G penetration in emerging markets and the increasing popularity of low-end smartphones.
Source : RCM Asia Pacific Limited as at April 30, 2013.
4
The China Fund, Inc. (CHN)
Portfolio Holdings
|
CUSIP
|
Security Description
|
Cost Base
|
Base MV
|
Shares
|
Percentage of
Net Assets |
|
|
B3VN92906
|
HAND Enterprise Solutions Co., Ltd.
|
1,793,494.00
|
22,864,849.00
|
6,369,715
|
6.2
|
|
|
688910900
|
Taiwan Semiconductor Manufacturing Co., Ltd.
|
16,072,090.00
|
22,573,801.00
|
6,084,000
|
6.1
|
|
|
B1G1QD902
|
Industrial & Commercial Bank of China
|
20,739,449.00
|
20,986,172.00
|
29,829,000
|
5.7
|
|
|
663094902
|
China Everbright International, Ltd.
|
12,183,629.00
|
20,665,795.00
|
26,730,000
|
5.6
|
|
|
685992000
|
Sun Hung Kai Properties, Ltd.
|
17,289,798.00
|
18,362,985.00
|
1,269,000
|
4.9
|
|
|
633393905
|
Enn Energy Holdings, Ltd.
|
606,420.00
|
12,765,658.00
|
2,204,000
|
3.4
|
|
|
607355906
|
China Mobile, Ltd.
|
11,683,974.00
|
12,086,294.00
|
1,103,500
|
3.3
|
|
|
B6WY99909
|
China Medical System Holdings, Ltd.
|
853,792.00
|
11,442,775.00
|
11,669,300
|
3.1
|
|
|
619376908
|
China Resources Land, Ltd.
|
6,196,840.00
|
9,572,600.00
|
3,168,000
|
2.6
|
|
|
635186901
|
Digital China Holdings, Ltd.
|
13,205,899.00
|
9,144,038.00
|
7,256,000
|
2.5
|
|
|
913BMZ902
|
Ping An Insurance (Group) Company of China, Ltd. Access Product (expiration 04/01/13)
|
9,494,980.00
|
9,074,792.00
|
1,418,047
|
2.4
|
|
|
B01CT3905
|
Tencent Holdings, Ltd.
|
7,312,795.00
|
8,983,603.00
|
262,100
|
2.4
|
|
|
674842901
|
Ruentex Development Co., Ltd.
|
3,423,335.00
|
8,649,437.00
|
4,416,301
|
2.3
|
|
|
644094906
|
Taiwan FamilyMart Co., Ltd.
|
1,313,077.00
|
8,232,599.00
|
1,741,652
|
2.2
|
|
|
671815900
|
Qingling Motors Co., Ltd.
|
8,718,221.00
|
8,172,305.00
|
28,960,000
|
2.2
|
|
|
B00G0S903
|
CNOOC, Ltd.
|
8,859,687.00
|
7,866,908.00
|
4,228,000
|
2.1
|
|
|
626073902
|
Delta Electronics, Inc.
|
4,550,608.00
|
7,743,376.00
|
1,615,000
|
2.1
|
|
|
17313A533
|
Gree Electric Appliances, Inc. Access Product (expiration 01/17/14)
|
6,453,442.00
|
7,685,122.00
|
1,838,546
|
2.1
|
|
|
B3WH02907
|
Hermes Microvision Inc.
|
6,943,556.00
|
7,278,395.00
|
240,000
|
2.0
|
|
|
637248907
|
MediaTek Inc.
|
6,194,126.00
|
6,818,921.00
|
559,000
|
1.8
|
|
|
B2R2ZC908
|
CSR Corp., Ltd.
|
7,466,211.00
|
6,512,818.00
|
9,930,000
|
1.8
|
|
|
B15456906
|
Bank of China, Ltd.
|
6,465,433.00
|
6,437,097.00
|
13,762,000
|
1.7
|
|
|
959GRNII9
|
Taiwan Life Insurance Co., Ltd., 4.0%, 12/28/14
|
6,178,274.00
|
6,283,782.00
|
200,000,000
|
1.7
|
|
|
620267906
|
Advantech Co., Ltd.
|
4,104,778.00
|
6,134,589.00
|
1,284,000
|
1.7
|
|
|
B1L8PB906
|
Tong Hsing Electronic Industries, Ltd.
|
5,919,469.00
|
6,078,883.00
|
1,380,000
|
1.6
|
|
|
986PLF007
|
Golden Meditech Holdings, Ltd. 15.0%, 05/16/13
|
5,557,209.00
|
5,550,872.00
|
58,222,500
|
1.5
|
|
|
986PLG005
|
Golden Meditech Holdings, Ltd. 15.0%, 11/16/13
|
5,557,209.00
|
5,550,872.00
|
58,222,500
|
1.5
|
|
|
634007900
|
Kunlun Energy Co., Ltd.
|
4,298,243.00
|
5,228,495.00
|
2,666,000
|
1.4
|
|
|
626735906
|
Hong Kong Exchanges and Clearing, Ltd.
|
4,947,274.00
|
5,153,982.00
|
306,500
|
1.4
|
|
|
99ZMCS903
|
Kweichow Moutai Co., Ltd. Access Product (expiration 10/26/15)
|
6,129,683.00
|
4,787,163.00
|
171,159
|
1.3
|
|
|
B236JB905
|
Tiangong International Co., Ltd.
|
4,747,329.00
|
4,537,661.00
|
16,080,000
|
1.2
|
|
|
670039007
|
Uni-President Enterprises Corp.
|
669,016.00
|
4,464,022.00
|
2,267,508
|
1.2
|
|
|
643648900
|
Shenzhen International Holdings, Ltd.
|
1,900,271.00
|
4,163,624.00
|
31,992,500
|
1.1
|
|
|
658444906
|
Merida Industry Co., Ltd.
|
3,871,743.00
|
4,141,366.00
|
679,000
|
1.1
|
|
|
643055908
|
Golden Meditech Holdings, Ltd.
|
4,555,715.00
|
4,108,728.00
|
35,040,000
|
1.1
|
|
|
644806002
|
Hutchison Whampoa, Ltd.
|
3,303,627.00
|
3,968,598.00
|
366,000
|
1.1
|
|
|
613623909
|
Hengan International Group Co., Ltd.
|
3,889,897.00
|
3,890,164.00
|
375,500
|
1.0
|
|
|
651795908
|
Natural Beauty Bio-Technology, Ltd.
|
4,906,910.00
|
3,873,039.00
|
47,710,000
|
1.0
|
|
|
665157905
|
Comba Telecom Systems Holdings, Ltd.
|
7,565,579.00
|
3,741,958.00
|
10,958,500
|
1.0
|
|
|
B633D9904
|
Zhongsheng Group Holdings, Ltd.
|
3,466,065.00
|
3,663,374.00
|
2,662,000
|
1.0
|
|
|
B1CKXF901
|
Zhengzhou Yutong Bus Co., Ltd. Access Product (expiration 01/20/15)
|
3,096,799.00
|
3,658,479.00
|
825,469
|
1.0
|
|
|
B3ZVDV905
|
Sinopharm Group Co., Ltd.
|
2,527,529.00
|
3,599,776.00
|
1,212,000
|
1.0
|
|
|
B60LZR903
|
Agricultural Bank of China, Ltd.
|
2,895,784.00
|
2,510,790.00
|
5,238,000
|
0.7
|
|
|
B1TDQL904
|
Ping An Insurance (Group) Company of China, Ltd. Access Product (expiration 01/17/14)
|
1,566,145.00
|
1,343,150.00
|
209,900
|
0.4
|
|
|
B4PTR3906
|
Fook Woo Group Holdings, Ltd.
|
7,974,083.00
|
1,118,811.00
|
25,314,000
|
0.3
|
|
|
972ZGS900
|
Gree Electric Appliances, Inc. Access Product (expiration 10/14/13)
|
1,002,105.00
|
888,455.00
|
212,549
|
0.2
|
|
|
B04W2V905
|
FU JI Food and Catering Services Holdings Ltd.
|
4,246,696.00
|
0.00
|
5,462,000
|
0.0
|
|
|
ACI0090H8
|
Zong Su Foods (acquired 09/21/10)
|
15,000,034.00
|
0.00
|
2,677
|
0.0
|
^Nominal value owed in HK dollars.
Source: State Street Bank and Trust Company as at April 30, 2013.
5
The China Fund, Inc. (CHN)
The information contained herein has been obtained from sources believed to be reliable but RCM and its affiliates do not warrant the information to be accurate, complete or reliable. The opinions expressed herein are subject to change at any time and without notice. Past performance is not indicative of future results. This material is not intended as an offer or solicitation for the purchase or sale of any financial instrument. Investors should consider the investment objectives, risks, charges and expenses of any mutual fund carefully before investing. This and other information is contained in the fund’s annual and semiannual reports, proxy statement and other fund information, which may be obtained by contacting your financial advisor or visiting the fund’s website at www.chinafundinc.com. This information is unaudited and is intended for informational purposes only. It is presented only to provide information on investment strategies and opportunities. The Fund seeks to achieve its objective through investment in the equity securities of companies and other entities with significant assets, investments, production activities, trading or other business interests in China or which derive a significant part of their revenue from China. Investing in non-U.S. securities entails additional risks, including political and economic risk and the risk of currency fluctuations, as well as lower liquidity. These risks, which can result in greater price volatility, will generally be enhanced in less diversified funds that concentrate investments in a particular geographic region. The Fund is a closed-end exchange traded management investment company. This material is presented only to provide information and is not intended for trading purposes. Closed-end funds, unlike open-end funds, are not continuously offered. After the initial public offering, shares are sold on the open market through a stock exchange, where shares may trade at a premium or a discount. Holdings are subject to change daily.