Attached files
| file | filename |
|---|---|
| 8-K - WESTFIELD FINANCIAL, INC. 8-K - Western New England Bancorp, Inc. | a50633846.htm |
Exhibit 99.1
WESTFIELD FINANCIAL, INC. ANNUAL MEETING OF SHAREHOLDERS MAY 16, 2013
FORWARD – LOOKING STATEMENTS Today’s presentation may contain “forward-looking statements” which may be identified by the use of such words as “believe,” “expect,” “anticipate,” “should,” “planned,” “estimated,” and “potential.” Examples of forward-looking statements include, but are not limited to, estimates with respect to our financial condition and results of operation and business that are subject to various factors which could cause actual results to differ materially from these estimates. These factors include, but are not limited to: changes in the interest rate environment that reduce margins; changes in the regulatory environment; the highly competitive industry and market area in which we operate; general economic conditions, either nationally or regionally, resulting in, among other things, a deterioration in credit quality; changes in business conditions and inflation; changes in credit market conditions; changes in the securities markets which affect investment management revenues; increases in Federal Deposit Insurance Corporation deposit insurance premiums and assessments could adversely affect our financial condition; changes in technology used in the banking business; the soundness of other financial services institutions which may adversely affect our credit risk; certain of our intangible assets may become impaired in the future; our controls and procedures may fail or be circumvented; new line of business or new products and services, which may subject us to additional risks; changes in key management personnel which may adversely impact our operations; the effect on our operations of recent legislative and regulatory initiatives that were or may be enacted in response to the ongoing financial crisis; severe weather, natural disasters, acts of war or terrorism and other external events which could significantly impact our business; and other factors detailed from time to time in our Securities and Exchange Commission (“SEC”) filings. Any or all of our forward-looking statements in today’s presentation or in any other public statements we make may turn out to be wrong. They can be affected by inaccurate assumptions we might make or known or unknown risks and uncertainties. Consequently, no forward-looking statements can be guaranteed. We disclaim any obligation to subsequently revise any forward-looking statements to reflect events or circumstances after the date of such statements, or to reflect the occurrence of anticipated or unanticipated events.

WELCOME JAMES C. HAGAN PRESIDENT AND CHIEF EXECUTIVE OFFICER
OVERVIEWAND STRATEGY Our markets are poised for significant recovery as the economy improves. Large banks are not focused on small and mid-sized consumers and businesses. Grow our business by focusing on our strengths and leveraging our capital. Focus on new markets and products. Focus on C&I and CRE portfolios by targeting businesses in western Massachusetts and northern Connecticut. Hired 2 new commercial lenders in 2012 with nearly 50 years experience. Provide technology solutions in demand by our customers, including mobile banking.
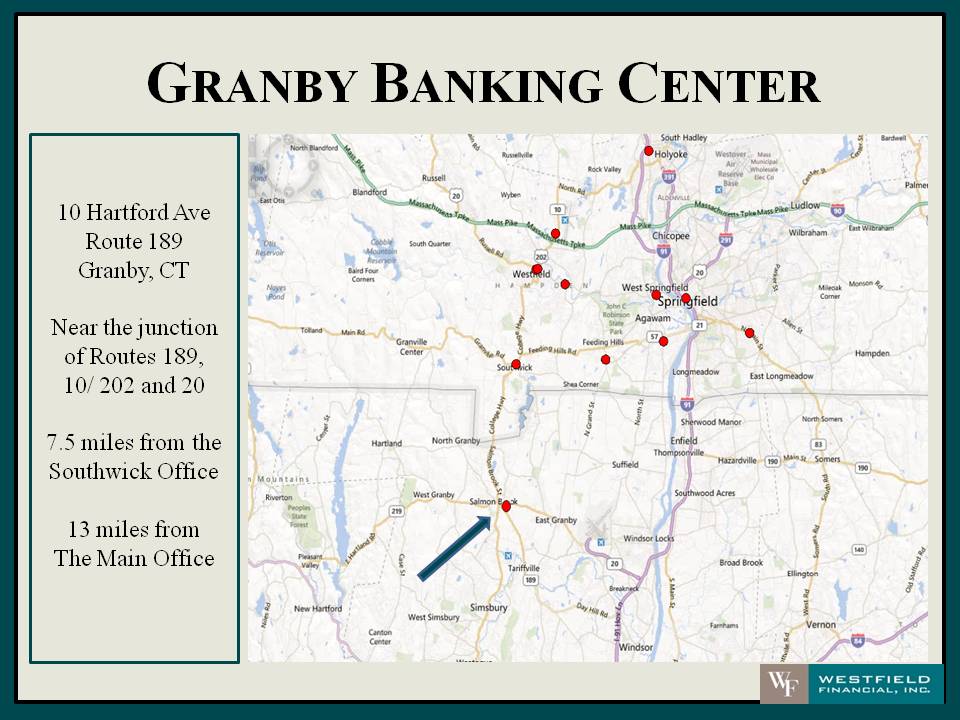
GRANBY BANKING CENTER 10 Hartford Ave Route 189 Granby, CT Near the junction of Routes 189, 10/ 202 and 20 7.5 miles from the Southwick Office 13 miles from The Main Office
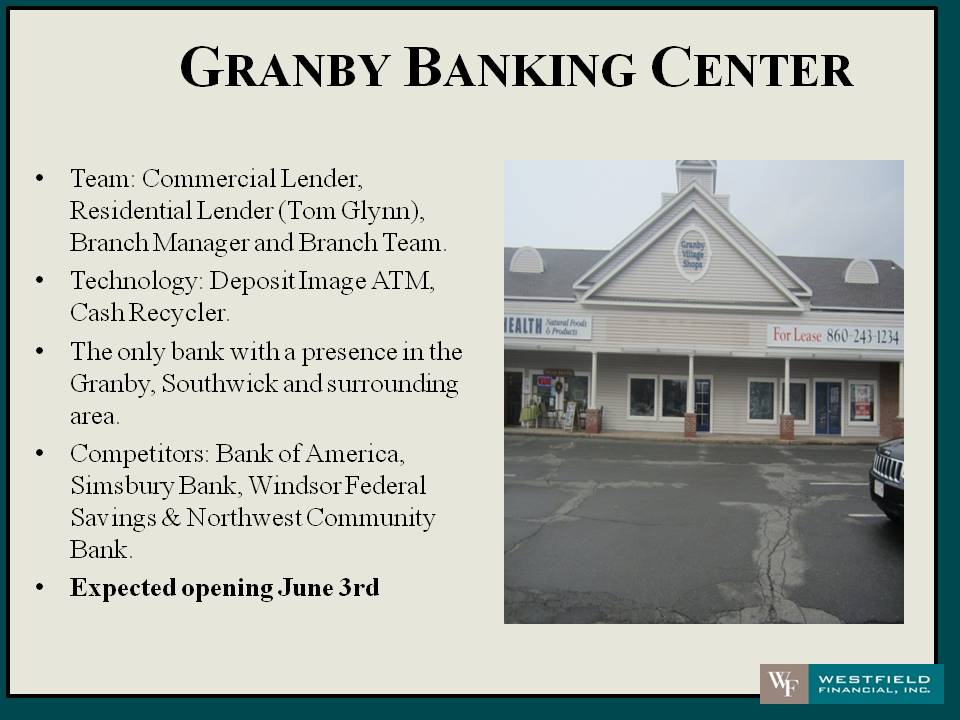
GRANBY BANKING CENTER Team: Commercial Lender, Residential Lender (Tom Glynn), Branch Manager and Branch Team. Technology: Deposit Image ATM, Cash Recycler. The only bank with a presence in the Granby, Southwick and surrounding area. Competitors: Bank of America, Simsbury Bank, Windsor Federal Savings & Northwest Community Bank. Expected opening June 3rd
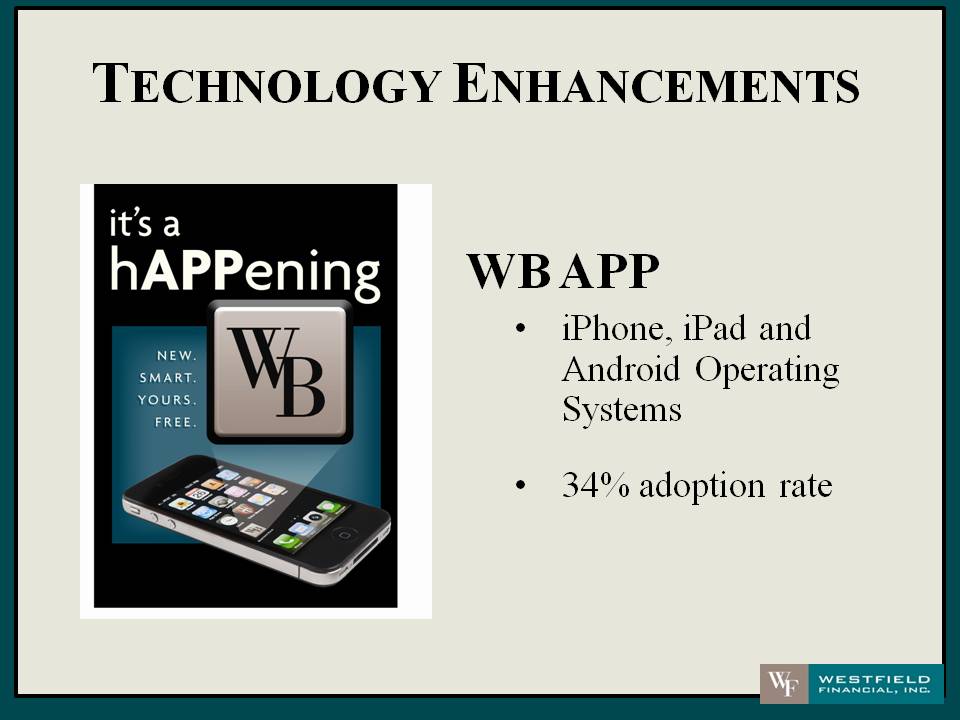
TECHNOLOGY ENHANCEMENTS WB APP iPhone, iPad and Android Operating Systems 34% adoption rate

160TH ANNIVERSARY Bank Chartered April 15, 1853 First Deposit July 1, 1853

SELECTED FINANCIAL HIGHLIGHTS LEO R. SAGAN JR., CHIEF FINANCIAL OFFICER
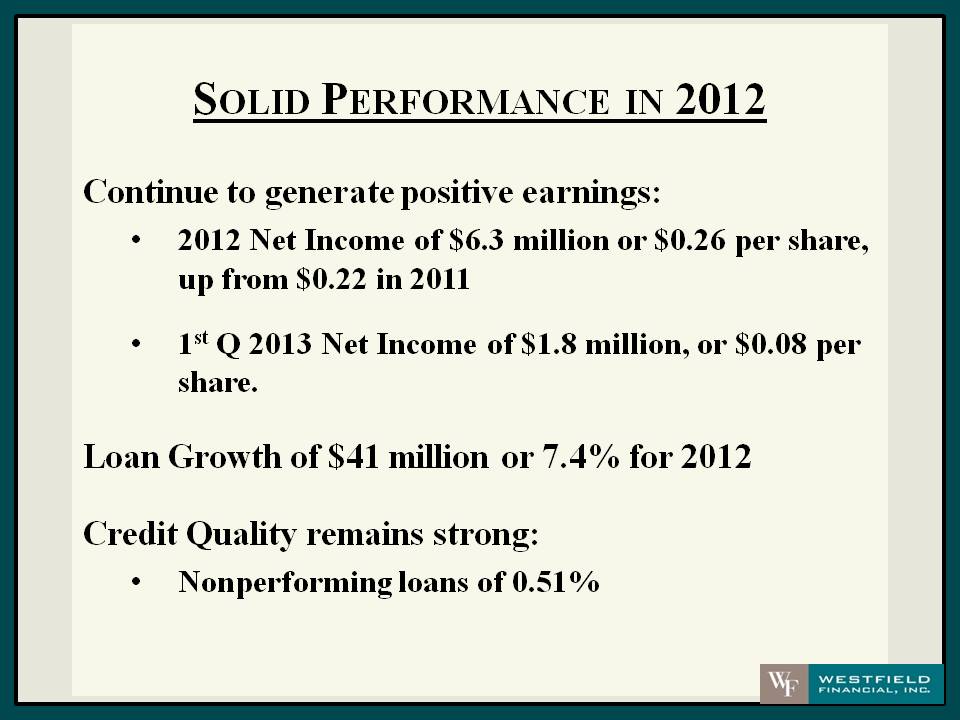
SOLID PERFORMANCE IN 2012 Continue to generate positive earnings: 2012 Net Income of $6.3 million or $0.26 per share, up from $0.22 in 2011 1st Q 2013 Net Income of $1.8 million, or $0.08 per share Loan Growth of $41 million or 7.4% for 2012 Credit Quality remains strong: Nonperforming loans of 0.51%
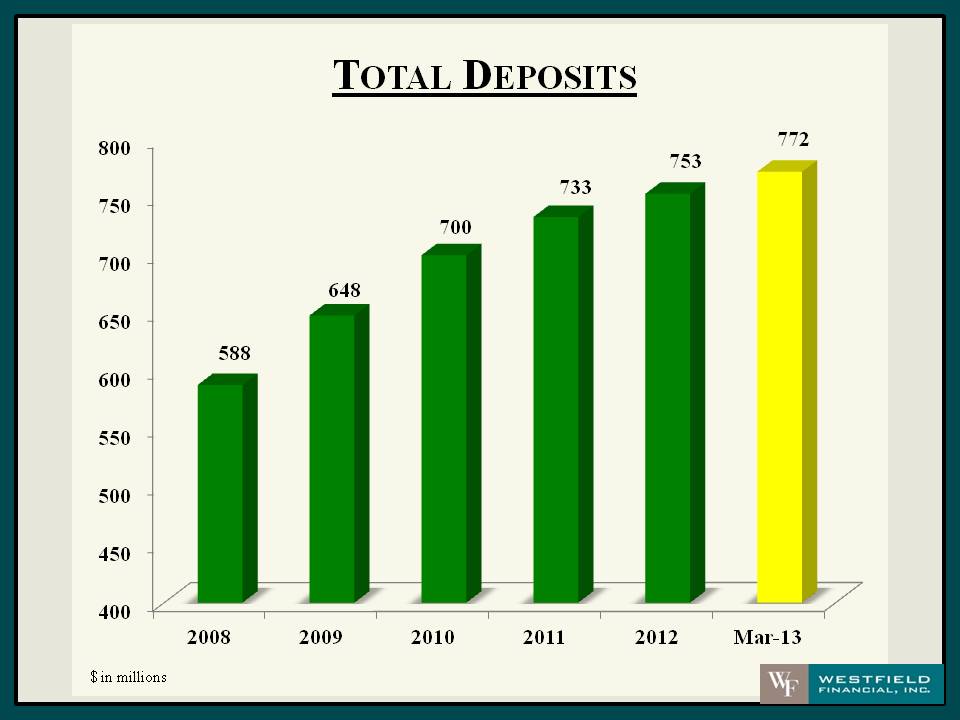
TOTAL DEPOSITS $ in millions 588 648 700 733 753 772 2008 2009 2010 2011 2012 Mar-13
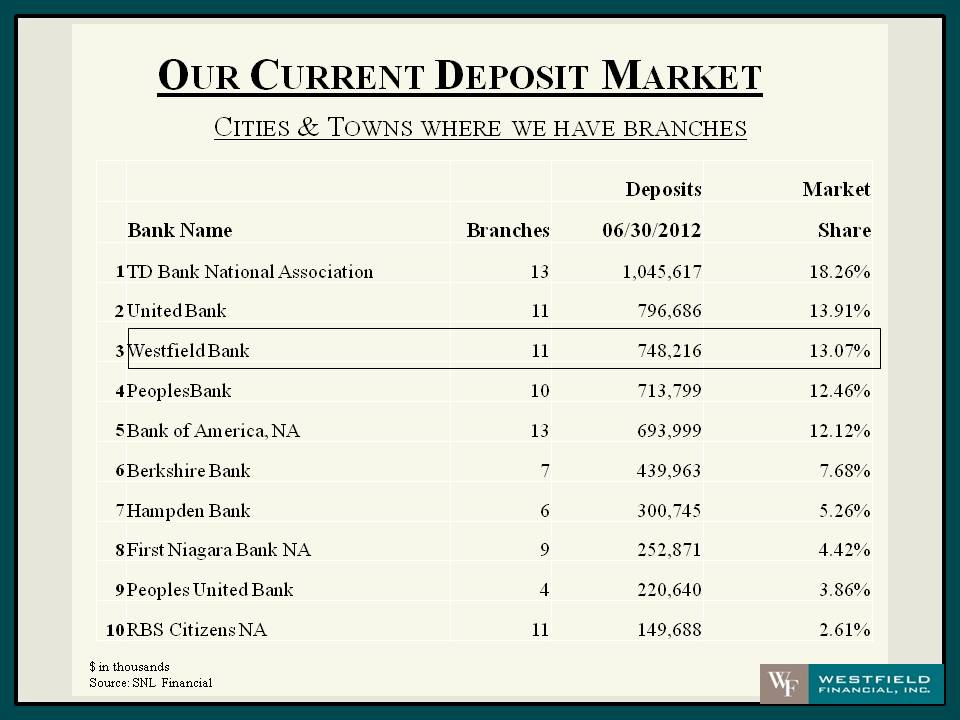
OUR CURRENT DEPOSIT MARKET CITIES & TOWNS WHERE WE HAVE BRANCHES Bank Name Branches Deposits 06/30/2012 Market Share 1TD Bank National Association 13 1,045,617 18.26% 2United Bank 11 796,686 13.91% 3Westfield Bank 11 748,216 13.07% 4PeoplesBank 10 713,799 12.46% 5Bank of America, NA 13 693,999 12.12% 6Berkshire Bank 7 439,963 7.68% 7Hampden Bank 6 300,745 5.26% 8First Niagara Bank NA 9 252,871 4.42% 9Peoples United Bank 4 220,640 3.86% 10RBS Citizens NA 11 149,688 2.61% $ in thousands Source: SNL Financial
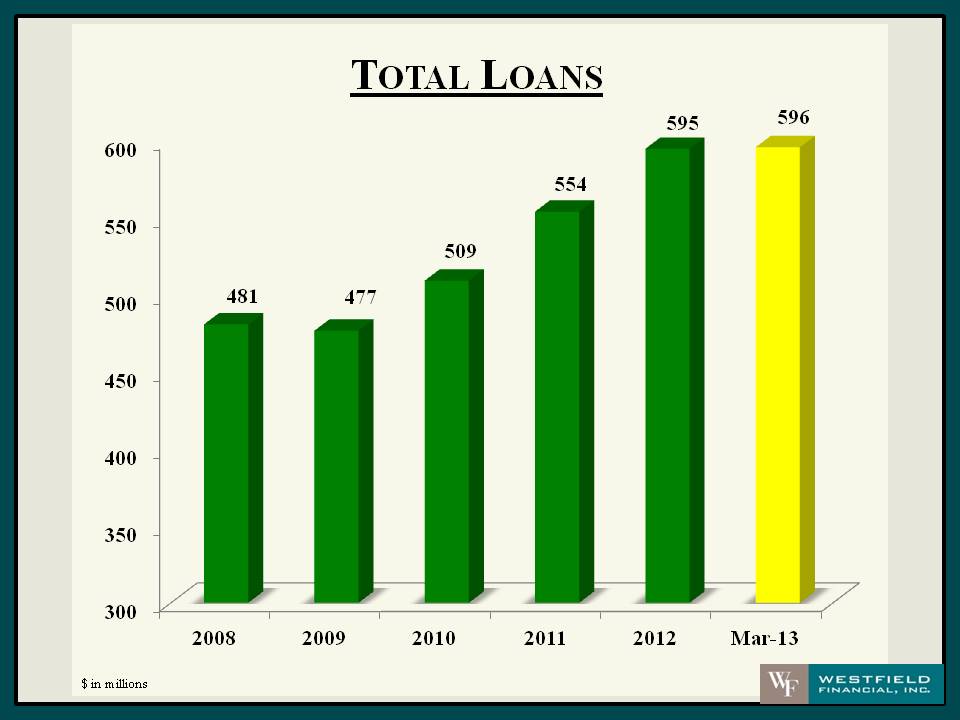
TOTAL LOANS $ in millions 481 477 509 554 595 596 2008 2009 2010 2011 2012 Mar-13
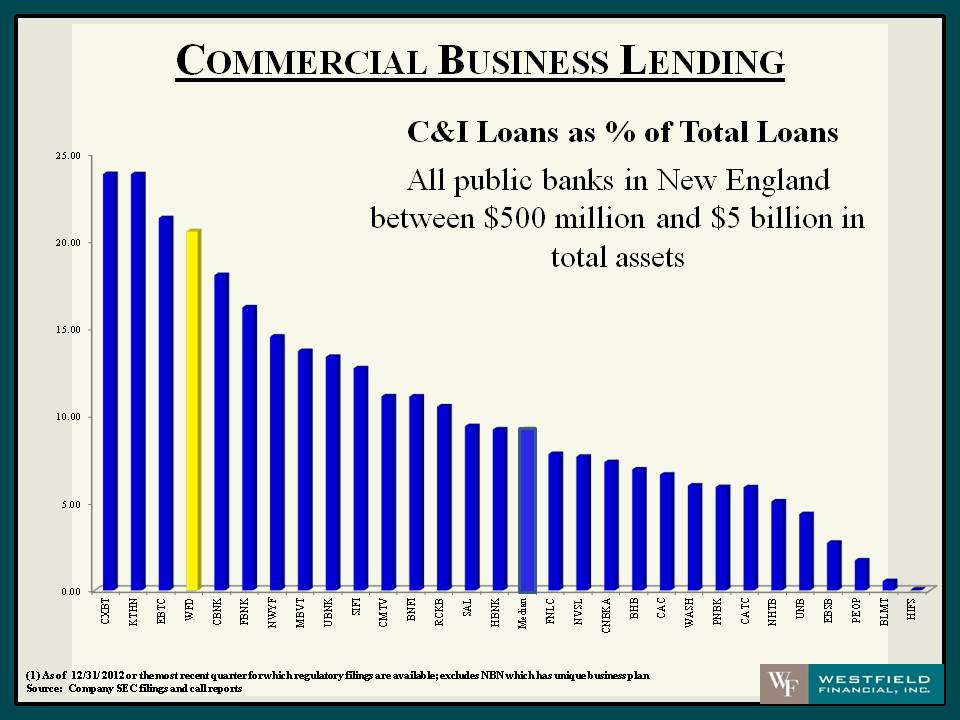
COMMERCIAL BUSINESS LENDING C&I Loans as % of Total Loans All public banks in New England between $500 million and $ 5 billion in total assets (1) As of 12/31/ 2012 or the most recent quarter for which regulatory filings are available; excludes NBN which has unique business plan Source: Company SEC filings and call reports
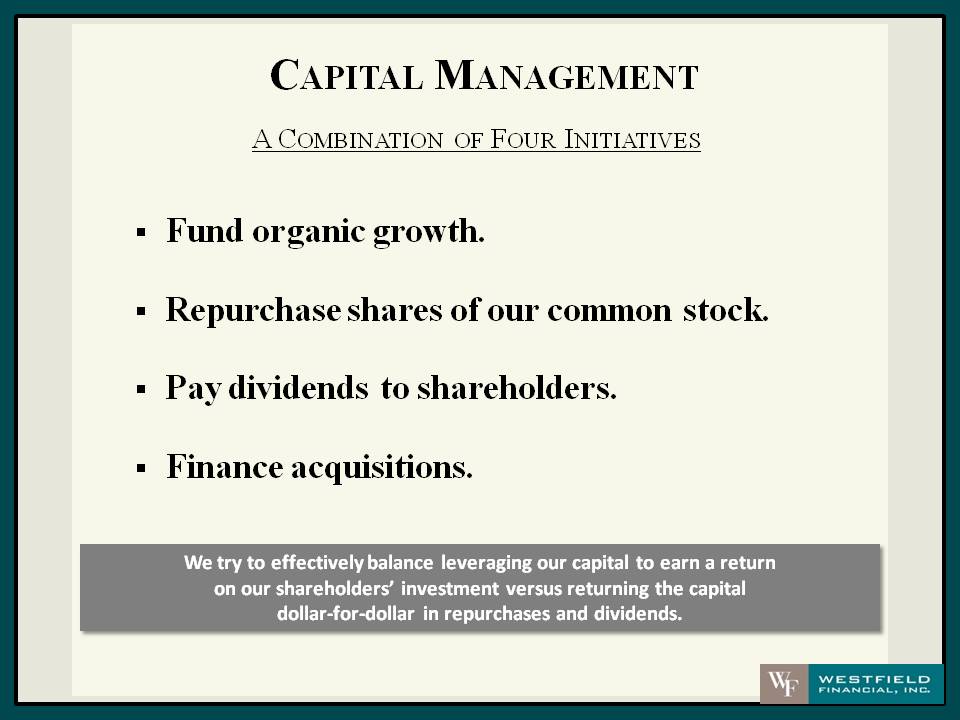
CAPITAL MANAGEMENT A COMBINATION OF FOUR INITIATIVES Fund organic growth. Repurchase stock shares of our common stock. Pay dividends to shareholders. Finance acquisitions. We try to effectively balance leveraging our capital to earn a return on our shareholders’ investment versus returning the capital dollar‐for‐dollar in repurchases and dividends.
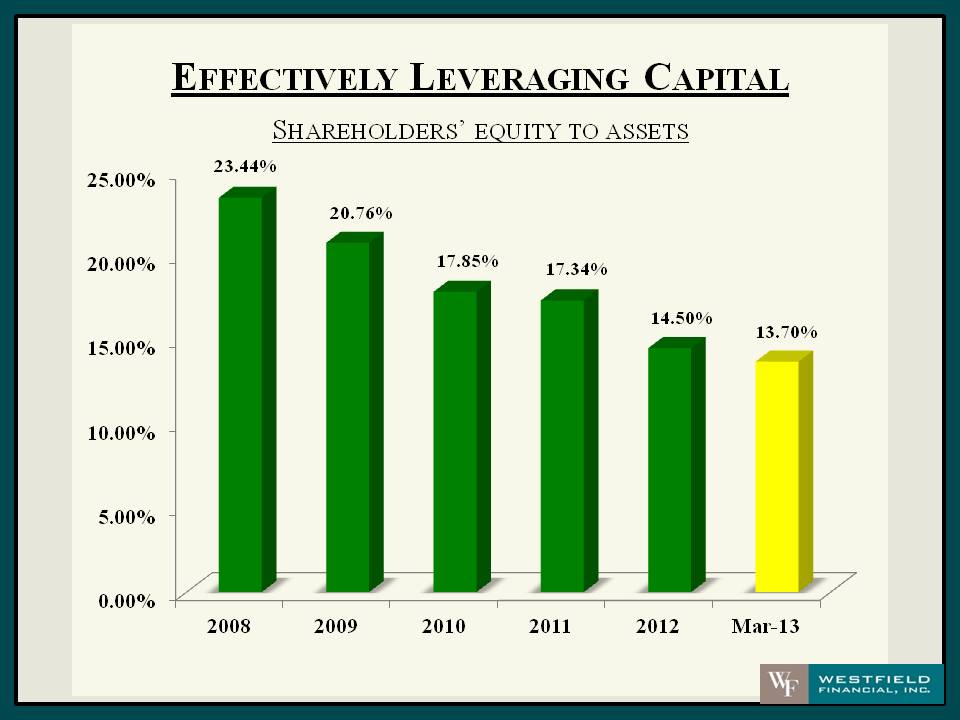
EFFECTIVELY LEVERAGING CAPITAL SHAREHOLDERS’ EQUITY TO ASSETS 23.44% 20.76% 17.85% 17.34% 14.50% 13.70% 2008 2009 2010 2011 2012 Mar-13
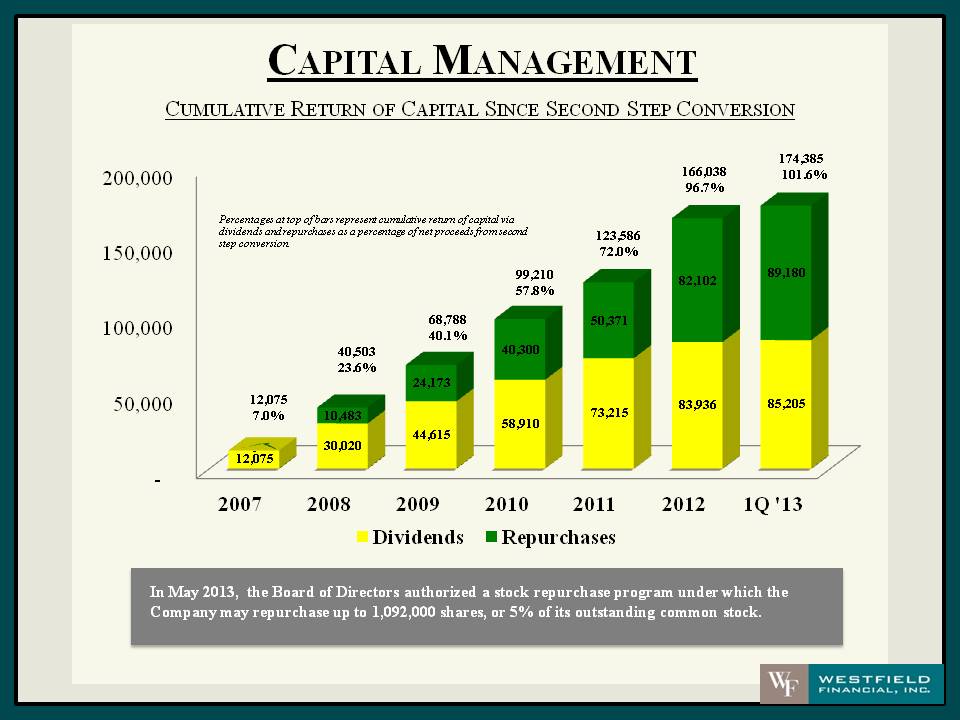
CAPITAL MANAGEMENT CUMULATIVE RETURN OF CAPITAL SINCE SECOND STEP CONVERSION Percentages at top of bars represent cumulative return of capital via dividends and repurchases as a percentage of net proceeds from second step conversion. 12,075 40,503 68,788 99,210 123,586 166,038 174,385 7.0% 23.6% 40.1% 57.8% 72.0% 96.7% 101.6% 10,483 24,173 40,300 50,371 82,102 89,180 12,075 30, 020 44,615 58,910 73,215 83,936 85,205 2007 2008 2009 2010 2011 2012 1Q '13 Dividends Repurchases In May 2013, the Board of Directors authorized a stock repurchase program under which the Company may repurchase up to 1,092,000 shares, or 5% of its outstanding common stock.
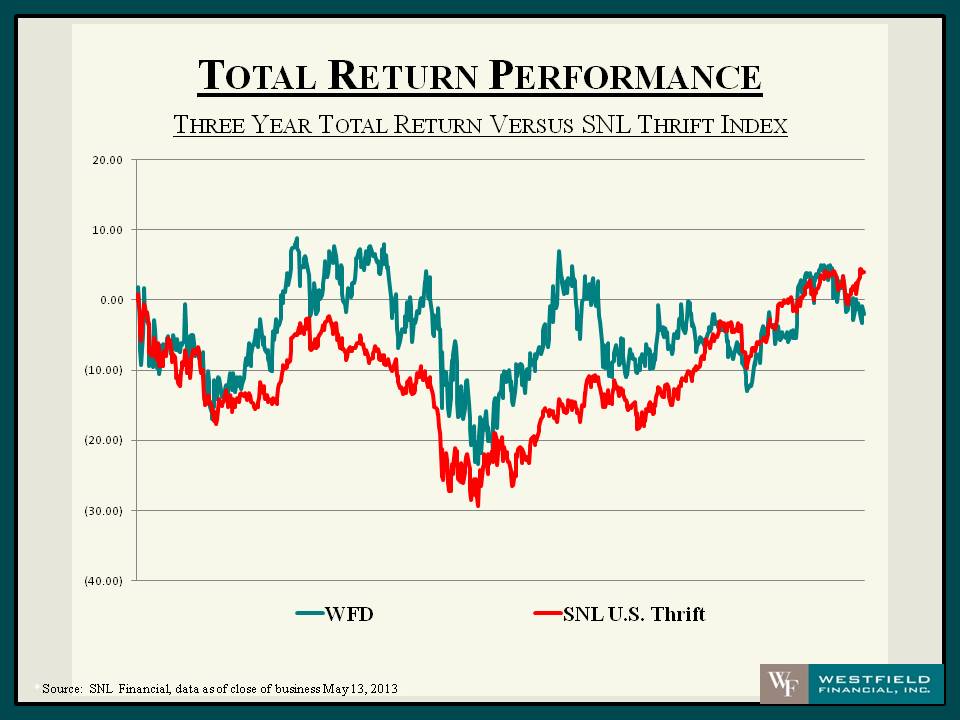
TOTAL RETURN PERFORMANCE THREE YEAR TOTAL RETURN VERSUS SNL THRIFT INDEX WFD SNL U.S. Thrift * Source: SNL Financial, data as of close of business May 13, 2013.
Thank You