Attached files
| file | filename |
|---|---|
| 8-K - FORM 8-K - CYS Investments, Inc. | d539918d8k.htm |
 Wells Fargo
Securities Research & Economics Specialty Finance Conference
May 16, 2013
Exhibit 99.1 |
 Forward
Looking Statements
This
presentation
contains
forward-looking
statements,
within
the
meaning
of
Section
27A
of
the
Securities
Act
of
1933,
as
amended,
and
Section
21E
of
the
Securities
Exchange
Act
of
1934,
as
amended,
that
are
based
on
management’s
beliefs
and
assumptions,
current
expectations,
estimates
and
projections.
Such
statements,
including
information
relating
to
the
Company’s
expectations
for
future
distributions
and
market
conditions,
are
not
considered
historical
facts
and
are
considered
forward-looking
information
under
the
federal
securities
laws.
This
information
may
contain
words
such
as
“believes,”
“plans,”
“expects,”
“intends,”
“estimates”
or
similar
expressions.
This
information
is
not
a
guarantee
of
the
Company’s
future
performance
and
is
subject
to
risks,
uncertainties
and
other
important
factors
that
could
cause
the
Company’s
actual
performance
or
achievements
to
differ
materially
from
those
expressed
or
implied
by
this
forward-looking
information
and
include,
without
limitation,
changes
in
the
Company’s
distribution
policy,
changes
in
the
Company’s
ability
to
pay
distributions,
changes
in
the
market
value
and
yield
of
our
assets,
changes
in
interest
rates
and
the
yield
curve,
net
interest
margin,
return
on
equity,
availability
and
terms
of
financing
and
hedging
and
various
other
risks
and
uncertainties
related
to
our
business
and
the
economy,
some
of
which
are
described
in
our
filings
with
the
SEC.
Given
these
uncertainties,
you
should
not
rely
on
forward-looking
information.
The
Company
undertakes
no
obligations
to
update
any
forward-looking
information,
whether
as
a
result
of
new
information,
future
events
or
otherwise.
2 |
 CYS Overview
Focus on Cost
Efficiency
Target Assets
Agency Residential Mortgage Backed Securities
A Real Estate Investment Trust Formed in January 2006
Ample Financing
Sources
Financing lines with 37 lenders
Swap agreements with 18 counterparties
Dividend Policy
Self managed: highly scalable
Senior
Management
Kevin Grant, CEO, President, Chairman
Frances Spark, CFO
Company intends to distribute all or substantially all of its REIT
taxable income
3 |
 CYS Goal:
Deliver Competitive Total Return Through Dividends
1
June 11, 2009 –
March 31, 2013
2
June 11, 2009 –
March 31, 2013
Source: Company filings , Bloomberg
CYS
vs.
Bloomberg
REIT
Index,
S&P
500¹,
6/2009
–
3/2013
CYS
Expense
Ratio²
(%),
6/2009
–
3/2013
4 |
 Investment
Environment 15
Year
Fixed
Hedged
with
Swaps:
1/2005
–
5/2013
15 Year Hedged
(i)
15 Year Unhedged
(ii)
Source: Bloomberg.
Note:
Spreads
calculatedas:
(i)
15
year
CC
Index
=
50%
4
year
swap,
and
(ii)
15
year
Current
Coupon
Index
5 |
 6
Volatility in the Cap/Floor Markets Hit a
Low in Mid-March
30 Yr MBS -
15 Yr MBS Spread
7 Yr Cap/Floor Implied Vol
Nov 2012 –
May 2013
April 2012 –
May 2013
30 Year MBS Cheapened Meaningfully
Relative to 15 Year MBS
5 Year Swap vs. 1 Month LIBOR
Jan 2005 –
May 2013
Yield Curve
Creates positive carry
Very low cost of financing
Good ROE
Hedge flexibility very important
Fed still fighting deflation
30 Year MBS Now Priced for Operation Taper |
 Fed Voters:
Dovish, But Language Suggests Operation Taper
Duke
Tarullo
Yellen
Raskin
Powell
Stein
Pianalto
Dudley
Dudley
Evans
Rosengren
Bullard
George
Source:
federalreserve.gov,
Macroeconomic
Advisers,
LLC,
Bank
of
America
Merrill
Lynch,
Bloomberg,
Wall
Street
Journal,
Indiana
University,
Marketwatch,
Thomson
Reuters,
Federal
Reserve
Bank
of
Atlanta, Federal Reserve Bank of Chicago, Federal Reserve Bank of Cleveland, Maryland Consumer
Rights Coalition, Boston Globe, Businessweek, Newsweek, Washington Post, CNBC.
Fisher
Kocherlakota
Plosser
Hawkish
Dovish
Neutral
Bernanke
2/22/13
There
are
legitimate
concerns associated with the costs
and benefits of continued asset
purchases.
3/8/13
it
might
be
appropriate
at
some point
to adjust the pace of MBS purchases in
response to developments in primary or
secondary mortgage markets.
2/27/13
It
would
be
best
to
taper the
dose of QE so that markets can adjust
gradually to the eventual removal of
this treatment.
3/6/13
I would like the FOMC to
begin to taper these purchases with
an aim toward ending them before
the end of the year.
2/22/13
The
idea
of
tapering
the program
at some point in the future may be gaining
steam on the committee.
2/28/13
We
are
much
more
attuned
to
monitoring financial markets, risk pricing,
and potential stress points in the financial
system
3/25/13
At
some
point,
I
expect
that
I
will
see
sufficient evidence of economic momentum to
cause me to favor gradually dialing back the pace
of asset purchases.
2013
Voters
2014
Voters
7 |
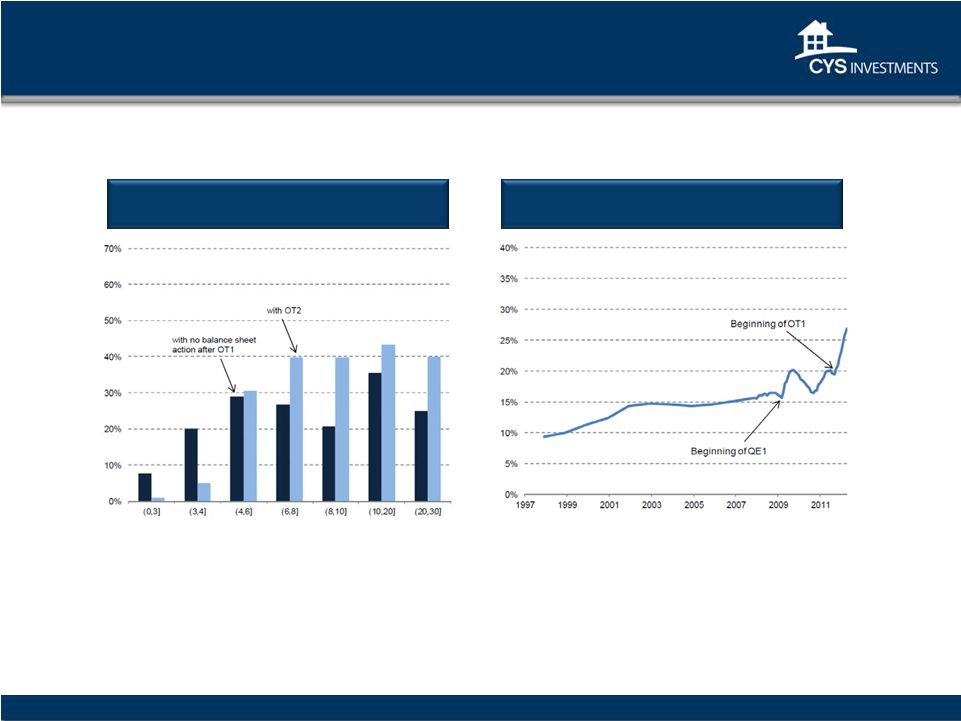 The Fed’s
Tools: Forward Rate Guidance; OT2; QE3
Fed Ownership Shares of Nominal Notes and
Bonds in March 2013 with and without OT2
•
With no operations after OT1, the Fed would own nearly 30% of the 10+ sector.
•
With OT2, that share would increase to over 40%.
Fed Ownership of Treasuries Outstanding
Maturing in Over Ten Years
Source: Macroeconomic Advisers, U.S. Treasury, Federal Reserve. Updated May 24, 2012.
8 |
 Central
Banks: Decidedly More Accommodative -
Focus on Global Deflation Risk
Xiaochuan
China
Bernanke
USA
Kuroda
Japan
Australia
Stevens
New Zealand
Bollard
Draghi
EU
Tombini
Brazil
Subbarao
India
Hawkish
Dovish
Neutral
Draghi
EU
Subbarao
India
Xiaochuan
China
9
Bank
of
Canada
Governor
Mark
Carney
will
become
Governor
of
the
Bank
of
England
onJuly
1,2013,
Stephen
Poloz
takes
over the Bank of Canada on June 3
Canada
Poloz |
 Economic
Recovery Below Normal Pace U.S. Retail Gasoline Price, Regular Grade
1990 –
Present
$ per gal
Capacity Utilization: Manufacturing
1970 –
Present
%
Civilian Unemployment Rate
1940 -
present
%
CPI-U All Items, Core
1940 –
Present
% Change -
Year to Year
Total Nonfarm Private Payroll Employment
2000 -
present
000’s
Challenger, Gray & Christmas, Inc.
Job Cut Announcement Report
Q1/89 –
Q1/13, by Quarter
Source: S&P, Federal Reserve Bank of St. Louis, Fiserv, and Macromarkets LLC / Haver
Analytics, BLS, Challenger, Gray & Christmas, US Dept. of Energy, NYMEX
10 |
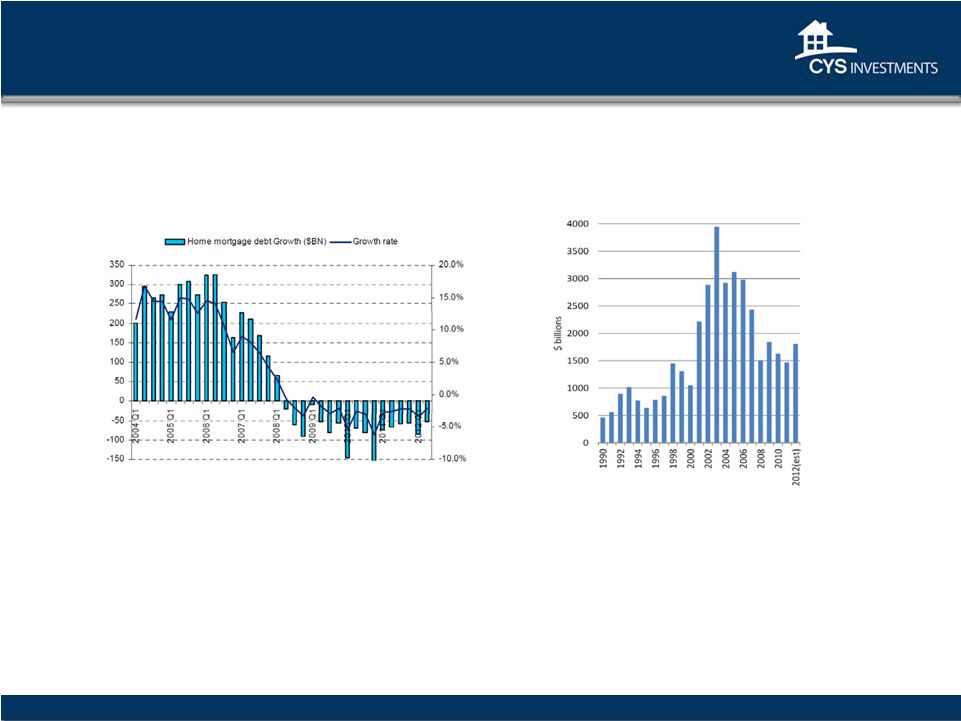 Mortgage Market
Shrinkage Likely to Continue Residential Mortgage Debt Decline Driven By:
1.
Declining home prices
2.
Delevering Consumers/Homeowners
3.
Psychology of lower leverage
4.
Low volume of new and existing home sales
5.
All-cash home purchase transactions, and higher downpayments
6.
Scheduled principal payments
7.
High percentage of cash-in refis versus cash-out refis.
Growth in Residential
Mortgage Debt
2004 -2012
Source: Deutsche Bank, BLS, LPS Applied Analytics, Financial Stability Oversight Council
2012 Annual Report 11
Mortgage Origination Volume
1990 -
2012 |
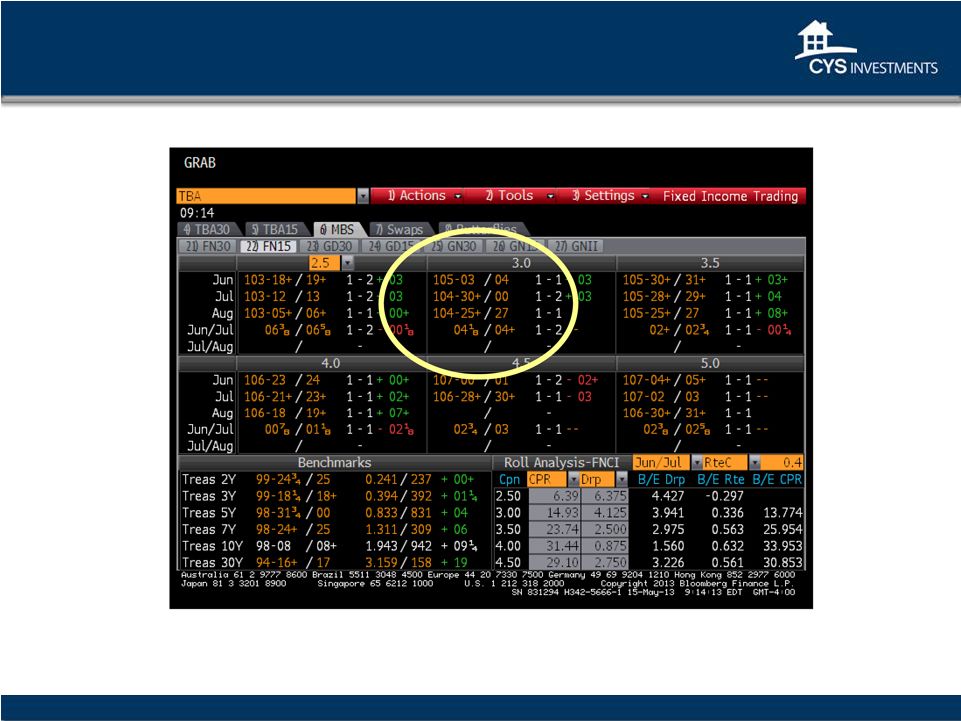 Economics of
Forward Purchase Source: Bloomberg 05/15/13
12 |
 Portfolio
Composition and Results 1
As of 3/31/12
Note:
the
12/12
dividend
was
composed
of
$0.40
regular
cash,
and
$0.52
special
dividend.
Total Agency RMBS: $20,063 million
CYS Common Stock Dividends: 9/2009 –
4/2013
CYS Agency RMBS Portfolio1
13 |
 Portfolio
Characteristics CYS Agency RMBS Portfolio Characteristics*
* As of 3/31/13
(1)
MTR,
or
“Months
to
Reset,”
is
the
number
of
months
remaining
before
the
fixed
rate
ona
hybrid
ARM
becomesa
variable
rate.
At
theend
of
the
fixed
period,
the
variable
rate
will
be
determined
by
the
marginand
the
pre-specifiedcaps
of
the
ARM.
After
the
fixed
period,
the
interest
rates
on
100%
of
our
hybrid
ARMs
resetannually.
(2)
CPR,
or
“Constant
Prepayment
Rate,”
is
a
method
of
expressing
the
prepayment
rate
fora
mortgage
pool
that
assumes
that
aconstant
fraction
of
the
remaining
principal
is
prepaideach
month
or
year.
Specifically,
the
CPR
isan
annualized
version
of
the
prior
threemonth
prepayment
rate.
Securities
with
no
prepayment
history
areexcluded
from
this
calculation.
(3) Weighted average months to reset of our hybrid ARM portfolio.
14
Par Value
Fair Value
Weighted Average
Asset Type
(in thousands)
Cost/Par
Fair
Value/Par
MTR
(1)
Coupon
CPR
(2)
15 Year Fixed Rate
$8,774,166
$9,228,421
$104.38
$105.18
N/A
2.98%
14.9%
20 Year Fixed Rate
1,059,923
1,112,782
104.94
104.99
N/A
3.16%
5.7%
30 Year Fixed Rate
5,957,689
6,283,218
105.14
105.46
N/A
3.53%
8.8%
Hybrid ARMs
3,282,679
3,438,118
103.70
104.74
74.5
2.64%
15.4%
Total/Weighted
Average
$19,074,457
$20,062,539
$104.53
$105.18
74.5
(3)
3.11%
13.4% |
 History of
Transparent and Consistent Financial Reporting CYS uses Financial Reporting for
Investment Companies CYS Financial Reporting –
Transparent and Best in Class
Schedule of investments
NAVs have reflected mark-to-market accounting since inception
Realized and unrealized losses taken through income statement
in period incurred
No OCI account on balance sheet
15 |
 Financial
Information (1)
Drop income is a component of our net income accounted for as net gain from investments on
our statement of operations and therefore excluded from our Core Earnings. (2)
Core earnings is defined as net income (loss) available to common shares excluding net gain
(loss) on investments, net realized gain (loss) on termination of swap contracts and
unrealized appreciation (depreciation) on swap and cap contracts.
16
Income
Statement
Data
(in
000's)
3/31/2013
12/31/2012
Total investment income
$ 73,101
$ 79,579
Interest expense
15,031
16,378
Operating expenses
5,553
4,787
Total expenses
20,584
21,165
Net investment income
52,517
58,414
Net gain (loss) from investments
(78,811)
(95,994)
Net gain (loss) from swap and cap contracts
10,091
(2,363)
Net income (loss)
(16,203)
(39,943)
Dividend on preferred shares
(1,453)
(1,452)
Net income available to common shares
($17,656)
($41,395)
Net income per common share (diluted)
($0.10)
($0.24)
Drop income per common share (diluted)
(1)
$0.15
$0.18
Core Earnings per common share (diluted)
(2)
$0.17
$0.21
Distributions per common share
$0.32
$0.92
Non-GAAP
Measure/Reconciliation
(in
000's)
NET INCOME (LOSS) AVAILABLE TO COMMON SHARES
(17,656)
(41,395)
Net (gain) loss from investments
78,811
95,994
Net (gain) loss from termination of swap and cap contracts
(8,630)
0
Net unrealized (appreciation) depreciation on swap and cap contracts
(23,417)
(16,965)
Core Earnings
$29,108
$37,634 |
 Financial
Information (1)
Our average yield on settled Agency RMBS for the period was calculated by dividing our
interest income from Agency RMBS by our average settled Agency RMBS. (2)
Our
average
cost
of
funds
and
hedge
forthe
period
wascalculated
by
dividing
our
total
interest
expense,
including
our
net
swap
and
cap
interest
income
(expense),
by
ouraverage
repurchase agreements.
(3)
Our interest rate spread net of hedge for the period was calculated by subtracting our
average cost of funds and hedge from our average yield on Agency RMBS. (4)
The
interest
rate
spread
net
of
hedgeincluding
dropincome
for
the
period
is
calculated
by
subtractingadjustedaveragecost
of
fundsand
hedge
fromaverage
total
yield
on
Agency
RMBS including drop income.
(5)
Our operating expense ratio is calculated by dividing operating expenses by average net
assets. (6)
Our leverage ratio was calculated by dividing (i) the Company’s repurchase agreements
balance plus payable for securities purchased minus receivable for securities sold by (ii) net
assets.
* All percentages are
annualized. 17
Three Months Ended
Key Metrics*
3/31/2013
12/31/2012
Average yield on settled Agency RMBS
(1)
1.80%
1.97%
Average cost of funds and hedge
(2)
1.05%
1.03%
Interest rate spread net of hedge
(3)
0.75%
0.94%
Interest rate spread net of hedge including drop income
(4)
1.16%
1.31%
Operating expense ratio
(5)
0.94%
0.76%
Leverage ratio (at period end)
(6)
7.8:1
7.7:1
As of
Balance
Sheet
Data
(in
000's)
3/31/2013
12/31/2012
Cash and cash equivalents
$13,463
$13,882
Receivable for securities sold
$414,936
$10,343
Repurchase agreements
$13,760,475
$13,891,307
Payable for securities purchased
$4,657,501
$4,515,501
Net assets
$2,322,076
$2,402,662
Net assets per common share
$12.87
$13.31 |
 Wells Fargo
Securities Research & Economics Specialty Finance Conference
May 16, 2013 |