Attached files
| file | filename |
|---|---|
| 8-K - FORM 8-K - ASTORIA FINANCIAL CORP | v345339_8k.htm |
Annual Meeting of Shareholders The Inn at New Hyde Park May 15, 2013 NYSE: AF
2 Forward Looking Statement This presentation may contain a number of forward - looking statements within the meaning of Section 27 A of the Securities Act of 1933 , as amended, and Section 21 E of the Securities Exchange Act of 1934 , as amended . These statements may be identified by the use of the words “anticipate,” “believe,” “could,” “estimate,” “expect,” “intend,” “may,” “outlook,” “plan,” “potential,” “predict,” “project,” “should,” “will,” “would,” and similar terms and phrases, including references to assumptions . Forward - looking statements are based on various assumptions and analyses made by us in light of our management’s experience and perception of historical trends, current conditions and expected future developments, as well as other factors we believe are appropriate under the circumstances . These statements are not guarantees of future performance and are subject to risks, uncertainties and other factors (many of which are beyond our control) that could cause actual results to differ materially from future results expressed or implied by such forward - looking statements . These factors include, without limitation, the following : the timing and occurrence or non - occurrence of events may be subject to circumstances beyond our control ; there may be increases in competitive pressure among financial institutions or from non - financial institutions ; changes in the interest rate environment may reduce interest margins or affect the value of our investments ; changes in deposit flows, loan demand or real estate values may adversely affect our business ; changes in accounting principles, policies or guidelines may cause our financial condition to be perceived differently ; general economic conditions, either nationally or locally in some or all areas in which we do business, or conditions in the real estate or securities markets or the banking industry may be less favorable than we currently anticipate ; legislative or regulatory changes, including the implementation of the Dodd - Frank Wall Street Reform and Consumer Protection Act of 2010 and any actions regarding foreclosures, may adversely affect our business ; enhanced supervision and examination by the Office of the Comptroller of the Currency, the Board of Governors of the Federal Reserve System, and the Consumer Financial Protection Bureau ; effects of changes in existing U . S . government or government - sponsored mortgage programs ; technological changes may be more difficult or expensive than we anticipate ; success or consummation of new business initiatives may be more difficult or expensive than we anticipate ; or litigation or other matters before regulatory agencies, whether currently existing or commencing in the future, may be determined adverse to us or may delay occurrence or non - occurrence of events longer than we anticipate . We have no obligation to update any forward - looking statements to reflect events or circumstances after the date of this document .

3 Corporate Profile NYSE: AF • With assets of $16.2 billion, Astoria Financial is the holding company for Astoria Federal Savings and is the fifth largest publicly traded thrift in the country. • Established in 1888, Astoria Federal, with deposits in New York totaling $10.4 billion, is the largest thrift depository in New York. • 19 consecutive years of core profitability (1) • Stable and healthy credit metrics throughout the crisis • Clean, well capitalized balance sheet (1) Refers to net income recalculated to exclude net realized gains on securities, amortization of intangibles and impairment of goodwill, and other nonrecurring items. Core profitability is a non - GAAP financial measure .

4 Capital Ratios 0% 6% 12% 18% Tangible/Tier 1 Leverage Tier 1 Risk-Based Total Risk-Based 9.42% 15.48% 16.74% 8.14% 13.40% 14.66% Bank Holding Company At March 31, 2013 Note: As a thrift holding company, AF is not yet subject to bank holding company capital rules. H olding company ratios indicated herein are pro forma estimates which exclude 100% of the trust preferred securities redeemed on May 10, 2013.

5 2012: A Transitional Year • Diversify and improve the quality of both the balance sheet and earnings Reposition assets and liabilities ─ Increase multi - family/CRE loan portfolio ─ Increase core deposits Expand business banking group • Reduce operating expenses • Improve asset quality We positioned 2012 as a transitional year, undertaking several initiatives to elevate our future financial performance.
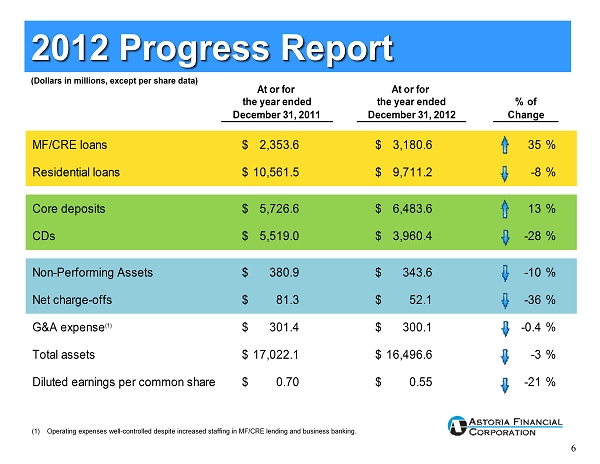
6 2012 Progress Report At or for At or for % of Change MF/CRE loans $ 2,353.6 $ 3,180.6 35% Residential loans $10,561.5 $ 9,711.2 -8% Core deposits $ 5,726.6 $ 6,483.6 13% CDs $ 5,519.0 $ 3,960.4 -28% Non-Performing Assets $ 380.9 $ 343.6 -10% Net charge-offs $ 81.3 $ 52.1 -36% G&A expense (1) $ 301.4 $ 300.1 -0.4% Total assets $17,022.1 $16,496.6 -3% Diluted earnings per common share $ 0.70 $ 0.55 -21% December 31, 2011 December 31, 2012 the year ended the year ended (Dollars in millions, except per share data) (1) Operating expenses well - controlled despite increased staffing in MF/CRE lending and business banking.

7 At December 31, 2011 Loans Loans At December 31, 2012 Asset/Liability Repositioning Trend Deposits Deposits Residential 80% MF/CRE 18% Other 2% Residential 74% MF/CRE 24% Other 2% Core 51% CDs 49% Core 62% CDs 38%
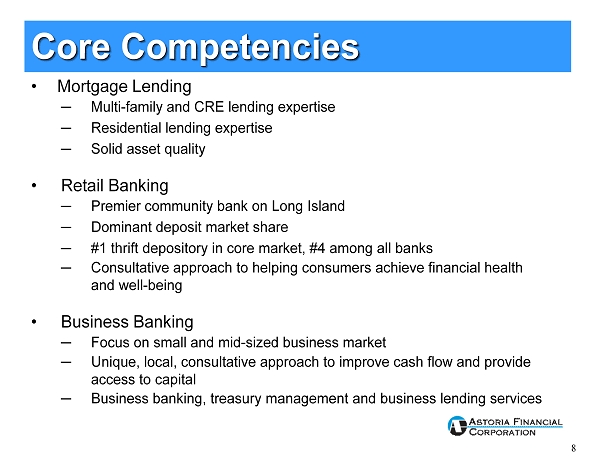
8 Core Competencies • Mortgage Lending ─ Multi - family and CRE lending expertise ─ Residential lending expertise ─ Solid asset quality • Retail Banking ─ Premier community bank on Long Island ─ Dominant deposit market share ─ #1 thrift depository in core market, #4 among all banks ─ Consultative approach to helping consumers achieve financial health and well - being • Business Banking ─ Focus on small and mid - sized business market ─ Unique, local, consultative approach to improve cash flow and provide access to capital ─ Business banking, treasury management and business lending services

9 Multi - family/Commercial Real Estate Portfolio • $3.4 billion portfolio, or 26% of total loan portfolio at March 31, 2013 ─ 2012 originations of $1.6 billion, average loan amount = $3.1 million with a weighted average LTV at origination of approximately 53% and weighted average debt service coverage ratio of 1.81 % ─ 1Q13 originations of $345.6 million, average loan amount = $2.8 million with a weighted average LTV at origination of 52% and weighted average debt service coverage ratio of 1.82% ─ Weighted average coupon at March 31, 2013: 4.46% (1) , weighted average LTV < 54% (2 ) ─ Focus on rent controlled, rent stabilized apartments in New York City • Approximately 70% of multi - family portfolio originated prior to 2011 is subject to rent control or rent stabilization. Approximately 90% of 2011 through 1Q13 multi - family loans closed and pipeline loans are subject to rent control or rent stabilization ─ Pipeline of $706.7 million at March 31, 2013 with weighted average coupon of 3.42%, and average loan size of $2.5 million (1) Excludes non - performing loans. (2) Based on current principal balances and original appraised values. MF/CRE loan portfolio increasing to a larger percentage of the total loan portfolio; growing 7% from December 31, 2012, and 37% from March 31, 2012.

10 Residential Mortgage Lending • $9.2 billion portfolio ─ No sub - prime, payment option or negative amortization ARM lending ─ Primarily jumbo prime 5/1 and 7/1 hybrid ARMs and 15 year fixed rate loans ─ Weighted average LTV (1) on total residential loan portfolio <60% • Multiple delivery channels provide flexibility & efficiency ─ Retail ─ Commissioned brokers (2) ─ Third party originators (2) • Geographically diversified portfolio ─ Reduces lending concentrations (1) LTV ratios are based on current principal balances and original appraised values. (2) All loans underwritten to Astoria’s stringent standards .

11 Leading Retail Banking Franchise • $10.4 billion in deposits, 85 banking office network ─ Low cost/stable source of funds – weighted average rate: 0.62% ─ L ow cost core deposits * increased $192.7 million from December 31, 2012 and $773.6 million from March 31, 2012, to $6.7 billion, or 64% of total deposits ─ 54% of households that have a retail CD account also have a low cost checking, savings or money market account relationship • 94% of depositors, with $9.7 billion in deposits, live within 5 miles of a branch – no broker or municipal deposits • Banking offices with high average deposits contribute to efficiency ─ Long Island Offices (82) – Nassau (28), Queens (17), Suffolk (25), Brooklyn (12) – Average Deposits of $122 Million ─ Westchester Offices (3) – Average Deposits of $140 Million • Alternative delivery channels ─ ATM’s, telephone, Internet and mobile banking * Core deposits include savings, money market and checking accounts

12 Retail Banking Philosophy ─ Consultative approach to helping consumers achieve financial health and well - being ─ Pro - active sales culture – PEAK Process ─ Focus on customer service – High customer satisfaction ─ Community involvement – Support over 700 local organizations and not - for - profit agencies Astoria Federal is an integral part of the fabric of the communities it serves

13 Business Banking Expansion Business deposits grew 15% from year - end 2012, and 29% from the first quarter 2012, to $563.1 million at March 31, 2013. • E xecutive vice president & managing director, formerly with Capital One , heads Business Banking Group • 17,000 current business banking clients • 23 of 85 Astoria Federal branches are headed by a commercial banker • Accelerated the hiring of additional relationship managers in 2013 • Plan to open new branches in Manhattan and prime commercial markets on Long Island

14 TOTAL 4 COUNTY POPULATION: 7,598,823 Exceeds population of 38 individual U.S. states Overall LI Deposit Share Ranking : #1 - all thrifts, #4 - all banks Sources: FDIC Summary of Deposits (as of June 30, 2012) SNL Financial LC Kings County (Brooklyn) Population: 2,521,808 Median household income: $38,578 Deposits: $1.3 billion Branches: 12 Market share: 3% Rank: #1 thrift, #8 all banks Queens County Population: 2,240,310 Median household income: $52,935 Deposits: $ 2.5 billion Branches: 17 Market share: 6% Rank: #1 thrift, #6 all banks Nassau County Population: 1,341,439 Median household income: $92,674 Deposits: $ 4.3 billion Branches: 28 Market share: 7% Rank: #1 thrift, #5 all banks Suffolk County Population: 1,495,266 Median household income: $82,593 Deposits: $ 2.4 billion Branches: 25 Market share: 6% Rank: #1 thrift, #6 all banks Well Positioned in Key Markets Long Island Powerhouse
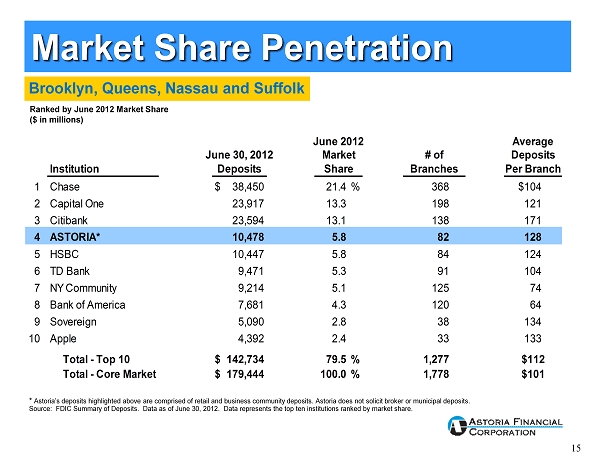
15 Brooklyn, Queens, Nassau and Suffolk June 2012 Average June 30, 2012 Market # of Deposits Institution Deposits Share Branches Per Branch 1 Chase $ 38,450 21.4% 368 $104 2 Capital One 23,917 13.3 198 121 3 Citibank 23,594 13.1 138 171 4 ASTORIA* 10,478 5.8 82 128 5 HSBC 10,447 5.8 84 124 6 TD Bank 9,471 5.3 91 104 7 NY Community 9,214 5.1 125 74 8 Bank of America 7,681 4.3 120 64 9 Sovereign 5,090 2.8 38 134 10 Apple 4,392 2.4 33 133 Total - Top 10 $ 142,734 79.5% 1,277 $112 Total - Core Market $ 179,444 100.0% 1,778 $101 Ranked by June 2012 Market Share ($ in millions) * Astoria’s deposits highlighted above are comprised of retail and business community deposits. Astoria does not solicit broker or municipal deposits. Source: FDIC Summary of Deposits. Data as of June 30, 2012. Data represents the top ten i nstitutions ranked by market share. Market Share Penetration
16 • • Asset Quality • Interest Rate Risk • Balance Sheet Repositioning Current Focus

17 At December 31, 2012 Loans Loans At March 31, 2013 Asset/Liability Repositioning Trend Deposits Deposits Residential 74% MF/CRE 24% Other 2% Residential 72% MF/CRE 26% Other 2% Core 62% CDs 38% Core 64% CDs 36%

18 Opportunity for Future Growth • Assets: ─ Growth of multi - family/CRE loan portfolio Multi - family/CRE loan originations for 1Q13 totaled $345.6 million M ulti - family/CRE loan pipeline was $706.7 million at March 31, 2013 with weighted average coupon of 3.42%, and average loan size of $2.5 million ─ Expand business banking footprint Establish new business banking centers Additional business relationship managers hired • Liabilities: ─ Low cost core deposits continue to become a larger percentage of deposits Core deposits totaled $6.7 billion, or 64% of total deposits; up from 62% of total deposits at December 31, 2012 Includes 15% increase in business core deposits from December 31, 2012 Ongoing campaigns for both personal and business checking • Margin: ─ Expect to maintain the net interest margin for 2013 slightly higher than the margin for the 2012 full year .
19 • Balance Sheet Repositioning • Asset Quality • Interest Rate Risk • Asset Quality Current Focus

20 Asset Quality • Conservative underwriting, top quality loans, low LTVs ─ $4.7 billion, or 51% of residential portfolio, originated 2008 through 1Q13 with a weighted average LTV of 56% ( 1) ; of which only $7.8 million are non - performing loans 90 days or more past due ─ Residential I/O portfolio reduced by $3.1 billion over last 3 years ─ Top quality multi - family and commercial real estate loan portfolios x ~ 90% of multi - family loans closed 2011 through 1Q13 and pipeline loans are subject to rent control or rent stabilization x Average LTV for portfolio loans < 54% ( 1) • Top quality MBS portfolio ─ 99% GSE/agency ─ Average life 2.7 years (1) LTV ratios are based on current principal balances and original appraised values .

21 • Balance Sheet Repositioning • Asset Quality • Interest Rate Risk • Interest Rate Risk Current Focus

22 • One year cumulative interest rate sensitivity gap at March 31, 2013: + 12.81% ─ 1Q13 activity x Stable core deposits increased $192.7 million from December 31, 2012 to $6.7 billion, or 64% of total deposits • Key balance sheet components ─ Approximately $4.7 billion, or 38%, of mortgage portfolio matures or reprices in one year or less ─ Weighted average life of MBS portfolio of 2.7 years Interest Rate Risk Management
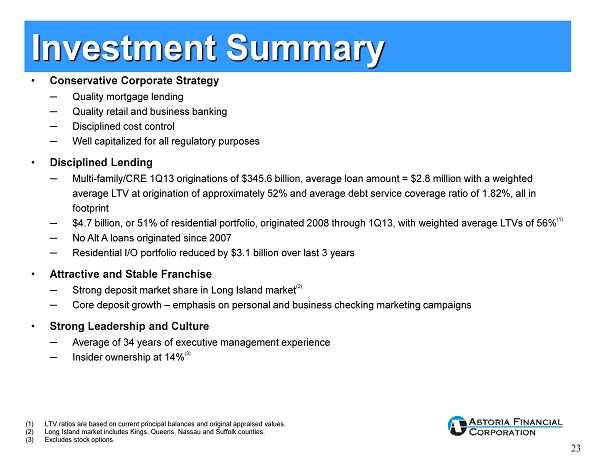
23 • Conservative Corporate Strategy ─ Quality mortgage lending ─ Quality retail and business banking ─ Disciplined cost control ─ Well capitalized for all regulatory purposes • Disciplined Lending ─ Multi - family/CRE 1Q13 originations of $345.6 billion, average loan amount = $2.8 million with a weighted average LTV at origination of approximately 52% and average debt service coverage ratio of 1.82%, all in footprint ─ $4.7 billion, or 51% of residential portfolio, originated 2008 through 1Q13, with weighted average LTVs of 56% (1) ─ No Alt A loans originated since 2007 ─ Residential I/O portfolio reduced by $3.1 billion over last 3 years • Attractive and Stable Franchise ─ Strong deposit market share in Long Island market (2) ─ Core deposit growth – emphasis on personal and business checking marketing campaigns • Strong Leadership and Culture ─ Average of 34 years of executive management experience ─ Insider ownership at 14% (3) (1) LTV ratios are based on current principal balances and original appraised values. (2) Long Island market includes Kings, Queens, Nassau and Suffolk counties. (3) Excludes stock options . Investment Summary

24 Glossary ARM ─ Adjustable Rate Mortgage CRE ─ Commercial Real Estate G&A ─ General and Administrative GAAP ─ Generally Accepted Accounting Principles GSE ─ Government Sponsored Enterprise I/O ─ Interest - Only LTV ─ Loan - To - Value Ratio MBS ─ Mortgage - Backed Securities MF ─ Multi - family NPLs ─ Non - Performing Loans

25 Contact Information Web site: www.astoriafederal.com Email: ir@astoriafederal.com Telephone: (516) 327 - 7869 Address: Astoria Financial Corporation Attn: Investor Relations One Astoria Federal Plaza Lake Success, NY 11042