Attached files
| file | filename |
|---|---|
| 8-K - CURRENT REPORT OF MATERIAL EVENTS OR CORPORATE CHANGES - Southcross Energy Partners, L.P. | a13-12499_18k.htm |
Exhibit 99.1
|
|
Investor Presentation May 2013 |
|
|
Cautionary Statements This presentation contains forward-looking statements and information. These forward-looking statements, which in many instances can be identified by words such as “could,” “will,” “may,” “assume,” “forecast,” “position,” “predict,” “strategy,” “expect,” “intend,” “plan,” “estimate,” “anticipate,” “believe,” “project,” “budget,” “potential,” or “proposed,” give current expectations or forecasts of future events or contain projections of results of operations or financial condition. Examples include discussion of our strategies, financing plans and growth opportunities. These forward-looking statements are based on our current information, expectations and beliefs; they are not a guarantee of future results, and you should not place undue reliance on such statements. Forward-looking statements are subject to many risks, uncertainties and other variable circumstances including those discussed in filings we make with the Securities and Exchange Commission, particularly in our 2012 Annual Report on Form 10-K under the headings “Risk Factors” and “Management’s Discussion and Analysis of Financial Condition and Results of Operations.” Many of these risks are outside of our control and could cause our actual results and experience to differ materially from those we anticipated would occur. Key uncertainties and risks that may directly affect our performance, future growth, results of operations, and financial condition, include, but are not limited to: the volatility of natural gas, crude oil and NGL prices and the price and demand of products derived from these commodities; competitive conditions in our industry and the extent and success of producers replacing declining production and our success in obtaining new sources of supply; industry conditions and supply of pipelines, processing and fractionation capacity relative to available natural gas from producers; our dependence upon a relatively limited number of customers for a significant portion of our revenues; actions or inactions taken or non-performance by third parties, including suppliers, contractors, operators, processors, transporters and customers; our ability to effectively recover NGLs at a rate equal to or greater than our contracted rates with customers; our ability to produce and market NGLs at the anticipated differential to NGL index pricing; our access to markets enabling us to match pricing indices for purchases and sales of natural gas and NGLs; our ability to complete projects within budget and on schedule, including but not limited to, timely receipt of necessary government approvals and permits, our ability to control the costs of construction and other factors that may impact projects; our ability to consummate acquisitions, integrate the acquired businesses successfully, realize anticipated cost savings and other synergies from any acquisitions; our ability to manage over time changing exposure to commodity price risk; the effectiveness of our hedging activities or our decisions not to undertake hedging activities; our access to financing and ability to remain in compliance with our financial covenants; our ability to generate sufficient operating cash flow to fund our minimum quarterly distribution; changes in general economic conditions; the effects of downtime associated with our assets or the assets of third parties interconnected with our systems; operating hazards, fires, natural disasters, weather-related delays, casualty losses and other matters beyond our control; the failure of our plants to perform as expected, including outages for unscheduled maintenance or repair; the effects of laws and governmental regulations and policies; the effects of existing and future litigation; and other financial, operational and legal risks and uncertainties detailed from time to time in our filings with the U.S. Securities and Exchange Commission. The forward-looking statements included in this presentation are made only as of the date hereof. Except as required by law, we do not undertake, and specifically decline, any obligation to update any such statements or to publicly announce the results of any revisions to any of such statements to reflect future events or developments. |
|
|
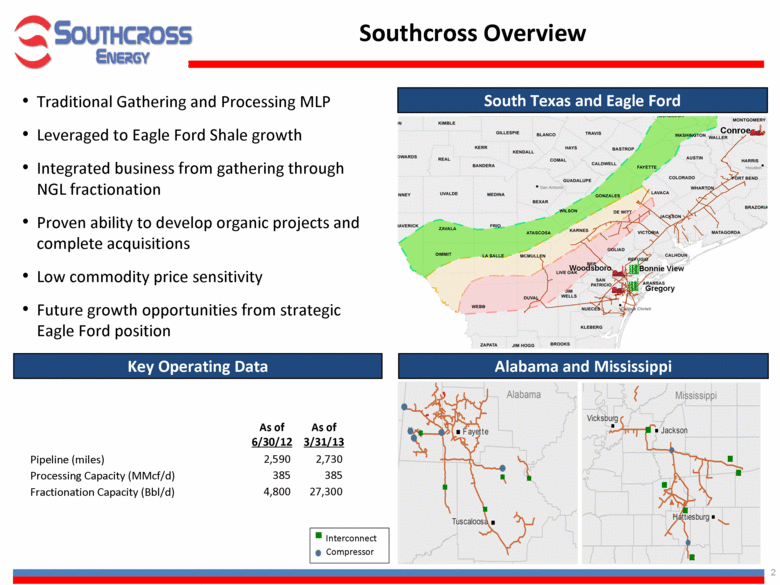
Southcross Overview Alabama and Mississippi South Texas and Eagle Ford Traditional Gathering and Processing MLP Leveraged to Eagle Ford Shale growth Integrated business from gathering through NGL fractionation Proven ability to develop organic projects and complete acquisitions Low commodity price sensitivity Future growth opportunities from strategic Eagle Ford position Key Operating Data As of 6/30/12 As of 3/31/13 Pipeline (miles) 2,590 2,730 Processing Capacity (MMcf/d) 385 385 Fractionation Capacity (Bbl/d) 4,800 27,300 Conroe Woodsboro Bonnie View Gregory |
|
|
Southcross History 2009 Acquired core assets 2010 Expanded Gregory processing plant Built and acquired two pipeline assets 2011 Won anchor contracts for Eagle Ford expansion Completed Enterprise Alabama acquisition Initiated construction of Woodsboro & Bonnie View processing / fractionation complex 2012 Woodsboro completed Commenced operations of Bonnie View fractionator Completed IPO in November 2013 Completed expansion of Bonnie View fractionator Completed final phase of Bee Line pipeline project |

|
|
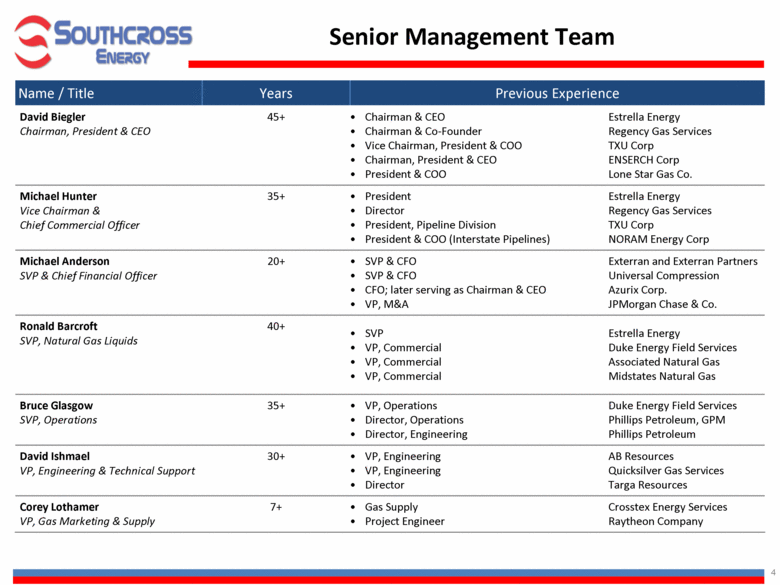
Senior Management Team Name / Title Years Previous Experience David Biegler Chairman, President & CEO 45+ Chairman & CEO Estrella Energy Chairman & Co-Founder Regency Gas Services Vice Chairman, President & COO TXU Corp Chairman, President & CEO ENSERCH Corp President & COO Lone Star Gas Co. Michael Hunter Vice Chairman & Chief Commercial Officer 35+ President Estrella Energy Director Regency Gas Services President, Pipeline Division TXU Corp President & COO (Interstate Pipelines) NORAM Energy Corp Michael Anderson SVP & Chief Financial Officer 20+ SVP & CFO Exterran and Exterran Partners SVP & CFO Universal Compression CFO; later serving as Chairman & CEO Azurix Corp. VP, M&A JPMorgan Chase & Co. Ronald Barcroft SVP, Natural Gas Liquids 40+ SVP Estrella Energy VP, Commercial Duke Energy Field Services VP, Commercial Associated Natural Gas VP, Commercial Midstates Natural Gas Bruce Glasgow SVP, Operations 35+ VP, Operations Duke Energy Field Services Director, Operations Phillips Petroleum, GPM Director, Engineering Phillips Petroleum David Ishmael VP, Engineering & Technical Support 30+ VP, Engineering AB Resources VP, Engineering Quicksilver Gas Services Director Targa Resources Corey Lothamer VP, Gas Marketing & Supply 7+ Gas Supply Crosstex Energy Services Project Engineer Raytheon Company |
|
|
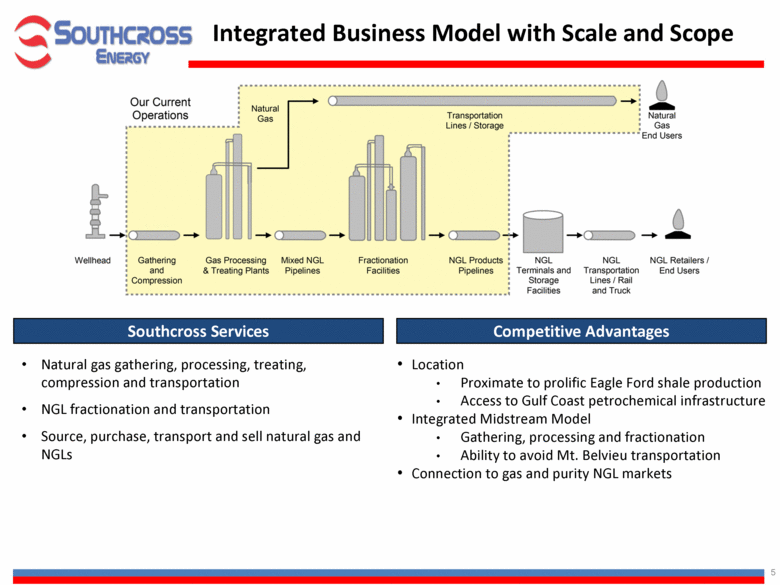
Integrated Business Model with Scale and Scope Competitive Advantages Southcross Services Natural gas gathering, processing, treating, compression and transportation NGL fractionation and transportation Source, purchase, transport and sell natural gas and NGLs Location Proximate to prolific Eagle Ford shale production Access to Gulf Coast petrochemical infrastructure Integrated Midstream Model Gathering, processing and fractionation Ability to avoid Mt. Belvieu transportation Connection to gas and purity NGL markets |
|
|
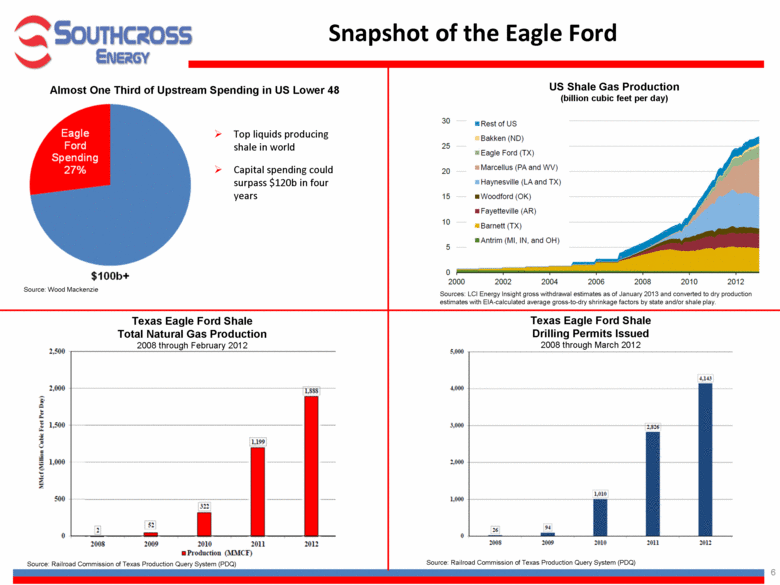
Texas Eagle Ford Shale Total Natural Gas Production 2008 through February 2012 Source: Railroad Commission of Texas Production Query System (PDQ) Source: Railroad Commission of Texas Production Query System (PDQ) Texas Eagle Ford Shale Drilling Permits Issued 2008 through March 2012 Sources: LCI Energy Insight gross withdrawal estimates as of January 2013 and converted to dry production estimates with EIA-calculated average gross-to-dry shrinkage factors by state and/or shale play. US Shale Gas Production (billion cubic feet per day) Snapshot of the Eagle Ford Top liquids producing shale in world Capital spending could surpass $120b in four years Source: Wood Mackenzie Almost One Third of Upstream Spending in US Lower 48 |
|
|
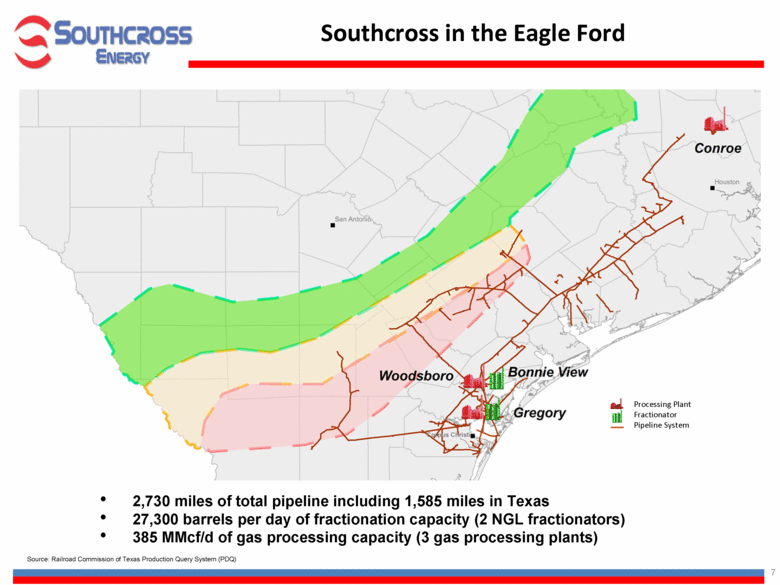
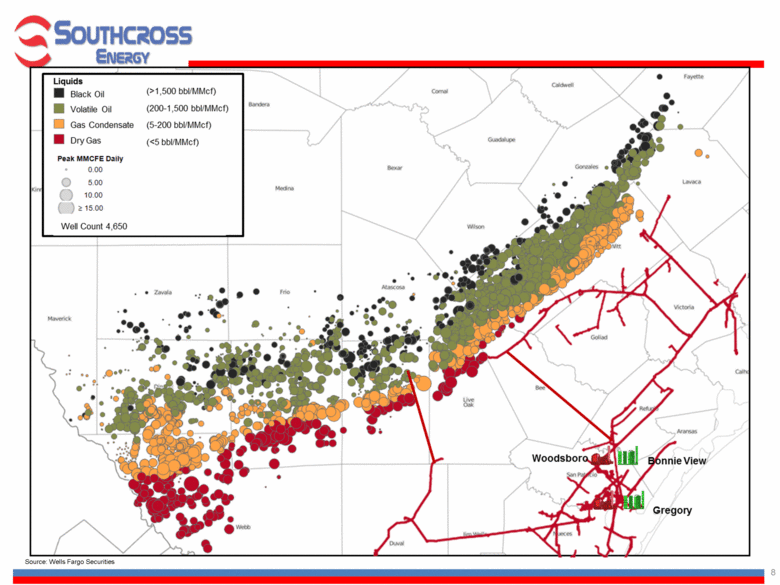
Southcross in the Eagle Ford 2,730 miles of total pipeline including 1,585 miles in Texas 27,300 barrels per day of fractionation capacity (2 NGL fractionators) 385 MMcf/d of gas processing capacity (3 gas processing plants) Processing Plant Fractionator Pipeline System Source: Railroad Commission of Texas Production Query System (PDQ) |
|
|
Source: Wells Fargo Securities |
|
|
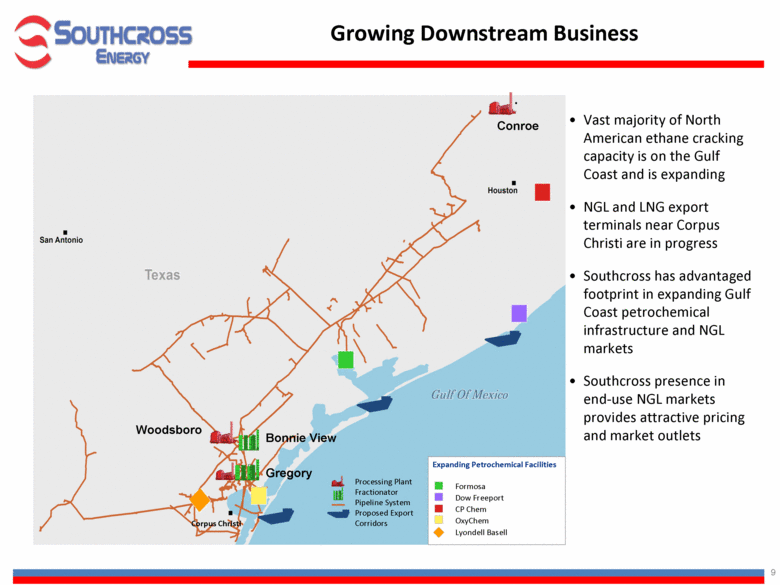
Vast majority of North American ethane cracking capacity is on the Gulf Coast and is expanding NGL and LNG export terminals near Corpus Christi are in progress Southcross has advantaged footprint in expanding Gulf Coast petrochemical infrastructure and NGL markets Southcross presence in end-use NGL markets provides attractive pricing and market outlets Growing Downstream Business Expanding Petrochemical Facilities Formosa Dow Freeport CP Chem OxyChem Lyondell Basell Woodsboro Bonnie View Gregory Conroe Corpus Christi |
|
|
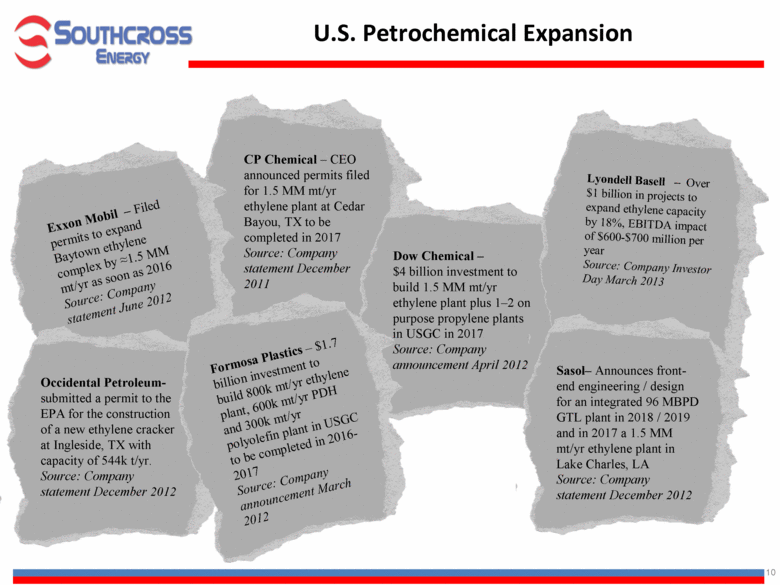
CP Chemical – CEO announced permits filed for 1.5 MM mt/yr ethylene plant at Cedar Bayou, TX to be completed in 2017 Source: Company statement December 2011 Exxon Mobil – Filed permits to expand Baytown ethylene complex by 1.5 MM mt/yr as soon as 2016 Source: Company statement June 2012 Dow Chemical – $4 billion investment to build 1.5 MM mt/yr ethylene plant plus 1–2 on purpose propylene plants in USGC in 2017 Source: Company announcement April 2012 Lyondell Basell – Over $1 billion in projects to expand ethylene capacity by 18%, EBITDA impact of $600-$700 million per year Source: Company Investor Day March 2013 Sasol– Announces front-end engineering / design for an integrated 96 MBPD GTL plant in 2018 / 2019 and in 2017 a 1.5 MM mt/yr ethylene plant in Lake Charles, LA Source: Company statement December 2012 U.S. Petrochemical Expansion Occidental Petroleum- submitted a permit to the EPA for the construction of a new ethylene cracker at Ingleside, TX with capacity of 544k t/yr. Source: Company statement December 2012 Formosa Plastics – $1.7 billion investment to build 800k mt/yr ethylene plant, 600k mt/yr PDH and 300k mt/yr polyolefin plant in USGC to be completed in 2016-2017 Source: Company announcement March 2012 |
|
|
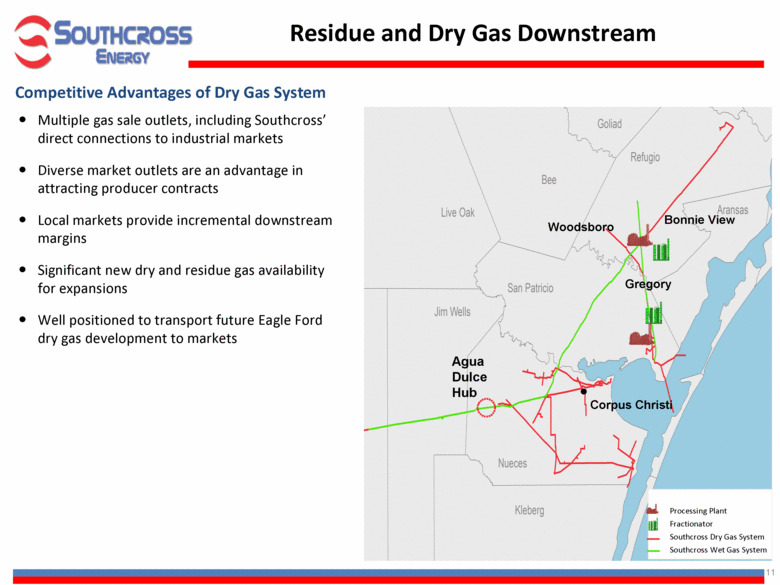
Multiple gas sale outlets, including Southcross’ direct connections to industrial markets Diverse market outlets are an advantage in attracting producer contracts Local markets provide incremental downstream margins Significant new dry and residue gas availability for expansions Well positioned to transport future Eagle Ford dry gas development to markets Residue and Dry Gas Downstream Competitive Advantages of Dry Gas System Agua Dulce Hub Woodsboro Corpus Christi Processing Plant Fractionator Southcross Dry Gas System Southcross Wet Gas System Bonnie View Gregory |
|
|
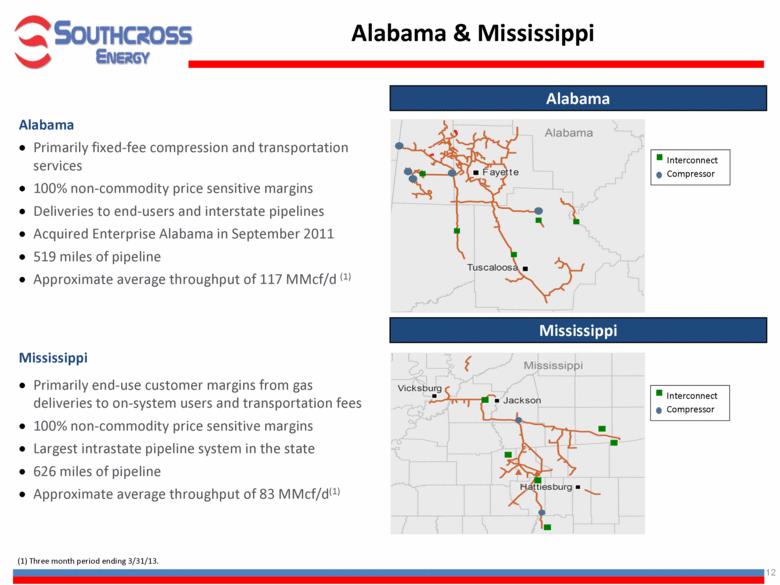
Alabama Primarily fixed-fee compression and transportation services 100% non-commodity price sensitive margins Deliveries to end-users and interstate pipelines Acquired Enterprise Alabama in September 2011 519 miles of pipeline Approximate average throughput of 117 MMcf/d (1) Alabama & Mississippi Mississippi Alabama Mississippi Primarily end-use customer margins from gas deliveries to on-system users and transportation fees 100% non-commodity price sensitive margins Largest intrastate pipeline system in the state 626 miles of pipeline Approximate average throughput of 83 MMcf/d(1) (1) Three month period ending 3/31/13. Compressor Compressor |
|
|
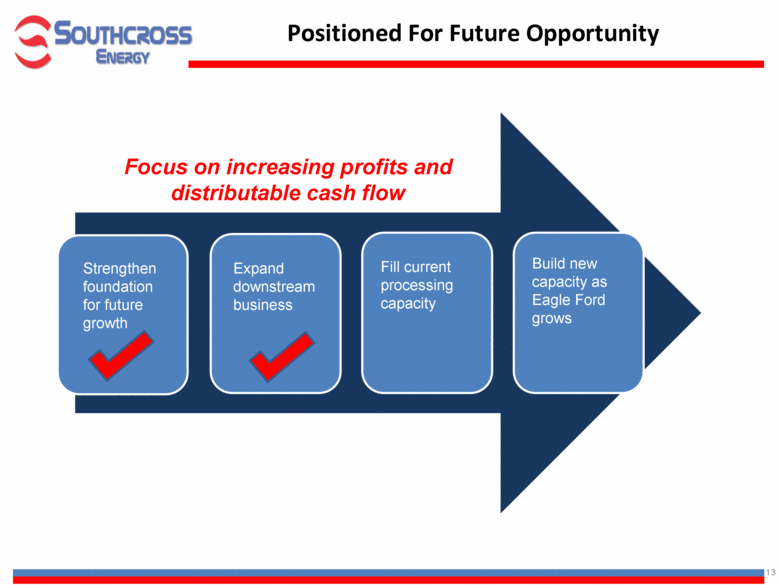
Positioned For Future Opportunity Focus on increasing profits and distributable cash flow Expand downstream business Fill current processing capacity Build new capacity as Eagle Ford grows Strengthen foundation for future growth |
|
|
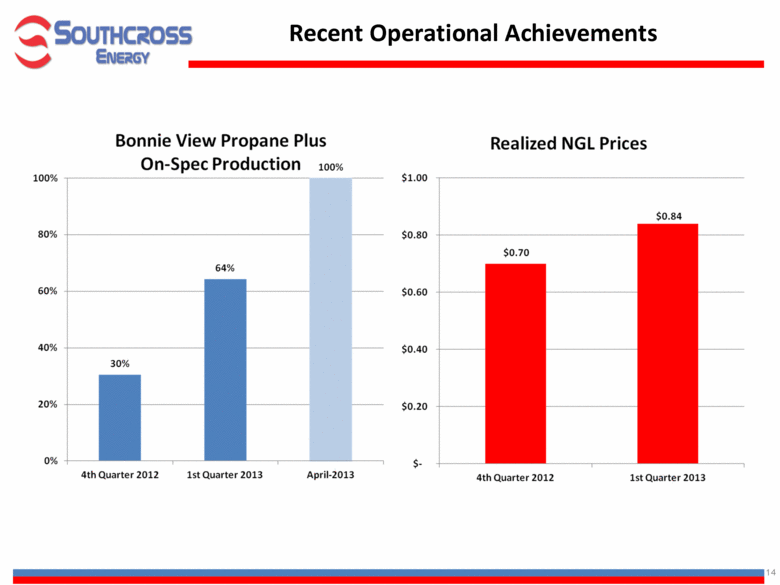
Recent Operational Achievements Bonnie View Propane Plus On-Spec Production Realized NGL Prices |
|
|
Southcross Investment Summary Strategically located asset base leveraged to Eagle Ford shale growth Integrated midstream assets from gathering through NGLs Leveraged to increasing opportunities in downstream NGL and residue natural gas business Filling existing capacity of assets provides near-term growth opportunity Strengthened balance sheet to support current business and expansion Supportive private equity sponsor with significant industry expertise Highly-experienced management team |
|
|
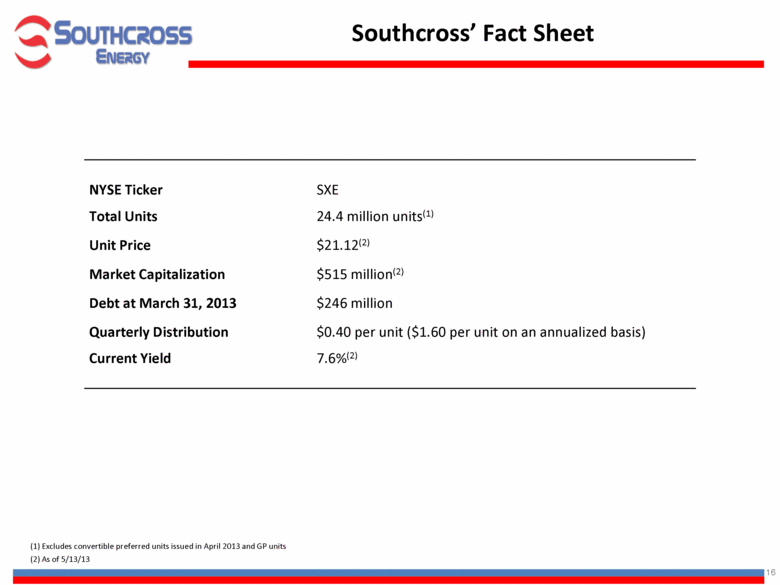
Southcross’ Fact Sheet NYSE Ticker SXE Total Units 24.4 million units(1) Unit Price $21.12(2) Market Capitalization $515 million(2) Debt at March 31, 2013 $246 million Quarterly Distribution $0.40 per unit ($1.60 per unit on an annualized basis) Current Yield 7.6%(2) (2) As of 5/13/13 (1) Excludes convertible preferred units issued in April 2013 and GP units |
|
|
Non-GAAP Measures SXE has used the non-GAAP financial measures of Adjusted EBITDA and distributable cash flow. SXE provides reconciliations of these non-GAAP financial measures to their most directly comparable financial measure as calculated and presented in accordance with GAAP. SXE defines Adjusted EBITDA as net income: plus interest expense, income tax expense, depreciation and amortization expense, certain non-cash charges such as non-cash equity compensation, unrealized losses on commodity derivative contracts, and selected charges / transaction costs that are unusual or non-recurring; less interest income, income tax benefit, unrealized gains on commodity derivative contracts, and selected gains that are unusual or non-recurring. Adjusted EBITDA is used as a supplemental financial measure by management and by external users of SXE’s financial statements, such as investors and lenders, to assess: the financial performance of SXE’s assets without regard to financing methods, capital structure or historical cost basis; the ability of SXE’s assets to generate cash sufficient to support its indebtedness and make cash distributions to its unitholders and general partner; its operating performance and return on capital as compared to those of other companies in the midstream energy sector, without regard to financing or capital structure; and the attractiveness of capital projects and acquisitions and the overall rates of return on alternative investment opportunities. SXE defines distributable cash flow as Adjusted EBITDA plus interest income, less cash interest expense (net of capitalized costs), income tax expense and maintenance capital expenditures and uses distributable cash flow to analyze its performance. Distributable cash flow does not reflect changes in working capital balances. Distributable cash flow is used as a supplemental financial measure by management and by external users of SXE’s financial statements, such as investors, to assess (i) the ability of SXE’s assets to generate cash sufficient to support its indebtedness and make future cash distributions to its unitholders; and (ii) the attractiveness of capital projects and acquisitions and the overall rates of return on alternative investment opportunities. The economic rationale behind management's use of Adjusted EBITDA and distributable cash flow is to measure SXE’s (i) operational performance, (ii) ability to incur and service debt, (iii) ability to fund capital expenditures and (iv) ability to make distributions to its investors. Adjusted EBITDA and distributable cash flow have limitations as analytical tools and should not be considered as alternatives to, or more meaningful than, performance measures calculated in accordance with GAAP. For example, certain items excluded from Adjusted EBITDA and distributable cash flow are significant components in understanding and assessing a company’s financial performance, including deductions for items such as depreciation, amortization, interest and income taxes. SXE’s computations of Adjusted EBITDA and distributable cash flow may not be comparable to other similarly titled measures of other companies. |
|
|
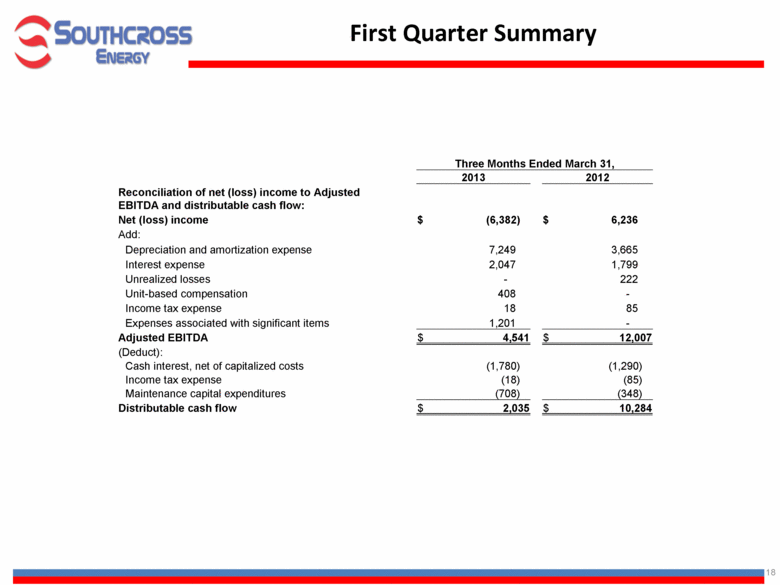
Three Months Ended March 31, 2013 2012 Reconciliation of net (loss) income to Adjusted EBITDA and distributable cash flow: Net (loss) income $ (6,382) $ 6,236 Add: Depreciation and amortization expense 7,249 3,665 Interest expense 2,047 1,799 Unrealized losses - 222 Unit-based compensation 408 - Income tax expense 18 85 Expenses associated with significant items 1,201 - Adjusted EBITDA $ 4,541 $ 12,007 (Deduct): Cash interest, net of capitalized costs (1,780) (1,290) Income tax expense (18) (85) Maintenance capital expenditures (708) (348) Distributable cash flow $ 2,035 $ 10,284 First Quarter Summary |