Attached files
| file | filename |
|---|---|
| 8-K - FORM 8-K - REPUBLIC AIRWAYS HOLDINGS INC | v345270_8k.htm |

Bank of America Merrill Lynch 2013 Global Transportation Conference Boston, MA May 15, 2013

Safe Harbor Disclosure DISCLAIMER Statements in this presentation, as well as oral statements that may be made by officers or directors of Republic Airways Holdings Inc., its advisors, affiliates or subsidiaries (collectively or separately the “Company”), that are not historical fact constitute “forward - looking statements”. Such forward - looking statements involve known and unknown risks, uncertainties and other factors that could cause the actual results of the Company to differ materially from historical results or from any results expressed or implied by the forward - looking statements. Such risks and uncertainties are outlined in the Company’s Annual Report on Form 10 - K, most recent Quarterly Report and other documents filed with the SEC from time to time. The Company cautions users of this presentation not to place undue reliance on forward - looking statements, which may be based on assumptions and anticipated events that do not materialize . 5/15/2013 2 © Republic Airways Holdings Inc.
Executive Summary • RJET reporting improved financial results driven by 2011 restructuring of Frontier and 2012 restructuring of 50 - seat subsidiary, Chautauqua Airlines • RJET well positioned in contracting regional industry with multiple partnerships and focus on growing larger regional aircraft fleet • Two remaining objectives for 2013 are to sell Frontier and secure new labor agreements for Republic 5/15/2013 3 © Republic Airways Holdings Inc.

Financial Progress 2010 - 2012 5/15/2013 © Republic Airways Holdings Inc. 4 2.49 3.36 2.00 2.50 3.00 3.50 2010 2012 Fuel Cost per Gallon (52.8) 23.9 (75.0) (25.0) 25.0 2010 2012 Pre - tax Income Frontier • Frontier restructuring complete in Sep 2011 • Secured > $120 million of annual improvements from labor, aircraft, maintenance, distribution cost and network/fleet adjustments Republic 31.3 62.3 - 50.0 100.0 2010 2012 Pre - tax Income • Chautauqua restructuring completed in Q4 2012 • Secured > $45 million in average annual cash flow improvements for 2012 - 2016 177 213 48 13 100 150 200 250 2010 2012 Fleet Mix AC under Pro-Rate at YE AC under Fixed-Fee at YE
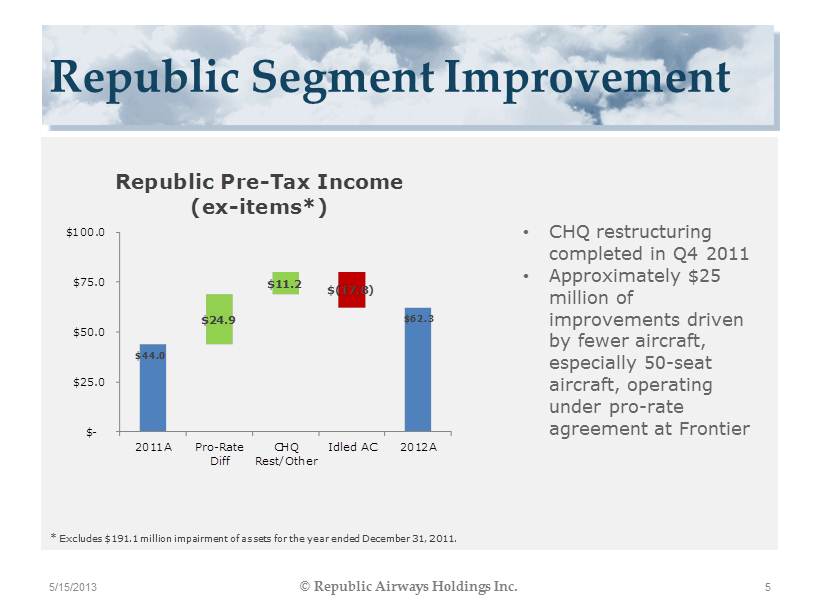
Republic Segment Improvement 5/15/2013 © Republic Airways Holdings Inc. 5 • CHQ restructuring completed in Q4 2011 • Approximately $25 million of improvements driven by fewer aircraft, especially 50 - seat aircraft, operating under pro - rate agreement at Frontier $44.0 $62.3 $24.9 $11.2 $(17.8) $- $25.0 $50.0 $75.0 $100.0 2011A Pro-Rate Diff CHQ Rest/Other Idled AC 2012A Republic Pre - Tax Income (ex - items*) * Excludes $191.1 million impairment of assets for the year ended December 31, 2011.

Frontier Segment Improvement 5/15/2013 © Republic Airways Holdings Inc. 6 • Network improvement drove unit revenue increases that outperformed the industry • Unit cost improvement driven by increase in seat density and restructuring in second half 2011 $(95.3) $23.9 $88.1 $32.1 $16.8 $8.3 $(100.0) $(75.0) $(50.0) $(25.0) $- $25.0 $50.0 2011A TRASM Unit Cost/ Other Fleet Trans. Fuel 2012A Frontier Pre - Tax Income
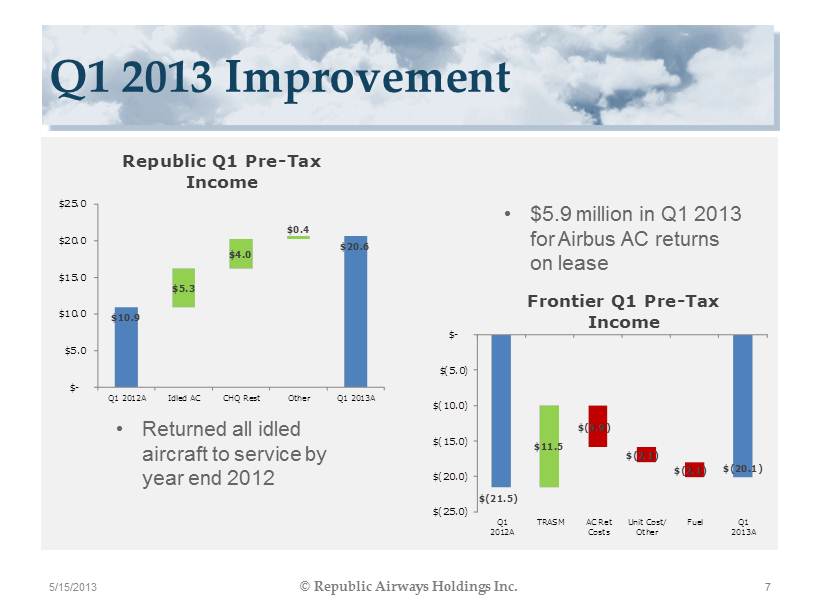
Q1 2013 Improvement 5/15/2013 © Republic Airways Holdings Inc. 7 • Returned all idled aircraft to service by year end 2012 • $5.9 million in Q1 2013 for Airbus AC returns on lease $10.9 $20.6 $5.3 $4.0 $0.4 $- $5.0 $10.0 $15.0 $20.0 $25.0 Q1 2012A Idled AC CHQ Rest Other Q1 2013A Republic Q1 Pre - Tax Income $(21.5) $(20.1) $11.5 $(5.9) $(2.1) $(2.1) $(25.0) $(20.0) $(15.0) $(10.0) $(5.0) $- Q1 2012A TRASM AC Ret Costs Unit Cost/ Other Fuel Q1 2013A Frontier Q1 Pre - Tax Income

Republic 2011 - 2013 Trend 5/15/2013 8 © Republic Airways Holdings Inc. (1) Represents the midpoint of 2013 full year guidance. (2) Includes $48.2 million and $102.5 million of fuel expense reimbursement for the year ended December 31, 2012 and 2011. Effec tiv e July 1, 2012 United agreed to supply fuel directly to our flights under its code - share agreements and the Company will no longer recognize the cost of fuel and relat ed revenue for fuel used under the United Code - Share Agreement. (3) Excludes $191.1 million of impairment for the year ended December 31, 2011. 2011A 2012A 2013E (1) Revenue (millions) (2) 1,534.0$ 1,377.4$ 1,410.0$ Pre-Tax Income (3) 44.0$ 62.3$ 95.2$ Pre-Tax Margin (3) 2.87% 4.52% 6.75% Block Hours 731 701 769 Available Seat Miles 14,449 13,437 13,716

2013 Republic Fleet Plan Republic AC Republic Partners 5/15/2013 © Republic Airways Holdings Inc. 9 70 126 10 21 Q1 2013 (225) E140/145 E170/175 E190 Q400 70 141 10 32 Q4 2013 (253) E140/145 E170/175 E190 Q400 6.7% 29.3% 31.6% 28.0% 4.4% Q1 2013 AA US UA DL F9/CT 12.1% 23.3% 32.9% 28.5% 3.2% Q4 2013 AA US UA DL F9/CT

Growth at Republic in 2013 and Beyond • Q400 contract ramping up with UA – Total of 32 aircraft, additional 17 in service in 2013 • E175 contract to begin in Q3 2013 with AA – Total of 47 aircraft, 15 in - service in 2013 • Option for 47 additional E175 aircraft beginning in 2015 – Optimal time frame to place with our network partners 5/15/2013 10 © Republic Airways Holdings Inc.

State of the Airline Industry • Macro economic factors are creating headwinds on industry revenues: higher personal taxes, stagnant jobs recovery and sequester are holding back the economic recovery • However the sluggish economy is also being reflected in lower energy costs • US Airways/AA merger will create 4 super - sized Airlines that control 85% of the domestic marketplace: AA, UA, DL, WN – Consolidation will likely lead to hub rationalization in the future • Fewer hubs means less demand for 50 seat RJs • Fewer network carriers means fewer customers for RJET and a more vigorous competitive environment 11 5/15/2013 © Republic Airways Holdings Inc.

Mainline Scope Changes Large RJ’s grow at the expense of small RJ’s 125 370 195 225 75 141 75 102 102 150 47 48 34 34 318 450 223 Previous 573 153 Potential 194 85 Current 260 85 Current 325 202 Previous Current 272 Current 450 255 Previous 552 32 Delta United American US Airways Note: Where scope i s calculated as a percentage of mainline fleet, in - service fleet at 12/31/11 was used and held constant 71+ seats 50 seats or less 51 - 70 seats Reasonably predictable Highly dynamic Comparing current allocations against maximum potential allocations allowed in recent/tentative agreements indicates opportunities to add a significant number of new 70 - seaters over time Q400’s counted against CO 50 - seat limit, but against TA 70+ seat limit Previous large jet category specified 43 ATR’s Specific limit of 153 76 - seat shells; remainder 51 - 75 seats 12 12 5/15/2013 © Republic Airways Holdings Inc. Information obtained from public company filings.
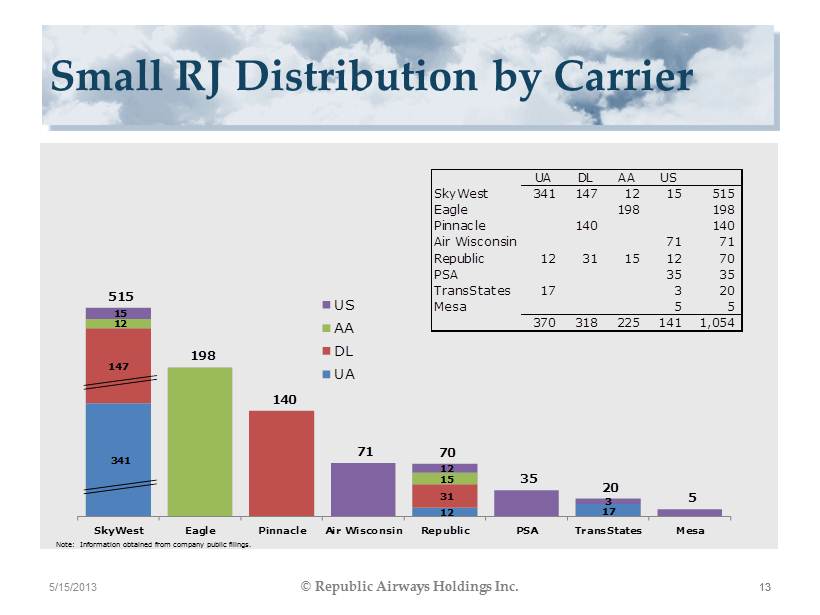
Small RJ Distribution by Carrier 13 13 5/15/2013 © Republic Airways Holdings Inc. 341 12 17 147 31 12 15 15 12 3 515 198 140 71 70 35 20 5 SkyWest Eagle Pinnacle Air Wisconsin Republic PSA TransStates Mesa US AA DL UA UA DL AA US SkyWest 341 147 12 15 515 Eagle 198 198 Pinnacle 140 140 Air Wisconsin 71 71 Republic 12 31 15 12 70 PSA 35 35 TransStates 17 3 20 Mesa 5 5 370 318 225 141 1,054 Note: Information obtained from company public filings.

Large RJ Distribution by Carrier 14 14 5/15/2013 © Republic Airways Holdings Inc. 70 70 22 20 30 122 67 36 58 39 47 40 9 205 192 89 76 68 47 14 Republic SkyWest TransStates Pinnacle Mesa Eagle PSA Growth US AA DL UA Note: Information obtained from company public filings. United has placed order for 30 E175 aircraft in 2015 (no carrier selected) UA DL AA US Republic 70 30 58 158 SkyWest 70 122 192 Pinnacle 36 36 TransStates 22 67 89 Mesa 20 39 59 Eagle 47 47 PSA 14 14 182 255 47 111 595
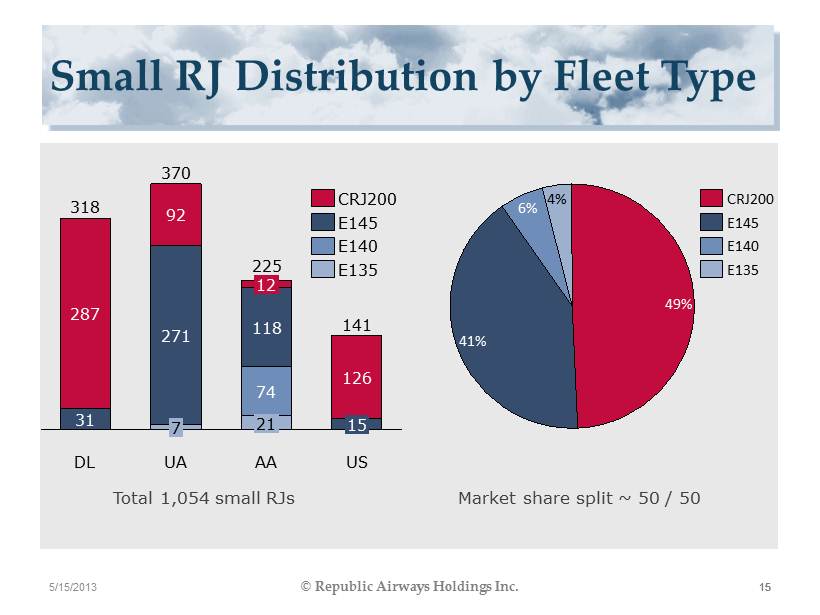
Small RJ Distribution by Fleet Type Total 1,054 small RJs 4% 41% 49% 6% E145 CRJ200 E140 E135 Market share split ~ 50 / 50 DL AA UA 287 31 318 92 271 370 12 118 74 225 US 7 21 141 126 15 CRJ200 E145 E140 E135 15 15 15 5/15/2013 © Republic Airways Holdings Inc.

Large RJ Distribution by Fleet Type 43% 24% 5% 15% 13% CRJ700 CRJ900 Q400 E175 E170 Total 595 large RJs Market share split ~ 70 / 30 47 85 38 255 20 112 DL AA UA 98 32 182 111 52 US 39 14 20 38 CRJ900 CRJ700 Q400 E175 E170 16 16 16 5/15/2013 © Republic Airways Holdings Inc.
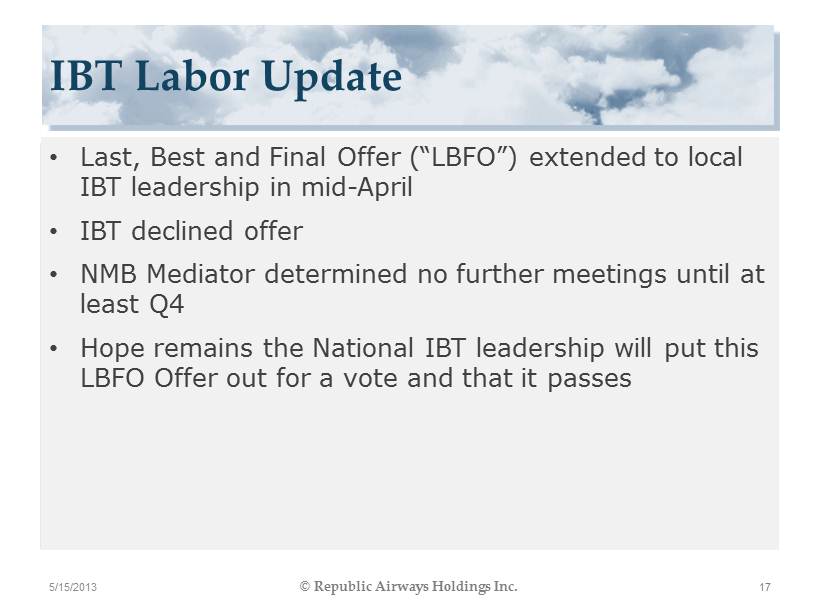
IBT Labor Update • Last, Best and Final Offer (“LBFO”) extended to local IBT leadership in mid - April • IBT declined offer • NMB Mediator determined no further meetings until at least Q4 • Hope remains the National IBT leadership will put this LBFO Offer out for a vote and that it passes 5/15/2013 17 © Republic Airways Holdings Inc.

Frontier Sale Update • Negotiating final term sheets with interested parties • Expect transaction, if it occurs, to close in early third quarter • Will know more in the next 30 days and will update you when we have something we can say publicly • Due to NDA, we cannot discuss publically at this point 5/15/2013 18 © Republic Airways Holdings Inc.
QUESTIONS 5/15/2013 © Republic Airways Holdings Inc. 19
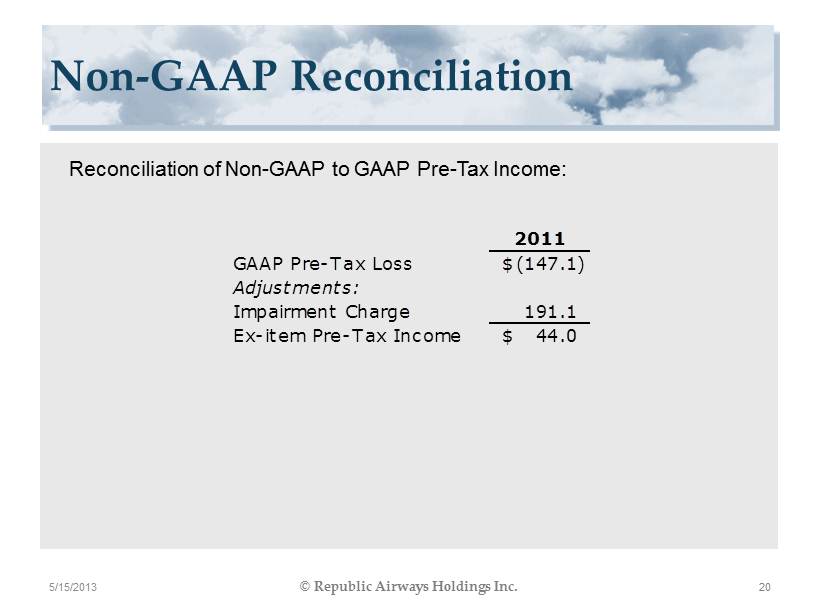
Non - GAAP Reconciliation 5/15/2013 20 © Republic Airways Holdings Inc. 2011 GAAP Pre-Tax Loss (147.1)$ Adjustments: Impairment Charge 191.1 Ex-item Pre-Tax Income 44.0$ Reconciliation of Non - GAAP to GAAP Pre - Tax Income:
