Attached files
| file | filename |
|---|---|
| 8-K - FORM 8-K - PEPCO HOLDINGS LLC | t76549_8k.htm |
Exhibit 99
 |
2013 Citi
Global
Energy and
Utilities
Conference
Investing Today
for a Brighter
Tomorrow
May 16, 2013
Boston, MA
|
 |
Safe Harbor Statement/Regulation G Information
Some of the statements contained in today’s presentation with respect to Pepco Holdings, Pepco, Delmarva Power and Atlantic City Electric, including each of their respective subsidiaries, are forward-looking statements within the meaning of the U.S. federal securities laws and are subject to the safe harbor created thereby under the Private Securities Litigation Reform Act of 1995. These statements include declarations regarding the intents, beliefs and current expectations of one or more of PHI, Pepco, DPL or ACE (each, a Reporting Company) or their subsidiaries. In some cases you can identify forward-looking statements by terminology such as “may,” “might,” “will,” “should,” “could,” “expects,” “intends,” “assumes,” “seeks to,” “plans,” “anticipates,” “believes,” “projects,” “estimates,” “predicts,” “potential,” “future,” “goal,” “objective,” or “continue”, the negative or other variations of such terms, or comparable terminology, or by discussions of strategy that involve risks and uncertainties. Forward-looking statements involve estimates, assumptions, known and unknown risks, uncertainties and other factors that may cause one or more Reporting Companies’ or their subsidiaries’ actual results, levels of activity, performance or achievements to be materially different from any future results, levels of activity, performance or achievements expressed or implied by such forward-looking statements. Therefore, forward-looking statements are not guarantees or assurances of future performance, and actual results could differ materially from those indicated by the forward-looking statements. These forward-looking statements are qualified in their entirety by, and should be read together with, the risk factors included in the “Risk Factors” section and other statements in each Reporting Company’s annual report on Form 10-K for the year ended December 31, 2012 filed on March 1, 2013 and other Securities and Exchange Commission (SEC) filings, and investors should refer to these risk factor sections and such other statements. All such factors are difficult to predict, contain uncertainties, are beyond each Reporting Company’s or its subsidiaries’ control and may cause actual results to differ materially from those contained in the forward-looking statements. Any forward-looking statements speak only as of the date of this presentation and none of the Reporting Companies undertakes any obligation to update any forward-looking statements to reflect events or circumstances after the date on which such statements are made or to reflect the occurrence of unanticipated events. New factors emerge from time to time, and it is not possible for a Reporting Company to predict all such factors. Furthermore, it may not be possible to assess the impact of any such factor on such Reporting Company’s or its subsidiaries’ business (viewed independently or together with the business or businesses of some or all of the other Reporting Companies or their subsidiaries) or the extent to which any factor, or combination of factors, may cause results to differ materially from those contained in any forward-looking statement. Any specific factors that may be provided should not be construed as exhaustive. PHI routinely makes available important information with respect to each Reporting Company, including copies of each Reporting Company’s annual, quarterly and current reports filed with or furnished to the SEC under the Securities Exchange Act of 1934, on PHI’s website at http://www.pepcoholdings.com/investors. PHI recognizes its website as a key channel of distribution to reach public investors and as a means of disclosing material non-public information to comply with each Reporting Company’s disclosure obligations under SEC Regulation FD. PHI discloses net income from continuing operations and related per share data (both as historical information and earnings guidance) excluding certain items (non-GAAP financial information) because management believes that these items are not representative of PHI’s ongoing business operations. Management uses this information, and believes that such information is useful to investors, in evaluating PHI’s period-over-period performance. The inclusion of this disclosure is intended to complement, and should not be considered as an alternative to, PHI’s reported net income from continuing operations and related per share data in accordance with accounting principles generally accepted in the United States (GAAP).
1
|
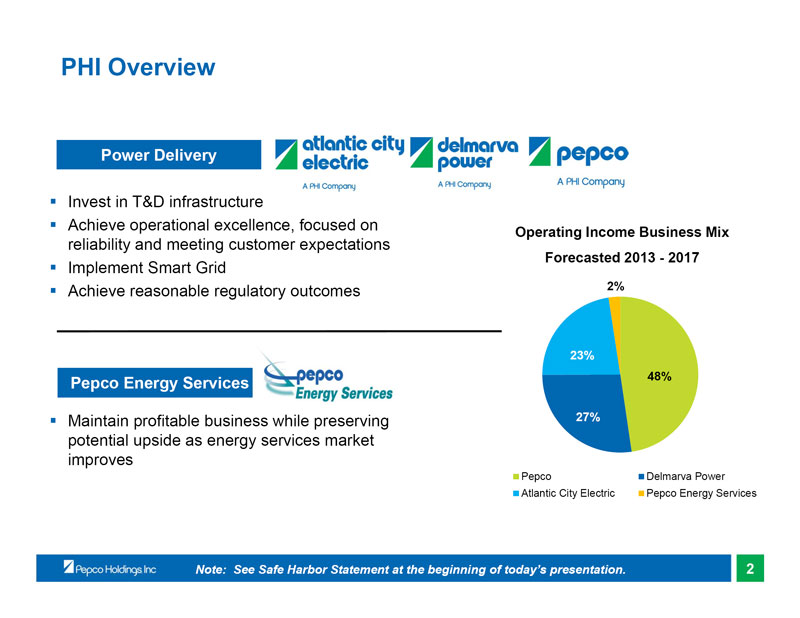 |
PHI Overview
Power Delivery
Invest in T&D infrastructure
Achieve operational excellence, focused on
Operating Income Business Mix
reliability and meeting customer expectations
Forecasted 2013 - 2017
Implement Smart Grid
Achieve reasonable regulatory outcomes 2%
23%
Pepco Energy Services 48%
Maintain profitable business while preserving 27% potential upside as energy services market improves
Pepco Delmarva Power Atlantic City Electric Pepco Energy Services
Note: See Safe Harbor Statement at the beginning of today’s presentation. 2
|
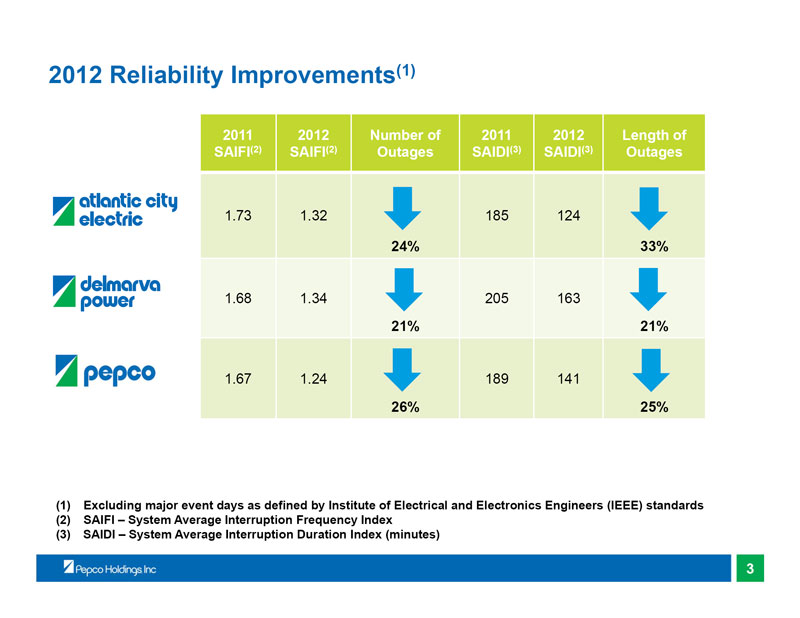 |
2012 Reliability Improvements(1)
2011 2012 Number of 2011 2012 Length of SAIFI(2) SAIFI(2) Outages SAIDI(3) SAIDI(3) Outages
1.73 1.32 185 124
24% 33%
1.68 1.34 205 163
21% 21%
1.67 1.24 189 141
26% 25%
(1) Excluding major event days as defined by Institute of Electrical and Electronics Engineers (IEEE) standards (2) SAIFI – System Average Interruption Frequency Index (3) SAIDI – System Average Interruption Duration Index (minutes)
3
|
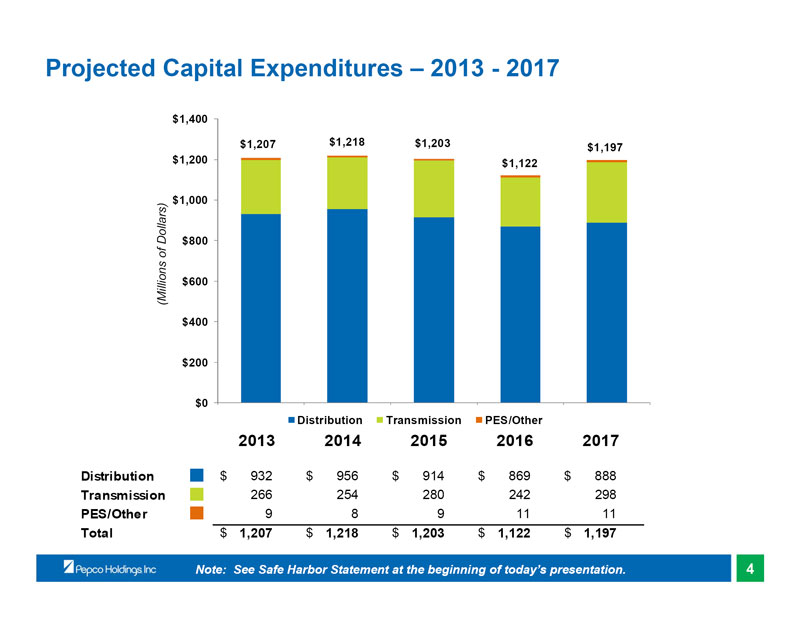 |
Projected Capital Expenditures – 2013 - 2017
$1,400 $1,207 $1,218 $1,203 $1,197 $1,200 $1,122
$1,000
$800
(Millions of Dollars) $600 $400
$200
$0
2013 2014 2015 2016 2017
Distribution Transmission PES/Other
2013 2014 2015 2016 2017
Distribution J $ 932 $ 956 $ 914 $ 869 $ 888 Transmission J 266 254 280 242 298 PES/Other J 9 8 9 11 11
Total $ 1,207 $ 1,218 $ 1,203 $ 1,122 $ 1,197
Note: See Safe Harbor Statement at the beginning of today’s presentation. 4
|
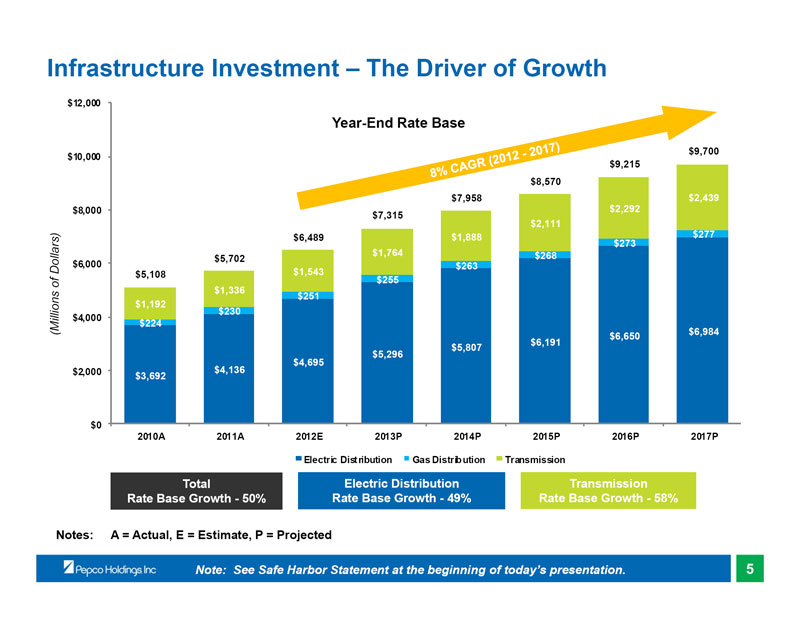 |
Infrastructure Investment – The Driver of Growth
$12,000
Year-End Rate Base
$9,700 $10,000 $9,215 $8,570 $7,958 $2,439 $8,000 $2,292 $7,315 $2,111 $6,489 $1,888 $277 $273 $1,764 $268 $5,702 $6,000 $263 $5,108 $1,543 $255 $1,336 $251 $1,192 $230 $4,000 $224
(Millions of Dollars) $6,984
$6,650 $6,191 $5,807 $5,296 $4,695 $2,000 $4,136 $3,692
$0
2010A 2011A 2012E 2013P 2014P 2015P 2016P 2017P
Electric Distribution Gas Distribution Transmission
Total Electric Distribution Transmission Rate Base Growth - 50% Rate Base Growth - 49% Rate Base Growth - 58%
Notes: A = Actual, E = Estimate, P = Projected
Note: See Safe Harbor Statement at the beginning of today’s presentation. 5
|
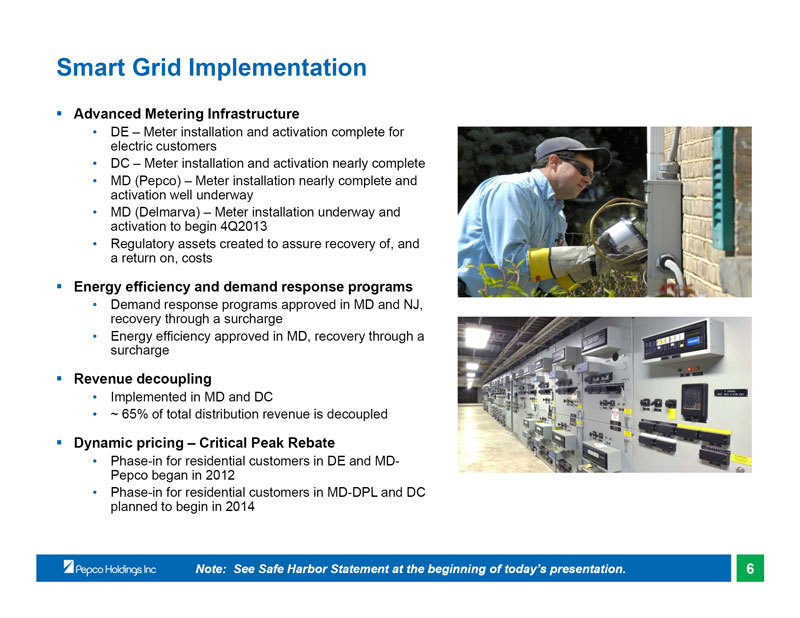 |
Smart Grid Implementation
Advanced Metering Infrastructure
• DE – Meter installation and activation complete for electric customers
• DC – Meter installation and activation nearly complete
• MD (Pepco) – Meter installation nearly complete and activation well underway
• MD (Delmarva) – Meter installation underway and activation to begin 4Q2013
• Regulatory assets created to assure recovery of, and a return on, costs
Energy efficiency and demand response programs
• Demand response programs approved in MD and NJ, recovery through a surcharge
• Energy efficiency approved in MD, recovery through a surcharge
Revenue decoupling
• Implemented in MD and DC
• ~ 65% of total distribution revenue is decoupled
Dynamic pricing – Critical Peak Rebate
• Phase-in for residential customers in DE and MD-Pepco began in 2012
• Phase-in for residential customers in MD-DPL and DC planned to begin in 2014
Note: See Safe Harbor Statement at the beginning of today’s presentation. 6
|
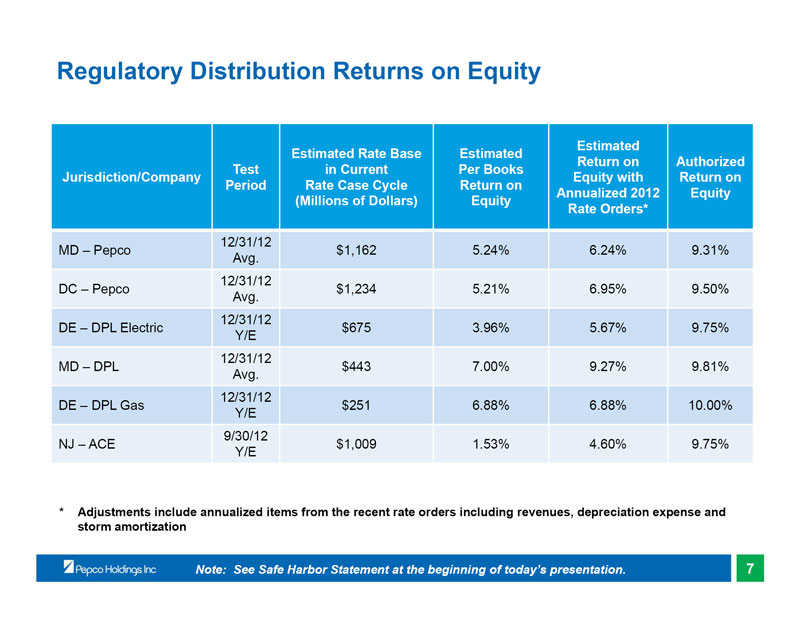 |
Regulatory Distribution Returns on Equity
Estimated Estimated Rate Base Estimated
Return on Authorized Test in Current Per Books Jurisdiction/Company Equity with Return on Period Rate Case Cycle Return on Annualized 2012 Equity (Millions of Dollars) Equity Rate Orders*
12/31/12
MD – Pepco $1,162 5.24% 6.24% 9.31% Avg.
12/31/12
DC – Pepco $1,234 5.21% 6.95% 9.50% Avg.
12/31/12
DE – DPL Electric $675 3.96% 5.67% 9.75% Y/E
12/31/12
MD – DPL $443 7.00% 9.27% 9.81% Avg.
12/31/12
DE – DPL Gas $251 6.88% 6.88% 10.00% Y/E
9/30/12
NJ – ACE $1,009 1.53% 4.60% 9.75% Y/E
* Adjustments include annualized items from the recent rate orders including revenues, depreciation expense and storm amortization
Note: See Safe Harbor Statement at the beginning of today’s presentation. 7
|
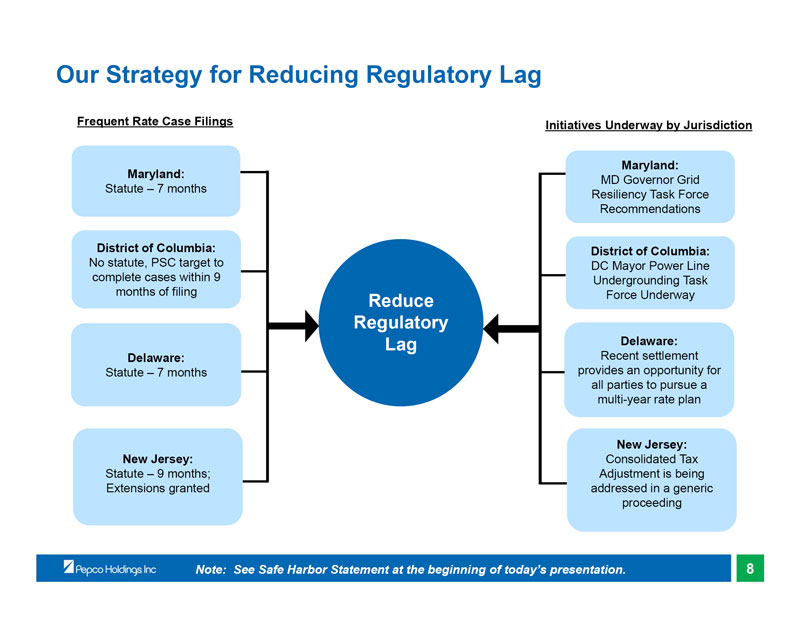 |
Our Strategy for Reducing Regulatory Lag
Frequent Rate Case Filings Initiatives Underway by Jurisdiction
Maryland: Maryland:
MD Governor Grid Statute – 7 months Resiliency Task Force Recommendations
District of Columbia: District of Columbia:
No statute, PSC target to DC Mayor Power Line complete cases within 9 Undergrounding Task months of filing Force Underway
Reduce Regulatory
Lag Delaware: Delaware: Recent settlement Statute – 7 months provides an opportunity for all parties to pursue a multi-year rate plan
New Jersey: New Jersey: Consolidated Tax Statute – 9 months; Adjustment is being Extensions granted addressed in a generic proceeding
Note: See Safe Harbor Statement at the beginning of today’s presentation. 8
|
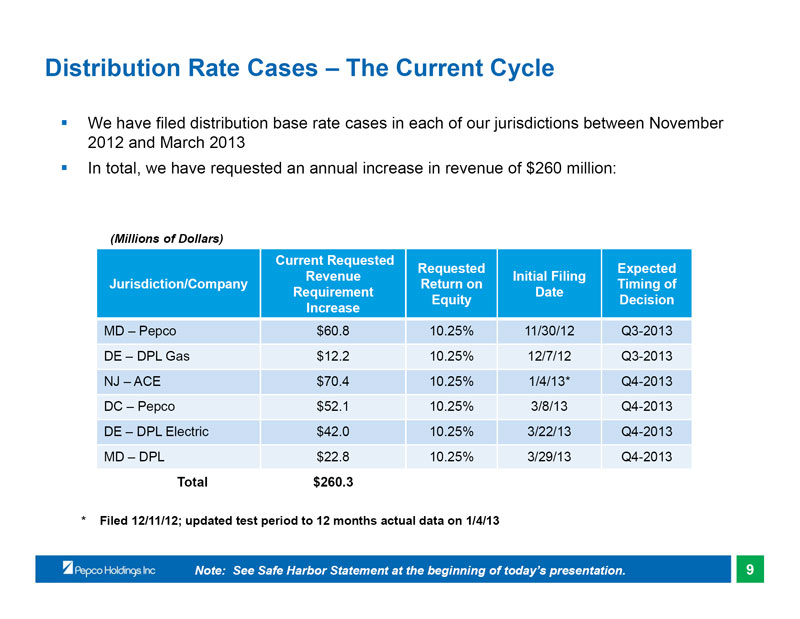 |
Distribution Rate Cases – The Current Cycle
We have filed distribution base rate cases in each of our jurisdictions between November 2012 and March 2013
In total, we have requested an annual increase in revenue of $260 million:
(Millions of Dollars)
Current Requested
Requested Expected Revenue Initial Filing Jurisdiction/Company Return on Timing of Requirement Date Equity Decision Increase
MD – Pepco $60.8 10.25% 11/30/12 Q3-2013 DE – DPL Gas $12.2 10.25% 12/7/12 Q3-2013 NJ – ACE $70.4 10.25% 1/4/13* Q4-2013 DC – Pepco $52.1 10.25% 3/8/13 Q4-2013 DE – DPL Electric $42.0 10.25% 3/22/13 Q4-2013 MD – DPL $22.8 10.25% 3/29/13 Q4-2013
Total $260.3
* Filed 12/11/12; updated test period to 12 months actual data on 1/4/13
Note: See Safe Harbor Statement at the beginning of today’s presentation. 9
|
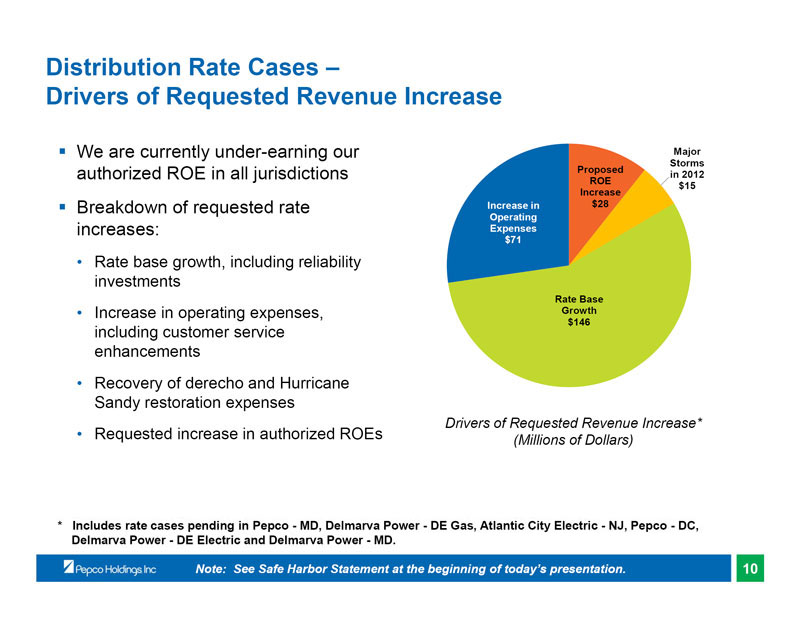 |
Distribution Rate Cases –
Drivers of Requested Revenue Increase
We are currently under-earning our Major
Storms Proposed
authorized ROE in all jurisdictions in 2012
ROE $15 Increase
Breakdown of requested rate Increase in $28
Operating
increases: Expenses
$71
• Rate base growth, including reliability investments
Rate Base
• Increase in operating expenses, Growth
$146
including customer service enhancements
• Recovery of derecho and Hurricane Sandy restoration expenses
Drivers of Requested Revenue Increase*
• Requested increase in authorized ROEs (Millions of Dollars)
* Includes rate cases pending in Pepco - MD, Delmarva Power - DE Gas, Atlantic City Electric - NJ, Pepco - DC, Delmarva Power - DE Electric and Delmarva Power - MD.
Note: See Safe Harbor Statement at the beginning of today’s presentation. 10
|
 |
FERC Filing Challenging Our Transmission Rates
On February 27, 2013, the public service commissions and public advocates in all four of our jurisdictions made a Section 206 filing with FERC challenging the transmission rates of each of our three utilities
Two primary issues were included in the filing:
• Request to reduce the base ROE to 8.7% based on a zone of reasonableness between 6.78% and 10.33%
• Request to modify the formula rate protocols in order to require additional data and identification and justification of costs
The impact of a 100 basis-point change in the transmission ROE is approximately $7 million in after-tax earnings
On April 3, we filed a response to the complaint requesting that FERC dismiss the complaint on the grounds that it failed to meet the requested burden to demonstrate that the existing rates and protocols are unjust and unreasonable
Note: See Safe Harbor Statement at the beginning of today’s presentation. 11
|
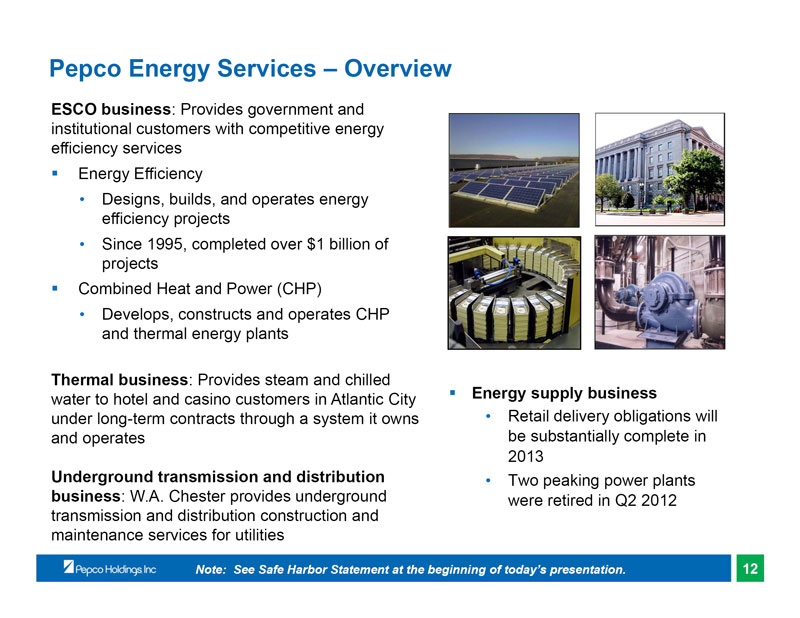 |
Pepco Energy Services – Overview
ESCO business: Provides government and institutional customers with competitive energy efficiency services
Energy Efficiency
• Designs, builds, and operates energy efficiency projects
• Since 1995, completed over $1 billion of projects
Combined Heat and Power (CHP)
• Develops, constructs and operates CHP and thermal energy plants
Thermal business: Provides steam and chilled water to hotel and casino customers in Atlantic City Energy supply business under long-term contracts through a system it owns • Retail delivery obligations will and operates be substantially complete in 2013
Underground transmission and distribution • Two peaking power plants business: W.A. Chester provides underground were retired in Q2 2012 transmission and distribution construction and maintenance services for utilities
Note: See Safe Harbor Statement at the beginning of today’s presentation. 12
|
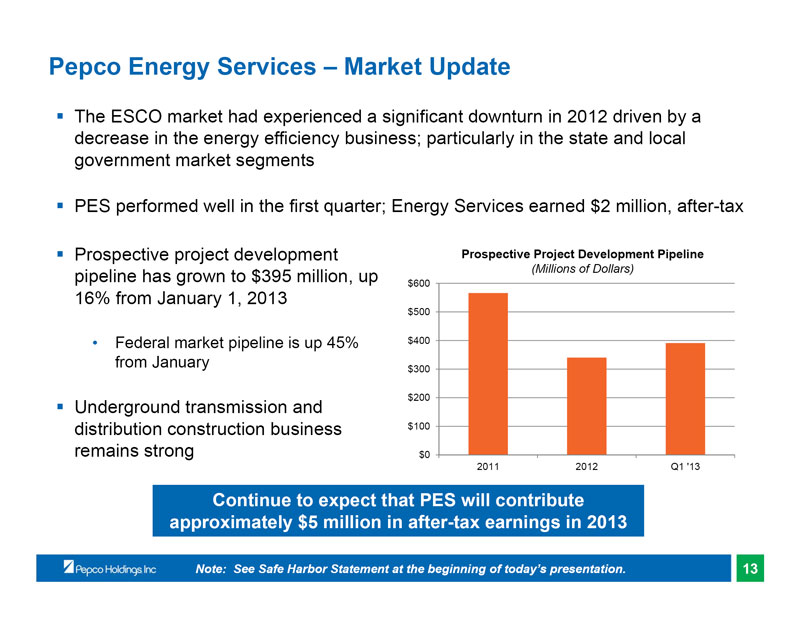 |
Pepco Energy Services – Market Update
The ESCO market had experienced a significant downturn in 2012 driven by a decrease in the energy efficiency business; particularly in the state and local government market segments
PES performed well in the first quarter; Energy Services earned $2 million, after-tax
Prospective project development Prospective Project Development Pipeline
pipeline has grown to $395 million, up (Millions of Dollars)
$600
16% from January 1, 2013
$500
• Federal market pipeline is up 45% $400 from January
$300
$200
Underground transmission and distribution construction business $100 remains strong $0
2011 2012 Q1 ‘13
Continue to expect that PES will contribute approximately $5 million in after-tax earnings in 2013
Note: See Safe Harbor Statement at the beginning of today’s presentation. 13
|
 |
Cross-Border Energy Leases
In the first quarter of 2013, we recorded a non-cash charge to earnings of $389 million, after-tax, which consisted of:
• $307 million to reduce the carrying value of the cross-border energy lease investments
• $82 million of related net interest expense
Following events that took place in the first quarter including court decisions in favor of the IRS, the change in our tax position with respect to the cross-border energy leases and the decision to pursue liquidation of the investments, we re-evaluated our ability to realize certain deferred tax assets associated with PCI legacy leasing activity and established valuation allowances against the assets, resulting in a non-cash charge to earnings of $101 million, after-tax
We have made progress on the liquidation of our six cross-border energy lease investments:
• In the second quarter of 2013, we entered into early termination agreements with three lessees involving two lease investments
• Upon the termination of these leases, we received aggregate net cash proceeds of $373 million and we expect to record an after-tax gain of approximately $30 million in the second quarter of 2013
• The aggregate financial impact of the early termination of the remaining cross-border energy lease investments is not expected to be material; however, there may be individual lease terminations that result in offsetting material gains and losses
Note: See Safe Harbor Statement at the beginning of today’s presentation. 14
|
 |
2013 Financing Activity
Debt Issuance
PHI entered into a new $250 million 364-day term loan on March 28
• Net proceeds were used to repay the then outstanding $200 million loan and for general corporate purposes
• Sized to approximate the $242 million IRS deposit made March 4
• Term loan will be repaid on or about May 29, 2013 with proceeds received from the liquidation of cross-border energy lease investments
Utility long-term debt issuance of $750 - $850 million*
• Pepco ~$400 million of which $250 million was issued March 18, 2013; ($200 million maturing)
• Delmarva Power ~$300 million ($250 million maturing)
• Atlantic City Electric ~$100 million ($69 million maturing)
Equity Issuance
Equity forward transaction entered into on March 5, 2012; settled on February 27, 2013
• 17.92 million shares priced at $19.25 per share
• Net proceeds of $312 million were used to repay outstanding commercial paper, a portion of which had been issued in order to make capital contributions to the utility subsidiaries, and for general corporate purposes
Dividend Reinvestment Plan/Employee Savings Plan (approximately $42 million)
Assuming the unwind of the majority of the cross-border energy lease portfolio, next anticipated equity issuance will be beyond 2015
* Debt issuance amounts may be reduced due to proceeds received in connection with the liquidation of the cross-border energy lease investments.
Note: See Safe Harbor Statement at the beginning of today’s presentation. 15
|
 |
2013 Earnings Guidance
Pepco Holdings 2013 earnings guidance range is $1.05 - $1.20 per share
The guidance range excludes:
• The results of discontinued operations and the impact of any special, unusual or extraordinary items
• All earnings or losses associated with the retail electric supply business at Pepco Energy Services, including the net mark-to-market effects of economic hedging activities
• All earnings or losses associated with the cross-border energy lease investments, including the associated interest on the tax liability
The guidance range assumes/includes:
• Normal weather conditions for the remainder of the year
Note: See Safe Harbor Statement/Reg. G Information at the beginning of today’s presentation. 16
|
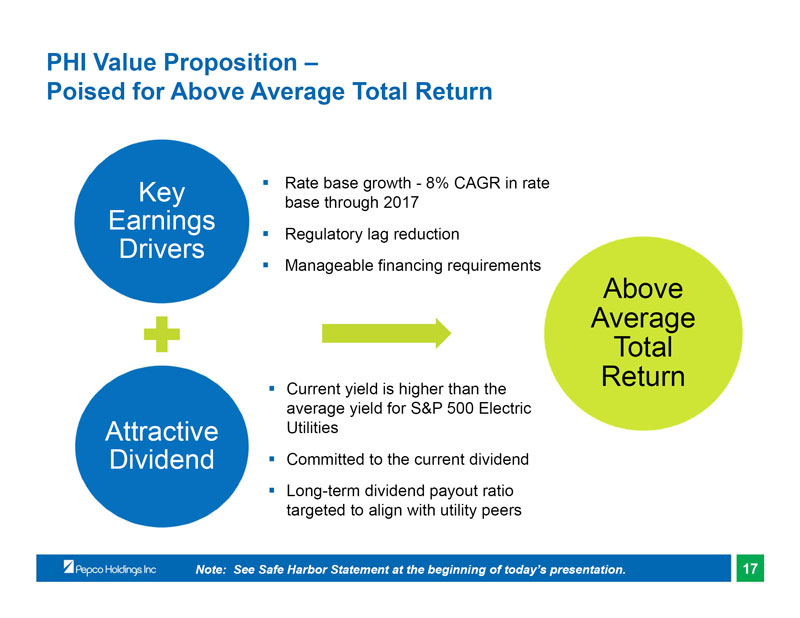 |
PHI Value Proposition –
Poised for Above Average Total Return
Key Rate base growth - 8% CAGR in rate base through 2017
Earnings
Regulatory lag reduction
Drivers
Manageable financing requirements
Above Average Total Return
Current yield is higher than the average yield for S&P 500 Electric
Attractive Utilities
Dividend Committed to the current dividend
Long-term dividend payout ratio targeted to align with utility peers
Note: See Safe Harbor Statement at the beginning of today’s presentation. 17
|
 |
Appendix |
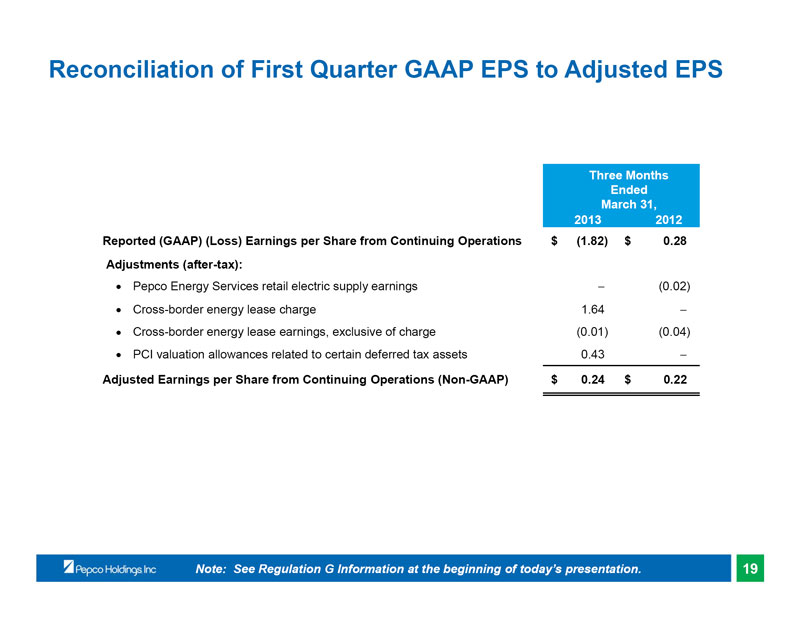 |
Reconciliation of First Quarter GAAP EPS to Adjusted EPS
Three Months Ended March 31, 2013 2012 Reported (GAAP) (Loss) Earnings per Share from Continuing Operations $ (1.82) $ 0.28 Adjustments (after-tax):
Pepco Energy Services retail electric supply earnings (0.02)
Cross-border energy lease charge 1.64
Cross-border energy lease earnings, exclusive of charge (0.01) (0.04)
PCI valuation allowances related to certain deferred tax assets 0.43
Adjusted Earnings per Share from Continuing Operations (Non-GAAP) $ 0.24 $ 0.22
Note: See Regulation G Information at the beginning of today’s presentation. 19
|
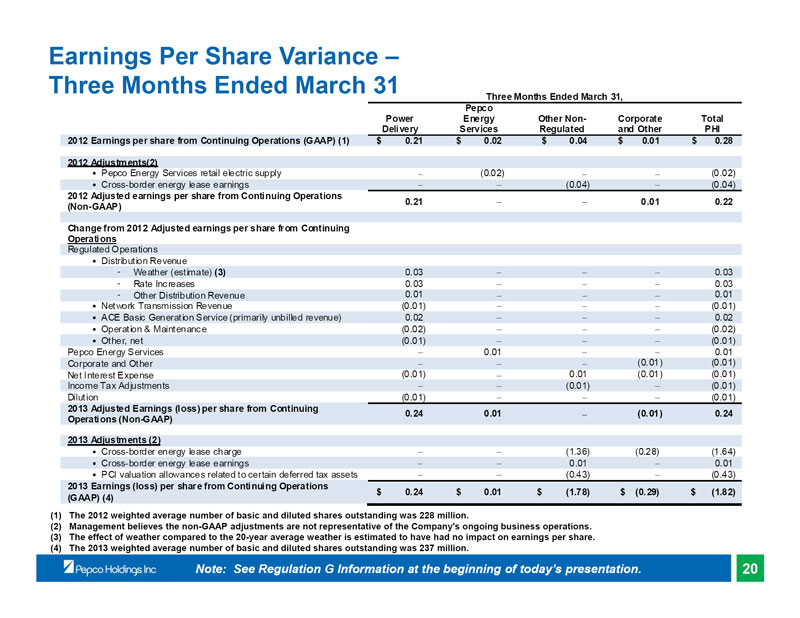 |
Earnings Per Share Variance –Three Months Ended March 31
Three Months Ended March 31, Pepco
Power Energy Other Non- Corporate Total Delivery Services Regulated and Other PHI 2012 Earnings per share from Continuing Operations (GAAP) (1) $ 0.21 $ 0.02 $ 0.04 $ 0.01 $ 0.28
2012 Adjustments(2) • Pepco Energy Services retail electric supply (0.02) (0.02) • Cross-border energy lease earnings (0.04) (0.04)
2012 Adjusted earnings per share from Continuing Operations
0.21 0.01 0.22 (Non-GAAP)
Change from 2012 Adjusted earnings per share from Continuing
Operations Regulated Operations
• Distribution Revenue
- Weather (estimate) (3) 0.03 0.03
- Rate Increases 0.03 0.03
- Other Distribution Revenue 0.01 0.01 • Network Transmission Revenue (0.01) (0.01) • ACE Basic Generation Service (primarily unbilled revenue) 0.02 0.02 • Operation & Maintenance (0.02) (0.02) • Other, net (0.01) (0.01) Pepco Energy Services 0.01 0.01 Corporate and Other (0.01) (0.01) Net Interest Expense (0.01) 0.01 (0.01) (0.01) Income Tax Adjustments (0.01) (0.01) Dilution (0.01) (0.01)
2013 Adjusted Earnings (loss) per share from Continuing
0.24 0.01 (0.01) 0.24 Operations (Non-GAAP)
2013 Adjustments (2)
• Cross-border energy lease charge (1.36) (0.28) (1.64) • Cross-border energy lease earnings 0.01 0.01 • PCI valuation allowances related to certain deferred tax assets (0.43) (0.43)
2013 Earnings (loss) per share from Continuing Operations
$ 0.24 $ 0.01 $ (1.78) $ (0.29) $ (1.82) (GAAP) (4)
(1) The 2012 weighted average number of basic and diluted shares outstanding was 228 million.
(2) Management believes the non-GAAP adjustments are not representative of the Company’s ongoing business operations. (3) The effect of weather compared to the 20-year average weather is estimated to have had no impact on earnings per share. (4) The 2013 weighted average number of basic and diluted shares outstanding was 237 million.
Note: See Regulation G Information at the beginning of today’s presentation. 20
|
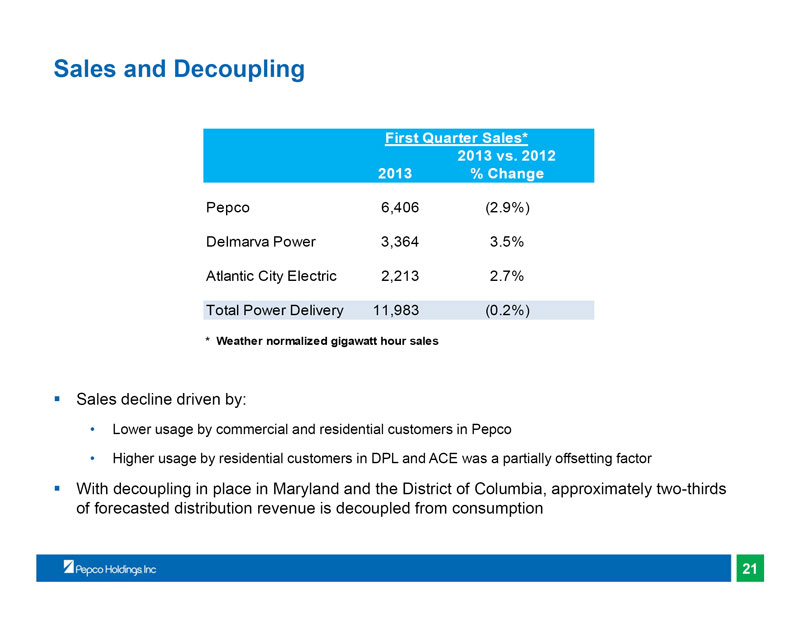 |
Sales and Decoupling
First Quarter Sales* 2013 vs. 2012 2013 % Change
Pepco 6,406 (2.9%) Delmarva Power 3,364 3.5% Atlantic City Electric 2,213 2.7% Total Power Delivery 11,983 (0.2%)
* Weather normalized gigawatt hour sales
Sales decline driven by:
• Lower usage by commercial and residential customers in Pepco
• Higher usage by residential customers in DPL and ACE was a partially offsetting factor
With decoupling in place in Maryland and the District of Columbia, approximately two-thirds of forecasted distribution revenue is decoupled from consumption
21
|
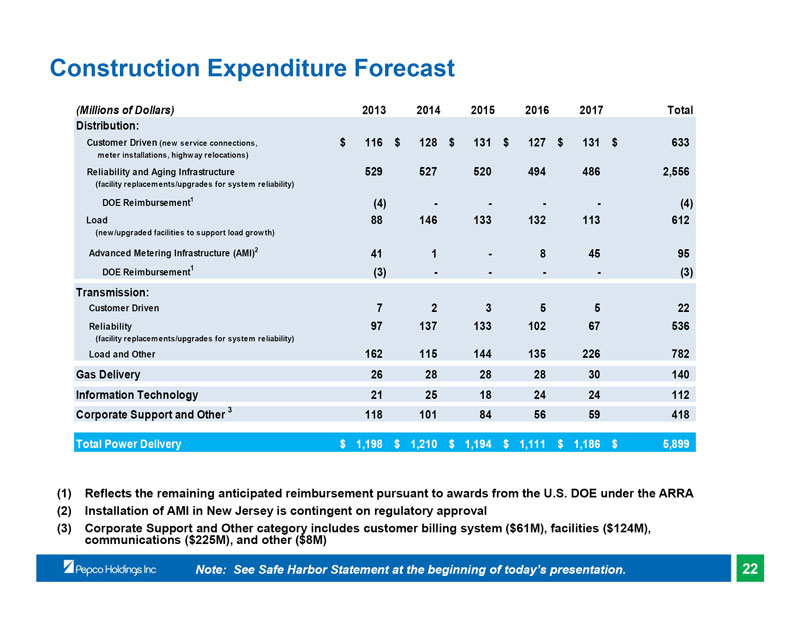 |
Construction Expenditure Forecast
(Millions of Dollars) 2013 2014 2015 2016 2017 Total Distribution: Customer Driven (new service connections, $ 116 $ 128 $ 131 $ 127 $ 131 $ 633
meter installations, highway relocations)
Reliability and Aging Infrastructure 529 527 520 494 486 2,556
(facility replacements/upgrades for system reliability)
DOE Reimbursement1 (4) - - - - (4) Load 88 146 133 132 113 612
(new/upgraded facilities to support load growth)
Advanced Metering Infrastructure (AMI)2 41 1 - 8 45 95 DOE Reimbursement1 (3) - - - - (3) Transmission: Customer Driven 7 2 3 5 5 22 Reliability 97 137 133 102 67 536
(facility replacements/upgrades for system reliability)
Load and Other 162 115 144 135 226 782 Gas Delivery 26 28 28 28 30 140 Information Technology 21 25 18 24 24 112 Corporate Support and Other 3 118 101 84 56 59 418
Total Power Delivery $ 1,198 $ 1,210 $ 1,194 $ 1,111 $ 1,186 $ 5,899
(1) Reflects the remaining anticipated reimbursement pursuant to awards from the U.S. DOE under the ARRA (2) Installation of AMI in New Jersey is contingent on regulatory approval (3) Corporate Support and Other category includes customer billing system ($61M), facilities ($124M), communications ($225M), and other ($8M)
Note: See Safe Harbor Statement at the beginning of today’s presentation. 22
|
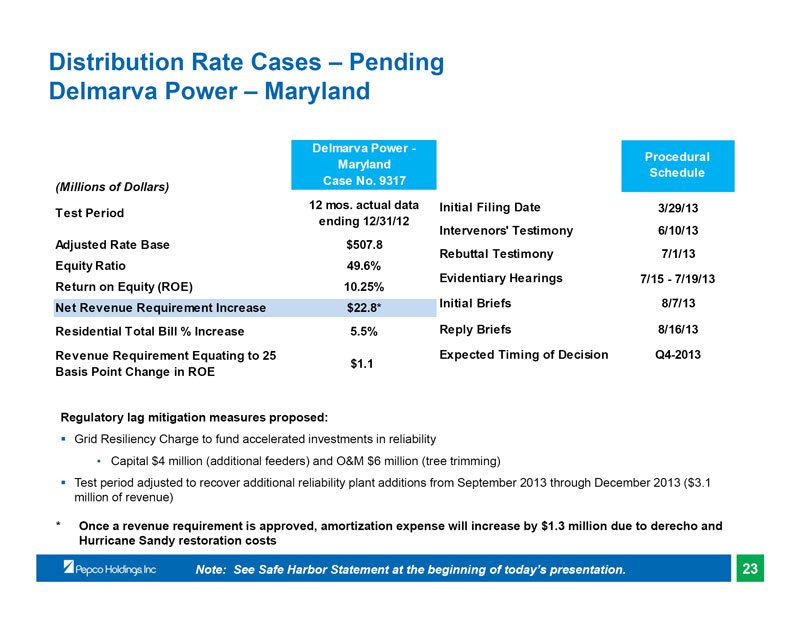 |
Distribution Rate Cases – Pending Delmarva Power – Maryland
Delmarva Power -
Procedural Maryland Schedule Case No. 9317
(Millions of Dollars)
12 mos. actual data Initial Filing Date 3/29/13 Test Period ending 12/31/12 Intervenors’ Testimony 6/10/13 Adjusted Rate Base $507.8 Rebuttal Testimony 7/1/13 Equity Ratio 49.6% Evidentiary Hearings 7/15 - 7/19/13 Return on Equity (ROE) 10.25% Net Revenue Requirement Increase $22.8* Initial Briefs 8/7/13 Residential Total Bill % Increase 5.5% Reply Briefs 8/16/13 Revenue Requirement Equating to 25 Expected Timing of Decision Q4-2013 $1.1 Basis Point Change in ROE
Regulatory lag mitigation measures proposed:
Grid Resiliency Charge to fund accelerated investments in reliability
• Capital $4 million (additional feeders) and O&M $6 million (tree trimming)
Test period adjusted to recover additional reliability plant additions from September 2013 through December 2013 ($3.1 million of revenue)
* Once a revenue requirement is approved, amortization expense will increase by $1.3 million due to derecho and Hurricane Sandy restoration costs
Note: See Safe Harbor Statement at the beginning of today’s presentation. 23
|
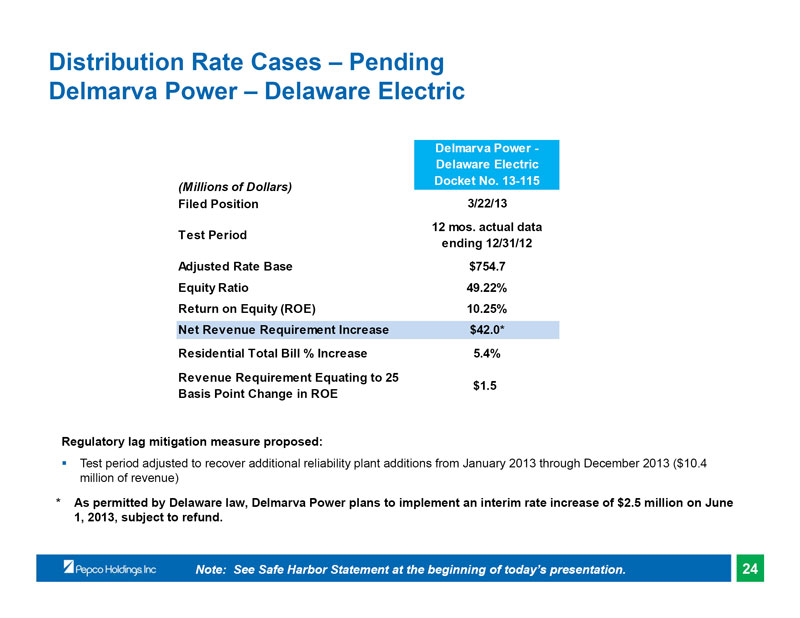 |
Distribution Rate Cases – Pending Delmarva Power – Delaware Electric
Delmarva Power - Delaware Electric Docket No. 13-115
(Millions of Dollars)
Filed Position 3/22/13 12 mos. actual data Test Period ending 12/31/12 Adjusted Rate Base $754.7 Equity Ratio 49.22% Return on Equity (ROE) 10.25% Net Revenue Requirement Increase $42.0* Residential Total Bill % Increase 5.4% Revenue Requirement Equating to 25 $1.5 Basis Point Change in ROE
Regulatory lag mitigation measure proposed:
Test period adjusted to recover additional reliability plant additions from January 2013 through December 2013 ($10.4 million of revenue)
* As permitted by Delaware law, Delmarva Power plans to implement an interim rate increase of $2.5 million on June 1, 2013, subject to refund.
Note: See Safe Harbor Statement at the beginning of today’s presentation. 24
|
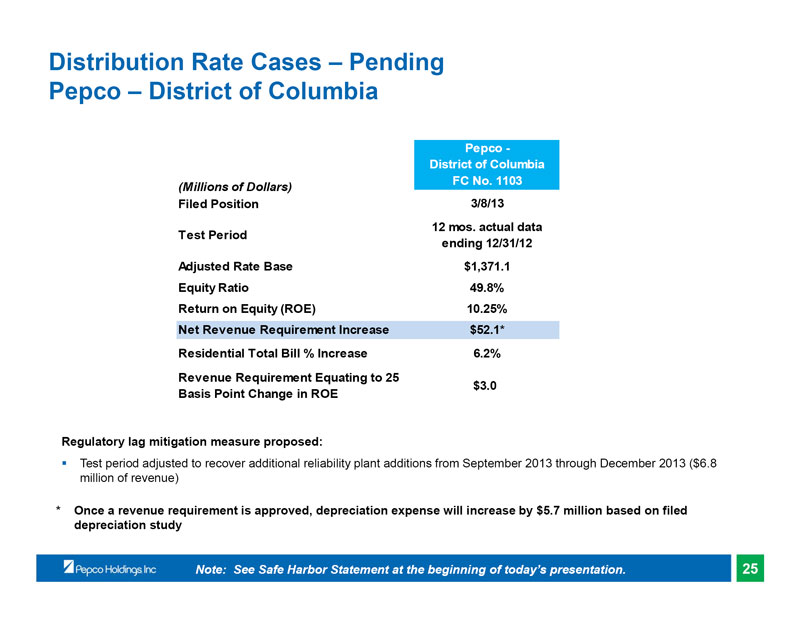 |
Distribution Rate Cases – Pending Pepco – District of Columbia
Pepco - District of Columbia FC No. 1103
(Millions of Dollars)
Filed Position 3/8/13 12 mos. actual data Test Period ending 12/31/12 Adjusted Rate Base $1,371.1 Equity Ratio 49.8% Return on Equity (ROE) 10.25% Net Revenue Requirement Increase $52.1* Residential Total Bill % Increase 6.2% Revenue Requirement Equating to 25 $3.0 Basis Point Change in ROE
Regulatory lag mitigation measure proposed:
Test period adjusted to recover additional reliability plant additions from September 2013 through December 2013 ($6.8 million of revenue)
* Once a revenue requirement is approved, depreciation expense will increase by $5.7 million based on filed depreciation study
Note: See Safe Harbor Statement at the beginning of today’s presentation. 25
|
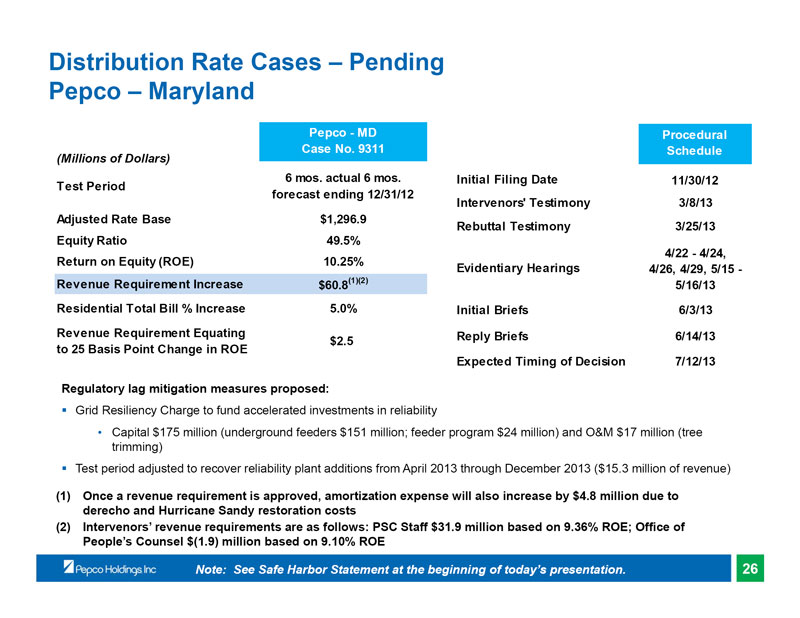 |
Distribution Rate Cases – Pending Pepco – Maryland
Pepco - MD Procedural Case No. 9311 Schedule
(Millions of Dollars)
6 mos. actual 6 mos. Initial Filing Date 11/30/12 Test Period forecast ending 12/31/12 Intervenors’ Testimony 3/8/13 Adjusted Rate Base $1,296.9 Rebuttal Testimony 3/25/13 Equity Ratio 49.5% 4/22 - 4/24, Return on Equity (ROE) 10.25% Evidentiary Hearings 4/26, 4/29, 5/15 - Revenue Requirement Increase $60.8(1)(2) 5/16/13 Residential Total Bill % Increase 5.0% Initial Briefs 6/3/13 Revenue Requirement Equating Reply Briefs 6/14/13 $2.5 to 25 Basis Point Change in ROE
Expected Timing of Decision 7/12/13
Regulatory lag mitigation measures proposed:
Grid Resiliency Charge to fund accelerated investments in reliability
• Capital $175 million (underground feeders $151 million; feeder program $24 million) and O&M $17 million (tree trimming)
Test period adjusted to recover reliability plant additions from April 2013 through December 2013 ($15.3 million of revenue)
(1) Once a revenue requirement is approved, amortization expense will also increase by $4.8 million due to derecho and Hurricane Sandy restoration costs (2) Intervenors’ revenue requirements are as follows: PSC Staff $31.9 million based on 9.36% ROE; Office of People’s Counsel $(1.9) million based on 9.10% ROE
Note: See Safe Harbor Statement at the beginning of today’s presentation. 26
|
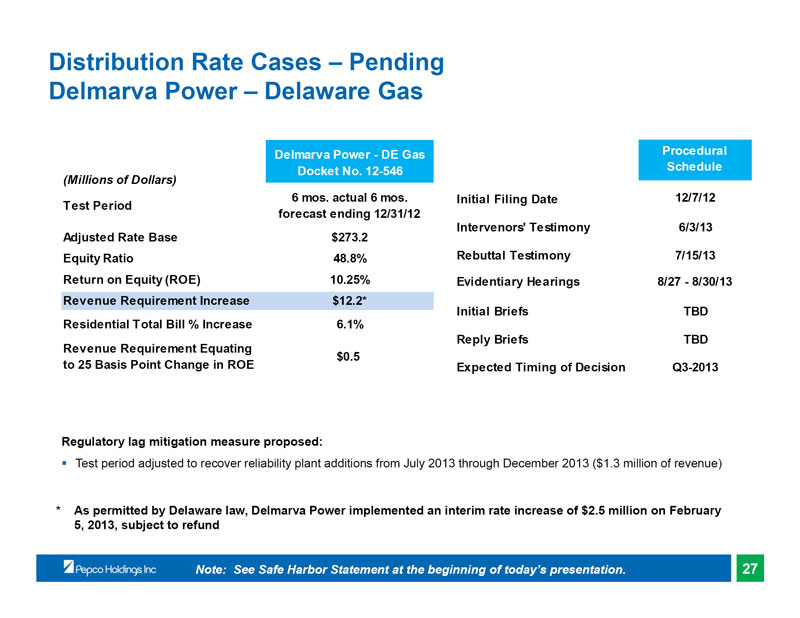 |
Distribution Rate Cases – Pending Delmarva Power – Delaware Gas
Delmarva Power - DE Gas Procedural Docket No. 12-546 Schedule
(Millions of Dollars)
6 mos. actual 6 mos. Initial Filing Date 12/7/12 Test Period forecast ending 12/31/12 Intervenors’ Testimony 6/3/13 Adjusted Rate Base $273.2 Equity Ratio 48.8% Rebuttal Testimony 7/15/13 Return on Equity (ROE) 10.25% Evidentiary Hearings 8/27 - 8/30/13 Revenue Requirement Increase $12.2* Initial Briefs TBD Residential Total Bill % Increase 6.1% Reply Briefs TBD Revenue Requirement Equating $0.5 to 25 Basis Point Change in ROE Expected Timing of Decision Q3-2013
Regulatory lag mitigation measure proposed:
Test period adjusted to recover reliability plant additions from July 2013 through December 2013 ($1.3 million of revenue)
* As permitted by Delaware law, Delmarva Power implemented an interim rate increase of $2.5 million on February 5, 2013, subject to refund
Note: See Safe Harbor Statement at the beginning of today’s presentation. 27
|
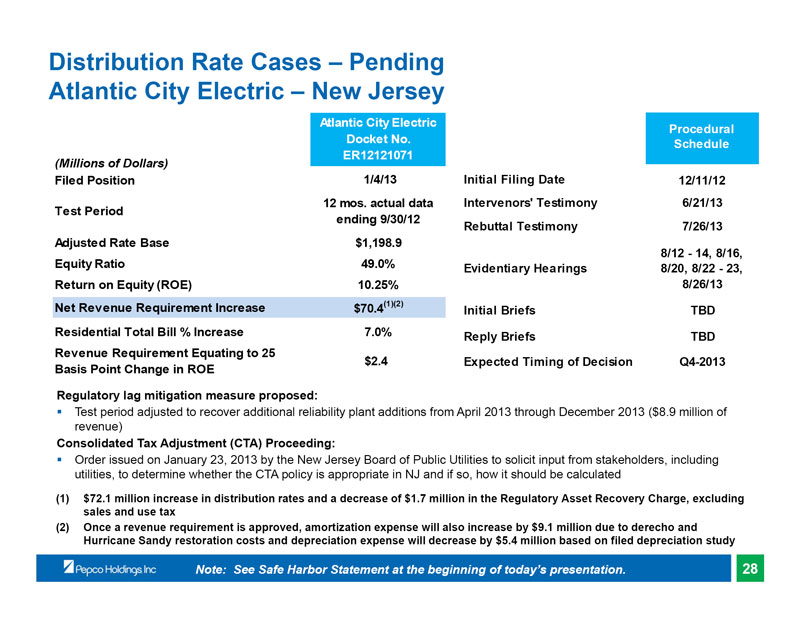 |
Distribution Rate Cases – Pending Atlantic City Electric – New Jersey
Atlantic City Electric
Procedural Docket No. Schedule ER12121071
(Millions of Dollars)
Filed Position 1/4/13 Initial Filing Date 12/11/12 12 mos. actual data Intervenors’ Testimony 6/21/13 Test Period ending 9/30/12 Rebuttal Testimony 7/26/13 Adjusted Rate Base $1,198.9 8/12 - 14, 8/16, Equity Ratio 49.0% Evidentiary Hearings 8/20, 8/22 - 23, Return on Equity (ROE) 10.25% 8/26/13 Net Revenue Requirement Increase $70.4(1)(2) Initial Briefs TBD Residential Total Bill % Increase 7.0% Reply Briefs TBD Revenue Requirement Equating to 25 $2.4 Expected Timing of Decision Q4-2013 Basis Point Change in ROE
Regulatory lag mitigation measure proposed:
Test period adjusted to recover additional reliability plant additions from April 2013 through December 2013 ($8.9 million of revenue)
Consolidated Tax Adjustment (CTA) Proceeding:
Order issued on January 23, 2013 by the New Jersey Board of Public Utilities to solicit input from stakeholders, including utilities, to determine whether the CTA policy is appropriate in NJ and if so, how it should be calculated
(1) $72.1 million increase in distribution rates and a decrease of $1.7 million in the Regulatory Asset Recovery Charge, excluding sales and use tax (2) Once a revenue requirement is approved, amortization expense will also increase by $9.1 million due to derecho and Hurricane Sandy restoration costs and depreciation expense will decrease by $5.4 million based on filed depreciation study
Note: See Safe Harbor Statement at the beginning of today’s presentation. 28
|
 |
MAPP Abandoned Cost Recovery
On February 28, 2013, FERC issued an order concluding that the MAPP project was canceled for reasons beyond the Company’s control and granted recovery of prudently incurred costs
Key elements of the Order:
• Established a hearing to review the prudence of the $87.5 million abandonment costs and the requested 5 year amortization period
• Disallowed the incentive and RTO membership adders, which reduce the project’s ROE from 12.8% to 10.8%
• Denied 50% recovery of the $4 million of costs incurred prior to November 1, 2008 (the date of the MAPP incentive order)
The Company filed a rehearing request on April 1 challenging the disallowance of the ROE adders as well as the denial of 50% of the costs incurred prior to November 1, 2008
In the first quarter 2013, the $2 million of costs that were denied recovery were charged to expense
Note: See Safe Harbor Statement at the beginning of today’s presentation. 29
|