Attached files
| file | filename |
|---|---|
| 8-K - 8-K - HollyFrontier Corp | hfc-form8xkasmpresentation.htm |

Annual Shareholder Meeting May 15, 2013

2

Agenda 3 1. Financial Performance 2. Margin Environment 3. Margin Drivers 4. Total Shareholder Returns 5. Cash Distribution Strategy 6. Strategic Accomplishments

4 2012 Financial Performance $0 $500 $1,000 $1,500 $2,000 2011 2012 $1,023 $1,727 Net Income $0 $1,000 $2,000 $3,000 $4,000 2011 2012 $1,842 $3,097 EBITDA $0 $2 $4 $6 $8 $10 2011 2012 $6.42 $8.38 EPS 2012 EPS +30% vs 2011 2012 Net Income +69% vs 2011 2012 EBITDA +68% vs 2011

5 Margin Environment Margins above 5-year average range for much of 2012 across all of our regions 2012 MidCon 321 Crack Spread 27% above 2011 2012 MidCon 321 Crack Spread $32.59 2011 MidCon 321 Crack Spread $25.67 Source: Macquarie

6 Margin Environment HFC 2012 Reported Consolidated Gross Margin per Barrel 21% Above 2011 Levels HFC Consolidated Refinery Gross Margin per Barrel $24.89 vs 2011 $20.64 Rockies GM/BBL $27.15 vs 2011 25.04, +8% yoy MidCon GM/BBL $23.42 vs 2011 19.59, +20% yoy Southwest GM/BBL $26.92 vs 2011 20.36, +32% yoy

7 Margin Drivers WTI/Brent Spread $17.46 WTI Discount to Brent on average for 2012 Discounted Heavy Crudes $22.31 WCS Discount to WTI on average for 2012 The US is a Net Exporter Of Refined Products Net Product Exports 1.5 million BPD in Dec. 2012 -3000 -2500 -2000 -1500 -1000 -500 0 500 1000 1500 2000 Ja n -20 0 7 M ay -2 00 7 Se p -2 0 0 7 Ja n -20 0 8 M ay -2 00 8 Se p -2 0 0 8 Ja n -20 0 9 M ay -2 00 9 Se p -2 0 0 9 Ja n -20 1 0 M ay -2 01 0 Se p -2 0 1 0 Ja n -20 1 1 M ay -2 01 1 Se p -2 0 1 1 Ja n -20 1 2 M ay -2 01 2 Se p -2 0 1 2 Ja n -20 1 3 Total Petroleum Product Net Exports Th o u sa n d s BP D WTI / Brent Spread Source: Bloomberg, EIA

Total 2012 Shareholder Return 8 HFC Total 2012 Share Price Appreciation 99% Compared to Sector Average 83% 12/30/11 Stock Price $23.40 12/31/12 Stock Price $46.55 HFC Total 2012 Shareholder Return 112% Compared to Sector Average 89% $3.10 per share cash dividends paid in 2012 **HFC split adjusted, MPC return only as of June 24th, 2011. PSX return only as July 20th, 2012, PBF as of Dec 13, 2012 IPO. * FY 2012 calculated off closing prices from 12/30/2011 and 12/31/2012 Full Year 2012 Performance

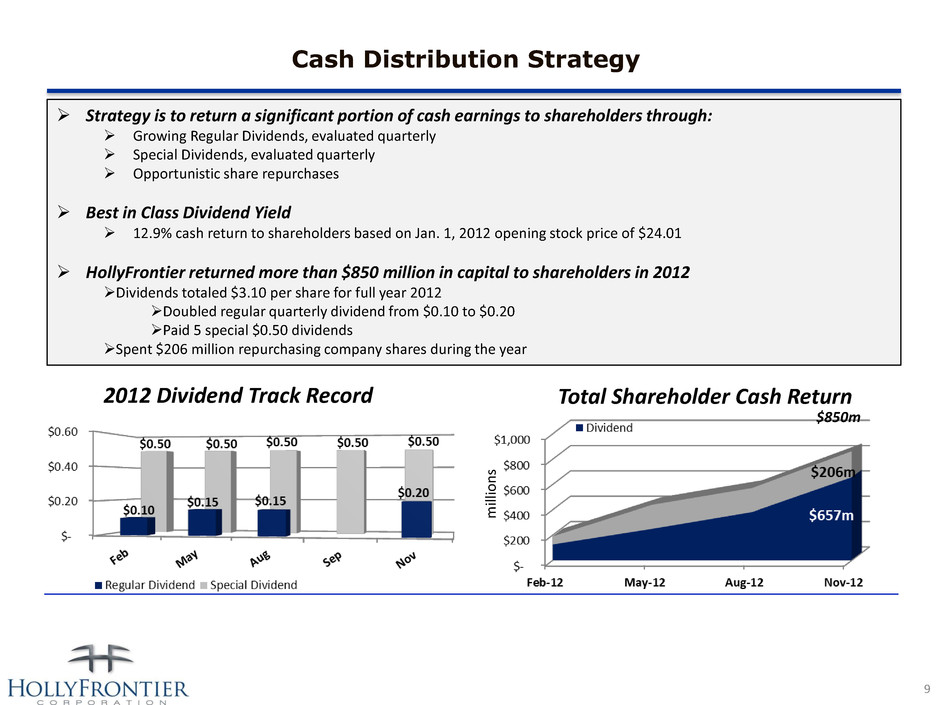
Cash Distribution Strategy 9 milli o n s Strategy is to return a significant portion of cash earnings to shareholders through: Growing Regular Dividends, evaluated quarterly Special Dividends, evaluated quarterly Opportunistic share repurchases Best in Class Dividend Yield 12.9% cash return to shareholders based on Jan. 1, 2012 opening stock price of $24.01 HollyFrontier returned more than $850 million in capital to shareholders in 2012 Dividends totaled $3.10 per share for full year 2012 Doubled regular quarterly dividend from $0.10 to $0.20 Paid 5 special $0.50 dividends Spent $206 million repurchasing company shares during the year 2012 Dividend Track Record $850m Total Shareholder Cash Return

1 0 Goal of Generating High Long-Term Return on Capital Employed 10-year average ROCE of 23% 20-year average ROCE of 15% -5% 5% 15% 25% 35% 45% 55% ROCE 20 Year Average 10 Year Average 10 and 20 year average ROCE calculated by taking the average of ROCE’s for the years 1992-2012. ROCE calculated by dividing net income by the sum of total debt and shareholder capital. For HFC pre-merger, legacy HOC/FTO earnings, debt and equity were combined. FTO legacy financials adjusted for LIFO accounting change in relevant years.

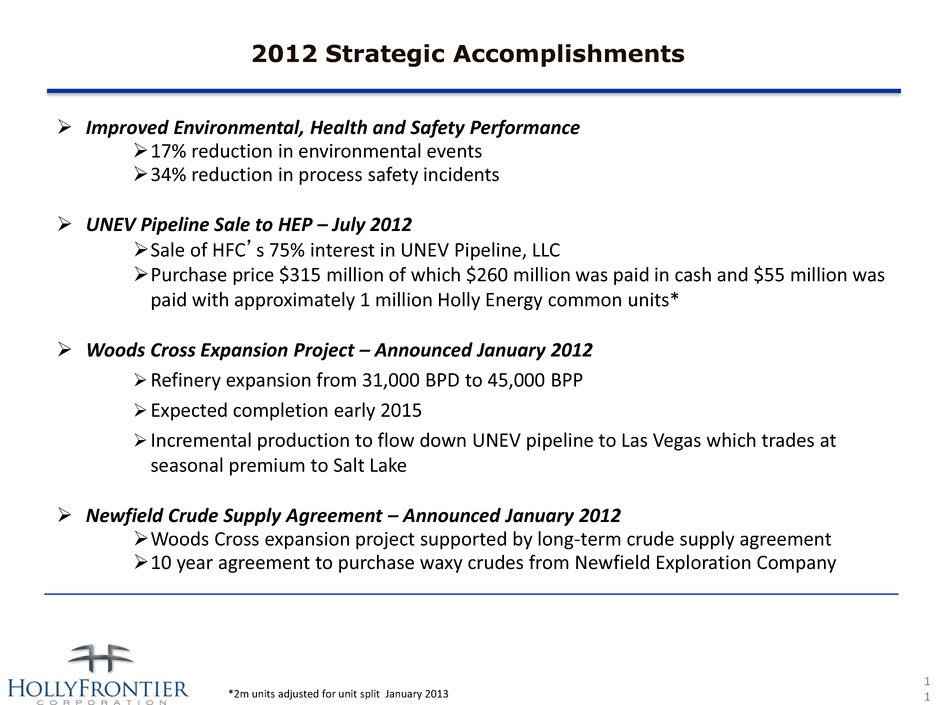
1 1 2012 Strategic Accomplishments Improved Environmental, Health and Safety Performance 17% reduction in environmental events 34% reduction in process safety incidents UNEV Pipeline Sale to HEP – July 2012 Sale of HFC’s 75% interest in UNEV Pipeline, LLC Purchase price $315 million of which $260 million was paid in cash and $55 million was paid with approximately 1 million Holly Energy common units* Woods Cross Expansion Project – Announced January 2012 Refinery expansion from 31,000 BPD to 45,000 BPP Expected completion early 2015 Incremental production to flow down UNEV pipeline to Las Vegas which trades at seasonal premium to Salt Lake Newfield Crude Supply Agreement – Announced January 2012 Woods Cross expansion project supported by long-term crude supply agreement 10 year agreement to purchase waxy crudes from Newfield Exploration Company *2m units adjusted for unit split January 2013
