Attached files
| file | filename |
|---|---|
| 8-K - 2013 GOLDMAN SACHS CONSUMER PRODUCTS SYMPOSIUM - PROCTER & GAMBLE Co | goldmansymposium2013.htm |


The Procter & Gamble Company: Reg G Reconciliation of Non-GAAP measures
In accordance with the SEC’s Regulation G, the following provides definitions of the non-GAAP measures used in Procter & Gamble's May 14, 2013 presentation and associated slides with the reconciliation to the most closely related GAAP measure. The measures provided are as follows:
|
1.
|
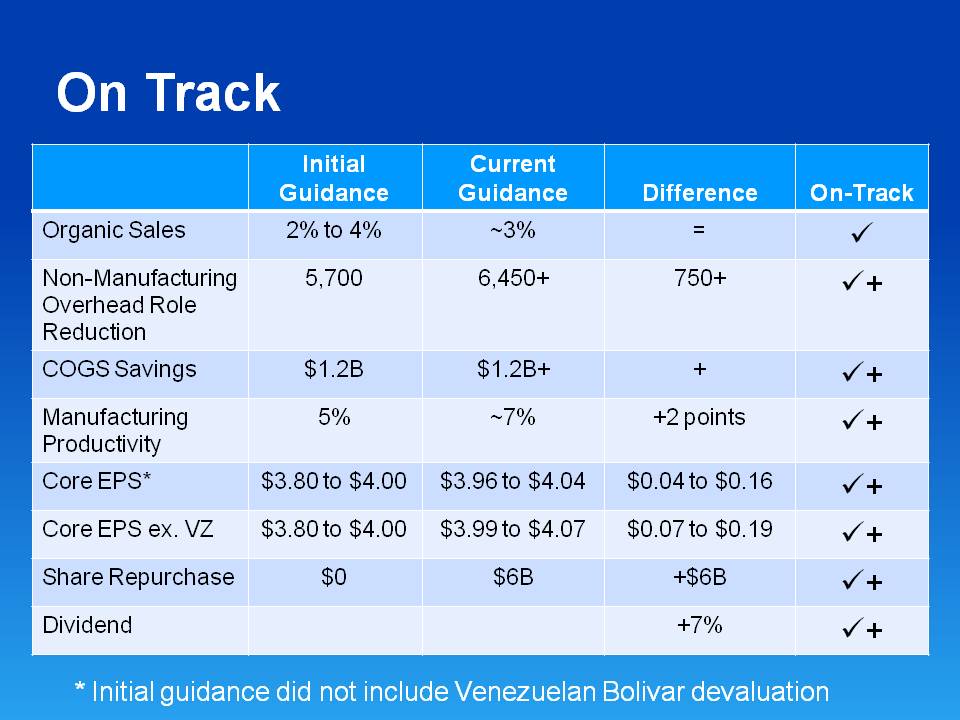
Organic Sales Growth – page 1
|
|
2.
|
Core EPS – pages 1 and 2
|
|
3.
|
Free Cash Flow – page 2
|
|
4.
|
Adjusted Free Cash Flow Productivity – page 2
|
1. Organic Sales Growth:
Organic sales growth is a non-GAAP measure of sales growth excluding the impacts of acquisitions, divestitures and foreign exchange from year-over-year comparisons. We believe this provides investors with a more complete understanding of underlying sales trends by providing sales growth on a consistent basis. Organic sales is also one of the measures used to evaluate senior management and is a factor in determining their at-risk compensation. The reconciliation of reported sales growth to organic sales is as follows:
|
Total P&G
|
Net Sales Growth
|
Foreign Exchange Impact
|
Acquisition/ Divestiture Impact*
|
Organic Sales Growth
|
||||
|
FY 2013 (Estimate)
|
1% to 2%
|
2%
|
0%
|
3% to 4%
|
||||
2. Core EPS: This is a measure of the Company’s diluted net earnings per share from continuing operations excluding certain items that are not judged to be part of the Company’s sustainable results or trends. This includes FY 2013 holding gain on the buyout of our Iberian joint venture partner, FY 2013 and 2012 charges related to incremental restructuring due to increased focus on productivity and cost savings, FY 2013 charge from the balance sheet impact of the Venezuela devaluation, charges in FY 2012 related to European legal matters, and FY 2012 impairment charges for goodwill and indefinite lived intangible assets. We believe the Core EPS measure provides an important perspective of underlying business trends and results and provides a more comparable measure of year-on-year earnings per share growth. Core EPS is also one of the measures used to evaluate senior management and is a factor in determining their at-risk compensation. The tables below provide a reconciliation of diluted net earnings per share to Core EPS:
|
Fiscal Year Data (Current Guidance):
|
FY 2013 (est.)
|
FY 2012
|
||
|
$3.90 to $3.98
|
$3.12
|
|||
|
Impairment Charges
|
-
|
$0.51
|
||
|
Charges for European legal matters
|
-
|
$0.03
|
||
|
Incremental restructuring charges
|
$0.19
|
$0.20
|
||
|
Gain on buyout of Iberian JV
|
($0.21)
|
-
|
||
|
Venezuela balance sheet devaluation impacts
|
$0.08
|
-
|
||
|
Rounding/Other Impacts
|
-
|
($0.01)
|
||
|
Core EPS
|
$3.96 to $4.04
|
$3.85
|
||
|
Core EPS Growth
|
3% to 5%
|
|
Fiscal Year Data (Initial Guidance):
|
FY 2013 (est.)
|
FY 2012
|
||
|
Diluted Net Earnings Per Share - Continuing Operations
|
$3.78 to $4.02
|
$3.12
|
||
|
Impairment Charges
|
-
|
$0.51
|
||
|
Charges for European Legal Matters
|
$0.01
|
$0.03
|
||
|
Incremental Restructuring Charges
|
$0.19 to $0.15
|
$0.20
|
||
|
Gain on buyout of Iberian JV (est.)
|
($0.17)
|
-
|
||
|
Rounding Impacts
|
($0.01)
|
($0.01)
|
||
|
Core EPS
|
$3.80 to $4.00
|
$3.85
|
||
|
Core EPS Growth
|
-1% to 4%
|
3. Free Cash Flow:
Free cash flow is defined as operating cash flow less capital spending. We view free cash flow as an important measure because it is one factor in determining the amount of cash available for dividends and discretionary investment. Free cash flow is also one of the measures used to evaluate senior management and is a factor in determining their at-risk compensation. The reconciliation of free cash flow is provided below (amounts in millions):
|
Operating Cash Flow
|
Capital Spending
|
Free Cash Flow
|
|
|
Jul ‘12-Mar ‘13
|
$10,481
|
($2,426)
|
$8,055
|
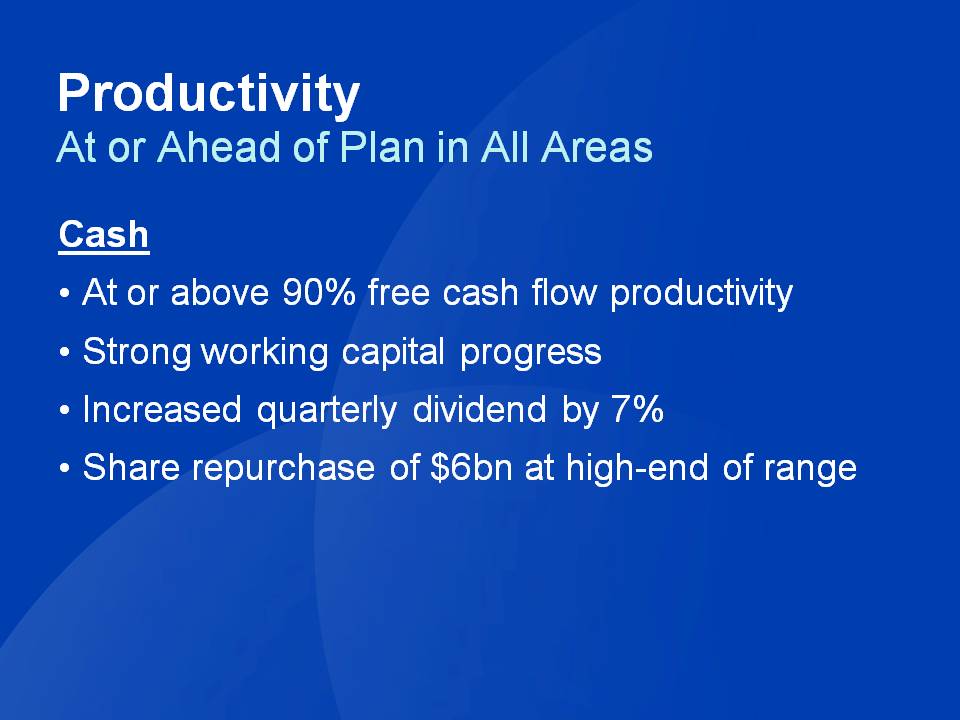
4. Adjusted Free Cash Flow Productivity:
Adjusted free cash flow productivity is defined as the ratio of free cash flow to net earnings excluding the gains from major divestitures and impairment charges. Given the size of these gains and the impairment charges, as well as our view that they are not part of our sustainable results, we have excluded these from our calculation. We believe this provides a better perspective of our underlying liquidity trends. The Company’s long-term target is to generate free cash flow at or above 90 percent of net earnings. We view adjusted free cash flow and adjusted free cash flow productivity as important measures because they are factors in determining the amount of cash available for dividends and discretionary investment. Adjusted free cash flow and adjusted free cash flow productivity are also measures used to evaluate senior management and are factors in determining their at-risk compensation. The reconciliation of adjusted free cash flow productivity is provided below (amounts in millions):
|
Free Cash Flow
|
Net Earnings
|
Divestiture Gain
|
Net Earnings excluding Gain
|
Adjusted Free Cash Flow Productivity
|
|
|
Jul ‘12-Mar ‘13
|
$8,055
|
$9,520
|
$623
|
$8,897
|
91%
|