Attached files
| file | filename |
|---|---|
| 8-K - FORM 8-K - PEABODY ENERGY CORP | btu_8-k20130514.htm |
Exhibit 99.1

Life Empowered
Bank of America - Merrill Lynch Global Metals and Mining Conference
May 15, 2013
Gregory H. Boyce Chairman and Chief Executive Officer
Peabody Energy

Statement on Forward-Looking Information
Peabody Energy
The use of the words “Peabody,” “the company,” “our” and “we” relate to Peabody Energy Corporation, its subsidiaries and majority-owned affiliates. Certain statements in this presentation are forward-looking within the meaning of Section 27A of the Securities Act of 1933 and Section 21E of the Securities Exchange Act of 1934, as amended, and are intended to come within the safe harbor protection provided by those sections. These forward-looking statements are based on numerous assumptions that the company believes are reasonable, but they are open to a wide range of uncertainties and business risks that may cause actual results to differ materially from expectations as of May 14, 2013. These factors are difficult to accurately predict and may be beyond the company's control. The company does not undertake to update its forward-looking statements. Factors that could affect the company's results include, but are not limited to: global supply and demand for coal, including the seaborne thermal and metallurgical coal markets; price volatility, particularly in higher-margin products and in the company's trading and brokerage businesses; impact of alternative energy sources, including natural gas and renewables; global steel demand and the downstream impact on metallurgical coal prices; impact of weather and natural disasters on demand, production and transportation; reductions and/or deferrals of purchases by major customers and ability to renew sales contracts; credit and performance risks associated with customers, suppliers, contract miners, co-shippers, and trading, banks and other financial counterparties; geologic, equipment, permitting, site access and operational risks related to mining; transportation availability, performance and costs; availability, timing of delivery and costs of key supplies, capital equipment or commodities such as diesel fuel, steel, explosives and tires; impact of take-or-pay agreements with rail and port commitments for the delivery of coal; successful implementation of business strategies; negotiation of labor contracts, employee relations and workforce availability; changes in postretirement benefit and pension obligations and funding requirements; replacement and development of coal reserves; availability, access to and related cost of capital and financial markets; effects of changes in interest rates and currency exchange rates (primarily the Australian dollar); effects of acquisitions or divestitures; economic strength and political stability of countries in which the company has operations or serves customers; legislation, regulations and court decisions or other government actions, including, but not limited to, new environmental and mine safety requirements, changes in income tax regulations, sales-related royalties, or other regulatory taxes and changes in derivatives laws and regulations; litigation, including claims not yet asserted; and other risks detailed in the company's reports filed with the Securities and Exchange Commission (SEC).
Included in the company's release of financial information accounted for in accordance with generally accepted accounting principles (GAAP) are certain non-GAAP financial measures, as defined by SEC regulations. The company has defined below the non-GAAP financial measures that are used.
Adjusted EBITDA is defined as (loss) income from continuing operations before deducting net interest expense, income taxes, asset retirement obligation expenses, depreciation, depletion and amortization, asset impairment and mine closure costs and amortization of basis difference associated with equity method investments. Adjusted EBITDA, which is not calculated identically by all companies, is not a substitute for operating income, net income or cash flow as determined in accordance with United States GAAP. Management uses Adjusted EBITDA as a key measure of operating performance and also believes it is a useful indicator of the company's ability to meet debt service and capital expenditure requirements.
05/14/13
2

Peabody Well Positioned for Rising Global Demand and Rebound in U.S. Coal
Peabody Energy
Peabody global asset base and strategy targets success in all market conditions
Leading presence in growing regions: Australia, SPRB and Illinois Basin
Benefitting from cost containment, capital discipline and debt reduction
U.S. generation on pace to recover 75% of lost 2012 demand
SPRB and Illinois Basin utility inventories improved 25% in last year
Pacific Rim markets driving significant met and thermal coal demand growth
China and India expected to import record coal volumes in 2013
3

Peabody: The Only Global Pure-Play Coal Investment
Peabody Energy
The World's Largest Private-Sector Coal Company
28 Active mines in U.S. and Australia
9.3 billion tons of reserves
U.S.: 8.2 billion tons
Australia: 1.1 billion tons
Significant project portfolio
Global trading and business offices
London Essen Ulaanbaatar Urumqi New Delhi Beijing Singapore Balikpapan Jakarta NCIG St. Louis DTA
Note: Active mine count includes 50% equity interest in Middlemount Mine. Reserve information is as reported in 2012 Form 10-K
4

Diverse Revenues and Strong Cost Containment Drive Superior Margins
Peabody Energy
2012 Revenue by Product
Western U.S. Thermal Australian Met Australian Thermal Trading & Brokerage Midwest U.S. Thermal
Global platform provides diverse contributions
Average gross margins ~30% above U.S. peers over past three years
Record 2012 U.S. margins
Leading U.S. platform
#1 position in growth regions of SPRB, ILB
Global Leader in LV PCI
Rising Australia met coal volumes
U.S. peers include ACI, ANR, CNX, CLD, PCX, WLT, ICO, and MEE in years of operation. Peabody gross margin from Mining Operations. #1 position based on total reported sales as of 12/31/2012, including sales sourced from third parties via Trading & Brokerage.
5

Global Coal Markets

Coal Market Demand Rising in 2013 on Higher Steel Production, Generation
Peabody Energy
Forecast global steel production growth of ~3% driving increased need for metallurgical coal
>75 GW of coal generation expected to come on line in 2013
Requires 225 MTPY of coal at full capacity
Coal generation increases YTD from China, India and Europe
Seaborne thermal demand likely to increase ~ 50 million tonnes on growing Asian demand
2013 Expected New Coal-Fueled Generation China 43 GW India 13 GW Other Asia 7 GW Europe 7 GW Other 7 GW
Source: Peabody Global Analytics, World Steel Association. YTD data through March 2013.
7

Seaborne Met Demand Beginning to Recover from Low 2012 Steel Growth
Peabody Energy
9% higher Q1 China steel production driving global growth
Q2 HQHCC benchmark increases to $172/tonne; Low-vol PCI improves spread to 82% of premium
Substantial project deferrals and mine idlings in 2012 as premium price per tonne moved below mid-$200s
Source: Peabody Global Analytics
8

PCI in Growing Demand from Global Steel Producers
Peabody Energy
Steelmakers increasing PCI use to reduce costs, improve margins
Pulverized Coal Injection a replacement for coke made from coking coal
1.1 tonnes of low-vol PCI replaces 1 tonne of coke
Peabody is #1 exporter of low-vol PCI
Majority of high quality low-vol PCI supply from Australia
Seaborne PCI market expected to grow at 8% CAGR through 2017 as premium met coal becomes constrained and new steel mills turn to PCI
Blast Furnace Coke - made from Metallurgical Coal Iron Ore Waste Gases Turbulent - Reaction region Slag Hot Metal
PCI coal is used as an energy source in a blast furnace and does not require the “strength” properties of coke
Source: Peabody Global Analytics
9

China, India Coal Imports Expected to Grow 10% - 15% in 2013
Peabody Energy
China
Coal imports up 30% in Q1
Coal generation up 4%
Q1 7.7% GDP growth exceeds government targets
Urbanization expected to send 15 to 20 million people to cities each year
~250 GW of new coal generation by 2017
China and India Coal Imports (Tonnes in Millions) 0 200 400 600
2012 425 Thermal 343 Met 82 2013P 480 390 90 2017P 655 500 155
India
Coal imports up 25% in Q1
Coal generation up 9%
Domestic coal production below targets; Minister of Coal calling for increased imports
New port projects underway to enable greater imports
~70 GW of new coal generation by 2017
Source: Peabody Global Analytics, China Customs, India Market Watch. Coal generation through first quarter 2013.
10

Global Supply Constraints Expected to Continue
Peabody Energy
U.S. exports expected to decline ~25 million tons in 2013
Strikes hinder mine production in several countries
India domestic production struggling to meet demand as imports rise
Mozambique and Mongolia shipments below targets
Idling or closing of high-cost mines and projects deferred in U.S., Mongolia, China, Australia and Canada
Source: Company filings, industry reports, Peabody Global Analytics.
11
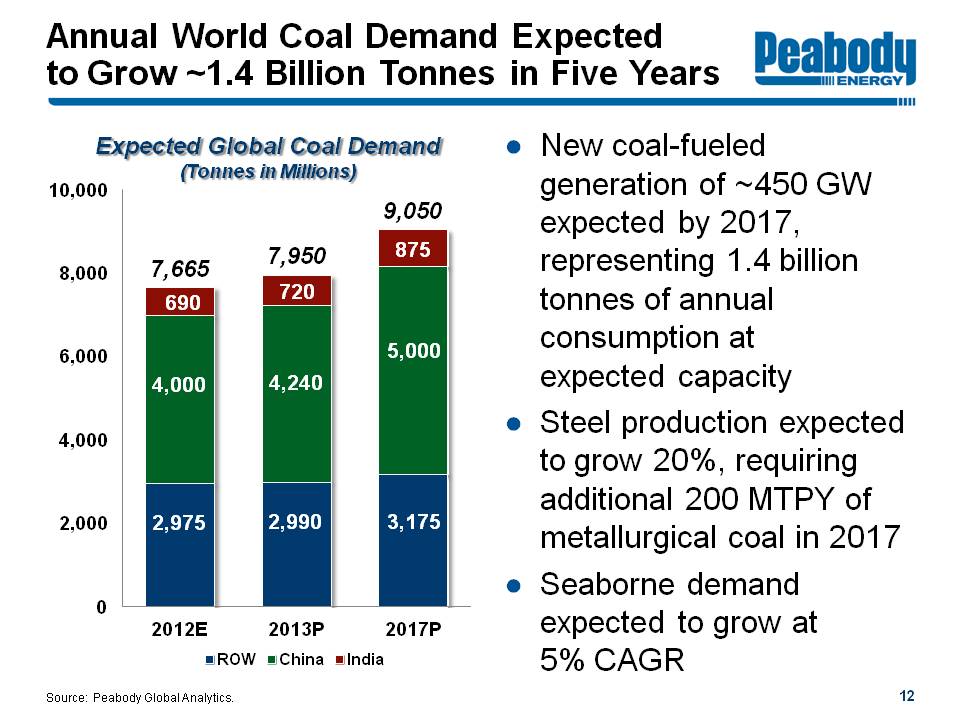
Annual World Coal Demand Expected to Grow ~1.4 Billion Tonnes in Five Years
Peabody Energy
Expected Global Coal Demand (Tonnes in Millions) 0 2,000 4,000 6,000 8,000 10,000
2012E 7,665 ROW 2,975 China 4,000 India 690
2013P 7,950 2,990 4,240 720
2017P 9,050 3,175 5,000 875
New coal-fueled generation of ~450 GW expected by 2017, representing 1.4 billion tonnes of annual consumption at
expected capacity
Steel production expected to grow 20%, requiring additional 200 MTPY of metallurgical coal in 2017
Seaborne demand expected to grow at 5% CAGR
Source: Peabody Global Analytics.
12

Major Market Signals are Positive for U.S. Coal to Rebound in 2013
Peabody Energy
Natural Gas Prices - Nearly Double Prior Year
Natural Gas Generation - Down 14% YTD
Coal Generation - Up 11% YTD
Coal Shipments - Down 7% YTD
SPRB/ILB Inventories - 25% Below Prior-Year Levels
2013 U.S. Coal Demand Expected to Grow 60 - 80 Million Tons
Source: Peabody Global Analytics and Industry Data. SPRB/ILB inventories at generators on a days-burn basis. YTD through April 27, 2013.
13

PRB and Illinois Basin Coal Use Expected to Grow >25% Over Next 5 Years
Peabody Energy
Peabody's Primary Regions: 130 Million Ton Increase Through 2017
Cumulative Generation Changes: 2012 - 2017
(Tons in Millions)
Retirements - Other (40) PRB/ILB (30)
New Generation - Other +5 PRB/ILB +10
Utilization/Basin Switching - Other +30 PRB/ILB +150
Total Demand Change - Other (5) PRB/ILB +130
~60 GW of coal generation to be retired by 2017
~70 million ton impact on demand
PRB and Illinois Basin generation to benefit from new plants, basin switching and higher capacity utilization
Current fleet only running at ~55% utilization
Every 1% utilization change = ~15 million tons of coal
Source: Peabody Global Analytics and SNL Energy.
14
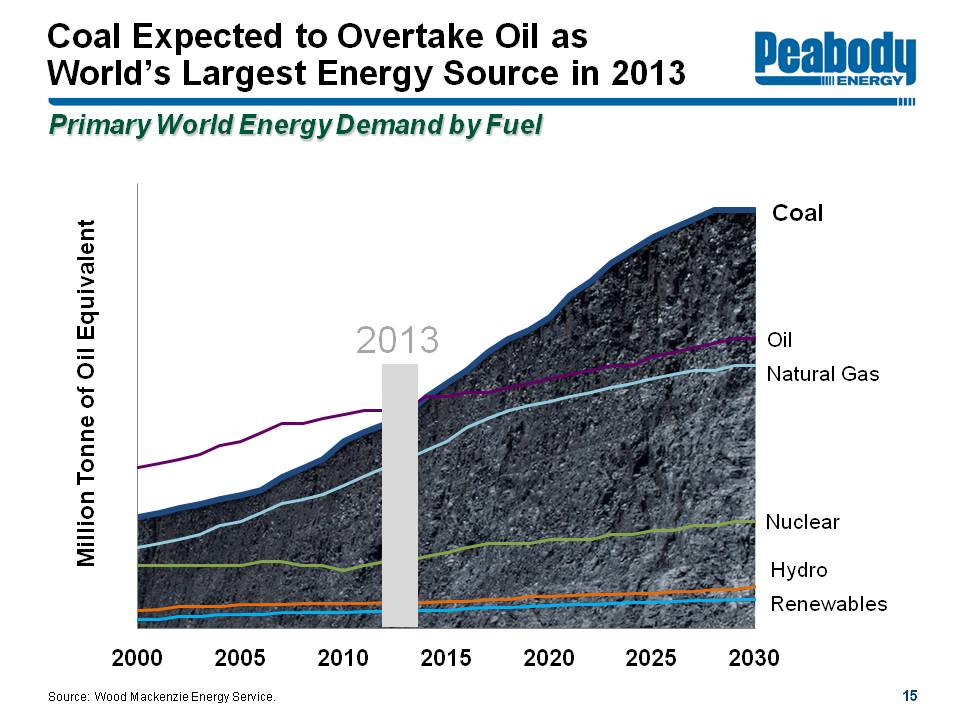
Coal Expected to Overtake Oil as World's Largest Energy Source in 2013
Peabody Energy
Primary World Energy Demand by Fuel
Million Tonne of Oil Equivalent
2000 2005 2010 2013 2015 2020 2025 2030
Coal Oil Natural Gas Nuclear Hydro Renewables
Source: Wood Mackenzie Energy Service
15

Peabody Energy Outlook

Peabody Targeting Four Primary Focus Areas
Peabody Energy
Achieve operational excellence
Reduce costs and improve capital efficiency
Maximize cash flow to continue debt reduction
Position Peabody to benefit during market recovery
17

Cost Containment Initiatives Taking Hold Across the Platform
Peabody Energy
Strong first quarter cost performance
U.S. costs per ton in line with prior year, despite 12% volume reduction
Australia costs per ton declined 10%
SG&A down 8%
Lowered full-year cost per ton targets for U.S. and Australia
Achieving success through multiple initiatives:
Adjusting mining methods, shifting production to lower-cost operations
Reducing overtime and contractor usage, repricing supply contracts
Fully realizing benefits from owner-operator conversions
Paring SG&A costs across the platform
18

U.S. Platform Well Positioned in Current Market
Peabody Energy
Targeting 180 - 190 million tons of production in 2013
Fully priced for 2013; 55% - 65% priced for 2014
Revenues per ton expected to be 5% - 10% below 2012
Expect costs per ton 2% - 3% below 2012
Optimizing operations to maximize margins
Pursuing U.S. coal export opportunities over time
Priced position as of April 18, 2013.
19

Australia Platform Targets Higher Volumes and Productivity Gains
Peabody Energy
Targeting increased metallurgical coal volumes in 2013
Focus on costs and productivity improvements
Target 2013 costs of ~$80 per ton
Key 2013 projects include owner-operator conversions at several operations and installing top coal caving technology at North Goonyella
Targeted Australia Volumes (Tonnes in Millions) 0 10 20 30 40
2005 8 Seaborne Thermal 2 Met 6
2011 25 Domestic Thermal 6 Seaborne Thermal10 Met 9
2012 33 Domestic Thermal 7 Seaborne Thermal 12 Met 14
2013P 33-36 Domestic Thermal 7-8 Seaborne Thermal 11-12 Met 15-16
Source: Sales volumes exclude discontinued operations.
20
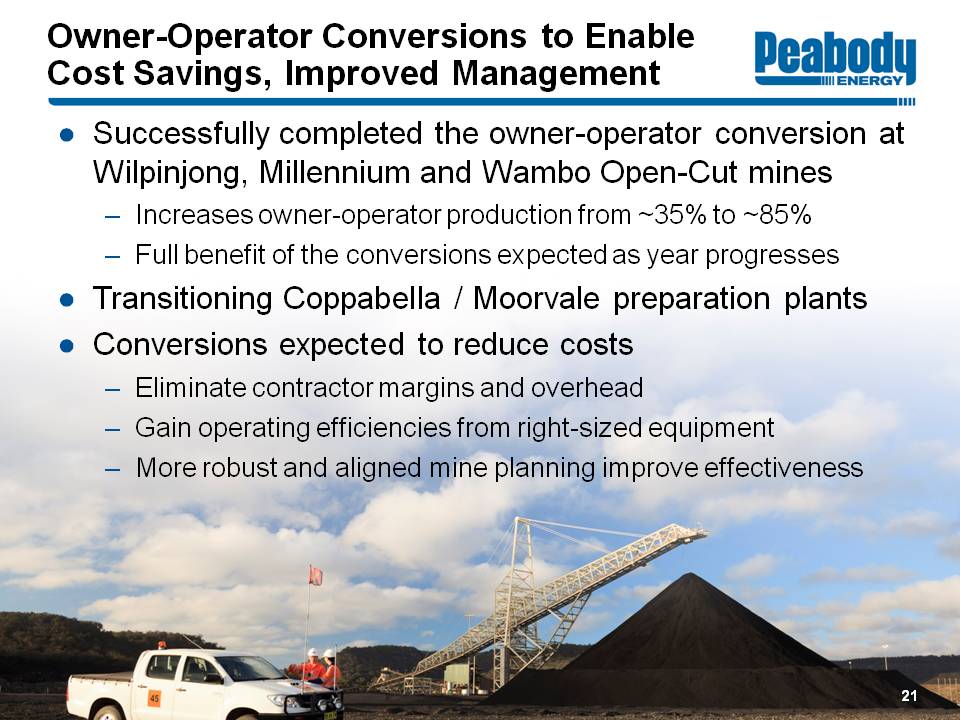
Owner-Operator Conversions to Enable Cost Savings, Improved Management
Peabody Energy
Successfully completed the owner-operator conversion at Wilpinjong, Millennium and Wambo Open-Cut mines
Increases owner-operator production from ~35% to ~85%
Full benefit of the conversions expected as year progresses
Transitioning Coppabella / Moorvale preparation plants
Conversions expected to reduce costs
Eliminate contractor margins and overhead
Gain operating efficiencies from right-sized equipment
More robust and aligned mine planning improve effectiveness
21

Significant Australian Assets Provide Platform for Growth
Peabody Energy
Peabody Australia Platform
$9.6 billion of investments over past decade
Acquisition of RAG, Excel and Macarthur
Greatly expanded capacity of thermal and met coal for seaborne market
Australia segment generated $3.1 billion in Adjusted EBITDA in last three years alone
Significant platform for future development and portfolio optimization
The 2011 Macarthur acquisition greatly adds to Peabody's presence in Australia's Bowen basin - the best source of seaborne met coal in the world. (Acquired licenses shown in tan.)
North Goonyella Mine Millennium Mine Codrilla North Burton West Burton Eaglefield Mine Burton Mine West Walker Cooper Creek Nebo Coppabella Mine Coppabella Moorvale West Moorvale Mine Olive Downs North Olive Downs South Yeerun Codrilla South Amaroo Vermont East Willunga Saraji
22
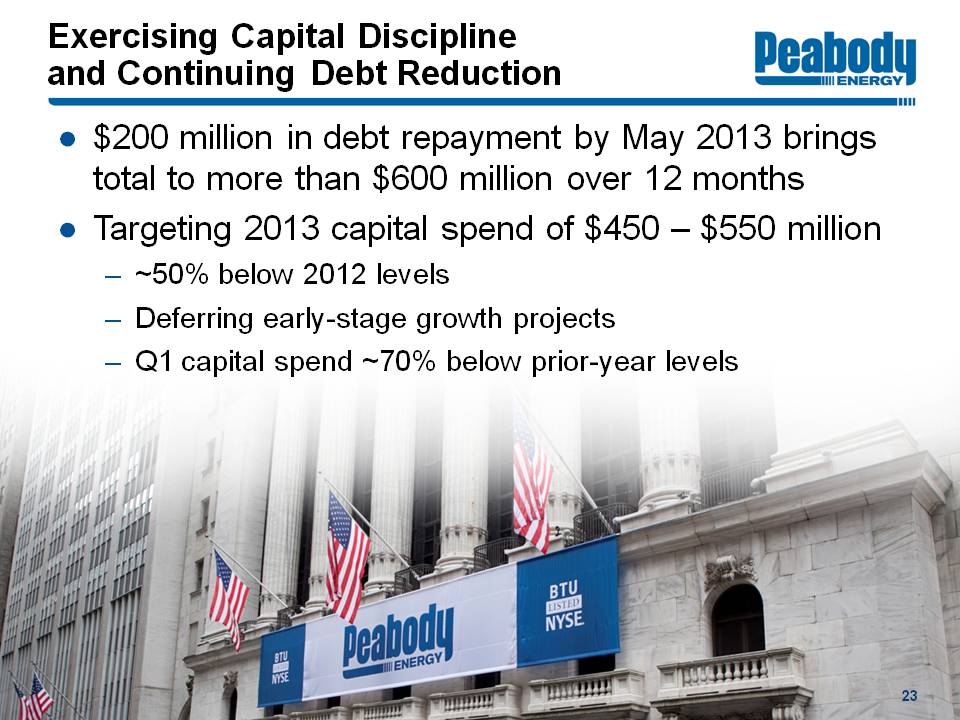
Exercising Capital Discipline and Continuing Debt Reduction
Peabody Energy
$200 million in debt repayment by May 2013 brings total to more than $600 million over 12 months
Targeting 2013 capital spend of $450 - $550 million
~50% below 2012 levels
Deferring early-stage growth projects
Q1 capital spend ~70% below prior-year levels
23

Peabody Platform Shaped to Meet Needs of Changing Markets
Peabody Energy
Rising coal exports from Australia
Leading position in low-cost SPRB and Illinois Basin
Aggressive focus on cost control across platform
Solid operating cash flows, low maintenance capex needs and focus on debt reduction
Managing near-term headwinds; positioned well for market recovery
24

Peabody Energy
www.PeabodyEnergy.com
Peabody Energy
Life Empowered