Attached files
| file | filename |
|---|---|
| 8-K - FORM 8-K - Hi-Crush Inc. | d536377d8k.htm |
| EX-99.1 - EX-99.1 - Hi-Crush Inc. | d536377dex991.htm |
 Investor Presentation
May 2013
Exhibit 99.2 |
 Forward Looking Statements
Some of the information in this news release may contain forward-looking
statements within the meaning of Section 27A of the Securities Act of 1933,
as amended, and Section 21E of the Securities Exchange Act of 1934, as amended (the “Exchange
Act”).
Forward-looking
statements
give
our
current
expectations
and
may
contain
projections
of
results
of
operations
or
of
financial
condition,
or
forecasts
of
future
events.
Words
such
as
“may,”
“assume,”
“forecast,”
“position,”
“predict,”
“strategy,”
“expect,”
“intend,”
“plan,”
“estimate,”
“anticipate,”
“could,”
“believe,”
“project,”
“budget,”
“potential,”
or “continue,”
and similar
expressions are used to identify forward-looking statements. They can be
affected by assumptions used or by known or unknown risks or uncertainties.
Consequently, no forward-looking statements can be guaranteed. When considering these
forward-looking
statements,
you
should
keep
in
mind
the
risk
factors
and
other
cautionary
statements
in
Hi-Crush’s
reports
filed
with the Securities and Exchange Commission (“SEC”), including those
described under Item 1A of Hi-Crush’s Form 10-K for the fiscal
year ended December 31, 2012 and any subsequently filed Form 10-Q. Actual results may vary materially. You are
cautioned not to place undue reliance on any forward-looking statements. You
should also understand that it is not possible to predict
or
identify
all
such
factors
and
should
not
consider
the
risk
factors
in
our
reports
filed
with
the
SEC
or
the
following
list
to
be a complete statement of all potential risks and uncertainties. Factors
that could cause our actual results to differ materially from
the
results
contemplated
by
such
forward-looking
statements
include:
the
volume
of
frac
sand
we
are
able
to
sell;
the
price
at which we are able to sell frac sand; the outcome of any pending litigation;
changes in the price and availability of natural gas or electricity; changes
in prevailing economic conditions; and difficulty collecting receivables. All forward-looking statements are
expressly qualified in their entirety by the foregoing cautionary statements.
Hi-Crush’s forward looking statements speak only as of the date
made and Hi-Crush undertakes no obligation to update or revise its forward-looking statements, whether as a result
of new information, future events or otherwise.
2 |
 Our
Platform for Growth 3
Increasing Northern
White sand usage
Constraints on
supply growth
Increased drilling
and completion
efficiencies
Market favors API
spec, consistently
high quality sand
Lowest-cost producer
53.9 million ton
reserve base with
significant cost
structure advantages
Fixed price /
volume contracts
with 2.9 years
weighted
average life
Tenured
relationships with
customers
Strong Industry
Fundamentals
High Quality
Reserve Base
Industry
Leading Cost
Advantage
Long-Term,
Contracted
Cashflow
State-of-the-art,
efficient and
modern plant
design
Rail logistics
capabilities |
 4
Extensive expertise in
developing sand mining
and processing facilities
Substantial management
ownership incentivized
by distribution growth
Increased volume
Contributions from
sponsor
Organic expansion
Acquisitions
Maximizing Opportunities for Unit Holders
Strong balance
sheet and
contractual cashflow
Cost of capital
advantage via MLP
structure
Experienced
Management
Financial
Flexibility
Multiple
Growth
Opportunities |
 5
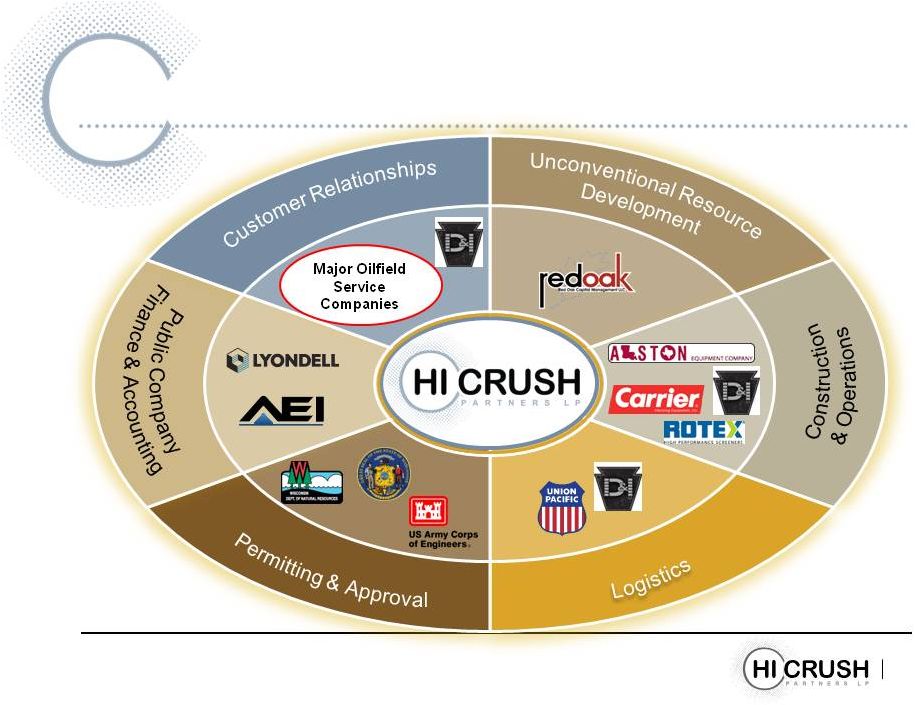
Leveraging Trends
Integration
with Customer
Supply Chain
Increased
Logistics
Capabilities
Dynamics of market continue to change
Premium white sand continues to gain share of proppant market
Flexibility and scale to meet customer volume and timing needs
Proppant
providers
must
be
able
to
“spec-in”
immediately
Barriers to entry continue to expand
Industry is ripe for consolidation |
 Platform for the Future
6
Long-Term,
Contracted
Cashflow
High Quality
Reserve Base
Strong
Industry
Fundamentals
Industry
Leading Cost
Advantage
Multiple
Growth
Opportunities
Experienced
Management
Financial
Flexibility
Integration
with Customer
Supply Chain
Increased
Logistics
Capabilities |
 Transaction Summary
7
•
Exercised accordian
•
Transaction expected to
close in Q2 2013
•
Key management joins
Hi-Crush team
D&I has strong balance sheet, no
debt (post close), maintenance
capital spending of $2M/year
D&I earns 85% of its revenue from
frac sand sales
2008 D&I operating income of
negative $279K; 2012 D&I operating
income of $18.7M
2008 D&I revenue of $2.8M; 2012
D&I revenue of $105.3M
Considerations
•
$125M purchase price
•
$95M cash
•
1.579M units priced at
$19/unit |
 8
Integrated Model, Flexibility of MLP Structure
Expected DPU Impact for HCLP Unit Holders
Preliminary View
Minimal costs to integrate operations;
forecast $2M in G&A, $2M in
maintenance capex/year
Accretive in early years
Expected to raise distribution paid for
Q4 2013 on anticipated Q2 2013 close
Initiating 2014 distribution guidance of
low double digit growth over 2013
Two operating segments for
accounting purposes
10-12%
increase
$0.475
Q3 2013
Q4 2013
2014 |
 Expands Market Share
Enhances Logistics Capabilities
Achieves Broad Synergies
Leverages Value-added Services
Compelling Growth for HCLP Unit Holders
Transaction Delivers Benefits, Creates Value
9
•
Deepens existing relationships and adds new customers
•
Operates largest distribution network in Marcellus & Utica
•
Creates more robust platform for products; adds additional rail expertise
•
Increases sales and margins; expands network into other basins
•
Flexibility in pricing model; in-basin system |
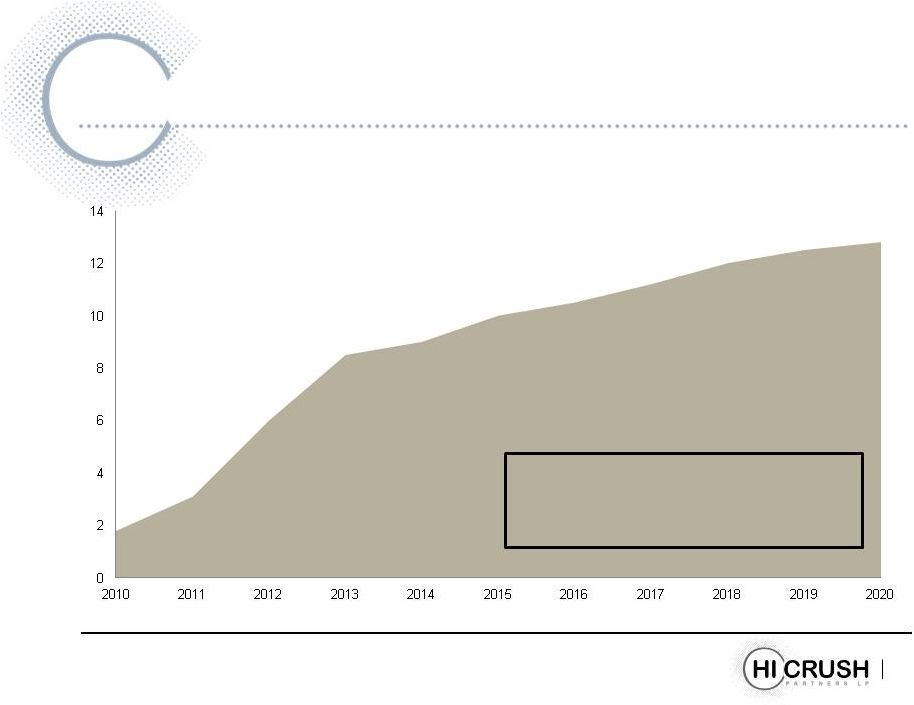
 Rapid Growth in Demand for Raw Sand
Proppant Consumed by Volume
Source: The Freedonia Group, March 1, 2012
Raw sand projected to increase as a percentage of proppant market, averaging at
least 75% by volume 10
4.6
16.7
23.8
31.5
1.5
0.0
5.0
10.0
15.0
20.0
25.0
30.0
35.0
40.0
45.0
2001
2006
2011
2016
2021
Raw Frac Sand
Resin-Coated Sand
Ceramics
Other
Million Tons
2.1
6.3
21.7
30.7
40.2
$34
$82
$68
$54
$40
Raw Frac Sand Price |
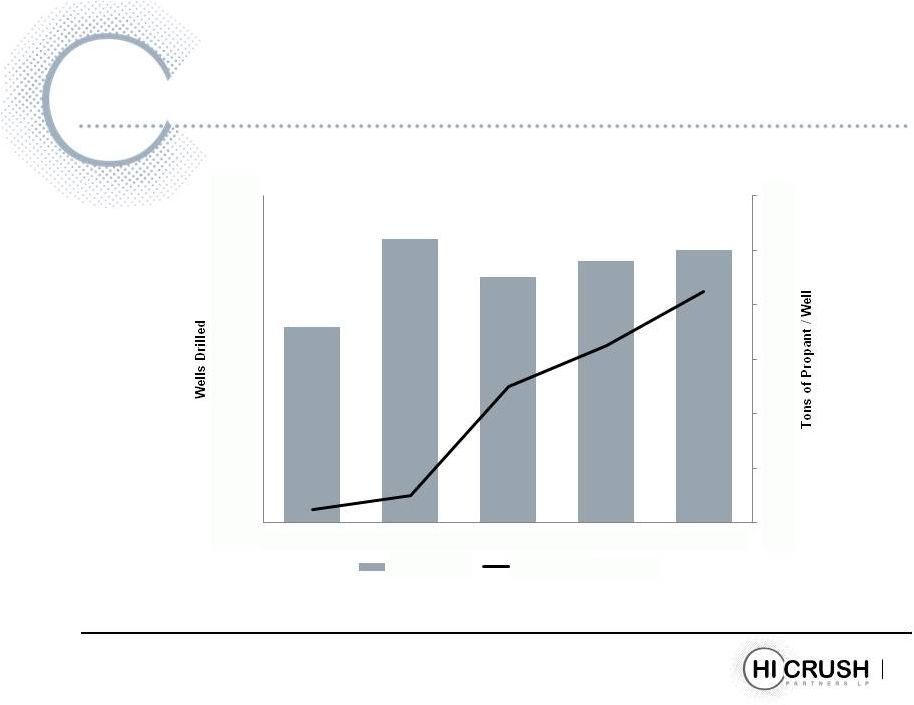 11
Increase in Proppant Intensity
Source: The Freedonia Group.
0
200
400
600
800
1000
1200
0
10,000
20,000
30,000
40,000
50,000
60,000
2001
2006
2011
2016E
2021E
Wells Drilled
Tons of Proppant / Well |
 Marcellus Production Doubles 2011-2015
12
Bcf/d
Source: Wood Mackenzie (December 2012)
D&I has 3x as many distribution
outlets in Marcellus as closest
competitor |
 Utica Permitting Accelerates
Source: Ohio Department of Natural Resources
13
D&I has 2x as many terminals in
Utica as closest competitor |
 Logistics Flexibility Critical
14
Shale Basins
Current Shale Plays
Prospective Shale Plays
Sandstone
Formations
Access to all major US oil
and gas basins
Shipping to all major US
shale plays
Direct loading of unit trains
Collaborative relationship
with Union Pacific
Augusta Facility
Wyeville Facility |
 Expanding Our Logistics Reach
15
Augusta Facility
Wyeville Facility
Sandstone
Formations
Eleven destination terminals across
Marcellus & Utica
Network of 5 Midwest origin
transload terminals, serviced by rail
Attractive long-term supply
agreement
Links supply with nearby terminal
facilities
Relationships with multiple
railroads
Shale Basins
Current Shale Plays
Prospective Shale Plays
D&I Facilities |
 Further Improve Customer Service
16
Delivery Choice
•
FOB plant, FOB destination
High Quality Sand
•
Best quality delivered where, when
and how customer wants it
Superior Value
•
Best price for quality from lowest-
cost producer
Focused Execution
•
Links suppliers with low-cost, high-
service logistics system
Flexible,
Integrated
Supplier of
Choice |
 Confidence in Ability to Execute
17
Clear
benefits
for
both
companies’
customers
•
Hi-Crush leader in low-cost production operations
•
D&I market leader in customer service and
distribution
Improved platform for solutions
•
Complementary customer networks and high
quality sand open door for new business
Management experience integrating and improving
operations, achieving and exceeding targets
•
Supply chain management
•
Inventory consolidation
•
Billing and back office operations
2013-14
Preliminary Outlook
$M
Operating Income Increase
Cost to Integrate |
 18
Stronger Together |
 Transaction Creates Substantial Unit Holder Value
•
Access to biggest distribution network in Marcellus & Utica
Enhances Long-Term Revenue Growth and Margin Potential
•
More robust platform for products, replication across system
Achieves Broad Synergies
•
Rail expertise, increases sales and margins
Forges Clear Path to Grow Distributions
•
Compelling growth for HCLP unit holders
Continue To Have A Strong Balance Sheet
•
Conservative coverage, distribution growth
Transaction Summary
19 |
 Multiple Future Opportunities
20
Contracting Wyeville capacity,
spot sales
Future contributions from
Augusta and sponsor-level
projects in development
Sponsor owns or has options
on additional acres of
undeveloped land
Industry ripe for consolidation
of small, private sand
companies
Incremental
Volume
Contributions
Organic
Expansion
M&A |
 21
First Quarter 2013 |
 Effective April 1 through December 31, 2013
•
Reduced price at Wyeville and Augusta facilities
Weighted average price for tons sold under long-term contracts will be
reduced less than 10% in 2013
•
Transfer 150,000 TPY from Augusta to Wyeville in Q2
•
Transfer additional 150,000 TPY from Augusta to Wyeville beginning in Q3
Amendment contains pricing mechanism to charge a premium each month if
required monthly volumes not taken
Strengthens and protects long-term relationship
Customer Contract Amendment
22 |
 First Quarter Summary
23
Three Months
Three Months
Ended
Ended
March 31, 2013
March 31, 2012
Successor
Predecessor
Revenues
$
19,628
$
13,532
Cost of goods sold (including depreciation and depletion)
5,782
4,776
Gross profit
13,846
8,756
Operating costs and expenses:
General and administrative
2,719
1,487
Exploration expense
1
199
Accretion of asset retirement obligation
29
6
Income from operations
11,097
7,064
Other (income) expense:
Other income
-
-
Interest expense
314
928
Net income
$
10,783
$
6,136
Earnings per unit:
Common
units
–
basic
and
diluted
$
0.40
Subordinated
units
–
basic
and
diluted
$
0.40
Weighted average limited partner units outstanding:
13,644,094
13,640,351
Common
units
–
basic
and
diluted
Subordinated
units
–
basic
and
diluted |
 First Quarter Summary
24
Three Months
Three Months
Ended
Ended
March 31, 2013
March 31, 2012
Successor
Predecessor
Reconciliation of distributable cash flow to net income:
Net income
$
10,783
$
6,136
Depreciation and depletion expense
273
179
Income tax expense
-
-
Interest expense
314
928
EBITDA
$
11,370
$
7,243
Less: Cash interest paid
(255)
Less: Maintenance and replacement capital
expenditures, including accrual for reserve
replacement (1)
(422)
Add: Accretion of asset retirement obligation
29
Add: Quarterly distribution from preferred interest in
Augusta
(2)
3,750
Distributable cash flow
$
14,472
(1) Maintenance and replacement capital expenditures, including accrual for reserve
replacement, were determined based on an estimated reserve replacement cost of $1.35 per ton
sold during the period. Such expenditures include those associated with the replacement of equipment and sand reserves,
to the extent that such expenditures are made to maintain our long-term operating capacity.
The amount presented does not represent an actual reserve account or requirement to spend the
capital. (2) The
amount pertains to the first quarter performance of Augusta, on which we are entitled to receive a preferred distribution of $3,750. We have included
this amount in our distributable cash flow for the first quarter of 2013 as we received this
distribution on May 10, 2013, in advance of our first quarter 2013 cash distributions to our
common and subordinated unitholders, which will be paid on May 15, 2013. The amount is not reflected in our GAAP net income
because our investment in Augusta is accounted for under the cost method. In accordance with
that method, any distributions earned under our preferred interest are not recognized as
income until the cash is actually received by the Partnership. |
 Production Costs per Ton Sold
25
Hi-Crush Partners LP
Production Cost per ton
Fiscal Quarter:
3Q 2011
4Q 2011
1Q 2012
2Q 2012
3Q 2012
4Q 2012
1Q 2013
Predecessor
Successor
Combined
Sand Sold (tons)
126,036
206,557
222,658
316,599
186,957
191,446
378,403
248,158
312,730
Production costs ($ in thousands)
$ 2,192
$ 3,806
$ 4,597
$ 5,006
$ 2,644
$ 2,437
$ 5,081
$ 3,845
$ 5,509
Production costs per ton
$ 17.39
$ 18.43
$ 20.65
$ 15.81
$ 14.14
$ 12.73
$ 13.43
$ 15.49
$ 17.62
9 months
ended
12 months
ended
3 months
ended
6 months
ended
12 months
ended
12 months
ended
Year-To-Date:
9/30/2011
12/31/2011
3/31/2012
6/30/2012
9/30/2012
12/31/2012
3/31/2013
Predecessor
Successor
Combined
Sand Sold (tons)
126,036
332,593
222,658
539,257
726,214
191,446
917,660
1,165,818
1,255,890
Production costs ($ in thousands)
$ 2,192
$ 5,998
$ 4,597
$ 9,603
$ 12,247
$ 2,437
$ 14,684
$ 18,529
$ 19,441
Production costs per ton
$ 17.39
$ 18.03
$ 20.65
$ 17.81
$ 16.86
$ 12.73
$ 16.00
$ 15.89
$ 15.48
9 months ended |
 Production Costs –
Non-GAAP Reconciliation
26
Hi-Crush Partners LP
GAAP Reconciliation of Production Costs to Cost of Goods Sold
Fiscal Quarter:
3Q 2011
4Q 2011
1Q 2012
2Q 2012
4Q 2012
1Q 2013
(Amounts in thousands)
Predecessor
Successor
Combined
Cost of goods sold
$ 2,498
$ 3,949
$ 4,776
$ 5,495
$ 3,065
$ 2,832
$ 5,897
$ 4,313
$ 5,782
Depreciation and depletion
(306)
(143)
(179)
(489)
(421)
(395)
(816)
(468)
(273)
Production costs
$ 2,192
$ 3,806
$ 4,597
$ 5,006
$ 2,644
$ 2,437
$ 5,081
$ 3,845
$ 5,509
3Q 2012 |
 Appendix |
 28
Corporate Structure
Avista Capital Partners
and Co-Investors
Management
Augusta
Facility
41.7% Common
LP
Operating Subsidiaries
(including Wyeville facility, D&I)
Public Unitholders
2.2% Common LP
12.1% Convertible Class B Units
44.0% Subordinated LP
Incentive Distribution Rights
39% Ownership
61% Ownership
Hi-Crush
Partners LP
(the Partnership)
Hi-Crush Proppants LLC
(Sponsor)
Hi-Crush GP LLC
(the General Partner)
Non-Economic
GP Interest
100% Ownership
100% Ownership
28
Undeveloped
Acreage
Preferred Interest in Augusta
($3.75 million expected quarterly
distributions) |
 Wyeville: Our Foundation Asset
29
651 acres
High
quality
“Northern
White”
sand
•
Extensive coring program with third party
frac-specialized lab testing (StimLab and
PropTester)
53.9 million tons of proven recoverable reserves
•
Implied 37-year reserve life
On-site rail facilities accommodate unit trains (80+
cars) for superior logistics
Current plant output capacity of 1.6 million tons per
year
Modern Wet Plant
Access to Rail Line
Large, Contiguous
Deposit
Dry Plant Silos
Asset Overview
Overview |
 Augusta: Growth Vehicle
30
Newly built facility completed in July 2012 on
approximately 1,000 acres
High quality Northern White sand
46.2 million tons of coarse grade sand
Efficient logistics capabilities with on-site
processing plant and rail
1.6 million tons per year capacity
Strong long-term take-or-pay contract profile with
investment grade customer base
Preferred interest in Augusta facility
•
Up to $3.75 million quarterly distributions
•
Convert to 20% common ownership in
Augusta if certain distribution thresholds
or other conditions are met
•
Waiver of assignment of customer
contract from Wyeville to Augusta
Augusta Asset Overview
Dry Plant
Rail Loadout
Wet Plant
Conveyor
Belt
Conveyor Belt Connecting Plants
On-Site Rail Logistics
Dry Plant and Rail
Loadout Storage Silos
Large, Contiguous Deposit |