Attached files
| file | filename |
|---|---|
| 8-K - 8-K - EP Energy LLC | a13-12381_18k.htm |
Exhibit 99.1
|
|
EPE Graphic.pngEP Energy Citi 2013 Global Energy and Utilities Conference Dane Whitehead Executive Vice President and Chief Financial Officer May 14, 2013 |
|
|
2 EP Energy Cautionary Statement Regarding Forward-Looking Statements This presentation includes certain forward-looking statements and projections of EP Energy LLC (“EP Energy”). EP Energy has made every reasonable effort to ensure that the information and assumptions on which these statements and projections are based are current, reasonable, and complete. However, a variety of factors could cause actual results to differ materially from the projections, anticipated results or other expectations expressed, including, without limitation, the supply and demand for oil, natural gas and NGLs; EP Energy’s ability to meet production volume targets; the uncertainty of estimating proved reserves and unproved resources; the future level of service and capital costs; the availability and cost of financing to fund future exploration and production operations; the success of drilling programs with regard to proved undeveloped reserves and unproved resources; EP Energy’s ability to comply with the covenants in various financing documents; EP Energy’s ability to obtain necessary governmental approvals for proposed E&P projects and to successfully construct and operate such projects; actions by the credit rating agencies; credit and performance risk of EP Energy’s lenders, trading counterparties, customers, vendors and suppliers; changes in commodity prices and basis differentials for oil and natural gas; general economic and weather conditions in geographic regions or markets served by EP Energy, or where operations of EP Energy are located, including the risk of a global recession and negative impact on oil and natural gas demand; the uncertainties associated with governmental regulation, including any potential changes in federal and state tax laws and regulation; political and currency risks associated with international operations of EP Energy; competition; and other factors described in EP Energy’s Securities and Exchange Commission filings. While EP Energy makes these statements and projections in good faith, neither EP Energy nor its management can guarantee that anticipated future results will be achieved. Reference must be made to those filings for additional important factors that may affect actual results. EP Energy assumes no obligation to publicly update or revise any forward-looking statements made herein or any other forward-looking statements made by EP Energy, whether as a result of new information, future events, or otherwise. Certain of the production information in this presentation includes the production attributable to EP Energy’s 48.8 percent interest in Four Star Oil and Gas Company (“Four Star”). In addition, the proved reserves attributable to its interest in Four Star represent estimates prepared by EP Energy and not those of Four Star. This presentation presents certain production and reserves-related information on an "equivalency" basis. Equivalent volumes are computed with natural gas converted to barrels at a ratio of six Mcf to one Bbl. These conversions are based on energy equivalency conversion methods primarily applicable at the burner tip and do not represent value equivalencies at the wellhead. Although these conversion factors are industry accepted norms, they are not reflective of price or market value differentials between product types. This presentation refers to the non-GAAP term EBITDAX, which the company defines as net income plus interest and debt expense, income taxes and depreciation, depletion and amortization and exploration expenses. |
|
|
3 EP Energy Purpose: What We Do At EP Energy, we have a passion for finding and producing the oil and natural gas that enriches people's lives |
|
|
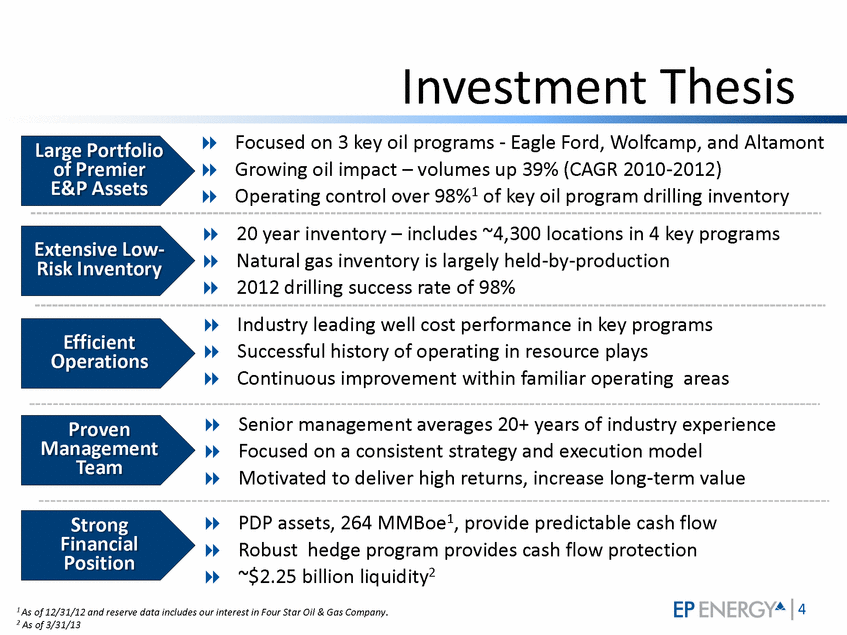
4 EP Energy Investment Thesis .Focused on 3 key oil programs - Eagle Ford, Wolfcamp, and Altamont .Growing oil impact – volumes up 39% (CAGR 2010-2012) .Operating control over 98%1 of key oil program drilling inventory .20 year inventory – includes ~4,300 locations in 4 key programs .Natural gas inventory is largely held-by-production .2012 drilling success rate of 98% 1 As of 12/31/12 and reserve data includes our interest in Four Star Oil & Gas Company. 2 As of 3/31/13 Large Portfolio of Premier E&P Assets .Industry leading well cost performance in key programs .Successful history of operating in resource plays .Continuous improvement within familiar operating areas .PDP assets, 264 MMBoe1, provide predictable cash flow .Robust hedge program provides cash flow protection .~$2.25 billion liquidity2 .Senior management averages 20+ years of industry experience .Focused on a consistent strategy and execution model .Motivated to deliver high returns, increase long-term value Strong Financial Position Proven Management Team Extensive Low- Risk Inventory Efficient Operations |
|
|
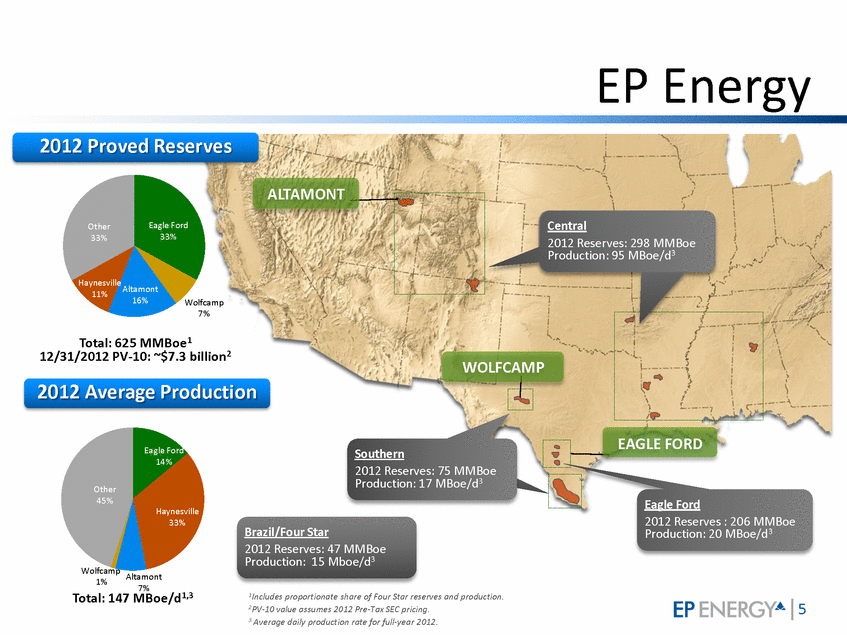
5 EP Energy EAGLE FORD ALTAMONT WOLFCAMP Central 2012 Reserves: 298 MMBoe Production: 95 MBoe/d3 Southern 2012 Reserves: 75 MMBoe Production: 17 MBoe/d3 Brazil/Four Star 2012 Reserves: 47 MMBoe Production: 15 Mboe/d3 Eagle Ford 2012 Reserves : 206 MMBoe Production: 20 MBoe/d3 2012 Proved Reserves Total: 625 MMBoe1 12/31/2012 PV-10: ~$7.3 billion2 Total: 147 MBoe/d1,3 2012 Average Production Altamont 16% Eagle Ford 33% Wolfcamp 7% Other 33% Other 45% Eagle Ford 14% Haynesville 33% Altamont 7% Wolfcamp 1% Haynesville 11% 1Includes proportionate share of Four Star reserves and production. 2PV-10 value assumes 2012 Pre-Tax SEC pricing. 3 Average daily production rate for full-year 2012. |
|
|
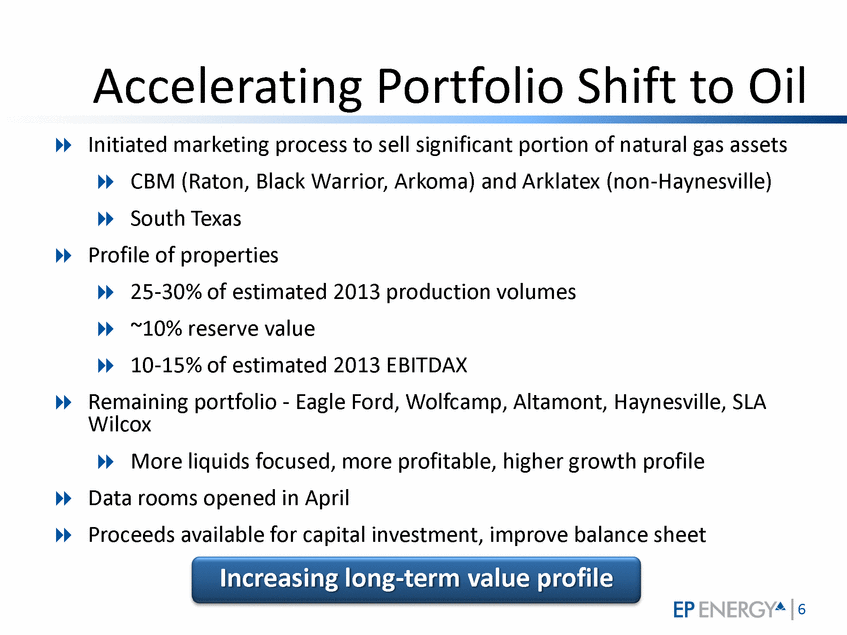
6 EP Energy Accelerating Portfolio Shift to Oil Increasing long-term value profile .Initiated marketing process to sell significant portion of natural gas assets .CBM (Raton, Black Warrior, Arkoma) and Arklatex (non-Haynesville) .South Texas .Profile of properties .25-30% of estimated 2013 production volumes .~10% reserve value .10-15% of estimated 2013 EBITDAX .Remaining portfolio - Eagle Ford, Wolfcamp, Altamont, Haynesville, SLA Wilcox .More liquids focused, more profitable, higher growth profile .Data rooms opened in April .Proceeds available for capital investment, improve balance sheet |
|
|
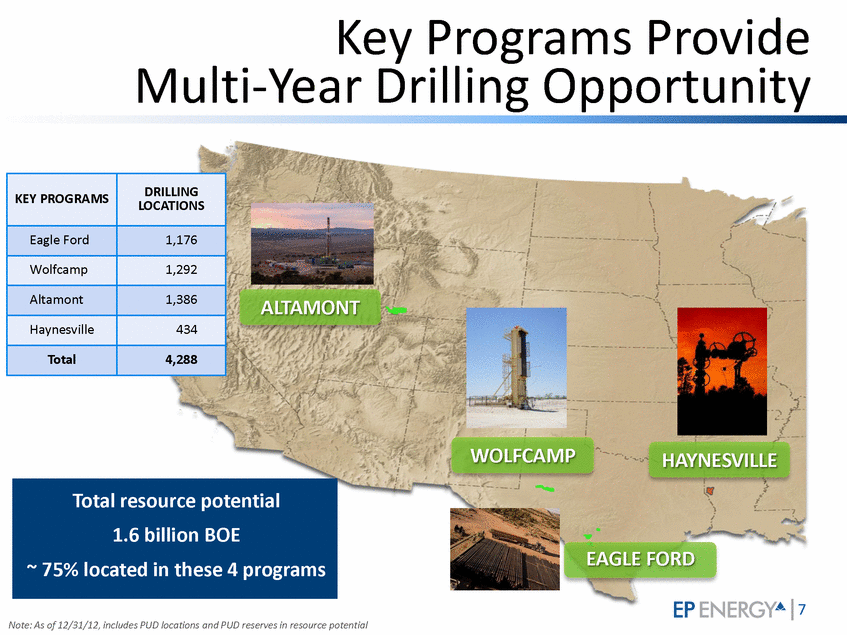
7 EP Energy Key Programs Provide Multi-Year Drilling Opportunity Note: As of 12/31/12, includes PUD locations and PUD reserves in resource potential KEY PROGRAMS DRILLING LOCATIONS Eagle Ford 1,176 Wolfcamp 1,292 Altamont 1,386 Haynesville 434 Total 4,288 Altamont Eagle Ford ALTAMONT WOLFCAMP EAGLE FORD HAYNESVILLE Haynesville Total resource potential 1.6 billion BOE ~ 75% located in these 4 programs |
|
|
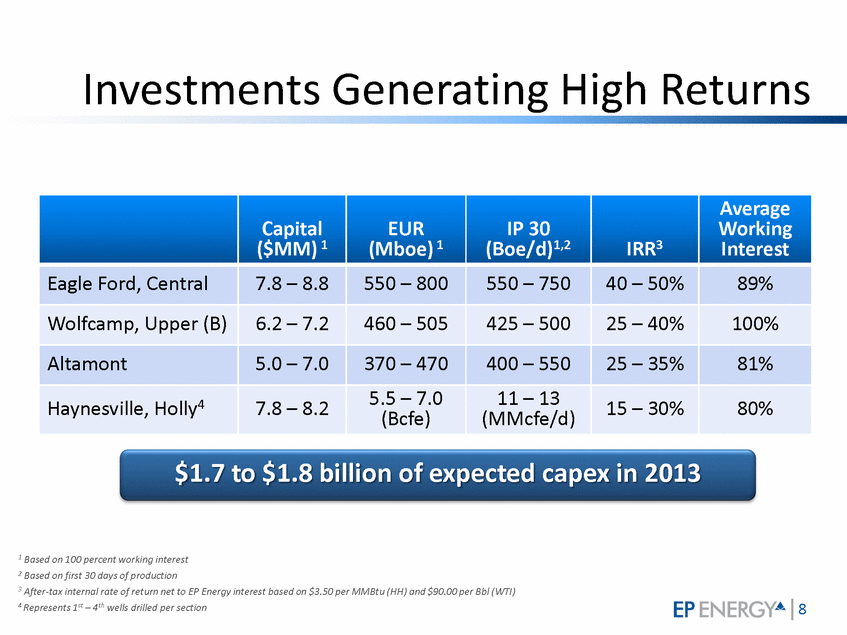
8 EP Energy Investments Generating High Returns Capital ($MM) 1 EUR (Mboe) 1 IP 30 (Boe/d)1,2 IRR3 Average Working Interest Eagle Ford, Central 7.8 – 8.8 550 – 800 550 – 750 40 – 50% 89% Wolfcamp, Upper (B) 6.2 – 7.2 460 – 505 425 – 500 25 – 40% 100% Altamont 5.0 – 7.0 370 – 470 400 – 550 25 – 35% 81% Haynesville, Holly4 7.8 – 8.2 5.5 – 7.0 (Bcfe) 11 – 13 (MMcfe/d) 15 – 30% 80% 1 Based on 100 percent working interest 2 Based on first 30 days of production 3 After-tax internal rate of return net to EP Energy interest based on $3.50 per MMBtu (HH) and $90.00 per Bbl (WTI) 4 Represents 1st – 4th wells drilled per section $1.7 to $1.8 billion of expected capex in 2013 |
|
|
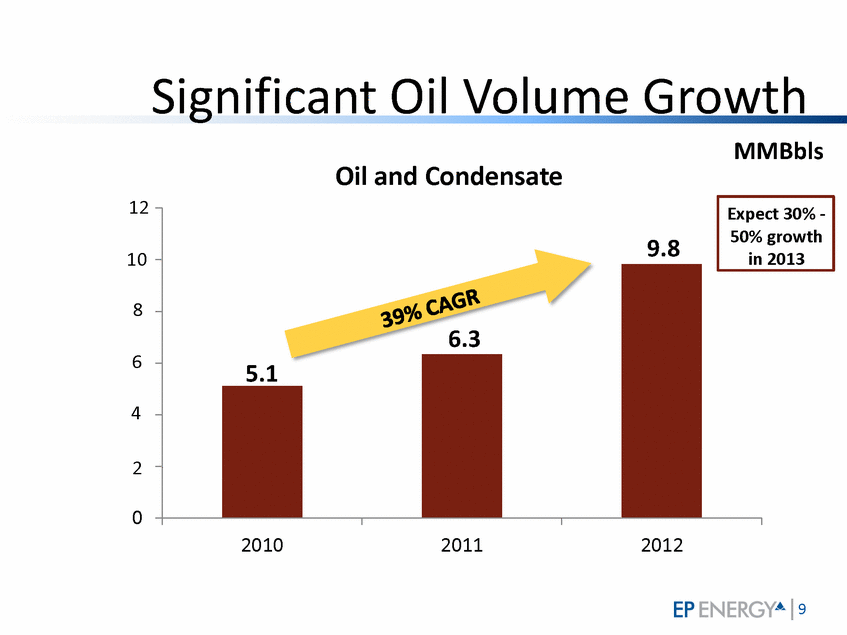
9 EP Energy Significant Oil Volume Growth 2010 2011 2012 5.1 6.3 9.8 MMBbls Oil and Condensate 39% CAGR Expect 30% - 50% growth in 2013 2 4 6 8 10 12 |
|
|
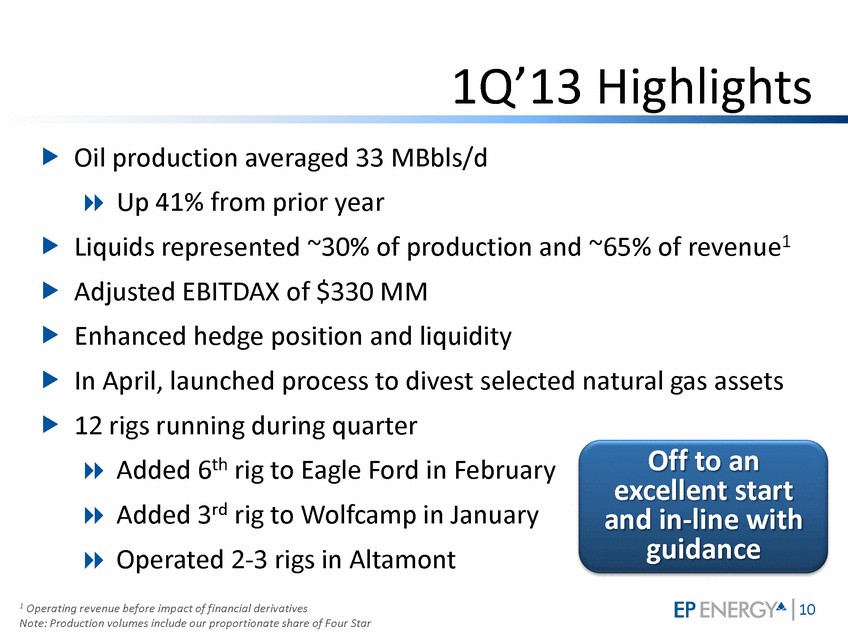
10 EP Energy 1Q’13 Highlights .Oil production averaged 33 MBbls/d .Up 41% from prior year .Liquids represented ~30% of production and ~65% of revenue1 .Adjusted EBITDAX of $330 MM .Enhanced hedge position and liquidity .In April, launched process to divest selected natural gas assets .12 rigs running during quarter .Added 6th rig to Eagle Ford in February .Added 3rd rig to Wolfcamp in January .Operated 2-3 rigs in Altamont 1 Operating revenue before impact of financial derivatives Note: Production volumes include our proportionate share of Four Star Off to an excellent start and in-line with guidance |
|
|
11 EP Energy Favorable Crude Oil Hedges As of May 8, 2013 (Contract Months: January 2013 – forward). Note: Hedged percentages and volumes reflect crude oil and NGL volumes hedged at floor prices. $100.01 $97.41 $95.42 $100.88 $99.47 $96.18 $95.85 $91.56 $87.98 $80 $90 $100 0 2 4 6 8 10 12 14 16 18 2013 2014 2015 ~90% ~60% ~20% Hedged Volumes Avg. Ceiling/Floor Price WTI Strip Price (5/8/13) MMBOE $/Bbl Percentage of hedged volumes for 2013, 2014, and 2015 are based on 2013 expected domestic liquids volumes |

|
|
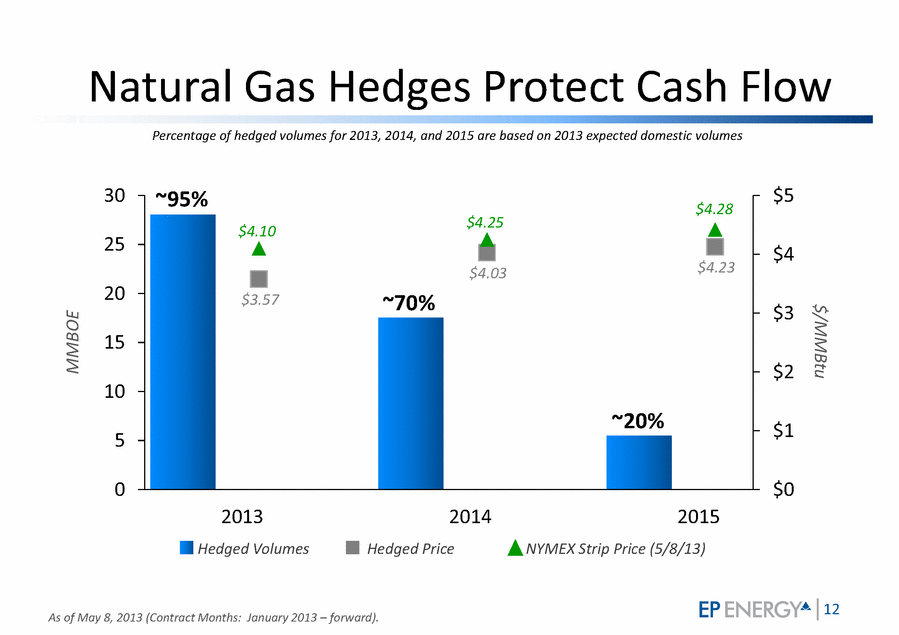
12 EP Energy Natural Gas Hedges Protect Cash Flow As of May 8, 2013 (Contract Months: January 2013 – forward). $3.57 $4.03 $4.23 $4.10 $4.25 $4.28 $0 $1 $2 $3 $4 $5 0 5 10 15 20 25 30 2013 2014 2015 MMBOE $/MMBtu ~95% ~70% ~20% Hedged Volumes Hedged Price NYMEX Strip Price (5/8/13) Percentage of hedged volumes for 2013, 2014, and 2015 are based on 2013 expected domestic volumes |
|
|
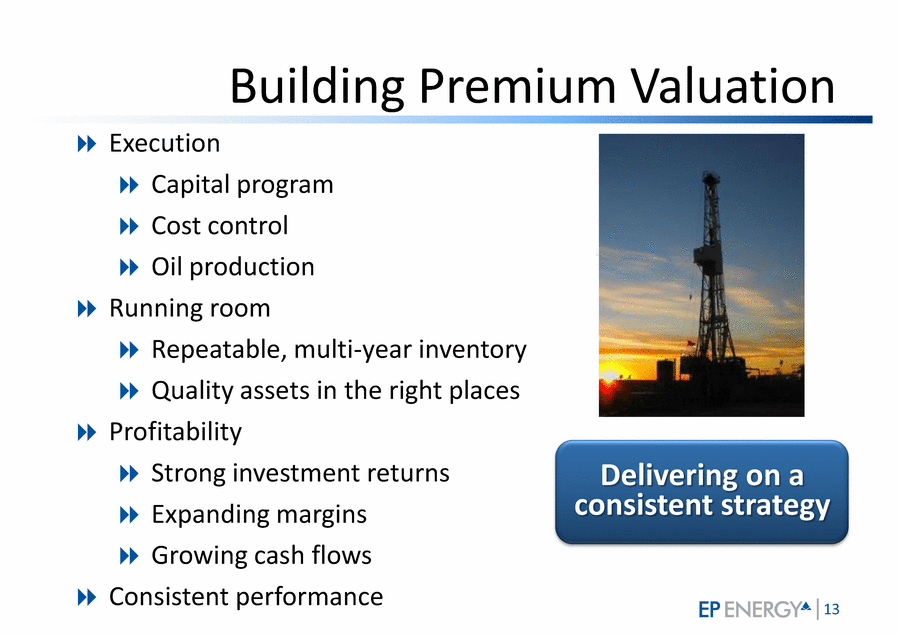
13 EP Energy Building Premium Valuation .Execution .Capital program .Cost control .Oil production .Running room .Repeatable, multi-year inventory .Quality assets in the right places .Profitability .Strong investment returns .Expanding margins .Growing cash flows .Consistent performance Delivering on a consistent strategy |
|
|
EP Energy Citi 2013 Global Energy and Utilities Conference Dane Whitehead Executive Vice President and Chief Financial Officer May 14, 2013 |