Attached files
| file | filename |
|---|---|
| 8-K - 8-K - CIFC Corp. | cifc20138-kcover.htm |
Exhibit 99.1

CIFC CORP. | Investor Relations |
250 Park Avenue - 4th Floor | Investor@CIFC.COM |
New York, NY 10177 | (646) 367-6633 |
NASDAQ: CIFC
CIFC Corp. Announces First Quarter 2013 Results
NEW YORK, May 13, 2013 - CIFC Corp. (NASDAQ: CIFC) (“CIFC” or the “Company”) today announced its results for the first quarter ended March 31, 2013.
Highlights for the First Quarter 2013
• | Economic Net Income (“ENI”, a non-GAAP measure) for the quarter was $6.2 million, an increase of 175% compared to $2.3 million for the same period in the prior year. |
• | ENI management fees for the quarter were $14.0 million, an increase of 20% compared to $11.6 million for the same period in the prior year. |
• | GAAP net income for the quarter was $2.8 million, an increase of 75% compared to $1.6 million for the same period in the prior year. |
• | The Company sponsored two newly issued CLOs that represent approximately $1.0 billion of new loan-based Fee Earning Assets Under Management ("Fee Earning AUM" or "AUM"). |
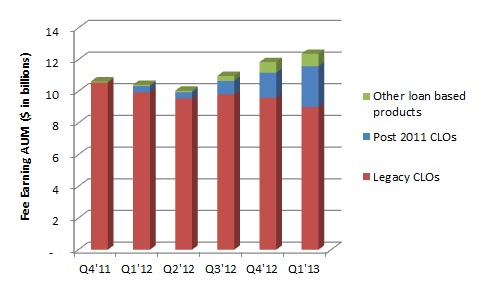
• | Fee Earning AUM from loan-based products totaled $12.4 billion as of March 31, 2013 compared to $10.4 billion as of March 31, 2012. |
• | On May 10, 2013, the Company announced its plan to enter into a strategic relationship with HarbourVest Partners, LLC ("HarbourVest"), a leading, global private markets investment firm for over 30 years and an established investor in mezzanine and European senior loans. HarbourVest plans to offer investment opportunities in U.S. senior secured loans exclusively with CIFC. |
Executive Overview
"We had a strong first quarter with asset management fee revenues and Economic Net Income increasing significantly over the prior year quarter. We sponsored two newly issued CLOs totaling $1.0 billion and our loan-based AUM increased (after normal attrition) to $12.4 billion from $11.8 billion at December 31, 2012 and from $10.4 billion at March 31, 2012. Also, we are excited to be teaming up with HarbourVest and see significant opportunity to jointly deliver investment solutions focused on private debt. We continue to focus on growth in this market environment” said Peter Gleysteen, President and Chief Executive Officer.
1
Selected Financial Metrics
(In thousands, except per share data) (unaudited)
NON-GAAP FINANCIAL MEASURES - ENI (1) | 1Q'13 | 1Q'12 | % Change vs. 1Q'12 | ||||
Management fees - senior and subordinated | $ | 13,975 | $ | 11,623 | 20% | ||
Incentive fees | 2,613 | 213 | >100% | ||||
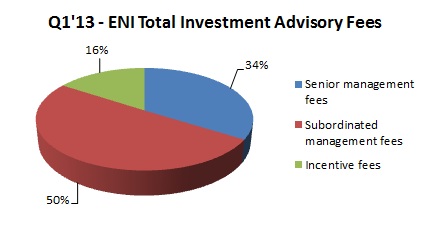
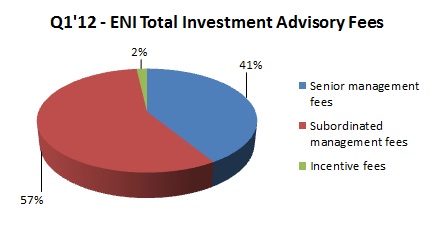
Total Investment Advisory Fees (2) | 16,588 | 11,836 | 40% | ||||
Net interest income | 2,728 | 1,174 | >100% | ||||
Realized net investment gains/(losses) | 3,443 | (1,620 | ) | >100% | |||
Unrealized net investment gains/(losses) | (5,082 | ) | 984 | >100% | |||
Net Investment Income | 1,089 | 538 | >100% | ||||
Total ENI Revenues | 17,677 | 12,374 | 43% | ||||
Compensation and benefits | 6,426 | 5,744 | 12% | ||||
Other operating expenses | 3,576 | 2,910 | 23% | ||||
Corporate interest expense | 1,482 | 1,469 | 1% | ||||
Total ENI Expenses | 11,484 | 10,123 | 13% | ||||
ENI | $ | 6,193 | $ | 2,251 | >100% | ||
ENI per share - basic (3) | $ | 0.30 | $ | 0.11 | >100% | ||
ENI per share - diluted (4) | $ | 0.27 | $ | 0.12 | >100% | ||
NON-GAAP FINANCIAL MEASURES - Adjusted EBIT, Adjusted EBITDA and other ratios (1) | 1Q'13 | 1Q'12 | % Change vs. 1Q'12 | ||||
Adjusted EBIT (5) | $ | 7,675 | $ | 3,720 | >100% | ||
Adjusted EBITDA (6) | $ | 7,844 | $ | 3,845 | >100% | ||
EBITDA Margin (7) | 44 | % | 31 | % | 13% | ||
Fee Related EBITDA Margin (7) | 41 | % | 28 | % | 13% | ||
ENI Margin (7) | 35 | % | 18 | % | 17% | ||
NON-GAAP FINANCIAL MEASURES - AUM | 3/31/2013 | 12/31/2012 | % Change vs. 12/31/2012 | 3/31/2012 | % Change vs. 3/31/12 | ||||
Fee Earning AUM from loan-based products (8) | $12,369,633 | $11,844,898 | 4% | $10,417,022 | 19% | ||||
SELECTED GAAP RESULTS | 1Q'13 | 1Q'12 | % Change vs. 1Q'12 | ||||
Total net revenues | $ | 2,633 | $ | 2,745 | (4)% | ||
Total expenses | $ | 15,148 | $ | 16,627 | (9)% | ||
Net income (loss) attributable to CIFC Corp. | $ | 2,787 | $ | 1,595 | 75% | ||
Earnings (loss) per share - basic | $ | 0.13 | $ | 0.08 | 63% | ||
Earnings (loss) per share - diluted | $ | 0.13 | $ | 0.08 | 63% | ||
Explanatory Notes:
(1) | See Appendix for a detailed description of these non-GAAP measures and reconciliations from net income (loss) attributable to CIFC Corp. to non-GAAP measures. |
(2) | Generally, for CLOs, investment advisory fees include: (i) senior management fees, which are paid prior to all scheduled interest and principal payments on CLO debt tranches, (ii) subordinated management fees, which are paid after all scheduled interest and principal payments on CLO debt tranches and assuming coverage tests are satisfied and (iii) incentive management fees, which vary by the terms of the CLO, but are generally paid after investors' returns exceed a return hurdle. Amounts have been adjusted and are presented net of fee sharing arrangements, if any. |
(3) | For the three months ended March 31, 2013 and 2012, basic weighted average shares outstanding was 20,797,490 and 20,426,118, respectively. |
(4) | For the three months ended March 31, 2013 and 2012, diluted ENI shares outstanding was 26,399,385 and 24,640,340, respectively. Amount represents ENI plus corporate interest expense related to convertible notes divided by total diluted ENI shares. Total diluted ENI shares represents the weighted average shares outstanding plus Non-GAAP adjustments assuming (i) shares repurchased from proceeds received from the exercise of dilutive options, (ii) the conversion of the convertible notes, and (iii) all warrants have been fully exercised. |
(5) | Adjusted EBIT is ENI before corporate interest expense. See Appendix. |
(6) | Adjusted EBITDA is Adjusted EBIT before depreciation of fixed assets. See Appendix. |
(7) | EBITDA Margin is Adjusted EBITDA divided by Total ENI Revenues. Fee Related EBITDA Margin is Adjusted EBITDA less Net Investment Income divided by Total Investment Advisory Fees. ENI Margin is ENI divided by Total ENI Revenues. |
(8) | Amount excludes non-core AUM of $2.1 billion, $2.5 billion and $3.0 billion as of March 31, 2013, December 31, 2012 and March 31, 2012, respectively. |
2
First Quarter 2013 Financial Overview
CIFC reported ENI of $6.2 million for the first quarter of 2013, compared to $2.3 million for the same period in the prior year. ENI increased period to period by $3.9 million primarily as a result of the increase in (i) incentive fees as more CLOs reached their incentive fee hurdles compared to the first quarter of the prior year, (ii) senior and subordinated management fees from the issuances of five new CLOs and the acquisition of four CLOs since the first quarter of 2012 and (iii) net investment income from realized gains due to the settlement on two warehouses. These increases were partially offset by (i) higher unrealized losses on investments in CLOs and warehouses due to the softening of CLO equity prices during the period, (ii) principal paydowns, calls and redemptions of certain legacy CLOs and CDOs as well as (iii) higher expenses to support the continued growth of the Company.
CIFC reported GAAP net income attributable to CIFC Corp. of $2.8 million for the first quarter of 2013, compared to $1.6 million in the same period of the prior year. GAAP operating results increased by $1.2 million from the prior year period, primarily due to the activity noted above, decreases in net losses on contingent liabilities due to changes in expected performance on certain CLOs and the absence of restructuring costs during the current period. These increases were slightly offset by higher taxes and increases in compensation and professional fees to support the continued growth of the Company. In addition, during the first quarter of 2012, CIFC recorded a gain on sale from Gillespie CLO PLC ("Gillespie", a European CLO) of $5.8 million.
Fee Earning AUM
Investment advisory fees earned from investment products the Company manages on behalf of third party investors are the Company's primary source of revenue. These fees typically consist of senior and subordinated management fees based on a percentage of the investment product's assets and, in some cases, incentive fees based on the returns the Company generates for investors in the products.
The Company's total loan-based Fee Earning AUM increased by $0.5 billion from December 31, 2012, primarily as a result of the issuance of two new CLOs with AUM of approximately $1.0 billion partially offset by the call of two CLOs and declines in fee earning AUM for certain CLOs which have reached the end of their contractual reinvestment periods, after which periods capital is returned to investors as the loan assets underlying the CLOs repay principal. Incentive fees are generally paid to the Company as CLOs mature when the relevant return hurdles and certain other restrictions have been met.
The following table summarizes Fee Earning AUM for the Company's significant loan-based products (1):
March 31, 2013 | December 31, 2012 | March 31, 2012 | |||||||||||||||||||
(in thousands, except # of Products) | # of Products | Fee Earning AUM(2) | # of Products | Fee Earning AUM(2) | # of Products | Fee Earning AUM(2) | |||||||||||||||
Post 2011 CLOs | 5 | $ | 2,585,214 | 3 | $ | 1,579,558 | 1 | $ | 398,683 | ||||||||||||
Legacy CLOs (3) | 27 | 9,004,131 | 29 | 9,599,220 | 27 | 9,945,083 | |||||||||||||||
Total CLOs | 32 | 11,589,345 | 32 | 11,178,778 | 28 | 10,343,766 | |||||||||||||||
Other loan-based products | 2 | 780,288 | 3 | 666,120 | 1 | 73,256 | |||||||||||||||
AUM from loan-based products | 34 | $ | 12,369,633 | 35 | $ | 11,844,898 | 29 | $ | 10,417,022 | ||||||||||||
3
Explanatory Notes:
(1) | Table excludes Fee Earning AUM from non-core products, which consists of legacy ABS and Corporate Bond CDOs of $2.1 billion, $2.5 billion and $3.0 billion as of March 31, 2013, December 31, 2012, and March 31, 2012, respectively. Fee Earning AUM on CDOs are expected to continue to decline as these funds run-off per their contractual terms. |
(2) | Fee Earning AUM generally reflects the aggregate principal or notional balance of the collateral and, in some cases, the cash balance held by the CLO as of the date of the last trustee report received for each CLO prior to the respective AUM date. |
(3) | Legacy CLOs represent all managed CLOs issued prior to 2011, including CLOs acquired since 2011 but issued prior to 2011. |
 .
.Total loan-based Fee Earning AUM activity for the quarter ended March 31, 2013 is as follows ($ in thousands):
1Q'13 | Amount | |||
December 31, 2012 | $ | 11,844,898 | ||
CLO New Issuances | 1,001,334 | |||
CLO Principal Paydown | (412,412 | ) | ||
CLO Calls, Redemptions and Sales | (165,141 | ) | ||
Fund Subscriptions | 122,597 | |||
Fund Redemptions | (10,354 | ) | ||
Other (1) | (11,289 | ) | ||
March 31, 2013 | $ | 12,369,633 | ||
Explanatory Note:
(1) | Other includes changes in collateral balances of CLOs between periods and market appreciation on other loan-based products. |
Liquidity
As of March 31, 2013, the Company's total liquidity was comprised of unrestricted cash and cash equivalents of $39.1 million, warehouse investments of $15.3 million and investments of $60.2 million. The decrease of $8.6 million in cash and cash equivalents from $47.7 million as of December 31, 2012, was primarily attributable to (i) net new investments in equity of CLOs and warehouses during the period and (ii) a bridge loan provided by the Company to a third party investor in a warehouse investment, which was subsequently repaid in April. This was partially offset by (i) proceeds received from the settlement of two warehouses related to the two CLOs that were issued in the quarter, and (ii) quarterly operating cash flow.
4
Non-GAAP Financial Measures
The Company discloses financial measures that are calculated and presented on a basis of methodology other than in accordance with generally accepted accounting principles of the United States of America (“Non-GAAP”) as follows:
ENI is a non-GAAP financial measure of profitability which management uses in addition to GAAP to measure the performance of its core business. The Company believes ENI reflects the nature and substance of the business and the economic results driven by investment advisory fee revenues from the management of client funds and earnings on the Company's investments. ENI represents net income (loss) attributable to CIFC Corp. before taxes, realized and unrealized gains (losses) on dispositions of non-core assets, a portion of non-cash compensation related to profits interests granted by CIFC Parent Holdings LLC (a significant stockholder in the Company) in June 2011, amortization and impairments of intangible assets, gains/(losses) on derivatives and liabilities and certain non-recurring operating expenses and strategic transaction expenses (such as those associated with the mergers and acquisitions). ENI also presents investment advisory fee revenues net of any fee-sharing arrangements primarily resulting from mergers or acquisitions.
Adjusted EBIT and Adjusted EBITDA are also non-GAAP financial measures that management considers, in addition to net income (loss) attributable to CIFC Corp., to evaluate the Company's core performance. Adjusted EBIT represents ENI before corporate interest expense and Adjusted EBITDA represents Adjusted EBIT before depreciation of fixed assets, a non-cash item.
ENI, Adjusted EBIT and Adjusted EBITDA may not be comparable to similar measures presented by other companies, as they are non-GAAP financial measures that are not based on a comprehensive set of accounting rules or principles and therefore may be defined differently by other companies. In addition, ENI, Adjusted EBIT and Adjusted EBITDA should be considered an addition to, not as a substitute for, or superior to, financial measures determined in accordance with GAAP.
A detailed calculation of ENI, Adjusted EBIT and Adjusted EBITDA and a reconciliation to the most comparable GAAP financial measure is included in the Appendix.
[Financial Tables to Follow in Appendix]
About CIFC
CIFC is a fundamentals-based, relative value credit manager. Our senior management team averages 30 years of credit experience having managed credit businesses in every cycle since the 1980’s. Headquartered in New York, CIFC is an SEC registered investment adviser and a publicly traded company (NASDAQ: CIFC). We currently serve over 200 institutional investors globally. For more information, please visit CIFC’s website at www.cifc.com.
Forward-Looking Statements
This release may contain forward-looking statements within the meaning of Section 27A of the Securities Act of 1933 and Section 21E of the Securities Exchange Act of 1934 which reflect CIFC's current views with respect to, among other things, CIFC's operations and financial performance. You can identify these forward-looking statements by the use of words such as “outlook,” “believes,” “expects,” “potential,” “continues,” “may,” “will,” “should,” “seeks,” “approximately,” “predicts,” “intends,” “plans,” “estimates,” “anticipates” or the negative version of these words or other comparable words. Such forward-looking statements are subject to various risks and uncertainties. Accordingly, there are or will be important factors that could cause actual outcomes or results to differ materially from those indicated in these statements. CIFC believes these factors include but are not limited to those described under the section entitled “Risk Factors” in its Annual Report on Form 10-K for the fiscal year ended December 31, 2012, as such factors may be updated from time to time in its periodic filings with the Securities and Exchange Commission, which are accessible on the SEC's website at www.sec.gov. These factors should not be construed as exhaustive and should be read in conjunction with the other cautionary statements that are included in this release and in the filings. CIFC undertakes no obligation to publicly update or review any forward-looking statement, whether as a result of new information, future developments or otherwise.
5
Appendix - Table of Contents
Ÿ | Summary reconciliation of GAAP net income (loss) attributable to CIFC Corp. to Non-GAAP measures (ENI, Adjusted EBIT and Adjusted EBITDA) for the Three Months Ended March 31, 2013 and 2012 (unaudited) |
Ÿ | Reconciliation of GAAP to Non-GAAP measures (GAAP basis Statement of Operations are adjusted to exclude the consolidation of VIEs) for the Three Months Ended March 31, 2013 and 2012 (unaudited) |
Ÿ | Reconciliation of GAAP to Non-GAAP measures (GAAP basis Balance Sheets are adjusted to exclude the consolidation of VIEs) as of March 31, 2013 and December 31, 2012 (unaudited) |
6
Appendix
Summary Reconciliation of GAAP Net income (loss) attributable to CIFC Corp. to Non-GAAP Measures
(In thousands) (unaudited) | 1Q'13 | 1Q'12 | ||||
GAAP Net income (loss) attributable to CIFC Corp. | $ | 2,787 | $ | 1,595 | ||
Advisory fee sharing arrangements (1) | (4,210 | ) | (2,409 | ) | ||
Compensation costs (2) | 1,098 | — | ||||
Professional services - insurance settlement received | — | (657 | ) | |||
Amortization and impairment of intangibles | 4,049 | 4,726 | ||||
Restructuring charges | — | 3,904 | ||||
Net gain/loss on liabilities, derivatives and other | 111 | 2,588 | ||||
Gain on sales of contracts | (752 | ) | (5,772 | ) | ||
Income tax expense (benefit) | 3,110 | (1,724 | ) | |||
Total reconciling and non-recurring items | 3,406 | 656 | ||||
ENI | $ | 6,193 | $ | 2,251 | ||
Add: Corporate interest expense | 1,482 | 1,469 | ||||
Adjusted EBIT | $ | 7,675 | $ | 3,720 | ||
Add: Depreciation of fixed assets | 169 | 125 | ||||
Adjusted EBITDA | $ | 7,844 | $ | 3,845 | ||
Explanatory Notes:
(1) | The Company shares advisory fees on certain of the CLOs it manages (for example, advisory fees on certain acquired funds are shared with the party that sold the funds to CIFC). These amounts are netted from investment advisory fees in the computation of ENI. |
(2) | For the three months ended March 31, 2013, compensation has been adjusted for non-cash compensation related to profits interest granted to certain CIFC employees by CIFC Parent Holdings LLC (as significant stockholder in the Company) in 2011 and sharing of incentive fees with certain former employees, established in connection with the Company's CNCIM Acquisition. |
7
Reconciliation from GAAP to Non-GAAP Measures - Consolidated Statements of Operations (1)
1Q'13 | 1Q'12 | |||||||||||||||||||||||
(In thousands) (unaudited) | Consolidated GAAP | Consolidation Adjustments | Deconsolidated Non-GAAP | Consolidated GAAP | Consolidation Adjustments | Deconsolidated Non-GAAP | ||||||||||||||||||
Revenues | ||||||||||||||||||||||||
Investment advisory fees | $ | 2,642 | $ | 18,155 | $ | 20,797 | $ | 2,744 | $ | 11,501 | $ | 14,245 | ||||||||||||
Net investment income | (9 | ) | 2,737 | 2,728 | 1 | 632 | 633 | |||||||||||||||||
Total net revenues | 2,633 | 20,892 | 23,525 | 2,745 | 12,133 | 14,878 | ||||||||||||||||||
Expenses | ||||||||||||||||||||||||
Compensation and benefits | 7,524 | — | 7,524 | 5,744 | — | 5,744 | ||||||||||||||||||
Professional services | 1,923 | — | 1,923 | 724 | — | 724 | ||||||||||||||||||
General and administrative expenses | 1,483 | — | 1,483 | 1,404 | — | 1,404 | ||||||||||||||||||
Depreciation and amortization | 4,218 | — | 4,218 | 4,851 | — | 4,851 | ||||||||||||||||||
Restructuring charges | — | — | — | 3,904 | — | 3,904 | ||||||||||||||||||
Total expenses | 15,148 | — | 15,148 | 16,627 | — | 16,627 | ||||||||||||||||||
Other Income (Expense) and Gain (Loss) | ||||||||||||||||||||||||
Net gain (loss) on investments at fair value | 349 | (1,988 | ) | (1,639 | ) | — | (265 | ) | (265 | ) | ||||||||||||||
Net gain (loss) on liabilities at fair value | (114 | ) | — | (114 | ) | (2,377 | ) | — | (2,377 | ) | ||||||||||||||
Corporate interest expense | (1,482 | ) | — | (1,482 | ) | (1,469 | ) | — | (1,469 | ) | ||||||||||||||
Net gain on the sale of management contracts | 752 | — | 752 | 5,772 | — | 5,772 | ||||||||||||||||||
Other, net | 3 | — | 3 | (41 | ) | — | (41 | ) | ||||||||||||||||
Net other income (expense) and gain (loss) | (492 | ) | (1,988 | ) | (2,480 | ) | 1,885 | (265 | ) | 1,620 | ||||||||||||||
Operating income (loss) | (13,007 | ) | 18,904 | 5,897 | (11,997 | ) | 11,868 | (129 | ) | |||||||||||||||
Net results of Consolidated VIEs | 47,058 | (47,058 | ) | — | 38,780 | (38,780 | ) | — | ||||||||||||||||
Income (loss) before income tax (expense) benefit | 34,051 | (28,154 | ) | 5,897 | 26,783 | (26,912 | ) | (129 | ) | |||||||||||||||
Income tax (expense) benefit | (3,110 | ) | — | (3,110 | ) | 1,724 | — | 1,724 | ||||||||||||||||
Net income (loss) | 30,941 | (28,154 | ) | 2,787 | 28,507 | (26,912 | ) | 1,595 | ||||||||||||||||
Net (income) attributable to noncontrolling interest and Consolidated VIEs | (28,154 | ) | 28,154 | — | (26,912 | ) | 26,912 | — | ||||||||||||||||
Net income (loss) attributable to CIFC Corp. | $ | 2,787 | $ | — | $ | 2,787 | $ | 1,595 | $ | — | $ | 1,595 | ||||||||||||
Explanatory Note:
(1) | The Consolidated Statements of Operations have been adjusted to present on a deconsolidated non-GAAP basis, which eliminate the impact of Consolidated VIEs. Management uses these statements in addition to GAAP to measure the performance of its core business. |
8
Reconciliation from GAAP to Non-GAAP - Consolidated Balance Sheets (1)
March 31, 2013 | December 31, 2012 | |||||||||||||||||||||||
(In thousands) (unaudited) | GAAP | Adjustments | Deconsolidated Non-GAAP | GAAP | Adjustments | Deconsolidated Non-GAAP | ||||||||||||||||||
Assets | ||||||||||||||||||||||||
Cash and cash equivalents | $ | 39,130 | $ | — | $ | 39,130 | $ | 47,692 | $ | — | $ | 47,692 | ||||||||||||
Due from brokers | 5,876 | — | 5,876 | 1,150 | — | 1,150 | ||||||||||||||||||
Restricted cash and cash equivalents | 1,613 | — | 1,613 | 1,612 | — | 1,612 | ||||||||||||||||||
Investments at fair value | 5,261 | 70,227 | 75,488 | 5,058 | 74,176 | 79,234 | ||||||||||||||||||
Receivables | 12,756 | 2,828 | 15,584 | 2,432 | 2,675 | 5,107 | ||||||||||||||||||
Prepaid and other assets | 5,057 | — | 5,057 | 5,392 | — | 5,392 | ||||||||||||||||||
Deferred tax asset, net | 53,381 | — | 53,381 | 50,545 | — | 50,545 | ||||||||||||||||||
Equipment and improvements, net | 3,975 | — | 3,975 | 3,979 | — | 3,979 | ||||||||||||||||||
Intangible assets, net | 39,087 | — | 39,087 | 43,136 | — | 43,136 | ||||||||||||||||||
Goodwill | 76,000 | — | 76,000 | 76,000 | — | 76,000 | ||||||||||||||||||
Subtotal | 242,136 | 73,055 | 315,191 | 236,996 | 76,851 | 313,847 | ||||||||||||||||||
Total assets of Consolidated VIEs | 11,355,458 | (11,355,458 | ) | — | 10,267,915 | (10,267,915 | ) | — | ||||||||||||||||
Total Assets | $ | 11,597,594 | $ | (11,282,403 | ) | $ | 315,191 | $ | 10,504,911 | $ | (10,191,064 | ) | $ | 313,847 | ||||||||||
Liabilities | ||||||||||||||||||||||||
Due to brokers | $ | 37 | $ | — | $ | 37 | $ | — | $ | — | $ | — | ||||||||||||
Accrued and other liabilities | 15,655 | — | 15,655 | 15,734 | — | 15,734 | ||||||||||||||||||
Deferred purchase payments | 4,915 | — | 4,915 | 4,778 | — | 4,778 | ||||||||||||||||||
Contingent liabilities at fair value | 30,330 | — | 30,330 | 33,783 | — | 33,783 | ||||||||||||||||||
Long-term debt | 138,450 | — | 138,450 | 138,233 | — | 138,233 | ||||||||||||||||||
Subtotal | 189,387 | — | 189,387 | 192,528 | — | 192,528 | ||||||||||||||||||
Total non-recourse liabilities of Consolidated VIEs | 11,176,220 | (11,176,220 | ) | — | 10,113,035 | (10,113,035 | ) | — | ||||||||||||||||
Total Liabilities | 11,365,607 | (11,176,220 | ) | 189,387 | 10,305,563 | (10,113,035 | ) | 192,528 | ||||||||||||||||
Equity | ||||||||||||||||||||||||
Common stock | 21 | — | 21 | 21 | — | 21 | ||||||||||||||||||
Treasury stock | (664 | ) | — | (664 | ) | (664 | ) | — | (664 | ) | ||||||||||||||
Additional paid-in capital | 957,108 | — | 957,108 | 955,407 | — | 955,407 | ||||||||||||||||||
Accumulated other comprehensive income (loss) | (6 | ) | — | (6 | ) | (3 | ) | — | (3 | ) | ||||||||||||||
Retained earnings (deficit) | (830,655 | ) | — | (830,655 | ) | (833,442 | ) | — | (833,442 | ) | ||||||||||||||
Total CIFC Corp. Stockholder's Equity | 125,804 | — | 125,804 | 121,319 | — | 121,319 | ||||||||||||||||||
Appropriated retained earnings (deficit) of Consolidated VIEs | 106,183 | (106,183 | ) | — | 78,029 | (78,029 | ) | — | ||||||||||||||||
Total Equity | 231,987 | (106,183 | ) | 125,804 | 199,348 | (78,029 | ) | 121,319 | ||||||||||||||||
Total Liabilities and Stockholders' Equity | $ | 11,597,594 | $ | (11,282,403 | ) | $ | 315,191 | $ | 10,504,911 | $ | (10,191,064 | ) | $ | 313,847 | ||||||||||
Explanatory Note:
(1) | The Consolidated Balance Sheets have been adjusted to present a deconsolidated non-GAAP statements, which eliminate the impact of Consolidated VIEs. Management uses these statements in addition to GAAP to measure the performance of its core business. |
9