Attached files
| file | filename |
|---|---|
| 8-K - 8-K - Addus HomeCare Corp | d538414d8k.htm |
 Coordinated
Personal Home Care A pre-acute
solution
to
the
post-acute
problem
SM
JMP Securities Research Conference
May 14, 2013
Exhibit 99.1 |
 Forward-Looking Statements
The following information contains, or may be deemed to contain,
forward-looking statements. By their nature, forward-looking statements
involve risks and uncertainties because they relate to events and depend
on circumstances that may or may not occur in the future. The future
results of Addus may vary from the results expressed in, or implied by,
the following forward-looking statements, possibly to a material degree,
and historical results may not be an indication of future performance.
For a discussion of some of the important factors that could cause Addus'
results to differ from those expressed in, or implied by, the following
forward-looking
statements,
please
refer
to
Addus’
most
recent
Annual
Report on Form 10-K, and its Quarterly Reports on Form 10-Q, each of
which is available at www.SEC.gov, particularly the Sections entitled “Risk
Factors”. Addus undertakes no obligation to update or revise any
forward-looking statements, except as may be required by law.
2 |
 It is
the primary mission of Addus HealthCare to improve the health and well being of our
consumers through the provision of quality, cost-effective home and community based
services. We will accomplish our goals by fostering an environment in which our
employees enthusiastically support and advance our mission.
Reward for accomplishing our mission includes pride in our organization, contribution
to the community and a reasonable profit.
Mission |
 Investment Highlights
Large & Growing Market
Broad Range of Services and Payors
Positioned to Excel under Healthcare Reform
History of Growth through Acquisition
Multiple Organic Growth Opportunities
Differentiated, Coordinated Care Model
Experienced Management Team
Significant Operational Scale Across
National Footprint |
 Addus
Dual
Advantage
TM
The New Paradigm
Long-term care risk makes it essential that
health plan dual eligible members live safely
and healthfully at home as long as possible…
5 |
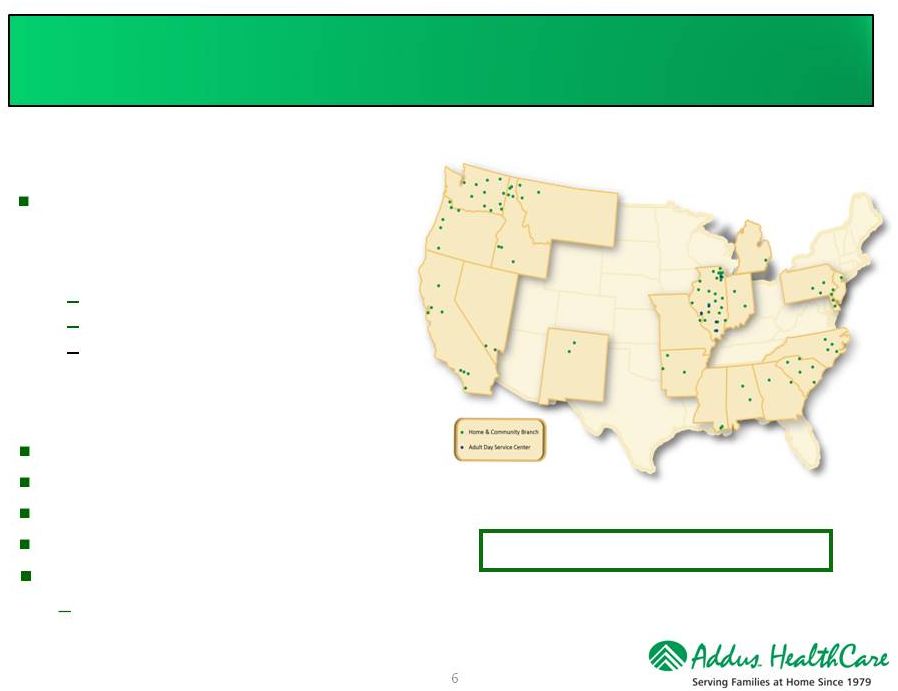 About
Addus Who is Addus?
Comprehensive provider of home and
community based services, which are
primarily social in nature, focused
primarily on the Dual Eligible population:
Personal Care
Private Duty
Adult Day Service
Founded in 1979
14,000+ employees
26,000+ consumers (many dual eligible)
2012 Revenues of $244.3 million
Diversified payor base (200+ payors)
Largest
payor
-
64%
of
2012
total
revenues
6
98 Locations Across 20 States
Key Facts: |
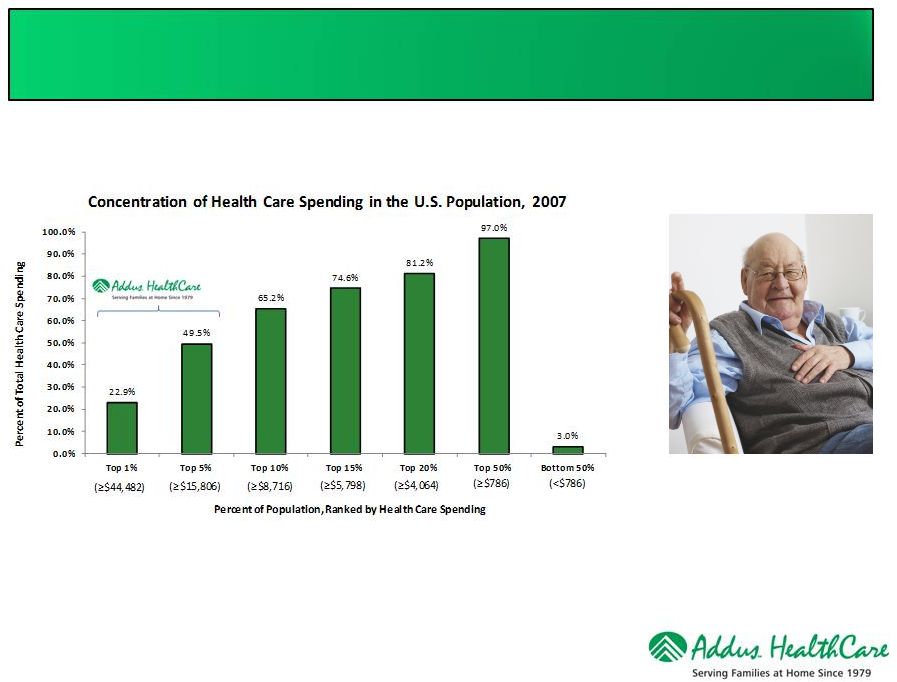 Who We
Serve Focusing on the Dual Eligible Population
Addus focuses on the top 5% in terms of resource needs and expenditures!
Source: Kaiser Family Foundation calculations using data from U.S. Department of Health
and Human Services, Agency for Healthcare Research and Quality, Medical Expenditure
Panel Survey (MEPS), 2007 7 |
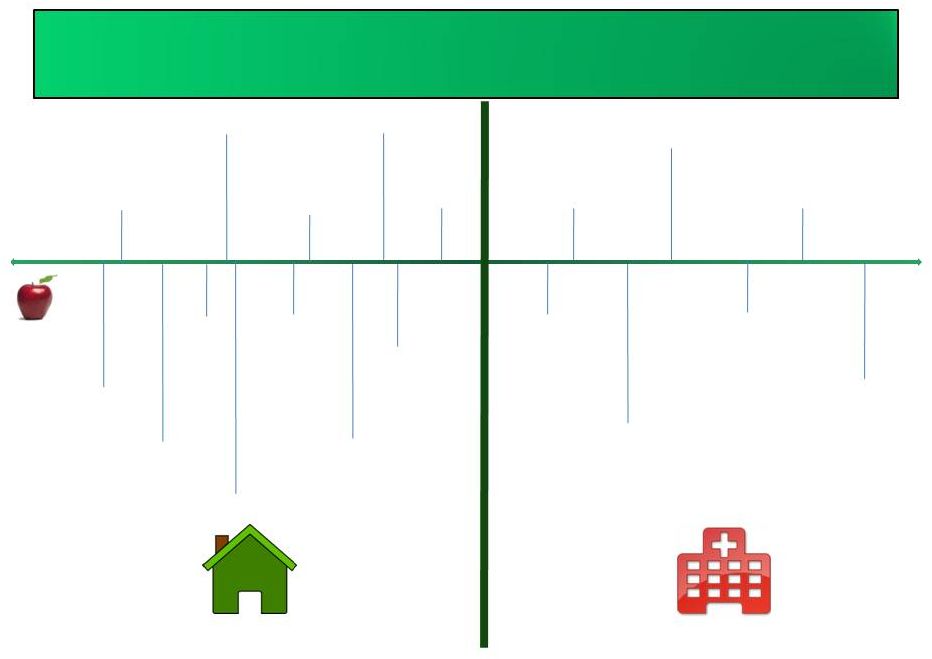 Companionship
$
Healthy
Living -
Eat
an Apple ¢
Telephone
Reassurance ¢
Personal
Emergency
Response
(PERS) ¢¢
Friendly
Visiting
¢¢
Meals at
Home ¢¢
Transportation ¢¢
Adult Day Services ¢¢
Personal Care $
Case
Management $
Home Health $
Hospice $$
Home
Physicians
$$
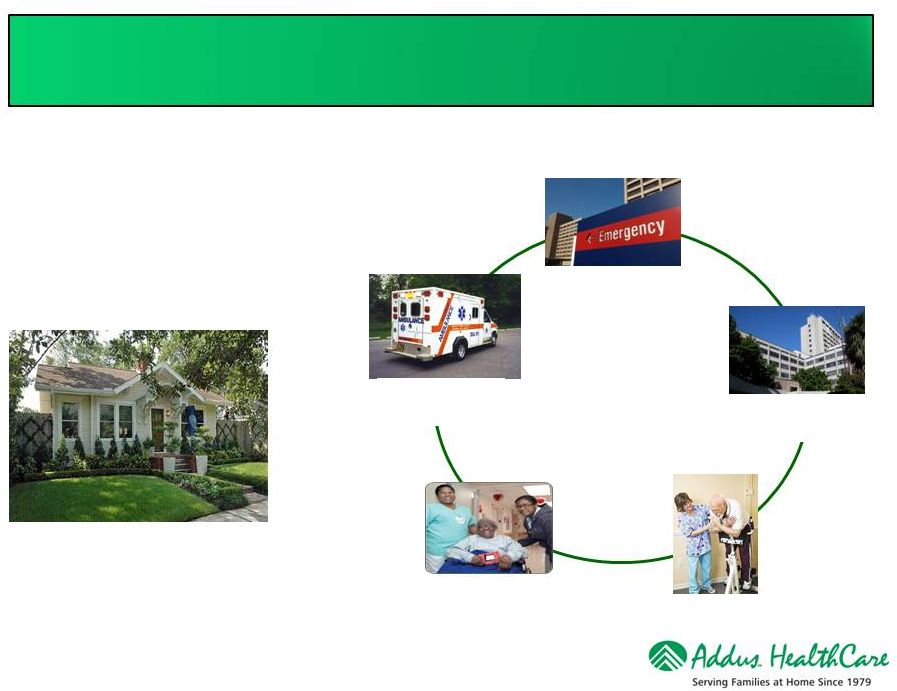
Ambulance/
ER $$$
Hospital Stay
$$$$
Hospital
Intensive Care
$$$$
Rehab Facility
$$$$
Psychiatric
Inpatient $$$$$
Nursing Home
$$$$$
Sub-Acute
Facilities $$$$$
Pre-Acute
Acute
Where are we in the Continuum of Care? |
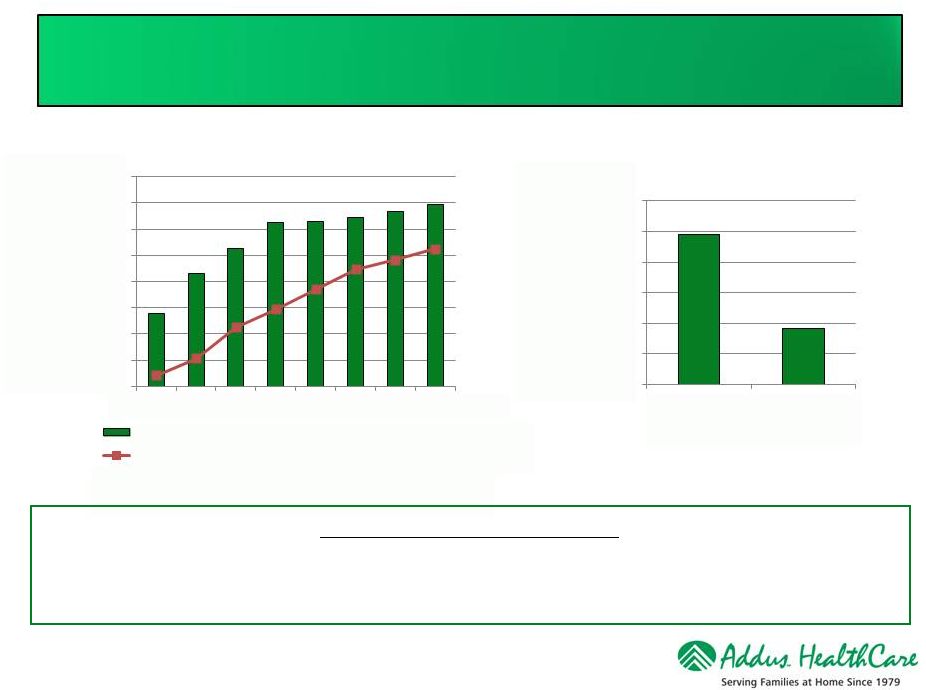 Long-Term Care Expenditures
.
SOURCE: KCMU and Urban Institute analysis of HCFA/CMS-64 data. June 2011
Growth in Medicaid Long Term Care Expenditures
Medicaid Spending Per Beneficiary
Source: Kassner, Reinhard, Fox-Grage, Houser, Accius,
Coleman and Milne. AARP Public Policy Institute: “A
Balancing Act: State Long-Term Care Reform,”July 2008
9
THE LANDSCAPE IS SHIFTING
States are shifting responsibility for care to health plans and managed care
Focus on managing and coordinating care for the costly dual eligible population
$0.00
$10.00
$20.00
$30.00
$40.00
$50.00
$60.00
$70.00
$80.00
1990
1995
2000
2002
2004
2006
2008
2009
Insitutional Care Expenditures(Billions)
Home & Community Based Services Expenditures (Billions)
$24,500
$9,200
$0
$5,000
$10,000
$15,000
$20,000
$25,000
$30,000
Nursing Home
Home Care |
 Total $300
Billion in annual spending for dual eligible enrollees in 2007 Funding for both programs
administered through the States 26 States have indicated they will participate
over the next 3 years Each State will decide on the size, nature and timing of the
pilots Approximately 9 million are “Duals”
Bids are being solicited from multiple “Managed Care Companies”
Stated Objectives:
Dual Eligible
What is the Opportunity?
Medicare Program
Populations 65+ years
Hospital Services (Part A)
–
Post Acute Care SNF / Rehab
Professional Services (Part B)
–
Post acute Home Care Services
Prescription Services (Part D)
Duals Represent 36% of Total Medicare Spending
Medicaid Programs
Generally populations 65+ years w Income limits
Home Based Personal Care
Long term Nursing Home Care
Duals Represent 39% of Total Medicaid Spending
69% of Medicaid Spending is for Long Term Care
10
–
Eliminate service duplication / streamline administration
–
Keep member functioning in the home environment
–
Avoid / lower the cost for Acute Care services
Pilot Program Features / Objectives
Sources: Kaiser Commission on Medicaid and the Uninsured, April 2011 |
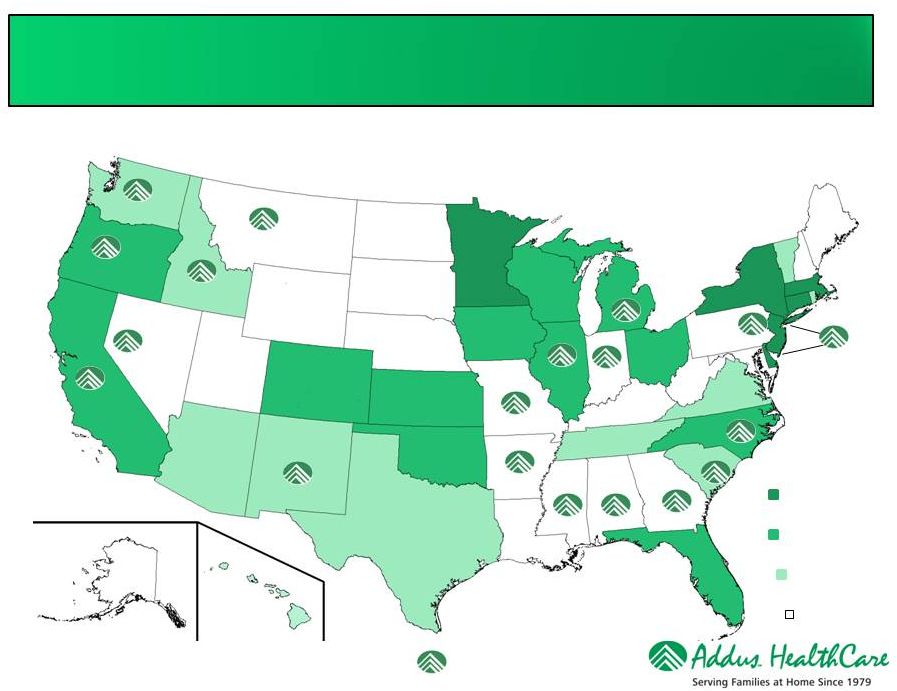 MCO
Plans/Programs already implemented
2013 Implementation
Plans
2014 Implementation
Plans
No Implementation
Plans
Addus location(s)
Source: Kaiser Commission on Medicaid and the Uninsured, May 2012
States Pursuing a Dual Program |
 Health
Plan’s Worst Nightmare 12
Home Personal Care
$9,200/year
Emergency Room
$1,700/visit
Acute Care Hospital
$12,320/stay
Rehab Facility
$18,600/stay
Nursing Home
$42,000/year
Vs.
Ambulance
$1,000/ride
Total Episodic Cost &
one-year of Nursing
Home
$75,620
Sources: Consumer Health Ratings.com
CMS.gov
The Choice is Obvious! |
 Addus
Dual Advantage TM
A Powerful Resource
No one knows more about the member…
No one is in a better position to
positively effect
health outcomes… …Than the Addus Home Care Aide
13 |
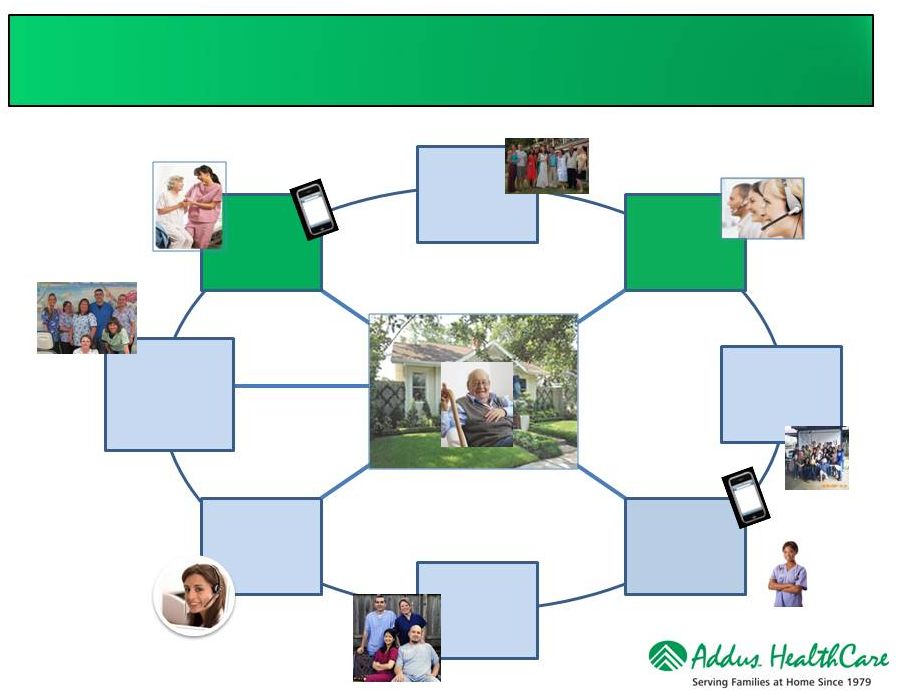 Home
Care Integrated Clinical Strategy Begins In The Home
Addus
Home Care
Aide
Client Primary
Care Health
Providers
Addus
Call Center
Health Plan
Case
Manager
14
Community-
Based
Providers &
Pharmacies
Interdisciplinary
Care Team
Community-Based
Resources &
Advocacy Groups
Family |
 Addus
Dual
Advantage
TM
A Model for Extending the Reach of Health Plan Case Managers
15
Serving the dual eligible population at home:
•
Complicated
•
Logistics intense
•
Highly transactional
•
Requires disciplined processes
Provides tremendous opportunity for
case management extension! |
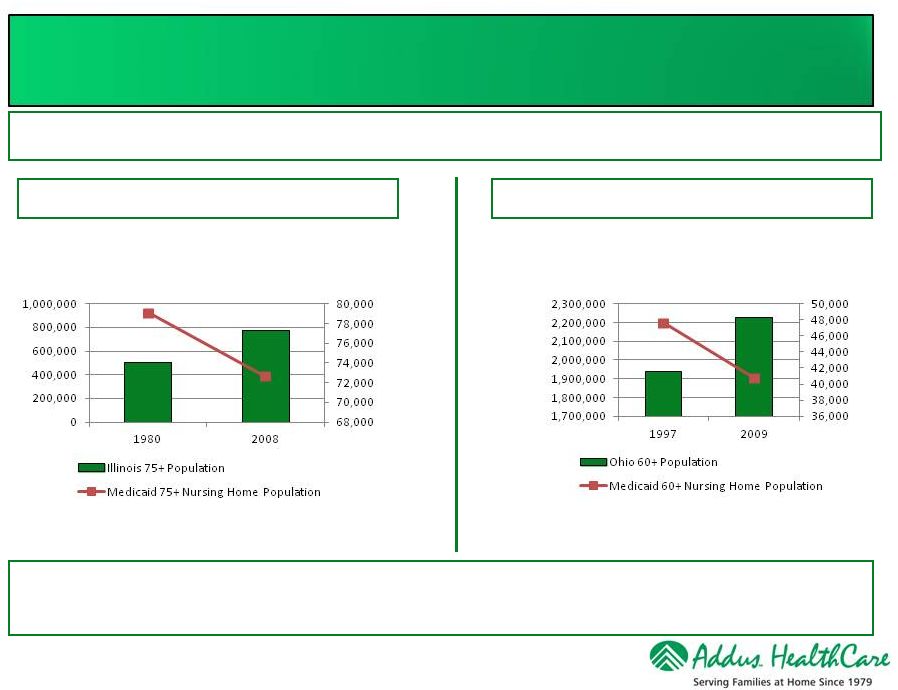 Source:
CCP Cost Effectiveness: Comparison of CCP growth with Nursing Facility Prevalence Reductions
HCBS Strategies Inc. February 10, 2010
Illinois Residents Age 75+
Total Population vs. Nursing Home Residents
Source: Coming of Age: Tracking the Progress and Challenges of Delivering Long-Term
Services and Supports in Ohio
Scripps Gerontology Center, Miami University of Ohio, June 2011
Ohio Residents Age 60+
Total Population vs. Nursing Home Residents
Scripps Gerontology Center Study
HCBS Strategies Study
Nursing home admissions fell, in spite of rising populations; substantial savings
The home is the lowest cost setting in which to provide care, and is preferred
by consumers and families
Home Care Programs Improve Outcomes |
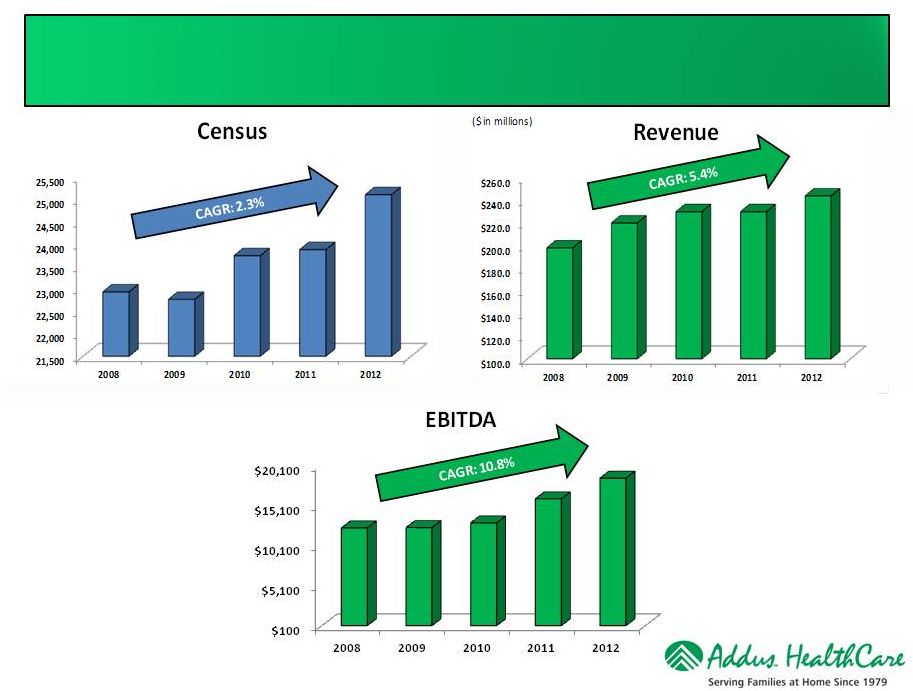 Census
-
Revenue
-
EBITDA
Trends
17
We define Adjusted EBITDA as earnings before
discontinued operations, preferred stock dividends,
reevaluation of contingent consideration, interest
expense, taxes, depreciation, amortization, and stock-
based compensation expense. Adjusted EBITDA is a
performance measure used by management that is not
calculated in accordance with generally accepted
accounting principles in the United States (GAAP). It
should not be considered in isolation or as a substitute for
net income, operating income or any other measure of
financial performance calculated in accordance with GAAP.
($ in thousands) |
 Condensed
Consolidated Statements of Income 18
($ in millions)
12/31/2008
12/31/2009
12/31/2010
12/31/2011
12/31/2012
3/31/2012
3/31/2013
Unaudited
Unaudited
Net Service Revenues
197.9
$
219.9
$
230.1
$
230.1
$
244.3
$
58.9
$
63.0
$
Cost of Service Revenues
(147.3)
(162.7)
(170.4)
(168.6)
(180.2)
(43.9)
(47.2)
General Administrative
(38.6)
(45.1)
(47.0)
(45.4)
(45.9)
(11.6)
(11.5)
Adjusted EBITDA
12.3
$
12.3
$
12.9
$
15.9
$
18.4
$
4.0
$
4.4
$
Gross Margin Percentage
25.6%
26.0%
25.9%
26.7%
26.2%
25.5%
25.1%
Adjusted EBITDA Percentage
6.2%
5.6%
5.6%
6.9%
7.5%
6.8%
7.0%
Year Ended
Three Months Ended
Continuing Operations
Notes: We define Adjusted EBITDA as earnings before discontinued operations, preferred
stock dividends, revaluation of contingent consideration, interest expense, taxes, depreciation, amortization,
and stock-based compensation expense. Adjusted EBITDA is a performance measure used by
management that is not calculated in accordance with generally accepted accounting principles in
the United States (GAAP). It should not be considered in isolation or as a substitute for net
income, operating income or any other measure of financial performance calculated in accordance
with GAAP.
Gross Margin percentage is defined as Net Service Revenues less Cost of Service Revenues
divided by Net Service Revenues. Adjusted EBITDA Percentage is defined as Adjusted
EBITDA divided by Net Service Revenues |
 Select
Balance Sheet Information 19
Balances for 3/31/2013 are unaudited.
($ in millions)
Key Balances
12/31/2008
12/31/2009
12/31/2010
12/31/2011
12/31/2012
3/31/2013
Cash
6.1
$
0.5
$
0.8
$
2.0
$
1.7
$
17.8
$
Accounts receivable, net
49.2
70.5
71.0
72.4
71.3
60.6
Total Assets
135.7
161.3
166.9
154.7
149.9
151.4
Debt, including current maturities
63.2
49.2
45.2
31.5
16.5
-
Stock holders' equity
34.6
$
80.6
$
88.1
$
86.4
$
94.4
$
107.8
$
Debt to capital ratio
64.6%
37.9%
33.9%
26.7%
14.8%
0.0% |
 Investment Highlights
Large & Growing Market
Broad Range of Services and Payors
Positioned to Excel under Healthcare Reform
History of Growth through Acquisition
Multiple Organic Growth Opportunities
Differentiated, Coordinated Care Model
Experienced Management Team
Significant Operational Scale Across
National Footprint |
 EBITDA
Reconciliation 21
($ in millions)
12/31/2008
12/31/2009
12/31/2010
12/31/2011
12/31/2012
3/31/2012
3/31/2013
(2)
Net Income
(0.2)
$
(1.8)
$
6.0
$
(2.0)
$
7.6
$
0.6
$
13.3
$
Less: (Earnings) loss from discontinued operations
(2.5)
(2.4)
(1.7)
10.4
1.7
1.1
(10.6)
Net Income from continuing operations
(2.7)
(4.2)
4.3
8.4
9.3
1.7
2.7
Preferred stock dividends
4.3
5.4
-
-
-
-
Revaluation of contingent consideration
-
-
-
(0.5)
-
-
-
Interest Income
(0.2)
(2.3)
(0.2)
-
-
Interest Expense
5.7
6.8
3.2
2.5
1.7
0.4
0.2
Income Tax Expense
(0.5)
(0.1)
1.9
4.3
4.8
1.2
0.8
Depreciation and amortization
5.2
4.1
3.4
3.2
2.5
0.6
0.6
Stock based compensation expense
0.3
0.3
0.3
0.3
0.3
0.1
0.1
Adjusted EBITDA (1)
12.3
$
12.3
$
12.9
$
15.9
$
18.4
$
4.0
$
4.4
$
(1)
(2)
3/31/13 and 3/31/12 amounts are unaudited
Year Ended
Three Months Ended
We define Adjusted EBITDA as earnings before discontinued operations, preferred stock
dividends, revaluation of contingent consideration, interest expense, taxes,
depreciation, amortization, severance costs related to former chairman and stock-based
compensation expense. Adjusted EBITDA is a performance measure used by management that
is not calculated in accordance with generally accepted accounting principles in the United States (GAAP). It should not be considered in isolation or as a
Continuing Operations
substitute for net income, operating income or any other measure of financial performance
calculated in accordance with GAAP. |