Attached files
| file | filename |
|---|---|
| 8-K - 8-K - STATE BANK FINANCIAL CORP | stbz_2013513-8k.htm |
State Bank Financial Corporation 2013 Gulf South Bank Conference Tom Wiley - Vice Chairman and President Tom Callicutt - Executive Vice President and CFO May 13, 2013
2 Cautionary Note Regarding Forward-Looking Statements Certain statements contained in this earnings deck that are not statements of historical fact may constitute forward-looking statements. These forward-looking statements, which are based on certain assumptions and describe our future plans, strategies and expectations, can generally be identified by the use of the words “may,” “would,” “could,” “will,” “expect,” “anticipate,” “believe,” “intend,” “plan” and “estimate,” as well as similar expressions. These forward-looking statements include statements related to our projected growth, anticipated future financial performance, and management’s long-term performance goals, as well as statements relating to the anticipated effects on results of operations and financial condition from expected developments or events, or business and growth strategies, including anticipated internal growth and plans to establish or acquire banks or the assets of failed banks. These forward-looking statements involve significant risks and uncertainties that could cause our actual results to differ materially from those anticipated in such statements. Potential risks and uncertainties include the following: • general economic conditions (both generally and in our markets) may be less favorable than expected, which could result in, among other things, a continued deterioration in credit quality, a further reduction in demand for credit and a further decline in real estate values; • the general decline in the real estate and lending markets, particularly in our market areas, may continue to negatively affect our financial results; • our ability to raise additional capital may be impaired if current levels of market disruption and volatility continue or worsen; • we may be unable to collect reimbursements on losses that we incur on our assets covered under loss share agreements with the FDIC as we anticipate; • costs or difficulties related to the integration of the banks we acquired or may acquire from the FDIC as receiver may be greater than expected; • restrictions or conditions imposed by our regulators on our operations may make it more difficult for us to achieve our goals; • legislative or regulatory changes, including changes in accounting standards and compliance requirements, may adversely affect us; • competitive pressures among depository and other financial institutions may increase significantly; • changes in the interest rate environment may reduce margins or the volumes or values of the loans we make or have acquired; • other financial institutions have greater financial resources and may be able to develop or acquire products that enable them to compete more successfully than we can; • our ability to attract and retain key personnel can be affected by the increased competition for experienced employees in the banking industry; • adverse changes may occur in the bond and equity markets; • war or terrorist activities may cause further deterioration in the economy or cause instability in credit markets; • economic, governmental or other factors may prevent the projected population, residential and commercial growth in the markets in which we operate; and • we will or may continue to face the risk factors discussed from time to time in the periodic reports we file with the SEC. For these forward-looking statements, we claim the protection of the safe harbor for forward-looking statements contained in the Private Securities Litigation Reform Act of 1995. You should not place undue reliance on the forward-looking statements, which speak only as of the date of this report. All subsequent written and oral forward-looking statements attributable to us or any person acting on our behalf are expressly qualified in their entirety by the cautionary statements contained or referred to in this section. We undertake no obligation to publicly update or revise any forward-looking statements, whether as a result of new information, future events or otherwise. See Item 1A, Risk Factors, in our Annual Report on Form 10-K for the year ended December 31, 2012, for a description of some of the important factors that may affect actual outcomes.
3 State Bank Financial Corporation Profile……………………………………………….…………………………………………………..……. 1Q 2013 Results ………………………………………………....................................…………………………………………………….…….. Company Characteristics..….……………………………………………………………………………………………………………………………. Strategic Priorities………………………………………………………………………......………….………………………………………………... 4 5 9 17 Contents
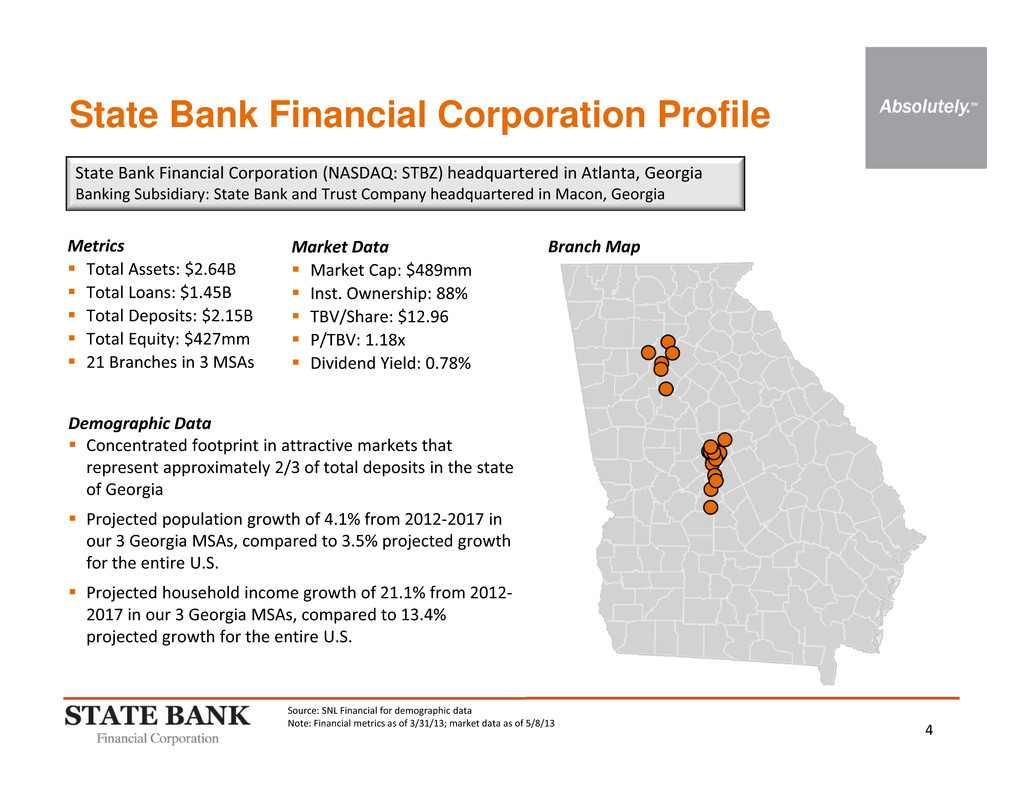
4 State Bank Financial Corporation (NASDAQ: STBZ) headquartered in Atlanta, Georgia Banking Subsidiary: State Bank and Trust Company headquartered in Macon, Georgia State Bank Financial Corporation Profile Market Data Market Cap: $489mm Inst. Ownership: 88% TBV/Share: $12.96 P/TBV: 1.18x Dividend Yield: 0.78% Source: SNL Financial for demographic data Note: Financial metrics as of 3/31/13; market data as of 5/8/13 Metrics Total Assets: $2.64B Total Loans: $1.45B Total Deposits: $2.15B Total Equity: $427mm 21 Branches in 3 MSAs Demographic Data Concentrated footprint in attractive markets that represent approximately 2/3 of total deposits in the state of Georgia Projected population growth of 4.1% from 2012‐2017 in our 3 Georgia MSAs, compared to 3.5% projected growth for the entire U.S. Projected household income growth of 21.1% from 2012‐ 2017 in our 3 Georgia MSAs, compared to 13.4% projected growth for the entire U.S. Branch Map
5 1Q 2013 Results
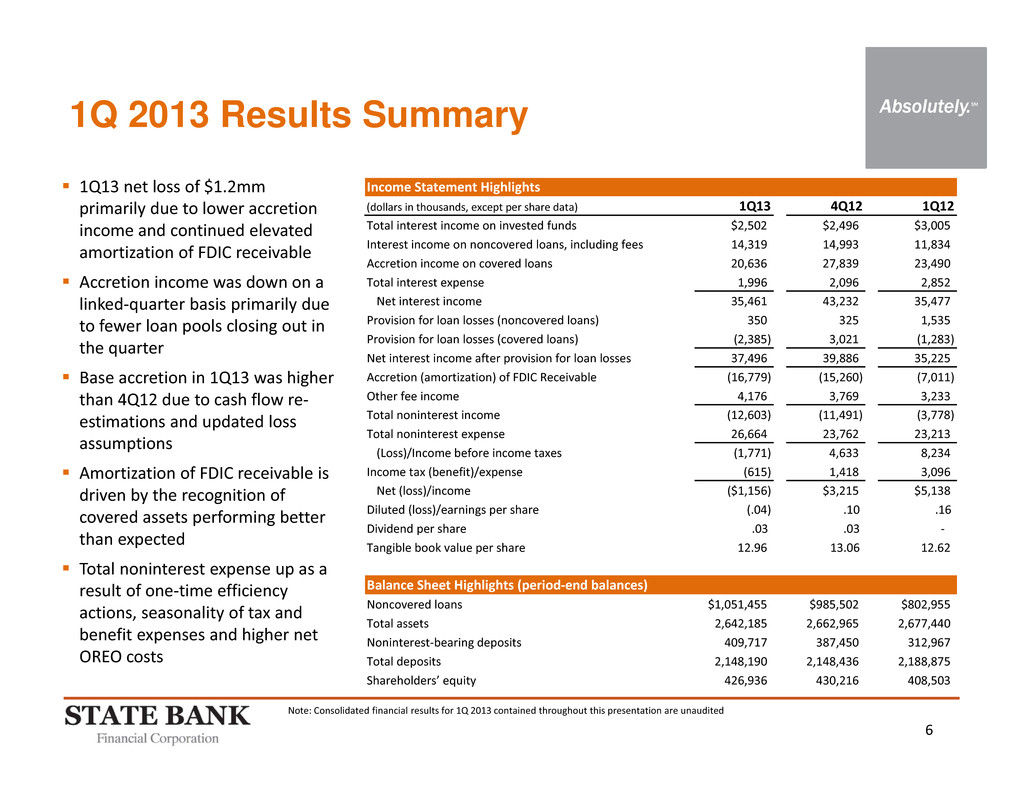
6 1Q 2013 Results Summary Note: Consolidated financial results for 1Q 2013 contained throughout this presentation are unaudited 1Q13 net loss of $1.2mm primarily due to lower accretion income and continued elevated amortization of FDIC receivable Accretion income was down on a linked‐quarter basis primarily due to fewer loan pools closing out in the quarter Base accretion in 1Q13 was higher than 4Q12 due to cash flow re‐ estimations and updated loss assumptions Amortization of FDIC receivable is driven by the recognition of covered assets performing better than expected Total noninterest expense up as a result of one‐time efficiency actions, seasonality of tax and benefit expenses and higher net OREO costs Income Statement Highlights (dollars in thousands, except per share data) 1Q13 4Q12 1Q12 Total interest income on invested funds $2,502 $2,496 $3,005 Interest income on noncovered loans, including fees 14,319 14,993 11,834 Accretion income on covered loans 20,636 27,839 23,490 Total interest expense 1,996 2,096 2,852 Net interest income 35,461 43,232 35,477 Provision for loan losses (noncovered loans) 350 325 1,535 Provision for loan losses (covered loans) (2,385) 3,021 (1,283) Net interest income after provision for loan losses 37,496 39,886 35,225 Accretion (amortization) of FDIC Receivable (16,779) (15,260) (7,011) Other fee income 4,176 3,769 3,233 Total noninterest income (12,603) (11,491) (3,778) Total noninterest expense 26,664 23,762 23,213 (Loss)/Income before income taxes (1,771) 4,633 8,234 Income tax (benefit)/expense (615) 1,418 3,096 Net (loss)/income ($1,156) $3,215 $5,138 Diluted (loss)/earnings per share (.04) .10 .16 Dividend per share .03 .03 ‐ Tangible book value per share 12.96 13.06 12.62 Balance Sheet Highlights (period‐end balances) Noncovered loans $1,051,455 $985,502 $802,955 Total assets 2,642,185 2,662,965 2,677,440 Noninterest‐bearing deposits 409,717 387,450 312,967 Total deposits 2,148,190 2,148,436 2,188,875 Shareholders’ equity 426,936 430,216 408,503
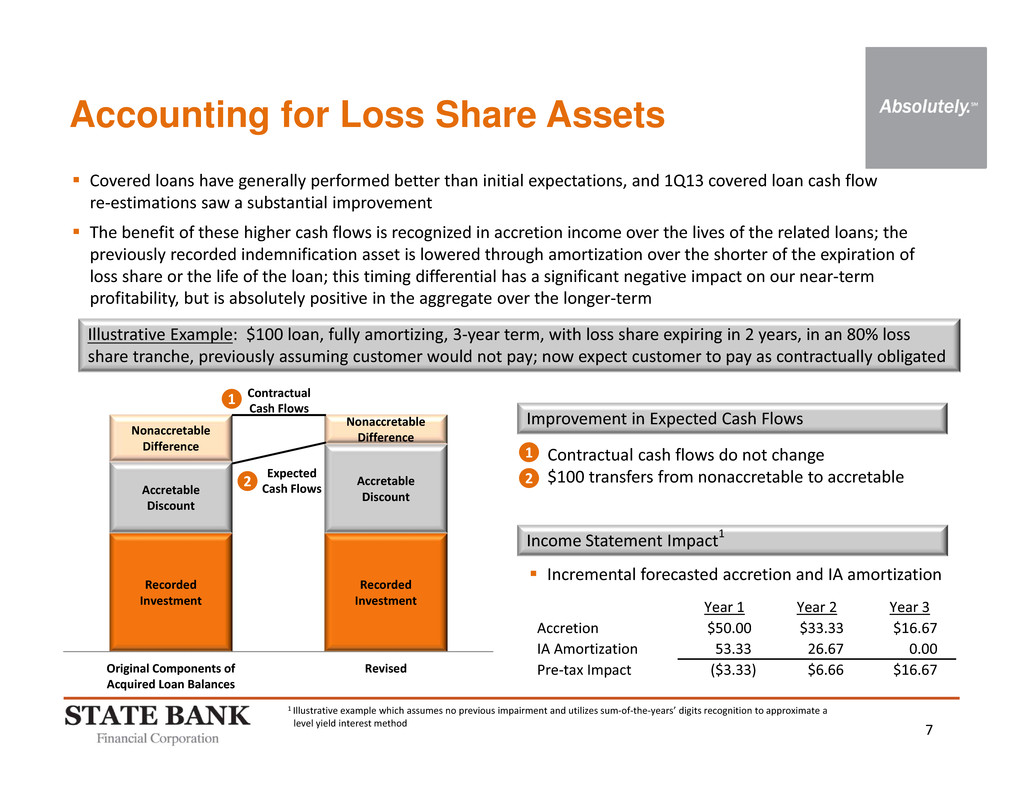
7 Contractual Cash Flows Recorded Investment Recorded Investment Accretable Discount Accretable Discount Nonaccretable Difference Nonaccretable Difference Original Components of Acquired Loan Balances Revised Accounting for Loss Share Assets Covered loans have generally performed better than initial expectations, and 1Q13 covered loan cash flow re‐estimations saw a substantial improvement The benefit of these higher cash flows is recognized in accretion income over the lives of the related loans; the previously recorded indemnification asset is lowered through amortization over the shorter of the expiration of loss share or the life of the loan; this timing differential has a significant negative impact on our near‐term profitability, but is absolutely positive in the aggregate over the longer‐term Income Statement Impact1 Illustrative Example: $100 loan, fully amortizing, 3‐year term, with loss share expiring in 2 years, in an 80% loss share tranche, previously assuming customer would not pay; now expect customer to pay as contractually obligated Improvement in Expected Cash Flows Contractual cash flows do not change $100 transfers from nonaccretable to accretableExpected Cash Flows 1 2 1 2 Incremental forecasted accretion and IA amortization 1 Illustrative example which assumes no previous impairment and utilizes sum‐of‐the‐years’ digits recognition to approximate a level yield interest method Year 1 Year 2 Year 3 Accretion $50.00 $33.33 $16.67 IA Amortization 53.33 26.67 0.00 Pre‐tax Impact ($3.33) $6.66 $16.67
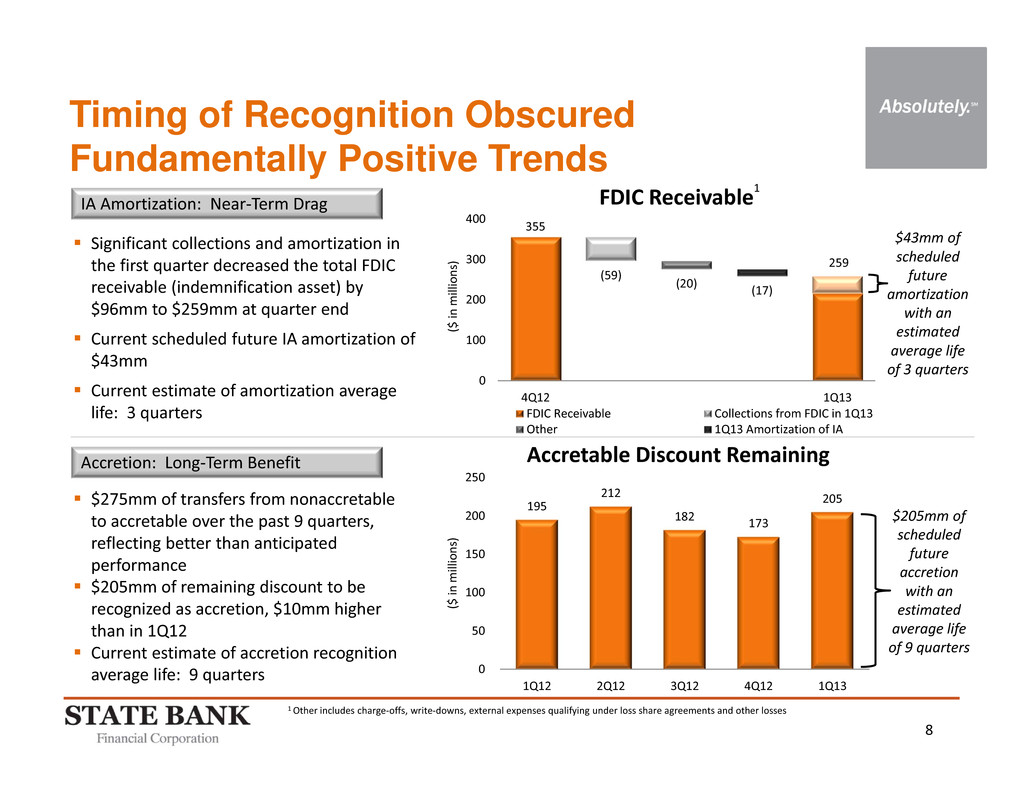
8 355 (59) (20) (17) 259 0 100 200 300 400 4Q12 1Q13 FDIC Receivable1 FDIC Receivable Collections from FDIC in 1Q13 Other 1Q13 Amortization of IA Timing of Recognition Obscured Fundamentally Positive Trends ( $ i n m i l l i o n s ) Significant collections and amortization in the first quarter decreased the total FDIC receivable (indemnification asset) by $96mm to $259mm at quarter end Current scheduled future IA amortization of $43mm Current estimate of amortization average life: 3 quarters ( $ i n m i l l i o n s ) $275mm of transfers from nonaccretable to accretable over the past 9 quarters, reflecting better than anticipated performance $205mm of remaining discount to be recognized as accretion, $10mm higher than in 1Q12 Current estimate of accretion recognition average life: 9 quarters 195 212 182 173 205 0 50 100 150 200 250 1Q12 2Q12 3Q12 4Q12 1Q13 Accretable Discount Remaining $205mm of scheduled future accretion with an estimated average life of 9 quarters $43mm of scheduled future amortization with an estimated average life of 3 quarters IA Amortization: Near‐Term Drag Accretion: Long‐Term Benefit 1 Other includes charge‐offs, write‐downs, external expenses qualifying under loss share agreements and other losses
9 Company Characteristics
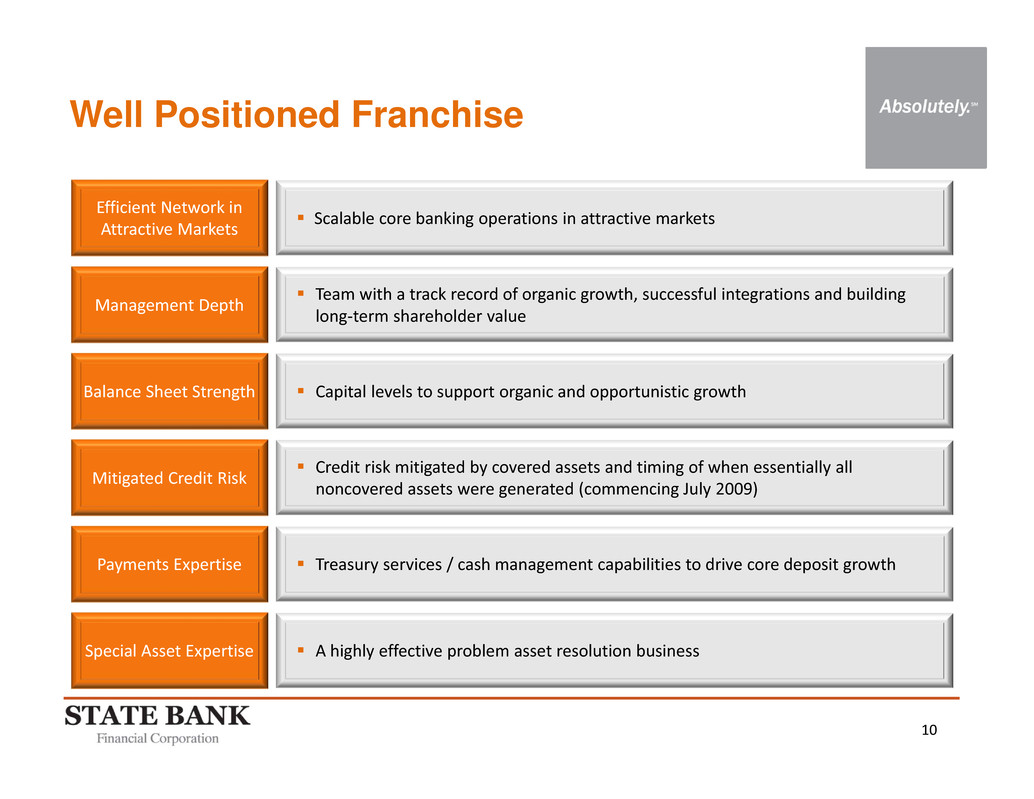
10 Well Positioned Franchise Efficient Network in Attractive Markets Special Asset Expertise Mitigated Credit Risk Balance Sheet Strength Management Depth Scalable core banking operations in attractive markets A highly effective problem asset resolution business Capital levels to support organic and opportunistic growth Team with a track record of organic growth, successful integrations and building long‐term shareholder value Credit risk mitigated by covered assets and timing of when essentially all noncovered assets were generated (commencing July 2009) Payments Expertise Treasury services / cash management capabilities to drive core deposit growth
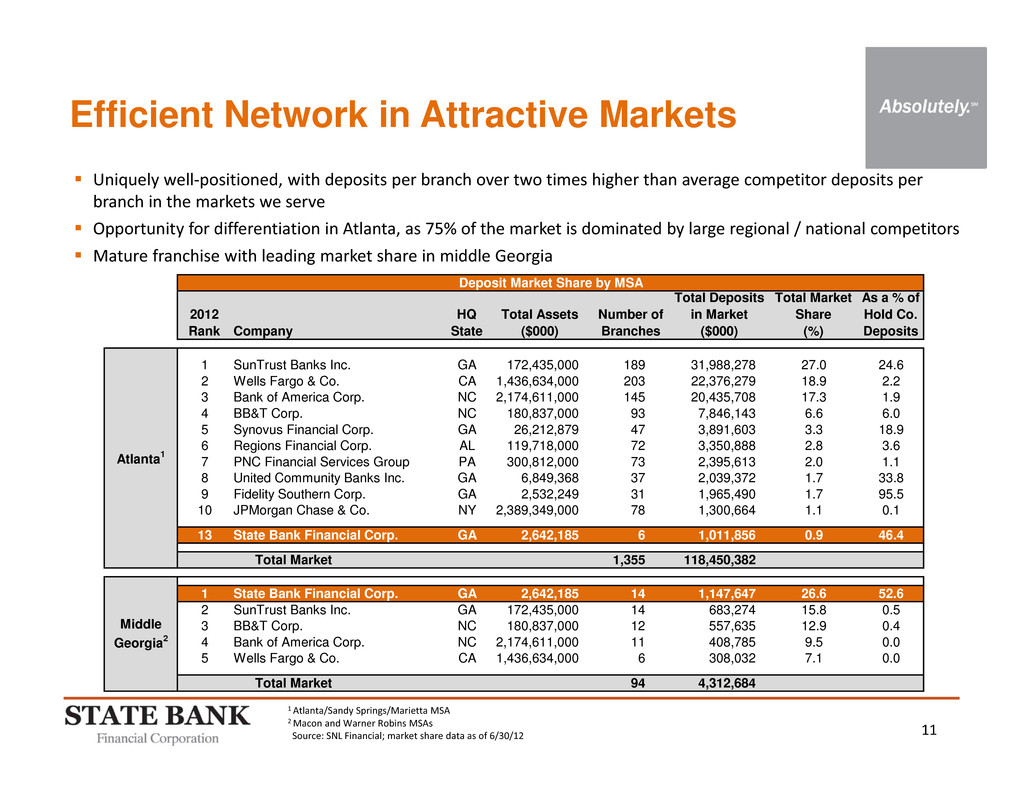
11 Efficient Network in Attractive Markets Uniquely well‐positioned, with deposits per branch over two times higher than average competitor deposits per branch in the markets we serve Opportunity for differentiation in Atlanta, as 75% of the market is dominated by large regional / national competitors Mature franchise with leading market share in middle Georgia 1 Atlanta/Sandy Springs/Marietta MSA 2 Macon and Warner Robins MSAs Source: SNL Financial; market share data as of 6/30/12 2012 Rank Company HQ State Total Assets ($000) Number of Branches Total Deposits in Market ($000) Total Market Share (%) As a % of Hold Co. Deposits 1 SunTrust Banks Inc. GA 172,435,000 189 31,988,278 27.0 24.6 2 Wells Fargo & Co. CA 1,436,634,000 203 22,376,279 18.9 2.2 3 Bank of America Corp. NC 2,174,611,000 145 20,435,708 17.3 1.9 4 BB&T Corp. NC 180,837,000 93 7,846,143 6.6 6.0 5 Synovus Financial Corp. GA 26,212,879 47 3,891,603 3.3 18.9 6 Regions Financial Corp. AL 119,718,000 72 3,350,888 2.8 3.6 7 PNC Financial Services Group PA 300,812,000 73 2,395,613 2.0 1.1 8 United Community Banks Inc. GA 6,849,368 37 2,039,372 1.7 33.8 9 Fidelity Southern Corp. GA 2,532,249 31 1,965,490 1.7 95.5 10 JPMorgan Chase & Co. NY 2,389,349,000 78 1,300,664 1.1 0.1 13 State Bank Financial Corp. GA 2,642,185 6 1,011,856 0.9 46.4 Total Market 1,355 118,450,382 1 State Bank Financial Corp. GA 2,642,185 14 1,147,647 26.6 52.6 2 SunTrust Banks Inc. GA 172,435,000 14 683,274 15.8 0.5 3 BB&T Corp. NC 180,837,000 12 557,635 12.9 0.4 4 Bank of America Corp. NC 2,174,611,000 11 408,785 9.5 0.0 5 Wells Fargo & Co. CA 1,436,634,000 6 308,032 7.1 0.0 Total Market 94 4,312,684 Middle Georgia2 Deposit Market Share by MSA Atlanta1
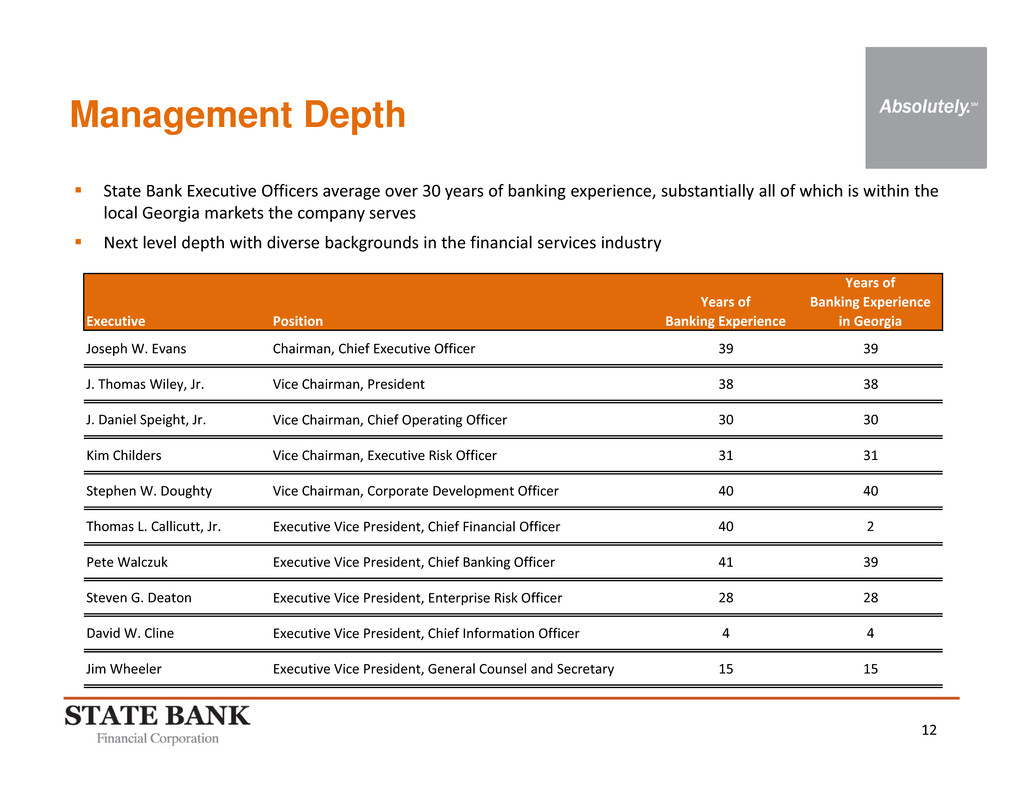
12 Management Depth State Bank Executive Officers average over 30 years of banking experience, substantially all of which is within the local Georgia markets the company serves Next level depth with diverse backgrounds in the financial services industry Executive Position Years of Banking Experience Years of Banking Experience in Georgia Joseph W. Evans Chairman, Chief Executive Officer 39 39 J. Thomas Wiley, Jr. Vice Chairman, President 38 38 J. Daniel Speight, Jr. Vice Chairman, Chief Operating Officer 30 30 Kim Childers Vice Chairman, Executive Risk Officer 31 31 Stephen W. Doughty Vice Chairman, Corporate Development Officer 40 40 Thomas L. Callicutt, Jr. Executive Vice President, Chief Financial Officer 40 2 Pete Walczuk Executive Vice President, Chief Banking Officer 41 39 Steven G. Deaton Executive Vice President, Enterprise Risk Officer 28 28 David W. Cline Executive Vice President, Chief Information Officer 4 4 Jim Wheeler Executive Vice President, General Counsel and Secretary 15 15
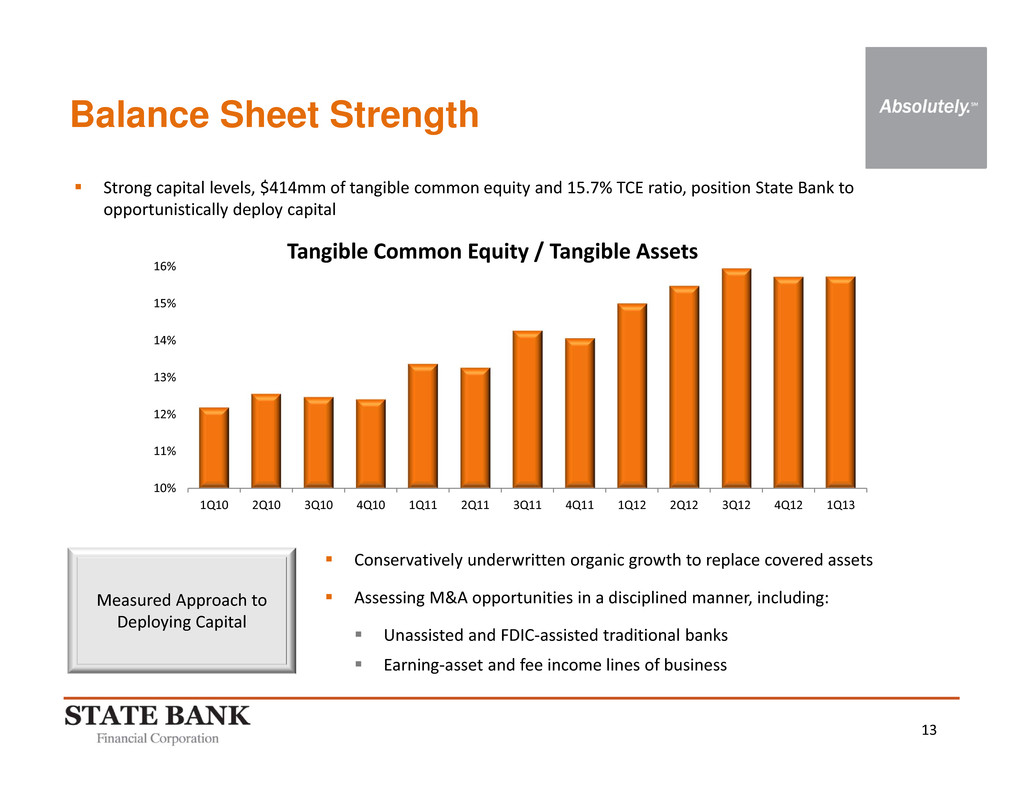
13 Balance Sheet Strength Strong capital levels, $414mm of tangible common equity and 15.7% TCE ratio, position State Bank to opportunistically deploy capital 10% 11% 12% 13% 14% 15% 16% 1Q10 2Q10 3Q10 4Q10 1Q11 2Q11 3Q11 4Q11 1Q12 2Q12 3Q12 4Q12 1Q13 Tangible Common Equity / Tangible Assets Conservatively underwritten organic growth to replace covered assets Assessing M&A opportunities in a disciplined manner, including: Unassisted and FDIC‐assisted traditional banks Earning‐asset and fee income lines of business Measured Approach to Deploying Capital
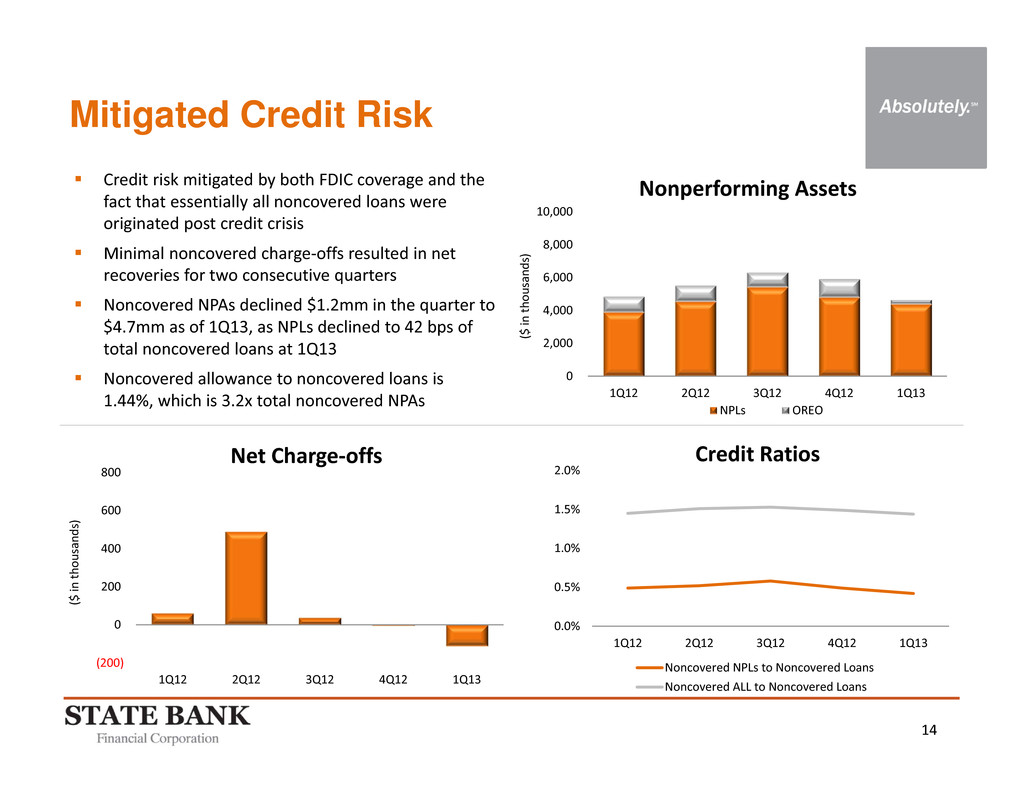
14 Mitigated Credit Risk Credit risk mitigated by both FDIC coverage and the fact that essentially all noncovered loans were originated post credit crisis Minimal noncovered charge‐offs resulted in net recoveries for two consecutive quarters Noncovered NPAs declined $1.2mm in the quarter to $4.7mm as of 1Q13, as NPLs declined to 42 bps of total noncovered loans at 1Q13 Noncovered allowance to noncovered loans is 1.44%, which is 3.2x total noncovered NPAs ( $ i n t h o u s a n d s ) ( $ i n t h o u s a n d s ) 0 2,000 4,000 6,000 8,000 10,000 1Q12 2Q12 3Q12 4Q12 1Q13 Nonperforming Assets NPLs OREO (200) 0 200 400 600 800 1Q12 2Q12 3Q12 4Q12 1Q13 Net Charge‐offs 0.0% 0.5% 1.0% 1.5% 2.0% 1Q12 2Q12 3Q12 4Q12 1Q13 Credit Ratios Noncovered NPLs to Noncovered Loans Noncovered ALL to Noncovered Loans

15 Payments Expertise Delivering differentiated service through 17 Certified Treasury Professionals across the entire organization Investing in payments technologies that embrace “convenience,” “choice” and “quality” as client‐facing differentiators Enhances our treasury services / cash management product offering for our commercial clients Integration of Altera is proceeding very well and contribution is exceeding our initial expectations Focused on cash management capabilities as a core competency Acquired Macon, Georgia‐based Altera Payroll, Inc., on October 15, 2012
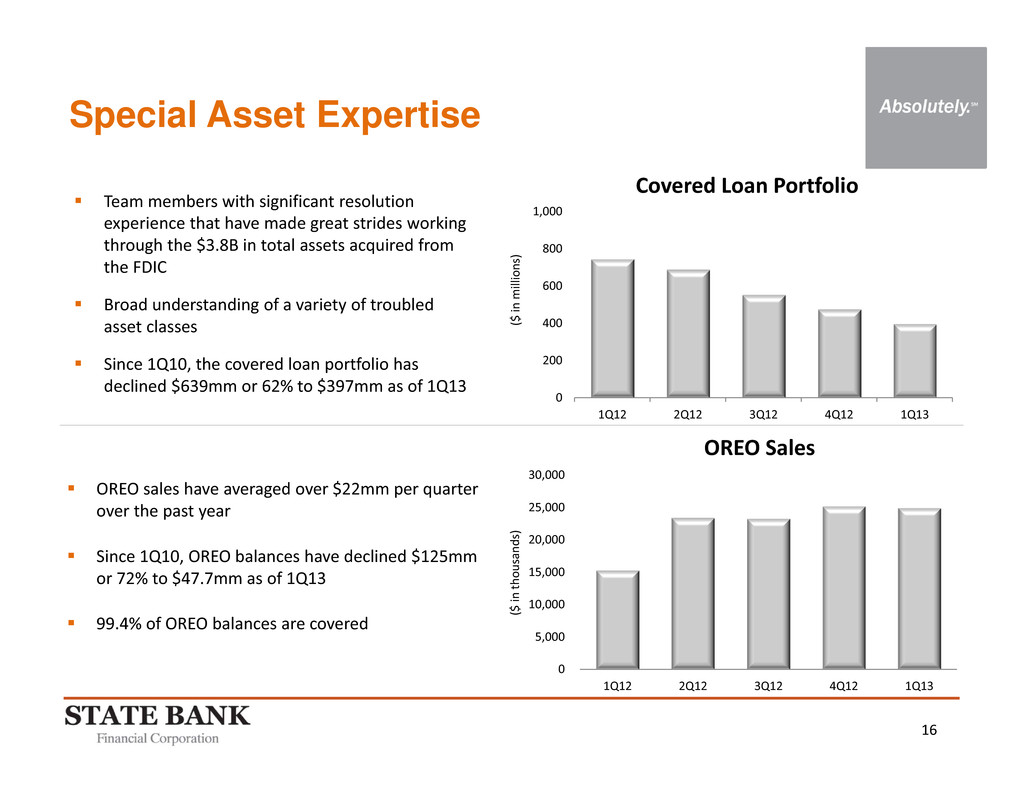
16 Special Asset Expertise Team members with significant resolution experience that have made great strides working through the $3.8B in total assets acquired from the FDIC Broad understanding of a variety of troubled asset classes Since 1Q10, the covered loan portfolio has declined $639mm or 62% to $397mm as of 1Q13 ( $ i n m i l l i o n s ) OREO sales have averaged over $22mm per quarter over the past year Since 1Q10, OREO balances have declined $125mm or 72% to $47.7mm as of 1Q13 99.4% of OREO balances are covered 0 200 400 600 800 1,000 1Q12 2Q12 3Q12 4Q12 1Q13 Covered Loan Portfolio 0 5,000 10,000 15,000 20,000 25,000 30,000 1Q12 2Q12 3Q12 4Q12 1Q13 OREO Sales ( $ i n t h o u s a n d s )
17 Strategic Priorities
18 Focused on productivity and sustainability of the core franchise Not a one‐time “cost‐cutting” project, but striving to instill a culture of operating efficiently Significant actions taken in 1Q13 to decrease expense run‐rate, while reinvesting in the core franchise to increase long‐term efficiency Refining an already efficient footprint; 1 branch closure each in 3Q12 and 4Q12, bringing our branch count to 21, compared to the 41 branches operated by legacy charters Strategic Priorities: Efficiency STBZ 1Q 2013 Earnings Conference Call “We're taking pretty much a top‐to‐bottom look at the company, recognizing that we pulled this organization together with a lot of disparate organizations that were merged at a rapid pace and we're just simply going back and asking ourselves with a clean sheet of paper, with 20‐20 hindsight and perfect clarity, would we be organized the way we would build it from scratch knowing what we know now. And also, with the benefit of having been able to see what's worked and what's not worked as well as we had expected. And again, just really taking a very ground‐up, start‐to‐finish approach and it's our expectation that the results from this will be significant.” ‐ Joe Evans
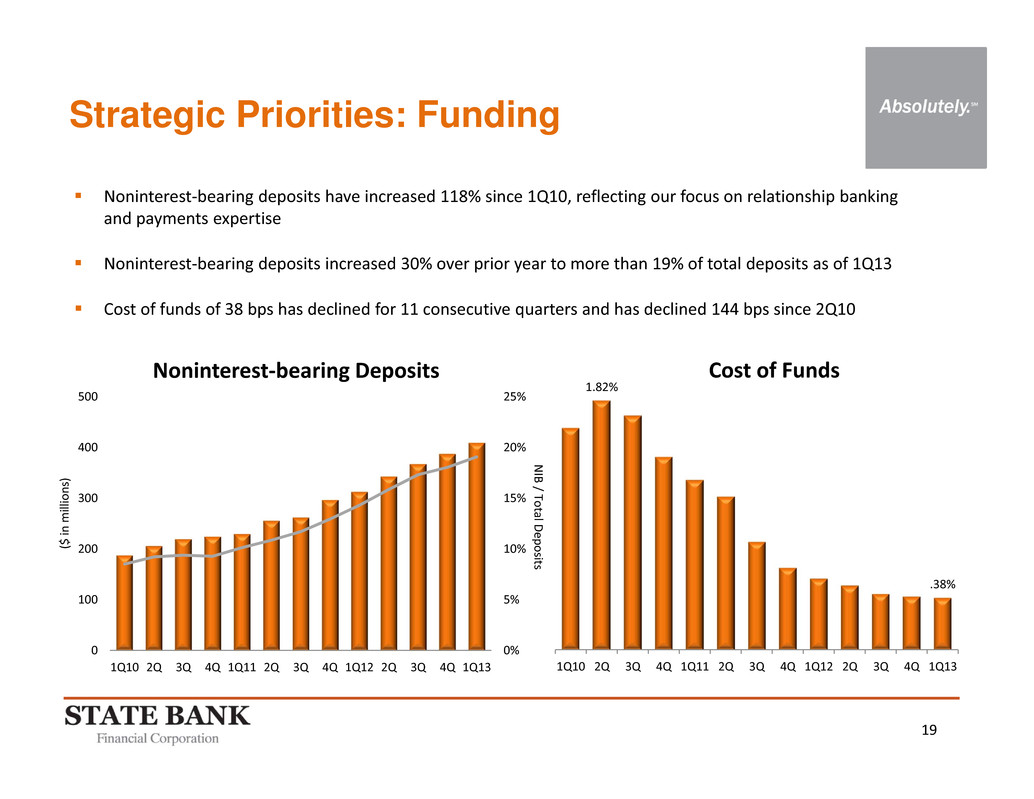
19 0% 5% 10% 15% 20% 25% 0 100 200 300 400 500 1Q10 2Q 3Q 4Q 1Q11 2Q 3Q 4Q 1Q12 2Q 3Q 4Q 1Q13 Noninterest‐bearing Deposits Noninterest‐bearing deposits have increased 118% since 1Q10, reflecting our focus on relationship banking and payments expertise Noninterest‐bearing deposits increased 30% over prior year to more than 19% of total deposits as of 1Q13 Cost of funds of 38 bps has declined for 11 consecutive quarters and has declined 144 bps since 2Q10 Strategic Priorities: Funding ( $ i n m i l l i o n s ) N IB / Total D eposits 1.82% .38% 1Q10 2Q 3Q 4Q 1Q11 2Q 3Q 4Q 1Q12 2Q 3Q 4Q 1Q13 Cost of Funds
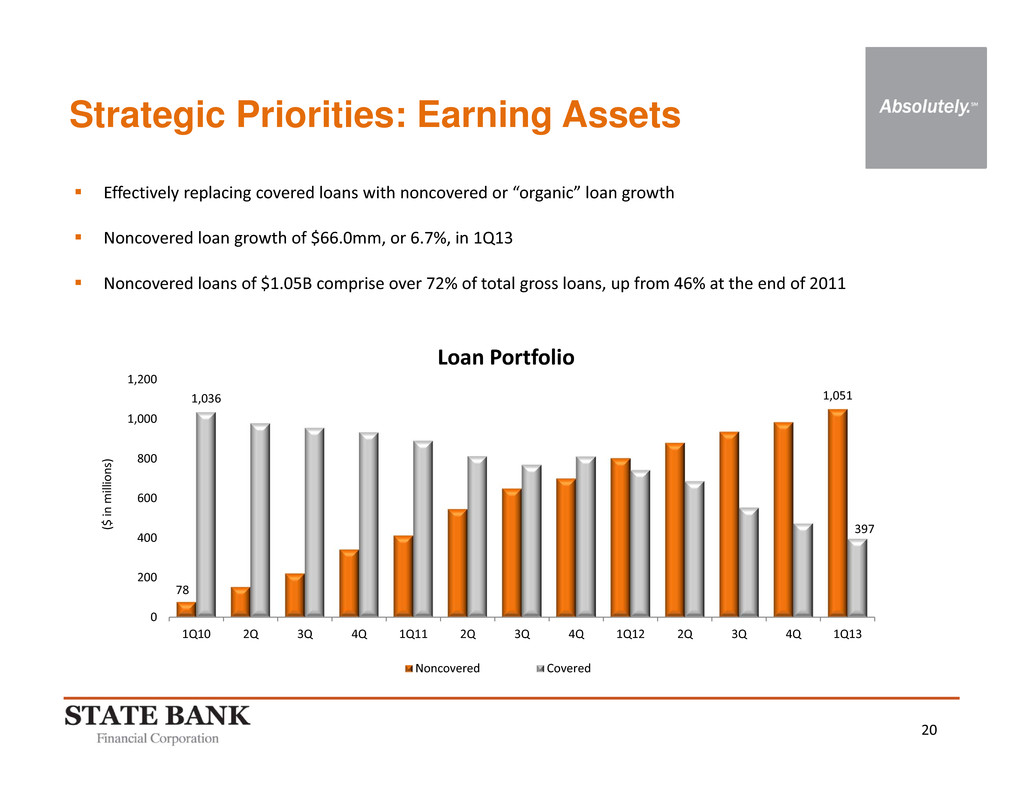
20 78 1,0511,036 397 0 200 400 600 800 1,000 1,200 1Q10 2Q 3Q 4Q 1Q11 2Q 3Q 4Q 1Q12 2Q 3Q 4Q 1Q13 Loan Portfolio Noncovered Covered Effectively replacing covered loans with noncovered or “organic” loan growth Noncovered loan growth of $66.0mm, or 6.7%, in 1Q13 Noncovered loans of $1.05B comprise over 72% of total gross loans, up from 46% at the end of 2011 ( $ i n m i l l i o n s ) Strategic Priorities: Earning Assets
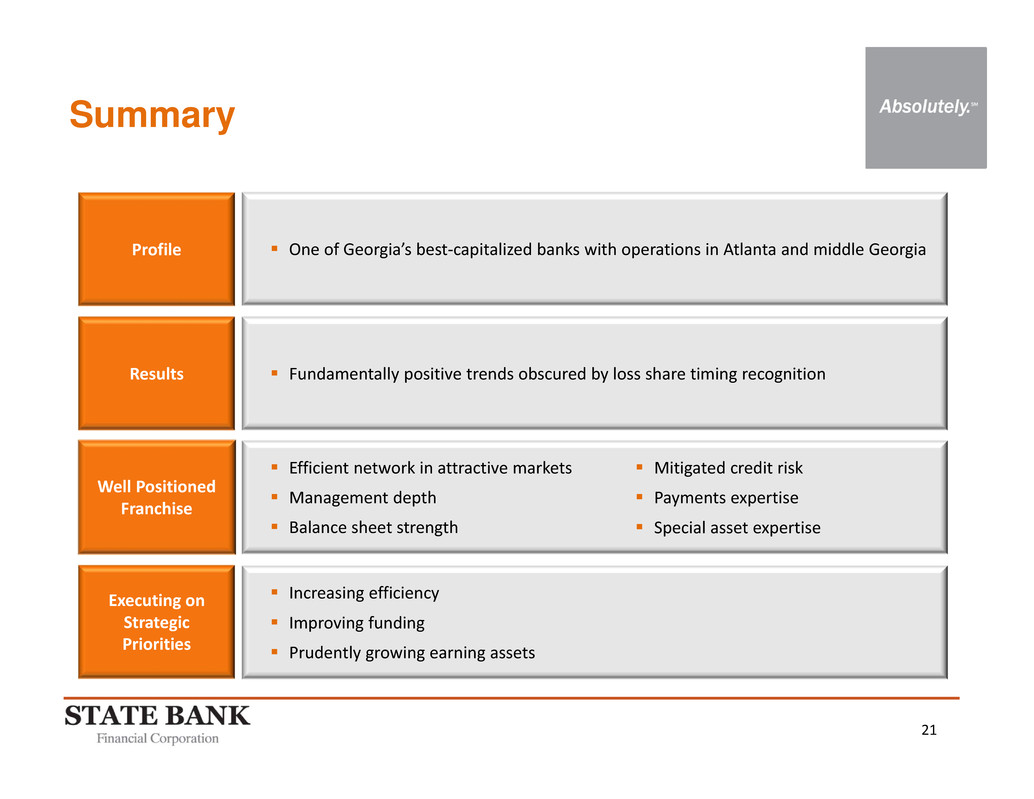
21 Summary Results Well Positioned Franchise Executing on Strategic Priorities Fundamentally positive trends obscured by loss share timing recognition Efficient network in attractive markets Management depth Balance sheet strength Increasing efficiency Improving funding Prudently growing earning assets Profile One of Georgia’s best‐capitalized banks with operations in Atlanta and middle Georgia Mitigated credit risk Payments expertise Special asset expertise
