Attached files
| file | filename |
|---|---|
| EX-23.1 - EX-23.1 - Marketo, Inc. | a2214086zex-23_1.htm |
Use these links to rapidly review the document
TABLE OF CONTENTS
INDEX TO CONSOLIDATED FINANCIAL STATEMENTS
As filed with the Securities and Exchange Commission on May 13, 2013
Registration No. 333-187689
UNITED STATES
SECURITIES AND EXCHANGE COMMISSION
Washington, D.C. 20549
Amendment No. 3
to
FORM S-1
REGISTRATION STATEMENT
Under
The Securities Act of 1933
MARKETO, INC.
(Exact name of registrant as specified in its charter)
| Delaware (State or other jurisdiction of incorporation or organization) |
7372 (Primary Standard Industrial Classification Code Number) |
56-2558241 (I.R.S. Employer Identification Number) |
901 Mariners Island Blvd., Suite 200
San Mateo, California 94404
(650) 376-2300
(Address, including zip code, and telephone number, including area code, of registrant's principal executive offices)
Phillip M. Fernandez
President and Chief Executive Officer
901 Mariners Island Blvd., Suite 200
San Mateo, California 94404
(650) 376-2300
(Name, address, including zip code, and telephone number, including area code, of agent for service)
| Copies to: | ||||
Aaron J. Alter Tony Jeffries Michael E. Coke Wilson Sonsini Goodrich & Rosati, P.C. 650 Page Mill Road Palo Alto, California 94304 (650) 493-9300 |
Sharon S. Zezima Vice President and General Counsel 901 Mariners Island Blvd., Suite 200 San Mateo, California 94404 (650) 376-2300 |
Anthony J. McCusker Richard A. Kline Goodwin Procter LLP 135 Commonwealth Drive Menlo Park, California 94025 (650) 752-3100 |
||
Approximate date of commencement of proposed sale to the public: As soon as practicable after this registration statement becomes effective.
If any of the securities being registered on this Form are to be offered on a delayed or continuous basis pursuant to Rule 415 under the Securities Act of 1933 check the following box: o
If this Form is filed to register additional securities for an offering pursuant to Rule 462(b) under the Securities Act, please check the following box and list the Securities Act registration statement number of the earlier effective registration statement for the same offering. o
If this Form is a post effective amendment filed pursuant to Rule 462(c) under the Securities Act, check the following box and list the Securities Act registration statement number of the earlier effective registration statement for the same offering. o
If this Form is a post effective amendment filed pursuant to Rule 462(d) under the Securities Act, check the following box and list the Securities Act registration statement number of the earlier effective registration statement for the same offering. o
Indicate by check mark whether the registrant is a large accelerated filer, an accelerated filer, a non-accelerated filer, or a smaller reporting company. See the definitions of "large accelerated filer", "accelerated filer" and "smaller reporting company" in Rule 12b-2 of the Exchange Act. (Check one):
| Large accelerated filer o | Accelerated filer o | Non-accelerated filer ý (do not check if a smaller reporting company) |
Smaller reporting company o |
CALCULATION OF REGISTRATION FEE
|
|||||||||||||
| Title of Each Class of Securities to be Registered |
Amount to be Registered(1) |
Proposed Maximum Offering Price Per Share |
Proposed Maximum Aggregate Offering Price(2) |
Amount of Registration Fee |
|||||||||
|---|---|---|---|---|---|---|---|---|---|---|---|---|---|
Common Stock, par value $0.0001 per share |
6,968,435 | $ | 13.00 | $ | 90,589,655 | $ | 12,357 | (3) | |||||
|
|||||||||||||
- (1)
- Estimated pursuant to Rule 457(a) under the Securities Act of 1933, as amended. Includes an additional 908,926 shares that the underwriters have the option to purchase.
- (2)
- Estimated solely for the purpose of calculating the registration fee.
- (3)
- Previously paid.
The registrant hereby amends this registration statement on such date or dates as may be necessary to delay its effective date until the registrant shall file a further amendment which specifically states that this registration statement shall thereafter become effective in accordance with Section 8(a) of the Securities Act of 1933 or until the registration statement shall become effective on such date as the Securities and Exchange Commission, acting pursuant to said Section 8(a), may determine.
The information in this preliminary prospectus is not complete and may be changed. These securities may not be sold until the registration statement filed with the Securities and Exchange Commission is effective. This preliminary prospectus is not an offer to sell nor does it seek an offer to buy these securities in any jurisdiction where the offer or sale is not permitted.
Subject to Completion. Dated May 13, 2013.
6,059,509 Shares

Common Stock
This is an initial public offering of shares of common stock of Marketo, Inc.
Marketo is offering 5,750,000 of the shares to be sold in the offering. The selling stockholders identified in this prospectus are offering an additional 309,509 shares. Marketo will not receive any of the proceeds from the sale of the shares being sold by the selling stockholders.
Prior to this offering, there has been no public market for the common stock. It is currently estimated that the initial public offering price per share will be between $11.00 and $13.00. Our common stock has been approved for listing on The NASDAQ Global Select Market under the symbol "MKTO".
We are an "emerging growth company" as defined under the federal securities laws and are therefore subject to reduced public company reporting requirements.
Funds affiliated with Battery Ventures, an existing stockholder of Marketo, have entered into a stock purchase agreement with us pursuant to which they will purchase 500,000 shares of our common stock at a price per share equal to the initial public offering price in a private placement to close immediately subsequent to the closing of this offering.
Investing in our common stock involves risks. See "Risk Factors" on page 11 to read about factors you should consider before buying shares of our common stock.
Neither the Securities and Exchange Commission nor any other regulatory body has approved or disapproved of these securities or passed upon the accuracy or adequacy of this prospectus. Any representation to the contrary is a criminal offense.
| |
Per Share
|
Total
|
|||||
|---|---|---|---|---|---|---|---|
Initial public offering price |
$ | $ | |||||
Underwriting discount(1) |
$ | $ | |||||
Proceeds, before expenses, to Marketo |
$ | $ | |||||
Proceeds, before expenses, to the selling stockholders |
$ | $ | |||||
- (1)
- See "Underwriting" for a description of the compensation payable to the underwriters.
To the extent that the underwriters sell more than 6,059,509 shares of common stock, the underwriters have the option to purchase up to an additional 908,926 shares from Marketo at the initial public offering price less the underwriting discount.
The underwriters expect to deliver the shares against payment in New York, New York on , 2013.
| Goldman, Sachs & Co. | Credit Suisse | |||||
UBS Investment Bank |
Canaccord Genuity |
Raymond James |
JMP Securities |
|||
Prospectus dated , 2013
Through and including , 2013 (the 25th day after the date of this prospectus), all dealers effecting transactions in these securities, whether or not participating in this offering, may be required to deliver a prospectus. This is in addition to a dealer's obligation to deliver a prospectus when acting as an underwriter and with respect to an unsold allotment or subscription.
Neither we nor the underwriters have authorized anyone to provide any information or to make any representations other than those contained in this prospectus or in any free writing prospectuses we have prepared. We take no responsibility for, and can provide no assurance as to the reliability of, any other information that others may give you. This prospectus is an offer to sell only the shares offered hereby, but only under circumstances and in jurisdictions where it is lawful to do so. The information contained in this prospectus is current only as of its date.
For investors outside the United States: Neither we nor any of the underwriters have done anything that would permit this offering or possession or distribution of this prospectus in any jurisdiction where action for that purpose is required, other than in the United States. You are required to inform yourselves about, and to observe any restrictions relating to, this offering and the distribution of this prospectus.
i
This summary highlights selected information appearing elsewhere in this prospectus and is qualified in its entirety by the more detailed information and financial statements included elsewhere in this prospectus. This summary may not contain all the information you should consider before investing in our common stock. You should carefully read this prospectus in its entirety before investing in our common stock, including the sections titled "Risk Factors" and "Management's Discussion and Analysis of Financial Condition and Results of Operations" and our consolidated financial statements and related notes included elsewhere in this prospectus. Unless the context otherwise requires, we use the terms "Marketo", the "Company", "we", "us" and "our" in this prospectus to refer to Marketo, Inc. and, where appropriate, our consolidated subsidiaries.
We are the provider of a leading cloud-based marketing software platform that enables organizations to engage in modern relationship marketing. Large-scale trends, such as increasingly self-directed consumers and broad and instant availability of information online, are changing the role and responsibilities of the marketing department in most organizations around the world. In today's data-centric, multi-channel business environment, marketing professionals are being pushed to fundamentally change how they engage and interact with prospects and customers. Our software platform is designed to enable the effective execution, management and analytical measurement of relationship marketing activities, helping organizations to acquire new customers more efficiently, build stronger relationships with existing customers, improve sales effectiveness and drive faster revenue growth.
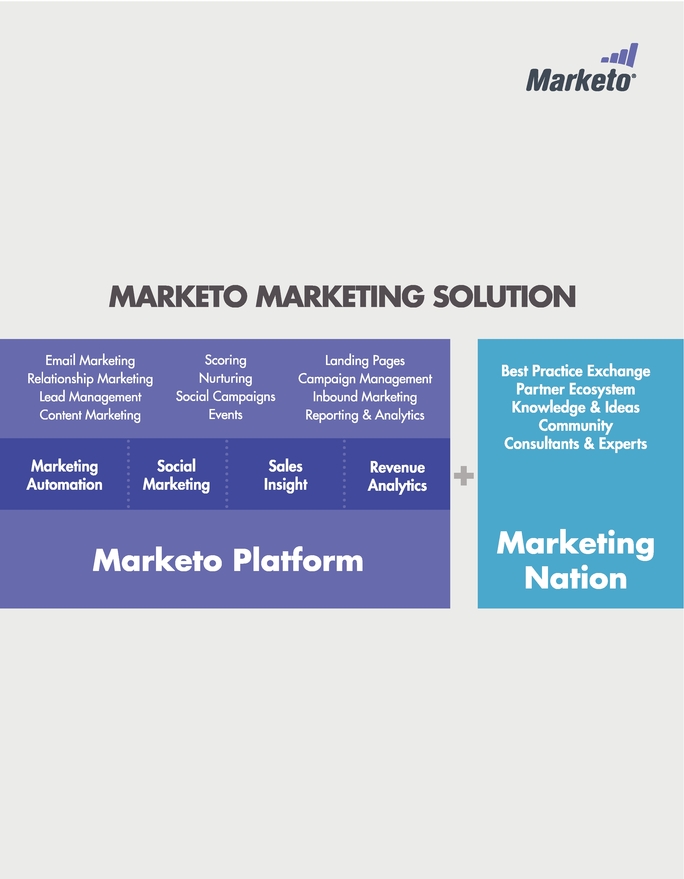
On our platform, we deliver an easy-to-use, integrated suite of advanced applications, which today include Marketing Automation, Social Marketing, Sales Insight and Revenue Analytics. To enable our customers to obtain maximum value from our platform, we have created an ecosystem of third-party applications, as well as a network of resources to foster marketing thought leadership, sharing and collaboration among our users. Furthermore, we provide our customers with expert professional services, delivered by marketers, for marketers, to enable rapid time to value through effective implementation and use of our solutions.
We designed our platform to be valuable across large enterprises and small and medium-sized businesses (SMBs) that sell to both businesses and consumers in virtually any industry. Our client base is diverse, with over 2,300 customers across a wide range of industries including business services, consumer, financial services, healthcare, manufacturing, media, technology and telecommunications. We market and sell our products directly and through a growing network of distribution partners. Representative customers include one or more divisions of the following companies: Capgemini, CenturyLink, Citrix, Gannett, General Electric, Medtronic, Moody's, Panasonic, Symantec and Universal Music Group. Except for a single customer in 2011 who was slightly over 1%, no single customer represented more than 1% of subscription and support revenue in 2010, 2011, 2012 or the three months ended March 31, 2012 or 2013.
We provide our solutions on a subscription basis and generated revenue of $14.0 million, $32.4 million and $58.4 million in 2010, 2011 and 2012, respectively, representing year-over-year increases of 131% and 80%, respectively. During the three months ended March 31, 2012 and 2013, we generated revenue of $12.2 million and $19.7 million, respectively, representing an increase of 62% during the first quarter of 2013 as compared to the first quarter of 2012. We had net losses of $11.8 million, $22.6 million, $34.4 million, $6.7 million and $9.5 million in 2010, 2011, 2012 and for the three months ended March 31, 2012 and 2013, respectively, due to increased investments in our growth. As of March 31, 2013, we had an accumulated deficit of $91.7 million.
1
Buyers of consumer and business goods and services are increasingly becoming self directed in their purchase decision making. With a wide range of information available across multiple online, social and offline channels and with an increased ability to opt out of unwanted communications, the manner in which buyers obtain information and make decisions about purchases is undergoing a dramatic transformation. Buyers are spending more time gathering information from search engines, company websites, blogs, online product reviews and social networks. As a result, brand perceptions are formed and significant purchasing decisions are often made prior to or without any direct contact with a salesperson or seeing a product in a retail setting.
At the same time, there is a growing range of digital information about prospects and customers that can be captured by marketers, including unstructured and diverse behavioral data such as purchase history, website visits, webinar attendance, video consumption, document downloads, telephonic and email inquiries and social network activity. This presents an opportunity for marketers to capture, analyze and leverage this information to deliver timely and relevant messages to their targeted audiences and to enable their salespeople to focus on their most promising opportunities. This, in turn, allows companies to allocate their marketing investments more effectively.
These trends have led to the emergence of a modern approach to relationship marketing, requiring marketers to fundamentally change how they engage with prospects and customers. Marketers now must engage with each customer in an individual and personalized dialog over time, facilitating the customer's self-directed research and decision-making, and stimulating buying. Used effectively, this approach enables modern marketers to significantly and measurably enhance an organization's ability to grow revenue, maximize return on investments in marketing and increase customer lifetime value.
The result is that marketing professionals now seek a new generation of software solutions that effectively leverage behavioral data and automation techniques to enable them to build and maintain personalized customer relationships at scale, and hence to become central catalysts for revenue growth in their companies. Marketers already invest significant funds in pursuit of revenue. According to the CMO Council's report, The 2011 State of Marketing, global marketing and communications spending exceeds $1.5 trillion annually. Companies of all sizes are spending greater portions of their marketing budgets on technology to achieve higher productivity and better business results. For instance, according to research firm IDC's 2012 CMO Tech Marketing Barometer Study, technology CMOs estimate that 8.7% of their total marketing program budget will be spent on marketing IT. We believe that our platform addresses several established segments of marketing-related software that in aggregate have been estimated by Gartner to be approximately $32 billion in 2013. These segments include customer relationship management, business intelligence, and web conferencing, teaming platforms and social software suites. Gartner expects the aggregate of these segments to grow to nearly $41 billion by 2016.
We are the provider of a leading cloud-based marketing software platform that is purpose-built to enable organizations ranging from SMBs to the world's largest enterprises to engage in modern relationship marketing. Our platform enables the effective execution, management and analytical measurement of online, social and offline marketing activities and customer interactions. Our software solution is complemented by resources, tools and expertise designed to help our customers collaborate, learn and get better results faster.
2
The key benefits of our solution include:
- •
- Drives faster revenue
growth. Our solution enables organizations to more effectively and efficiently acquire new customers, improve sales effectiveness and
generate faster revenue growth.
- •
- Enables organizations to better build and retain long-term
customer relationships. Our solution enables organizations to engage in personalized and interactive multi-channel dialogs with their
prospects and customers, resulting in deep, long-lasting relationships that increase customer lifetime value.
- •
- Streamlines the marketer's
world. Our solution enables organizations to manage entire multi-channel marketing campaigns and related customer interactions from a
single platform. This combines and advances the capabilities of a broad array of discrete point products in the market today, reducing complexity and costs.
- •
- Increases efficiency and speed of marketing
execution. Our solution is designed to be intuitive and easy to use so that marketers can efficiently use its many features without
requiring extensive training or specialized technical skills. The elements of our solution work together to simplify and automate repetitive tasks, so organizations can rapidly turn new marketing
ideas into revenue opportunities.
- •
- Provides deep analytical insight. Our solution serves as the system of record for data across marketing campaigns and channels and connects to other complementary enterprise data sources. Our analytics capabilities help our customers measure the effectiveness and the revenue generation impact of their marketing activities.
Our key competitive strengths include:
- •
- Ease of
use. Our solution is designed to enable users to rapidly adopt and use our platform to manage their marketing activities, from the
simple to the most sophisticated tasks, and to do so with little or no need for technical skills or IT support.
- •
- Powerful
capabilities. Our solution is designed to give users progressive access to increasingly powerful features when they need them, and
offers significant headroom in the richness of the campaigns they can create as well as the analytic questions they can answer.
- •
- Complete
platform. We offer a suite of applications that are tightly integrated and deliver a broad range of capabilities that would otherwise
require the purchase and use of multiple disparate point solutions such as email marketing tools, social campaign products and business intelligence software.
- •
- Enterprise
integration. Our platform offers extensible integration with a range of enterprise-wide processes and systems, including
customer relationship management (CRM) systems, e-commerce platforms, in-house databases and custom applications. In addition, we have developed specialized integrations with
industry-leading CRM solutions including salesforce.com and Microsoft Dynamics CRM to allow marketing, sales and service professionals to work collaboratively.
- •
- Thought leadership. We strive to be a thought leader in our industry, identifying and interpreting emerging trends in relationship marketing, shaping and guiding industry dialog, and creating and sharing the best marketing practices.
3
- •
- Network
effects. The extended Marketo community includes over 2,300 customers, 27,000 online community members and over 100 partners who share
their experiences, best practices and ready-to-use marketing campaign templates with other Marketo users. We call this the Marketing Nation. The growth of this community
creates a network effect as the expanded access to expertise and information benefits all participants and becomes increasingly valuable to our current and prospective customers.
- •
- Independence. We are an independent marketing software company exclusively focused on providing innovative marketing technologies, solutions and content for the modern marketing professional. Our independence enables us to continue to innovate and deliver advanced, differentiated marketing solutions, and to work with a broader set of partners, providing us a competitive advantage in the industry.
Key elements of our growth strategy are to:
- •
- Acquire new
customers. We plan to acquire an increasing number of customers through the expansion of our direct sales teams. We also intend to
expand our indirect sales teams to pursue additional channel, agency and OEM distribution partnerships, and to selectively enter new geographic markets.
- •
- Expand within our existing customer
base. We intend to increase revenue from existing customers, many of whom initially purchase a component of our solution for a subset of
users, and subsequently expand the use of our solutions.
- •
- Further penetrate additional markets and
verticals. Although to date a majority of our customers and revenue has been derived from the
business-to-business (B2B) market, we have had initial success in selling into the business-to-consumer (B2C) market and intend to continue to target a
range of B2C industries. In addition, we intend to expand our vertical marketing efforts in order to increase the depth of our market penetration in certain industries.
- •
- Continue to innovate and extend our marketing thought
leadership. We plan to continually develop new applications that enhance the functionality of our solution and address the latest
opportunities and challenges for marketers, which we will sell to both existing and new customers. We also intend to leverage our competitive strength in marketing thought leadership to advance our
solutions and to deliver rich content and robust services that provide differentiated value to our customers.
- •
- Pursue selective strategic acquisitions. We intend to selectively acquire businesses and technologies as we did with the acquisition of Crowd Factory in April 2012. We plan to evaluate opportunities that will strengthen and expand the functionality of our platform and provide access to new customers or markets.
In May 2013, we entered into a stock purchase agreement with funds affiliated with Battery Ventures, which currently beneficially owns approximately 2.1 million shares of our common stock, pursuant to which such funds will purchase 500,000 shares of our common stock at a price per share equal to the initial public offering price in a private placement to close immediately subsequent to the closing of this offering. After giving effect to this offering and the private placement, Battery Ventures will beneficially own approximately 7.3% of our outstanding common stock.
4
Our business is subject to numerous risks and uncertainties, including those highlighted in the section titled "Risk Factors" immediately following this prospectus summary. These risks include, but are not limited to, the following:
- •
- We have a history of losses and may not achieve consistent profitability in the future.
- •
- If we are unable to attract new customers or sell additional services and functionality to our existing customers, our
revenue growth will be adversely affected.
- •
- If subscription renewal rates decrease, or we do not accurately predict subscription renewal rates, our future revenue and
operating results may be harmed.
- •
- If we are unable to maintain a good relationship with salesforce.com and develop and grow our relationships with other
platform providers, our business will suffer.
- •
- We face significant competition from both established and new companies offering marketing software and other related
applications, as well as internally developed software, which may harm our ability to add new customers, retain existing customers and grow our business.
- •
- Our recent rapid growth may not be indicative of our future growth and, if we continue to grow rapidly, we may not be able
to manage our growth effectively.
- •
- If our or our customers' security measures are compromised or unauthorized access to customer data is otherwise obtained,
our marketing software may be perceived as not being secure, customers may curtail or cease their use of our solutions, our reputation may be harmed and we may incur significant liabilities.
- •
- Interruptions to or degraded performance of our service could result in customer dissatisfaction, damage to our
reputation, loss of customers, limited growth and reduction in revenue.
- •
- If we are unable to further penetrate the B2C market and additional vertical industries, our revenue may not grow and our
operating results may be harmed.
- •
- We may experience quarterly fluctuations in our operating results due to a number of factors, which makes our future results difficult to predict and could cause our operating results to fall below expectations or our guidance.
Our principal executive offices are located at 901 Mariners Island Blvd, Suite 200, San Mateo, California 94404, and our telephone number is (650) 376-2300. Our website is www.marketo.com. Information contained on, or that can be accessed through, our website is not incorporated by reference into this prospectus, and you should not consider information on our website to be part of this prospectus. We were incorporated in California in January 2006 and reincorporated in Delaware in January 2010.
Marketo, the Marketo logo, Marketing Nation, LaunchPoint and other trademarks or service marks of Marketo appearing in this prospectus are the property of Marketo. Trade names, trademarks and service marks of other companies appearing in this prospectus are the property of their respective holders. We have omitted the ® and ™ designations, as applicable, for the trademarks used in this prospectus.
We are an emerging growth company as defined in the Jumpstart Our Business Startups Act of 2012 (JOBS Act). We will remain an emerging growth company until the earliest to occur of: the last day of the fiscal year in which we have more than $1.0 billion in annual revenue; the date we qualify as a "large accelerated filer", with at least $700 million of equity securities held by non-affiliates; the issuance, in any three-year period, by us of more than $1.0 billion in non-convertible debt securities; and the last day of the fiscal year ending after the fifth anniversary of our initial public offering.
5
Common stock offered by us |
5,750,000 shares | |
Common stock offered by the selling stockholders |
309,509 shares |
|
Total common stock offered |
6,059,509 shares |
|
Common stock sold by us in the concurrent private placement |
Immediately subsequent to the closing of this offering, funds affiliated with Battery Ventures will purchase from us in a private placement 500,000 shares of our common stock at a price per share equal to the initial public offering price. Based on an assumed initial public offering price of $12.00 per share, which is the midpoint of the range set forth on the cover of this prospectus, this would be equal to $6.0 million in additional proceeds to us. We will receive the full proceeds and will not pay any underwriting discounts or commissions with respect to the shares that are sold in the private placement. The sale of these shares to Battery Ventures will not be registered in this offering and will be subject to a lock-up of 180 days. We refer to the private placement of these shares of common stock as the concurrent private placement. |
|
Common stock to be outstanding after this offering and the concurrent private placement |
35,784,149 shares |
|
Option to purchase additional shares |
We have granted the underwriters an option, exercisable for 30 days after the date of this prospectus, to purchase up to an additional 908,926 shares from us. |
|
Use of proceeds |
We intend to use the net proceeds from this offering and the concurrent private placement for working capital and other general corporate purposes. We also may use a portion of the net proceeds to acquire or invest in complementary businesses, products, services, technologies or other assets. However, we do not have agreements or commitments for any specific acquisitions or investments at this time. See "Use of Proceeds". |
|
Concentration of ownership |
Upon completion of this offering and the concurrent private placement, the executive officers, directors and 5% stockholders of our company and their affiliates will beneficially own, in the aggregate, approximately 76.0% of our outstanding capital stock. |
|
NASDAQ trading symbol |
"MKTO" |
The number of shares of our common stock to be outstanding after this offering and the concurrent private placement is based on 29,312,846 shares of our common stock outstanding assuming the conversion of the convertible preferred stock outstanding as of March 31, 2013 and
6
221,303 shares to be sold in this offering by certain selling stockholders upon the exercise of options and the vesting and settlement of restricted stock units, and excludes:
- •
- 7,982,829 shares of common stock issuable upon the exercise of options outstanding as of March 31, 2013 (other than
144,915 shares to be sold in this offering by certain selling stockholders upon the exercise of options), with a weighted average exercise price of $4.17 per share;
- •
- 345,614 shares of common stock issuable upon vesting of restricted stock units outstanding as of March 31, 2013
(other than 76,388 shares to be sold in this offering by certain selling stockholders upon the vesting and settlement of restricted stock units); and
- •
- 4,199,832 shares of common stock reserved for future issuance under our stock-based compensation plans, consisting of 509,670 shares of common stock reserved for future issuance under our 2006 Stock Plan, which shares will be added to the shares to be reserved under our 2013 Equity Incentive Plan, 2,952,130 shares of common stock reserved for future issuance under our 2013 Equity Incentive Plan, which will become effective in connection with this offering, 738,032 shares of common stock reserved for future issuance under our 2013 Employee Stock Purchase Plan, which will become effective in connection with this offering, and shares that become available under our 2013 Equity Incentive Plan and 2013 Employee Stock Purchase Plan, pursuant to provisions thereof that automatically increase the share reserves under the plans each year, as more fully described in "Executive Compensation — Employee Benefit and Stock Plans".
Unless otherwise noted, the information in this prospectus reflects and assumes the following:
- •
- a one-for-two reverse stock split effected on May 3, 2013;
- •
- the conversion of all outstanding shares of our convertible preferred stock into an aggregate of 25,876,142 shares of
common stock immediately prior to the completion of this offering;
- •
- the issuance of 500,000 shares of common stock to funds affiliated with Battery Ventures upon the closing of the
concurrent private placement;
- •
- the filing of our amended and restated certificate of incorporation in connection with the completion of this offering;
- •
- no exercise of outstanding options or settlement of outstanding RSUs; and
- •
- no exercise by the underwriters of their option to purchase up to an additional 908,926 shares of common stock from us in this offering.
7
SUMMARY CONSOLIDATED FINANCIAL DATA
The following tables summarize our consolidated financial data. You should read the summary consolidated financial data set forth below in conjunction with our consolidated financial statements, the notes to our consolidated financial statements and the section titled "Management's Discussion and Analysis of Financial Condition and Results of Operations" contained elsewhere in this prospectus.
We derived the summary consolidated statements of operations data for the years ended December 31, 2010, 2011 and 2012 and the consolidated balance sheet data as of December 31, 2012 from our audited consolidated financial statements included elsewhere in this prospectus. We derived the summary consolidated statements of operations data for the three months ended March 31, 2012 and 2013 and the consolidated balance sheet data as of March 31, 2013 from our unaudited interim consolidated financial statements included elsewhere in this prospectus. The unaudited interim consolidated financial statements were prepared on a basis consistent with our audited financial statements and include, in our opinion, all adjustments, consisting only of normal recurring adjustments that we consider necessary for a fair presentation of the financial information set forth in those statements. Our historical results are not necessarily indicative of the results that
8
may be expected in any future period, and our interim results are not necessarily indicative of the results to be expected for the full year or any other period.
| |
Year Ended December 31, | Three Months Ended March 31, |
||||||||||||||
|---|---|---|---|---|---|---|---|---|---|---|---|---|---|---|---|---|
| |
2010
|
2011
|
2012
|
2012
|
2013
|
|||||||||||
| |
(in thousands, except per share data) |
|||||||||||||||
| |
|
|
|
(unaudited) |
||||||||||||
Consolidated Statements of Operations Data: |
||||||||||||||||
Revenue: |
||||||||||||||||
Subscription and support |
$ | 13,473 | $ | 29,823 | $ | 52,756 | $ | 11,021 | $ | 17,555 | ||||||
Professional services and other |
559 | 2,569 | 5,657 | 1,190 | 2,181 | |||||||||||
Total revenue |
14,032 | 32,392 | 58,413 | 12,211 | 19,736 | |||||||||||
Cost of revenue(1): |
||||||||||||||||
Subscription and support |
4,612 | 9,386 | 16,216 | 3,135 | 5,820 | |||||||||||
Professional services and other |
2,534 | 5,550 | 8,442 | 1,805 | 2,618 | |||||||||||
Total cost of revenue |
7,146 | 14,936 | 24,658 | 4,940 | 8,438 | |||||||||||
Gross profit: |
||||||||||||||||
Subscription and support |
8,861 | 20,437 | 36,540 | 7,886 | 11,735 | |||||||||||
Professional services and other |
(1,975 | ) | (2,981 | ) | (2,785 | ) | (615 | ) | (437 | ) | ||||||
Total gross profit |
6,886 | 17,456 | 33,755 | 7,271 | 11,298 | |||||||||||
Operating expenses(1): |
||||||||||||||||
Research and development |
5,498 | 10,677 | 18,799 | 3,835 | 4,996 | |||||||||||
Sales and marketing |
11,019 | 23,088 | 37,776 | 7,819 | 12,318 | |||||||||||
General and administrative |
2,135 | 6,154 | 11,388 | 2,255 | 3,427 | |||||||||||
Total operating expenses |
18,652 | 39,919 | 67,963 | 13,909 | 20,741 | |||||||||||
Loss from operations |
(11,766 | ) | (22,463 | ) | (34,208 | ) | (6,638 | ) | (9,443 | ) | ||||||
Other income (expense), net |
(50 | ) | (137 | ) | (158 | ) | (15 | ) | (61 | ) | ||||||
Loss before provision for income taxes |
(11,816 | ) | (22,600 | ) | (34,366 | ) | (6,653 | ) | (9,504 | ) | ||||||
Provision for income taxes |
1 | 6 | 19 | 3 | 20 | |||||||||||
Net loss |
$ | (11,817 | ) | $ | (22,606 | ) | $ | (34,385 | ) | $ | (6,656 | ) | $ | (9,524 | ) | |
Net loss attributable to common stockholders: |
||||||||||||||||
Basic and diluted |
$ | (11,817 | ) | $ | (22,606 | ) | $ | (34,385 | ) | $ | (6,656 | ) | $ | (9,524 | ) | |
Net loss per share attributable to common stockholders: |
||||||||||||||||
Basic and diluted |
$ | (5.99 | ) | $ | (9.94 | ) | $ | (12.26 | ) | $ | (2.60 | ) | $ | (2.99 | ) | |
Weighted average shares used in computing net loss per share attributable to common stockholders: |
||||||||||||||||
Basic and diluted |
1,972 | 2,274 | 2,806 | 2,558 | 3,181 | |||||||||||
Pro forma net loss per share attributable to common stockholders: |
||||||||||||||||
Basic and diluted |
$ | (1.21 | ) | $ | (0.33 | ) | ||||||||||
Weighted average shares used in computing pro forma net loss per share attributable to common stockholders: |
||||||||||||||||
Basic and diluted |
28,435 | 29,057 | ||||||||||||||
9
- (1)
- Amounts include stock-based compensation expense as follows:
| |
Year Ended December 31, |
Three Months Ended March 31, |
||||||||||||||
|---|---|---|---|---|---|---|---|---|---|---|---|---|---|---|---|---|
| |
2010
|
2011
|
2012
|
2012
|
2013
|
|||||||||||
| |
(in thousands) |
|||||||||||||||
| |
|
|
|
(unaudited) |
||||||||||||
Cost of subscription and support revenue |
$ | 50 | $ | 108 | $ | 216 | $ | 30 | $ | 63 | ||||||
Cost of professional services and other revenue |
8 | 49 | 169 | 31 | 93 | |||||||||||
Research and development |
73 | 294 | 575 | 111 | 210 | |||||||||||
Sales and marketing |
57 | 509 | 966 | 206 | 230 | |||||||||||
General and administrative |
131 | 349 | 1,046 | 135 | 405 | |||||||||||
Total stock-based compensation expense |
$ | 319 | $ | 1,309 | $ | 2,972 | $ | 513 | $ | 1,001 | ||||||
| |
March 31, 2013 | |||||||||
|---|---|---|---|---|---|---|---|---|---|---|
| |
Actual | Pro Forma(1)
|
Pro Forma As Adjusted(2) |
|||||||
| |
(in thousands) |
|||||||||
Consolidated Balance Sheet Data: |
||||||||||
Cash and cash equivalents |
$ | 36,176 | $ | 36,176 | $ | 102,872 | ||||
Working capital |
18,931 | 18,931 | 85,627 | |||||||
Total assets |
75,866 | 75,866 | 142,562 | |||||||
Total indebtedness |
3,640 | 3,640 | 3,640 | |||||||
Deferred revenue |
24,508 | 24,508 | 24,508 | |||||||
Total liabilities |
40,266 | 40,266 | 40,266 | |||||||
Convertible preferred stock |
119,121 | — | — | |||||||
Total stockholders' equity |
35,600 | 35,600 | 102,296 | |||||||
- (1)
- The
pro forma column reflects the automatic conversion of all outstanding shares of our convertible preferred stock into 25,876,142 shares of our common
stock immediately prior to the closing of this offering.
- (2)
- The pro forma as adjusted column gives effect to (i) the pro forma adjustments set forth in footnote 1 above, (ii) the sale by us of 5,750,000 shares of our common stock offered by this prospectus at an assumed initial public offering price of $12.00 per share, which is the midpoint of the estimated offering price range set forth on the cover page of this prospectus, after deducting estimated underwriting discounts and commissions and estimated offering expenses, (iii) the sale of 500,000 shares of common stock to be purchased from us by Battery Ventures in the concurrent private placement at an assumed offering price of $12.00 per share, which is the midpoint of the estimated offering price range of our initial public offering set forth on the cover of this prospectus, and (iv) the issuance of 221,303 shares of common stock to be acquired by certain selling stockholders upon the exercise of options and the vesting and settlement of restricted stock units in order to sell those shares in the offering.
The pro forma as adjusted information presented in the consolidated balance sheet data is illustrative only and will change based on the actual initial public offering price and other terms of this offering determined at pricing. Each $1.00 increase or decrease in the assumed initial public offering price of $12.00 per share, which is the midpoint of the estimated offering price range set forth on the cover page of this prospectus, would increase or decrease, as applicable, each of cash and cash equivalents, working capital, total assets and total stockholders' equity on a pro forma as adjusted basis by approximately $5.8 million, assuming that the number of shares offered by us, as set forth on the cover page of this prospectus, remains the same and after deducting estimated underwriting discounts and commissions and estimated offering expenses.
10
Investing in our common stock involves a high degree of risk. You should consider carefully the risks and uncertainties described below, together with all of the other information in this prospectus, including our consolidated financial statements and related notes, before deciding whether to purchase shares of our common stock. If any of the following risks is realized, our business, financial condition, operating results and prospects could be materially and adversely affected. In that event, the price of our common stock could decline and you could lose part or all of your investment.
Risks Related to Our Business and Industry
We have a history of losses and may not achieve consistent profitability in the future.
We generated net losses of $11.8 million, $22.6 million, $34.4 million, $6.7 million and $9.5 million in 2010, 2011, 2012 and for the three months ended March 31, 2012 and 2013, respectively. As of March 31, 2013, we had an accumulated deficit of $91.7 million. We will need to generate and sustain increased revenue levels in future periods in order to become consistently profitable, and, even if we do, we may not be able to maintain or increase our level of profitability. We intend to continue to expend significant funds to expand our marketing and sales operations, develop and enhance our marketing software, meet the increased compliance requirements associated with our transition to and operation as a public company, upgrade our data center infrastructure and services capabilities and expand into new markets. Historically, we also have experienced negative gross margins on our professional services, which are expected to continue to be negative. Our efforts to grow our business may be more costly than we expect, and we may not be able to increase our revenue enough to offset our higher operating expenses. We may incur significant losses in the future for a number of reasons, including the other risks described in this prospectus, and unforeseen expenses, difficulties, complications and delays and other unknown events. If we are unable to achieve and sustain profitability, the market price of our common stock may significantly decrease.
If we are unable to attract new customers or sell additional services and functionality to our existing customers, our revenue growth will be adversely affected.
To increase our revenue, we must add new customers, encourage existing customers to renew their subscriptions on terms favorable to us, increase their usage of our solutions, and sell additional functionality to existing customers. As our industry matures, as interactive channels develop further, or as competitors introduce lower cost and/or differentiated products or services that are perceived to compete with ours, our ability to sell and renew based on pricing, technology and functionality could be impaired. As a result, we may be unable to renew our agreements with existing customers or attract new customers or new business from existing customers on terms that would be favorable or comparable to prior periods, which could have an adverse effect on our revenue and growth.
If subscription renewal rates decrease, or we do not accurately predict subscription renewal rates, our future revenue and operating results may be harmed.
Our customers have no obligation to renew their subscriptions for our software after the expiration of their subscription period, which is typically one year, but ranges from one quarter to three years. In addition, our customers may renew for lower subscription amounts or for shorter contract lengths. We may not accurately predict renewal rates for our customers. Our renewal rates may decline or fluctuate as a result of a number of factors, including customer usage, pricing changes, number of applications used by our customers, customer satisfaction with our service, the acquisition of our customers by other companies and deteriorating general economic conditions. If
11
our customers do not renew their subscriptions for our service or decrease the amount they spend with us, our revenue will decline and our business will suffer.
If we are unable to maintain a good relationship with salesforce.com and develop and grow our relationships with other platform providers, our business will suffer.
As of March 31, 2013, approximately 76% of our customers integrated our solution with certain capabilities of salesforce.com using publicly available application programming interfaces (APIs). In general, we rely on the fact that salesforce.com continues to allow us access to its APIs to enable these customer integrations. To date, we have not relied on a long-term written contract to govern our relationship with salesforce.com. Instead, we are subject to the standard terms and conditions for application developers of salesforce.com, which govern the distribution, operation and fees of applications on the salesforce.com platform, and which are subject to change by salesforce.com from time to time. While we expect to continue to generate the majority of our revenue from our customers using the salesforce.com platform in the near term, we also integrate our solutions with other platform providers, including Microsoft, NetSuite, Oracle, SAP and SugarCRM. Any deterioration in our relationship with any platform provider would harm our business and adversely affect our operating results.
Our business may be harmed if any platform provider:
- •
- discontinues or limits access to its APIs by us;
- •
- terminates or does not allow us to renew or replace our contractual relationship;
- •
- modifies its terms of service or other policies, including fees charged to, or other restrictions on, us, other
application developers, or changes how customer information is accessed by us or our customers;
- •
- establishes more favorable relationships with one or more of our competitors, or acquires one or more of our competitors
and offers competing services to us, such as may be the case with the acquisition of Eloqua by Oracle; or
- •
- otherwise develops its own competitive offerings.
In addition, we have benefited from these platform providers' brand recognition, reputations and customer bases. Any losses or shifts in the market position of these platform providers in general, in relation to one another or to new competitors or new technologies could lead to losses in our relationships or customers, or our need to identify or transition to alternative channels for marketing our solutions. Any such requirements for changes or shifts on us could consume substantial resources and may not be effective. Any such changes in the future could negatively impact our ability to reach our prospective customers, which would harm our business.
We face significant competition from both established and new companies offering marketing software and other related applications, as well as internally developed software, which may harm our ability to add new customers, retain existing customers and grow our business.
The marketing software market is evolving, highly competitive and significantly fragmented. We expect competition to continue to increase in the future. With the introduction of new technologies and the potential entry of new competitors into the market, we expect competition to persist and intensify in the future, which could harm our ability to increase sales, maintain or increase renewals and maintain our prices.
We face intense competition from other software companies that develop marketing software and from marketing services companies that provide interactive marketing services. Competition could significantly impede our ability to sell our marketing software on terms favorable to us. Our current and potential competitors may develop and market new technologies that render our
12
existing or future products less competitive, unmarketable or obsolete. In addition, if these competitors develop products with similar or superior functionality to our solutions, we may need to decrease the prices for our solutions in order to remain competitive. If we are unable to maintain our current pricing due to competitive pressures, our margins will be reduced and our operating results will be negatively affected.
Our competitors offer various solutions that compete with us. Some of these competitors include:
- •
- cloud-based marketing automation providers such as Act-On, Eloqua (which was recently acquired by Oracle) and
HubSpot;
- •
- traditional database marketing software vendors such as Aprimo (a division of Teradata), SAS Institute and Unica (a
division of IBM);
- •
- email marketing software vendors, such as ExactTarget, Responsys and Silverpop; and
- •
- large-scale enterprise suites such as Oracle and SAP.
We also expect that new competitors, such as enterprise software vendors that have traditionally focused on enterprise resource planning or back office applications, will continue to enter the marketing software market with competing products, which could have an adverse effect on our business, operating results and financial condition. For example, due to the growing awareness of the importance of technology solutions to modern relationship marketing, we expect to face additional competition from new entrants to our markets. In addition, sales force automation and CRM system vendors, such as Microsoft, NetSuite and salesforce.com, could acquire or develop solutions that compete with our offerings. Some of these companies have acquired social media marketing and other marketing software providers to integrate with their broader offerings.
Our current and potential competitors may have significantly more financial, technical, marketing and other resources than we have, are able to devote greater resources to the development, promotion, sale and support of their products and services, have more extensive customer bases and broader customer relationships than we have, and may have longer operating histories and greater name recognition than we have. As a result, these competitors may be better able to respond quickly to new technologies and to undertake more extensive marketing campaigns. In a few cases, these vendors may also be able to offer marketing software at little or no additional cost by bundling them with their existing suite of solutions. To the extent any of our competitors have existing relationships with potential customers for either marketing software or other solutions, those customers may be unwilling to purchase our solutions because of those existing relationships with that competitor. If we are unable to compete with such companies, the demand for our marketing software could substantially decline.
In addition, if one or more of our competitors were to merge or partner with another of our competitors, the change in the competitive landscape could adversely affect our ability to compete effectively. For example, Oracle recently acquired our competitor Eloqua, and ExactTarget acquired our competitor Pardot. Other companies such as Adobe, IBM and salesforce.com have also recently acquired companies in the marketing automation and/or social marketing and related spaces. These acquisitions have resulted in fewer but larger companies with whom we compete for customers. Our competitors may also establish or strengthen cooperative relationships with our current or future strategic distribution and technology partners or other parties with whom we have relationships, thereby limiting our ability to promote and implement our solutions. We may not be able to compete successfully against current or future competitors, and competitive pressures may harm our business, operating results and financial condition.
13
Our recent rapid growth may not be indicative of our future growth and, if we continue to grow rapidly, we may not be able to manage our growth effectively.
From 2010 to 2012, our revenue grew from $14.0 million to $58.4 million. We expect that, in the future, as our revenue increases to higher levels, our revenue growth rate will decline. We believe growth of our revenue depends on a number of factors, including our ability to:
- •
- price our marketing software effectively so that we are able to attract and retain customers without compromising our
profitability;
- •
- attract new customers, increase our existing customers' use of our services and provide our customers with excellent
customer support;
- •
- introduce our marketing software to new markets outside of the United States; and
- •
- increase awareness of our brand on a global basis.
We may not successfully accomplish any of these objectives. We plan to continue our investment in future growth. We expect to continue to expend substantial financial and other resources on:
- •
- sales and marketing, including a significant expansion of our sales organization;
- •
- our technology infrastructure, including systems architecture, management tools, scalability, availability, performance
and security, as well as disaster recovery measures;
- •
- product development, including investments in our product development team and the development of new products and new
features for existing products;
- •
- international expansion; and
- •
- general administration, including legal and accounting expenses related to being a public company.
In addition, our historical rapid growth has placed and may continue to place significant demands on our management and our operational and financial resources. We have also experienced significant growth in database size, the number of users and transactions and the amount of data that our hosting infrastructure supports. As we continue to grow, we may need to open new offices in the United States and internationally, and hire additional personnel for those offices. Finally, our organizational structure is becoming more complex as we add additional staff, and we will need to improve our operational, financial and management controls as well as our reporting systems and procedures. We will require significant capital expenditures and the allocation of valuable management resources to grow and change in these areas without undermining our corporate culture of rapid innovation, teamwork and attention to customer success that has been central to our growth so far.
If our or our customers' security measures are compromised or unauthorized access to customer data is otherwise obtained, our marketing software may be perceived as not being secure, customers may curtail or cease their use of our solutions, our reputation may be harmed and we may incur significant liabilities.
Our operations involve the storage and transmission of customer data, including personally identifiable information, and security incidents could result in unauthorized access to, loss of or unauthorized disclosure of this information, litigation, indemnity obligations and other possible liabilities, as well as negative publicity, which could damage our reputation, impair our sales and harm our business. Cyber attacks and other malicious Internet-based activity continue to increase generally, and cloud-based platform providers of marketing services have been targeted. If our security measures are compromised as a result of third-party action, employee or customer error, malfeasance, stolen or fraudulently obtained log-in credentials or otherwise, our reputation could be
14
damaged, our business may be harmed and we could incur significant liability. In addition, if the security measures of our customers are compromised, even without any actual compromise of our own systems, we may face negative publicity or reputational harm if our customers or anyone else incorrectly attributes the blame for such security breaches on us or our systems. We may be unable to anticipate or prevent techniques used to obtain unauthorized access or to sabotage systems because they change frequently and generally are not detected until after an incident has occurred. As we increase our customer base and our brand becomes more widely known and recognized when we are a public company, we may become more of a target for third parties seeking to compromise our security systems or gain unauthorized access to our customers' data.
Many governments have enacted laws requiring companies to notify individuals of data security incidents involving certain types of personal data. In addition, some of our customers contractually require notification of any data security compromise. Security compromises experienced by our competitors, by our customers or by us may lead to public disclosures, which may lead to widespread negative publicity. Any security compromise in our industry, whether actual or perceived, could harm our reputation, erode customer confidence in the effectiveness of our security measures, negatively impact our ability to attract new customers, cause existing customers to elect not to renew their subscriptions or subject us to third-party lawsuits, regulatory fines or other action or liability, which could materially and adversely affect our business and operating results.
There can be no assurance that any limitations of liability provisions in our contracts for a security breach would be enforceable or adequate or would otherwise protect us from any such liabilities or damages with respect to any particular claim. We also cannot be sure that our existing general liability insurance coverage and coverage for errors or omissions will continue to be available on acceptable terms or will be available in sufficient amounts to cover one or more large claims, or that the insurer will not deny coverage as to any future claim. The successful assertion of one or more large claims against us that exceed available insurance coverage, or the occurrence of changes in our insurance policies, including premium increases or the imposition of large deductible or co-insurance requirements, could have a material adverse effect on our business, financial condition and operating results.
Interruptions to or degraded performance of our service could result in customer dissatisfaction, damage to our reputation, loss of customers, limited growth and reduction in revenue.
We currently serve our customers from third-party data center hosting facilities located in California, Texas, Virginia and the United Kingdom. The continuous availability of our service depends on the operations of those facilities, on a variety of network service providers, on third-party vendors and on our own data center operations staff. In addition, we depend on our third-party facility providers' ability to protect these facilities against damage or interruption from natural disasters, power or telecommunications failures, criminal acts and similar events. In 2012, we began an effort to transition from a managed hosting service provider to co-location data center facilities for which we are purchasing and managing our own computer equipment and systems. This transition requires that we complete customer migrations without material interruption, which increases the risk of possible adverse business impact of any interruption or failure in the delivery of our service that could result from the transition. If there are any lapses of service or damage to a facility, we could experience lengthy interruptions in our service as well as delays and additional expenses in arranging new facilities and services. Even with current and planned disaster recovery arrangements, which, to date, have not been tested in an actual crisis, our business could be harmed.
15
We designed our system infrastructure and procure and own or lease the computer hardware used for our services. Design and mechanical errors, spikes in usage volume and failure to follow operations protocols and procedures could cause our systems to fail, resulting in interruptions in our solution. Any interruptions or delays in our service, whether as a result of third-party error, our own error, natural disasters or security breaches, whether accidental or willful, could harm our relationships with customers and cause our revenue to decrease and/or our expenses to increase. Also, in the event of damage or interruption, our insurance policies may not adequately compensate us for any losses that we may incur. These factors in turn could further reduce our revenue, subject us to liability and cause us to issue credits or cause customers not to renew their subscriptions, any of which could materially adversely affect our business.
If we are unable to further penetrate the B2C market and additional vertical industries, our revenue may not grow and our operating results may be harmed.
Currently, a significant majority of our revenue is derived from companies in the B2B market and a significant portion are derived from customers in the technology industry. An important part of our strategy, however, is to further penetrate the B2C market and vertical industries outside of technology. We have less experience in this market and these industries, and expanding into them may require us to develop additional features for our products, expand our expertise in certain areas, and add sales and support personnel possessing familiarity with this market and the relevant vertical industries. In addition, B2C customers may have greater usage requirements during their peak selling seasons which could put pressure on our systems and infrastructure and require us to expand these systems and infrastructure to meet increased demand. As a result of these and other factors, our efforts to expand further into the B2C market and further into additional vertical industries may be expensive, may not succeed and may harm our revenue growth and operating results.
We may experience quarterly fluctuations in our operating results due to a number of factors, which makes our future results difficult to predict and could cause our operating results to fall below expectations or our guidance.
Our quarterly operating results have fluctuated in the past and are expected to fluctuate in the future due to a variety of factors, many of which are outside of our control. As a result, our past results may not be indicative of our future performance, and comparing our operating results on a period-to-period basis may not be meaningful. In addition to the other risks described in this prospectus, factors that may affect our quarterly operating results include the following:
- •
- changes in spending on marketing software by our current or prospective customers;
- •
- pricing of our marketing software so that we are able to attract and retain customers;
- •
- acquisition of new customers and increases of our existing customers' use of our services;
- •
- customer renewal rates and the amounts for which agreements are renewed;
- •
- customer delays in purchasing decisions in anticipation of new products or product enhancements by us or our competitors;
- •
- budgeting cycles of our customers;
- •
- changes in the competitive dynamics of our market, including consolidation among competitors or customers;
- •
- the amount and timing of payment for operating expenses, particularly research and development and sales and marketing expenses (including marketing events and commissions and bonuses associated with performance), and employee benefit expenses;
16
- •
- the amount and timing of non-cash expenses, including stock-based compensation, goodwill impairments and other
non-cash charges;
- •
- the amount and timing of costs associated with recruiting, training and integrating new employees;
- •
- the amount and timing of cash collections from our customers and the mix of quarterly and annual billings;
- •
- introduction and adoption of our marketing software in markets outside of the United States;
- •
- unforeseen costs and expenses related to the expansion of our business, operations and infrastructure;
- •
- costs and timing of costs associated with the transition of our data center facilities;
- •
- awareness of our thought leadership and brand on a global basis;
- •
- changes in the levels of our capital expenditures;
- •
- foreign currency exchange rate fluctuations; and
- •
- general economic and political conditions in our domestic and international markets.
We may not be able to accurately forecast the amount and mix of future subscriptions, revenue and expenses and, as a result, our operating results may fall below our estimates or the expectations of public market analysts and investors. If our revenue or operating results fall below the expectations of investors or securities analysts, or below any guidance we may provide, the price of our common stock could decline.
We may not be able to scale our business quickly enough to meet our customers' growing needs and if we are not able to grow efficiently, our operating results could be harmed.
As usage of our marketing software grows and as customers use our solutions for more advanced relationship marketing programs, we will need to devote additional resources to improving our application architecture, integrating with third-party systems, and maintaining infrastructure performance. In addition, we will need to appropriately scale our internal business systems and our services organization, including customer support and professional services, to serve our growing customer base, particularly as our customer demographics expand over time. Any failure of or delay in these efforts could cause impaired system performance and reduced customer satisfaction. These issues could reduce the attractiveness of our marketing software to customers, resulting in decreased sales to new customers, lower renewal rates by existing customers, the issuance of service credits, or requested refunds, which could hurt our revenue growth and our reputation. Even if we are able to upgrade our systems and expand our staff, any such expansion will be expensive and complex, requiring management time and attention. We could also face inefficiencies or operational failures as a result of our efforts to scale our infrastructure. Moreover, there are inherent risks associated with upgrading, improving and expanding our information technology systems. We cannot be sure that the expansion and improvements to our infrastructure and systems will be fully or effectively implemented on a timely basis, if at all. These efforts may reduce revenue and our margins and adversely impact our financial results.
If we fail to adapt and respond effectively to rapidly changing technology, evolving industry standards and changing customer needs or requirements, our marketing software may become less competitive.
Our future success will depend on our ability to adapt and innovate our marketing software. To attract new customers and increase revenue from existing customers, we continually will need to
17
enhance and improve our offerings to meet customer needs at prices that our customers are willing to pay. Such efforts will require adding new functionality and responding to technological advancements, which will increase our research and development costs. If we are unable to develop new solutions that address our customers' needs, or to enhance and improve our solutions in a timely manner, we may not be able to achieve or maintain adequate market acceptance of our solutions. Our ability to grow is also subject to the risk of future disruptive technologies. Access and use of our marketing software is provided via the cloud, which, itself, was disruptive to the previous enterprise software model. If new technologies emerge that are able to deliver marketing software and related applications at lower prices, more efficiently, more conveniently or more securely, such technologies could adversely impact our ability to compete.
Because we recognize revenue from subscriptions over the term of the relevant contract, downturns or upturns in sales are not immediately reflected in full in our operating results.
As a subscription-based business, we recognize revenue over the term of each of our contracts, which is typically one year, but range from one quarter to three years. As a result, much of the revenue we report each quarter results from contracts entered into during previous quarters. Consequently, a shortfall in demand for our solutions and professional services or a decline in new or renewed contracts in any one quarter may not significantly reduce our revenue for that quarter but could negatively affect our revenue in future quarters. Accordingly, the effect of significant downturns in new sales or renewals of our marketing software will not be reflected in full in our operating results until future periods. Our revenue recognition model also makes it difficult for us to rapidly increase our revenue through additional sales in any period, as revenue from new customers must be recognized over the applicable term of the contracts.
Because our long-term growth strategy involves further expansion of our sales to customers outside the United States, our business will be susceptible to risks associated with international operations.
A component of our growth strategy involves the further expansion of our operations and customer base internationally. In 2010, 2011, 2012 and the three months ended March 31, 2012 and 2013, revenue generated outside of the United States was 10.6%, 10.7%, 12.8%, 11.4% and 13.9%, respectively, of our total revenue. We currently have international offices outside of North America in Europe and Australia, which focus primarily on selling and implementing our solutions in those regions. In the future, we may expand to other international locations. Our current international operations and future initiatives will involve a variety of risks, including:
- •
- changes in a specific country's or region's political or economic conditions;
- •
- unexpected changes in regulatory requirements, taxes or trade laws;
- •
- more stringent regulations relating to data security and the unauthorized use of, or access to, commercial and personal
information, particularly in the European Union;
- •
- differing labor regulations, especially in the European Union, where labor laws are generally more advantageous to
employees as compared to the United States, including deemed hourly wage and overtime regulations in these locations;
- •
- challenges inherent in efficiently managing an increased number of employees over large geographic distances, including
the need to implement appropriate systems, policies, benefits and compliance programs;
- •
- difficulties in managing a business in new markets with diverse cultures, languages, customs, legal systems, alternative
dispute systems and regulatory systems;
- •
- increased travel, real estate, infrastructure and legal compliance costs associated with international operations;
18
- •
- currency exchange rate fluctuations and the resulting effect on our revenue and expenses, and the cost and risk of
entering into hedging transactions if we chose to do so in the future;
- •
- limitations on our ability to reinvest earnings from operations in one country to fund the capital needs of our operations
in other countries;
- •
- laws and business practices favoring local competitors or general preferences for local vendors;
- •
- limited or insufficient intellectual property protection;
- •
- political instability or terrorist activities;
- •
- exposure to liabilities under anti-corruption and anti-money laundering laws, including the U.S.
Foreign Corrupt Practices Act and similar laws and regulations in other jurisdictions; and
- •
- adverse tax burdens and foreign exchange controls that could make it difficult to repatriate earnings and cash.
We opened our first international office two years ago, and our limited experience in operating our business internationally increases the risk that any potential future expansion efforts that we may undertake will not be successful. If we invest substantial time and resources to expand our international operations and are unable to do so successfully and in a timely manner, our business and operating results will suffer.
Failure to effectively develop and expand our marketing and sales capabilities could harm our ability to increase our customer base and achieve broader market acceptance of our solutions.
Our ability to increase our customer base and achieve broader market acceptance of our marketing software will depend to a significant extent on our ability to expand our marketing and sales operations. We plan to continue expanding our sales force and third-party channel partners, both domestically and internationally. We also plan to dedicate significant resources to sales and marketing programs, including Internet and other online advertising. The effectiveness of our online advertising has varied over time and may vary in the future due to competition for key search terms, changes in search engine use and changes in the search algorithms used by major search engines. All of these efforts will require us to invest significant financial and other resources. In addition, the cost to acquire customers is high due to these marketing and sales efforts. Our business will be seriously harmed if our efforts do not generate a correspondingly significant increase in revenue. We may not achieve anticipated revenue growth from expanding our sales force if we are unable to hire, develop and retain talented sales personnel, if our new sales personnel are unable to achieve desired productivity levels in a reasonable period of time or if our sales and marketing programs are not effective.
If we fail to maintain our thought leadership position in modern relationship marketing, our business may suffer.
We believe that maintaining our thought leadership position in modern relationship marketing is an important element in attracting new customers. We devote significant resources to develop and maintain our thought leadership position, with a focus on identifying and interpreting emerging trends in relationship marketing, shaping and guiding industry dialog, and creating and sharing the best marketing practices. Our activities related to developing and maintaining our thought leadership may not yield increased revenue, and even if they do, any increased revenue may not
19
offset the expenses we incurred in such effort. We rely upon the continued services of our management and employees with domain expertise in modern relationship marketing, and the loss of any key management or employees in this area could harm our competitive position and reputation. If we fail to successfully grow and maintain our thought leadership position, or incur substantial expenses in our attempts to do so, we may not attract enough new customers or retain our existing customers, and our business could suffer.
Our quarterly results reflect seasonality in the sale of our marketing software, which can make it difficult to achieve sequential revenue growth or could result in sequential revenue declines.
We have historically experienced seasonal variations in our signing of customer contracts and renewals. We sign a significantly higher percentage of agreements with new customers as well as renewal agreements with existing customers in the fourth quarter of each year as compared to any of the prior quarters. The first quarter is typically the slowest in this regard. We expect this seasonality to continue in the future, which may cause fluctuations in certain of our operating results and financial metrics, and thus limit our ability to predict future results. This seasonality is reflected to a much lesser extent, and sometimes is not immediately apparent, in our revenue, because we recognize subscription revenue over the term of the license agreement, which is typically one year, but ranges from one quarter to three years. As a result, a slowdown in our ability to enter into customer agreements may not be apparent in our revenue for the quarter, as the revenue recognized in any quarter is primarily from customer agreements entered into in prior quarters. Historical patterns should not be considered indicative of our future sales activity or performance.
If we fail to forecast our revenue accurately, or if we fail to match our expenditures with corresponding revenue, our operating results could be adversely affected.
Because our recent growth has resulted in the rapid expansion of our business, we do not have a long history upon which to base forecasts of future operating revenue. In addition, for our enterprise customers, the lengthy sales cycle for the evaluation and implementation of our solutions, which typically extends for several months, may also cause us to experience a delay between increasing operating expenses for such sales efforts, and, upon successful sales, the generation of corresponding revenue. Accordingly, we may be unable to prepare accurate internal financial forecasts or replace anticipated revenue that we do not receive as a result of delays arising from these factors. As a result, our operating results in future reporting periods may be significantly below the expectations of the public market, equity research analysts or investors, which could harm the price of our common stock.
The standards and practices that private entities use to regulate the use of email have in the past interfered with, and may in the future interfere with, the effectiveness of our software and our ability to conduct business.
Our customers rely in part on email to communicate with their existing or prospective customers. Various private entities, such as commercial email, antivirus and network security providers, attempt to regulate the use of email for commercial solicitation. These entities often advocate standards of conduct or practice that significantly exceed current legal requirements and classify certain email solicitations that comply with current legal requirements as spam. Some of these entities maintain "blacklists" of companies and individuals, and the websites, Internet service providers and Internet protocol addresses associated with those entities or individuals that do not adhere to those standards of conduct or practices for commercial email solicitations that the blacklisting entity believes are appropriate. If a company's Internet protocol addresses are listed by a blacklisting entity, emails sent from those addresses may be blocked if they are sent to any
20
Internet domain or Internet address that subscribes to the blacklisting entity's service or purchases its blacklist. Any of the foregoing restrictions or limitation on emails or internet addresses impacting our customers could lead to diminishing effectiveness of our marketing software solutions, and, in turn, result in service problems and ultimately a reduction in renewals or loss of customers for us.
We rely on our management team and other key employees, and the loss of one or more key employees could harm our business.
Our success and future growth depend upon the continued services of our management team, including Phillip M. Fernandez, our President and Chief Executive Officer, and other key employees in the areas of research and development, marketing, sales, services and general and administrative functions. From time to time, there may be changes in our management team resulting from the hiring or departure of executives, which could disrupt our business. We also are dependent on the continued service of our existing software engineers because of the complexity of our solutions. We may terminate any employee's employment at any time, with or without cause, and any employee may resign at any time, with or without cause. In addition, our executive officers and certain other management-level employees benefit from management retention agreements and/or a change in control acceleration policy in which an involuntary termination by us without cause or a voluntary termination by the employee for good reason, as such terms are defined in the agreements and policy, in connection with or one year after a change of control transaction, will result in either severance pay or acceleration of equity vesting for the individual, which would increase the cost to us of any such departure. We do not maintain key man life insurance on any of our employees. The loss of one or more of our key employees could harm our business.
The failure to attract and retain additional qualified personnel could prevent us from executing our business strategy.
To execute our business strategy, we must attract and retain highly qualified personnel. In particular, we compete with many other companies for software developers with high levels of experience in designing, developing and managing cloud-based software, as well as for skilled sales and operations professionals, and we may not be successful in attracting and retaining the professionals we need. Also, marketing domain experts and enterprise sales professionals are very important to our success and are difficult to replace. We have from time to time in the past experienced, and we expect to continue to experience in the future, difficulty in hiring and difficulty in retaining highly skilled employees with appropriate qualifications. In particular, we have experienced a more competitive hiring environment in the San Francisco Bay Area, where we are headquartered. Many of the companies with which we compete for experienced personnel have greater resources than we do. In addition, in making employment decisions, particularly in the software industry, job candidates often consider the value of the stock options or other equity incentives they are to receive in connection with their employment. If the price of our stock declines, or experiences significant volatility, our ability to attract or retain key employees will be adversely affected. If we fail to attract new personnel or fail to retain and motivate our current personnel, our growth prospects could be severely harmed.
If our marketing software fails due to defects or similar problems, and if we fail to correct any defect or other software problems, we could lose customers, become subject to service performance or warranty claims or incur significant costs.
Our solutions and the systems infrastructure underlying our marketing software platform are inherently complex and may contain material defects or errors. We have from time to time found defects in our solutions and may discover additional defects in the future. We may not be able to detect and correct defects or errors before customers begin to use our solutions. Consequently, we
21
or our customers may discover defects or errors after our solutions have been implemented. These defects or errors could also cause inaccuracies in the data we collect and process for our customers, or even the loss, damage or inadvertent release of such confidential data. We implement bug fixes and upgrades as part of our regularly scheduled system maintenance, which may lead to system downtime. Even if we are able to implement the bug fixes and upgrades in a timely manner, any history of defects or inaccuracies in the data we collect for our customers, or the loss, damage or inadvertent release of such confidential data could cause our reputation to be harmed, and customers may elect not to purchase or renew their agreements with us and subject us to service performance credits, warranty claims or increased insurance costs. The costs associated with any material defects or errors in our software or other performance problems may be substantial and could materially adversely affect our operating results.
If we do not or cannot maintain the compatibility of our marketing software with third-party applications that our customers use in their businesses, our revenue will decline.
The functionality and popularity of our marketing software depends, in part, on our ability to integrate our solutions with third-party applications and platforms, including CRM, event management, e-commerce, call center, and social media sites that our customers use and from which they obtain data. Third-party providers of applications and APIs may change the features of their applications and platforms, restrict our access to their applications and platforms or alter the terms governing use of their applications and APIs and access to those applications and platforms in an adverse manner. Such changes could functionally limit or terminate our ability to use these third-party applications and platforms in conjunction with our solution, which could negatively impact our offerings and harm our business. If we fail to integrate our software with new third-party applications and platforms that our customers use for marketing purposes, we may not be able to offer the functionality that our customers need, which would negatively impact our ability to generate revenue and adversely impact our business.
If we fail to offer high-quality education and customer support, our business and reputation would suffer.
High-quality education and customer support is important for the successful marketing and sale of our solution and for the renewal of existing customers. Providing this education and support requires that our customer support personnel have specific marketing domain knowledge and expertise, making it more difficult for us to hire qualified personnel and to scale up our support operations due to the extensive training required. The importance of high-quality customer support will increase as we expand our business and pursue new customers. If we do not help our customers quickly resolve post-deployment issues and provide effective ongoing support, our ability to sell additional functionality and services to existing customers would suffer and our reputation with existing or potential customers would be harmed.
Future acquisitions, strategic investments, partnerships or alliances could be difficult to identify and integrate, divert the attention of management, disrupt our business, dilute stockholder value and adversely affect our operating results and financial condition.
We may in the future seek to acquire or invest in businesses, products or technologies that we believe could complement or expand our solutions, enhance our technical capabilities or otherwise offer growth opportunities. The pursuit of potential acquisitions may divert the attention of management and cause us to incur various expenses in identifying, investigating and pursuing suitable acquisitions, whether or not the acquisition purchases are completed. In addition, we have limited experience in acquiring other businesses, having acquired only one company since our inception. If we acquire additional businesses, we may not be able to integrate successfully the
22
acquired personnel, operations and technologies, or effectively manage the combined business following the acquisition. We may not be able to find and identify desirable acquisition targets or be successful in entering into an agreement with any particular target. Acquisitions could also result in dilutive issuances of equity securities or the incurrence of debt, which could adversely affect our operating results. In addition, if an acquired business fails to meet our expectations, our operating results, business and financial condition may suffer.
Future product development is dependent on adequate research and development resources. If we do not adequately fund our research and development efforts, we may not be able to compete effectively and our business and operating results may be harmed.
In order to remain competitive, we must continue to develop new product offerings, applications and enhancements to our existing cloud-based marketing software. Maintaining adequate research and development personnel and resources to meet the demands of the market is essential. If we are unable to develop solutions internally due to certain constraints, such as high employee turnover, lack of management ability or a lack of other research and development resources, we may miss market opportunities. Further, many of our competitors expend a considerably greater amount of funds on their research and development programs, and those that do not may be acquired by larger companies that would allocate greater resources to our competitors' research and development programs. Our failure to maintain adequate research and development resources or to compete effectively with the research and development programs of our competitors could materially adversely affect our business.
Shifts over time in the mix of sizes or types of organizations that purchase our solutions or changes in the components of our solutions purchased by our customers could negatively affect our operating results.
Our strategy is to sell our marketing software to organizations of broadly different sizes, from SMBs to large enterprises. Our gross margins can vary depending on numerous factors related to the implementation and use of our marketing software, including the sophistication and intensity of our customers' use of our solutions and the level of professional services and support required by a customer. For example, our enterprise customers typically require more professional services and because our professional services offerings typically have a higher cost of revenue than subscriptions to our solutions, any increase in sales of professional services would have an adverse effect on our overall gross margin and operating results. Providing professional services to enterprises allows us to utilize our staff more efficiently than is the case in providing professional services to other customers or in other contexts; consequently, while an increase in providing professional services to enterprises typically hurts our overall gross margin, it may improve our professional services and other gross margin. Sales to enterprise customers may also entail longer sales cycles and more significant selling efforts. Selling to SMB customers may involve smaller contract size, higher relative selling costs and greater credit risk and uncertainty. If the mix of organizations that purchase our solutions changes, or the mix of solution components purchased by our customers changes, our gross margins could decrease and our operating results could be adversely affected.
Economic uncertainties or downturns in the general economy or the industries in which our customers operate could disproportionately affect the demand for our marketing software and negatively impact our operating results.
General worldwide economic conditions have experienced a significant downturn and fluctuations in recent years, and market volatility and uncertainty remain widespread. As a result, we and our customers find it extremely difficult to accurately forecast and plan future business
23
activities. In addition, these conditions could cause our customers or prospective customers to reduce their marketing and sales budgets, which could decrease corporate spending on our marketing software, resulting in delayed and lengthened sales cycles, a decrease in new customer acquisition and/or loss of customers. Furthermore, during challenging economic times, our customers may face issues with their cash flows and in gaining timely access to sufficient credit or obtaining credit on reasonable terms, which could impair their ability to make timely payments to us, impact customer renewal rates and adversely affect our revenue. If such conditions occur, we may be required to increase our reserves, allowances for doubtful accounts and write-offs of accounts receivable, and our operating results would be harmed. In addition, a downturn in the technology sector may disproportionately affect us because a significant portion of our customers are technology companies. We cannot predict the timing, strength or duration of any economic slowdown or recovery, whether global, regional or within specific markets. If the conditions of the general economy or markets in which we operate worsen, our business could be harmed. In addition, even if the overall economy improves, the market for marketing software may not experience growth or we may not experience growth.
If we fail to enhance our brand, our ability to expand our customer base will be impaired and our financial condition may suffer.
We believe that our development of the Marketo brand is critical to achieving widespread awareness of our existing and future marketing software solutions, and, as a result, is important to attracting new customers and maintaining existing customers. We also believe that the importance of brand recognition will increase as competition in our market increases. Successful promotion of our brand will depend largely on the effectiveness of our marketing efforts and on our ability to provide reliable and useful marketing software at competitive prices. In the past, our efforts to build our brand have involved significant expenses. Brand promotion activities may not yield increased revenue, and even if they do, any increased revenue may not offset the expenses we incurred in building our brand. In addition, to sell to and service our customers we utilize a combination of internal personnel and third-party service providers, as well as indirect sales partners that pursue additional channel, agency and OEM distribution partnerships. These third-party service providers and indirect sales partners, who are not in our control, may harm our reputation and damage our brand perception in the marketplace. If we fail to successfully promote and maintain our brand, our business could suffer.
We are dependent on the continued participation and level of service of our third-party professional service providers and our indirect sales partners.
We rely on third-party service providers to provide certain services to us and/or our customers, as well as indirect sales partners to pursue additional channel, agency and OEM distribution partnerships. If any of these third-party service providers stop supporting our solution or if our network of providers does not expand, we will likely have to expand our internal team to meet the needs of our customers, which could increase our operating costs and result in lower gross margins. To the extent that we are unable to recruit alternative partners, or to expand our internal team, our revenue and operating results would be harmed.
If we fail to adequately protect our proprietary rights, our competitive position could be impaired and we may lose valuable assets, experience reduced revenue and incur costly litigation to protect our rights.
Our success is dependent, in part, upon protecting our proprietary technology. We rely on a combination of patents, copyrights, trademarks, service marks, trade secret laws and contractual restrictions to establish and protect our proprietary rights in our products and services. However,
24
the steps we take to protect our intellectual property may be inadequate. We will not be able to protect our intellectual property if we are unable to enforce our rights or if we do not detect unauthorized use of our intellectual property. Any of our patents, trademarks or other intellectual property rights may be challenged by others or invalidated through administrative process or litigation. While we have some U.S. patent applications pending, we may be unable to obtain patent protection for the technology covered in our patent applications. In addition, any patents issued in the future may not provide us with competitive advantages, or may be successfully challenged by third parties. Furthermore, legal standards relating to the validity, enforceability and scope of protection of intellectual property rights are uncertain. Despite our precautions, it may be possible for unauthorized third parties to copy our products and use information that we regard as proprietary to create products and services that compete with ours. Some license provisions protecting against unauthorized use, copying, transfer and disclosure of our products may be unenforceable under the laws of certain jurisdictions and foreign countries. In addition, the laws of some countries do not protect proprietary rights to the same extent as the laws of the United States. To the extent we expand our international activities, our exposure to unauthorized copying and use of our products and proprietary information may increase.
We enter into confidentiality and invention assignment agreements with our employees and consultants and enter into confidentiality agreements with the parties with whom we have strategic relationships and business alliances. No assurance can be given that these agreements will be effective in controlling access to and distribution of our products and proprietary information. Further, these agreements may not prevent our competitors from independently developing technologies that are substantially equivalent or superior to our solutions.
In order to protect our intellectual property rights, we may be required to spend significant resources to monitor and protect these rights. Litigation may be necessary in the future to enforce our intellectual property rights and to protect our trade secrets. Litigation brought to protect and enforce our intellectual property rights could be costly, time consuming and distracting to management and could result in the impairment or loss of portions of our intellectual property. Furthermore, our efforts to enforce our intellectual property rights may be met with defenses, counterclaims and countersuits attacking the validity and enforceability of our intellectual property rights. Our inability to protect our proprietary technology against unauthorized copying or use, as well as any costly litigation or diversion of our management's attention and resources, could delay further sales or the implementation of our solutions, impair the functionality of our solutions, delay introductions of new solutions, result in our substituting inferior or more costly technologies into our solutions, or injure our reputation.
Our business may suffer if it is alleged or determined that our technology infringes the intellectual property rights of others.
The software industry is characterized by the existence of a large number of patents, copyrights, trademarks, trade secrets and other intellectual and proprietary rights. Companies in the software industry, including in marketing software, are often required to defend against litigation claims based on allegations of infringement or other violations of intellectual property rights. Many of our competitors and other industry participants have been issued patents and/or have filed patent applications and may assert patent or other intellectual property rights within the industry. Moreover, in recent years, individuals and groups that are non-practicing entities, commonly referred to as "patent trolls", have purchased patents and other intellectual property assets for the purpose of making claims of infringement in order to extract settlements. From time to time, we may receive threatening letters or notices or may be the subject of claims that our solutions and underlying technology infringe or violate the intellectual property rights of others. For example, as described further under "Business — Legal Proceedings," on May 7, 2013, iHance, Inc. sent us a
25
communication alleging that a salesperson email tracking feature in our Marketo Sales Insight application infringed upon certain of iHance's patents. Responding to such claims, regardless of their merit, can be time consuming, costly to defend in litigation, divert management's attention and resources, damage our reputation and brand, and cause us to incur significant expenses. Our technologies may not be able to withstand any third-party claims or rights against their use. Claims of intellectual property infringement might require us to redesign our application, delay releases, enter into costly settlement or license agreements or pay costly damage awards, or face a temporary or permanent injunction prohibiting us from marketing or selling our solutions. If we cannot or do not license the infringed technology on reasonable terms or at all, or substitute similar technology from another source, our revenue and operating results could be adversely impacted. Additionally, our customers may not purchase our marketing software if they are concerned that they may infringe third-party intellectual property rights. The occurrence of any of these events may have a material adverse effect on our business.
In our subscription agreements with our customers, we agree to indemnify our customers against any losses or costs incurred in connection with claims by a third party alleging that a customer's use of our services infringes the intellectual property rights of the third party. There can be no assurance that any existing limitations of liability provisions in our contracts would be enforceable or adequate, or would otherwise protect us from any such liabilities or damages with respect to any particular claim. Our customers who are accused of intellectual property infringement may in the future seek indemnification from us under the terms of our contracts. If such claims are successful, or if we are required to indemnify or defend our customers from these or other claims, these matters could be disruptive to our business and management and have a material adverse effect on our business, operating results and financial condition.
We use open source software in our products, which could subject us to litigation or other actions.
We use open source software in our marketing software and may use more open source software in the future. From time to time, there have been claims challenging the ownership of open source software against companies that incorporate open source software into their products. As a result, we could be subject to lawsuits by parties claiming ownership of what we believe to be open source software. Litigation could be costly for us to defend, have a negative effect on our operating results and financial condition or require us to devote additional research and development resources to change our products. In addition, if we were to combine our proprietary software products with open source software in a certain manner, we could, under certain of the open source licenses, be required to release the source code of our proprietary software products. If we inappropriately use open source software, we may be required to re-engineer our products, discontinue the sale of our products or take other remedial actions.
Existing federal, state and foreign laws regulate Internet tracking software, the senders of commercial emails and text messages, website owners and other activities, and could impact the use of our marketing solution and potentially subject us to regulatory enforcement or private litigation.
Certain aspects of how our customers utilize our solution are subject to regulations in the United States, European Union and elsewhere. New and expanding "Do Not Track" regulations have recently been enacted or proposed that protect users' right to choose whether or not to be tracked online. These regulations seek, among other things, to allow consumers to have greater control over the use of private information collected online, to forbid the collection or use of online information, to demand a business to comply with their choice to opt out of such collection or use, and to place limits upon the disclosure of information to third party websites. These policies could
26
have a significant impact on the operation of our marketing software and could impair our attractiveness to customers, which would harm our business.
Many of our customers and potential customers in the healthcare, financial services and other industries are subject to substantial regulation regarding their collection, use and protection of data and may be the subject of further regulation in the future. Accordingly, these laws or significant new laws or regulations or changes in, or repeals of, existing laws, regulations or governmental policy may change the way these customers do business and may require us to implement additional features or offer additional contractual terms to satisfy customer and regulatory requirements, or could cause the demand for and sales of our marketing software to decrease and adversely impact our financial results.
In addition, the Controlling the Assault of Non-Solicited Pornography and Marketing Act of 2003 (CAN-SPAM Act) establishes certain requirements for commercial email messages and specifies penalties for the transmission of commercial email messages that are intended to deceive the recipient as to source or content. The CAN-SPAM Act, among other things, obligates the sender of commercial emails to provide recipients with the ability to opt out of receiving future commercial emails from the sender. In addition, the CAN-SPAM Act, regulations issued pursuant to the CAN-SPAM Act, and the Telephone Consumer Protection Act allow companies to send some types of commercial text messages only when the recipient has opted in to the receipt of such text messages. The ability of our customers' message recipients to opt out of receiving commercial emails may minimize the effectiveness of the email components of our marketing software offerings. In addition, certain states and foreign jurisdictions, such as Australia, Canada and the European Union, have enacted laws that regulate sending email, and some of these laws are more restrictive than U.S. laws. For example, some foreign laws prohibit sending unsolicited email unless the recipient has provided the sender advance consent to receipt of such email, or in other words has "opted-in" to receiving it. A requirement that recipients opt into, or the ability of recipients to opt out of, receiving commercial emails may minimize the effectiveness of our software.
Our solutions include features that enable our customers to run sweepstakes, contests and similar events that are subject to regulation by various jurisdictions. To the extent that these regulations and the enforcement of these regulations dissuade our customers from conducting these types of events, they could impact customer demand for these features and ultimately customer demand for our solutions.
In addition, U.S., state and foreign jurisdictions are considering and may in the future enact legislation or laws restricting the ability to conduct marketing activities in mobile, social and web channels. Any of the foregoing existing or future restrictions could require us to change one or more aspects of the way we operate our business, which could impair our ability to attract and retain customers, or increase our operating costs or otherwise harm our business. We may be unable to pass along those costs to our clients in the form of increased subscription fees.
While these laws and regulations generally govern our customers' use of our solution, we may be subject to certain laws as a data processor on behalf of, or as a business associate of, our customers. For example, these laws and regulations governing the collection, use and disclosure of personal information include, in the United States, rules and regulations promulgated under the authority of the Federal Trade Commission, the Health Insurance Portability and Accountability Act of 1996, the Gramm-Leach-Bliley Act of 1999 and state breach notification laws, and internationally, the Data Protection Directive in the European Union and the Federal Data Protection Act in Germany. If we were found to be in violation of any of these laws or regulations as a result of government enforcement or private litigation, we could be subjected to civil and criminal sanctions, including both monetary fines and injunctive action that could force us to change our business practices, all of which could adversely affect our financial performance and significantly harm our reputation and our business.
27
Privacy concerns and consumers' acceptance of Internet behavior tracking may limit the applicability, use and adoption of our marketing software.
Privacy concerns may cause consumers to resist providing the personal data necessary to allow our customers to use our service effectively. We have implemented various features intended to enable our customers to better protect consumer privacy, but these measures may not alleviate all potential privacy concerns and threats. Even the perception of privacy concerns, whether or not valid, may inhibit market adoption of our service in certain industries. In addition to government activity, privacy advocacy groups and the technology and other industries are considering various new, additional or different self-regulatory standards that may place additional burdens on us. There are numerous lawsuits in process against various technology companies that collect and use personal information. If those lawsuits are successful, it could impact the way we conduct our business and adversely affect our financial results. The costs of compliance with, and other burdens imposed by, the foregoing laws, regulations, policies and actions may limit the use and adoption of our cloud-based marketing software and reduce overall demand for it, or lead to significant fines, penalties or liabilities for any noncompliance or loss of any such action.
We may be subject to additional obligations to collect and remit sales tax and other taxes, and we may be subject to tax liability for past sales, which could adversely harm our business.
State, local and foreign jurisdictions have differing rules and regulations governing sales, use, value added and other taxes, and these rules and regulations are subject to varying interpretations that may change over time. In particular, the applicability of such taxes to our subscription cloud-based marketing software in various jurisdictions is unclear. Further, these jurisdictions' rules regarding tax nexus are complex and vary significantly. As a result, we could face the possibility of tax assessments and audits, and our liability for these taxes and associated penalties could exceed our original estimates. A successful assertion that we should be collecting additional sales, use, value added or other taxes in those jurisdictions where we have not historically done so and do not accrue for such taxes could result in substantial tax liabilities and related penalties for past sales, discourage customers from purchasing our application or otherwise harm our business and operating results.
Changes in tax laws or regulations that are applied adversely to us or our customers could increase the costs of our cloud-based marketing software and adversely impact our business.
New income, sales, use or other tax laws, statutes, rules, regulations or ordinances could be enacted at any time. Any new taxes could adversely affect our domestic and international business operations, and our business and financial performance. Further, existing tax laws, statutes, rules, regulations or ordinances could be interpreted, changed, modified or applied adversely to us. These events could require us or our customers to pay additional tax amounts on a prospective or retroactive basis, as well as require us or our customers to pay fines and/or penalties and interest for past amounts deemed to be due. If we raise our prices to offset the costs of these changes, existing and potential future customers may elect not to continue or purchase our marketing software in the future. Additionally, new, changed, modified or newly interpreted or applied tax laws could increase our customers' and our compliance, operating and other costs, as well as the costs of our software. Any or all of these events could adversely impact our business and financial performance.
We are a multinational organization faced with increasingly complex tax issues in many jurisdictions, and we could be obligated to pay additional taxes in various jurisdictions.
As a multinational organization, we may be subject to taxation in several jurisdictions around the world with increasingly complex tax laws, the application of which can be uncertain. The
28
amount of taxes we pay in these jurisdictions could increase substantially as a result of changes in the applicable tax principles, including increased tax rates, new tax laws or revised interpretations of existing tax laws and precedents, which could have a material adverse effect on our liquidity and operating results. In addition, the authorities in these jurisdictions could review our tax returns and impose additional tax, interest and penalties, and the authorities could claim that various withholding requirements apply to us or our subsidiaries or assert that benefits of tax treaties are not available to us or our subsidiaries, any of which could have a material impact on us and the results of our operations.
Failure to comply with laws and regulations could harm our business.
Our business is subject to regulation by various federal, state, local and foreign governmental agencies, including agencies responsible for monitoring and enforcing employment and labor laws, workplace safety, environmental laws, consumer protection laws, anti-bribery laws, import/export controls, federal securities laws and tax laws and regulations. In certain jurisdictions, these regulatory requirements may be more stringent than those in the United States. Noncompliance with applicable regulations or requirements could subject us to investigations, sanctions, mandatory recalls, enforcement actions, disgorgement of profits, fines, damages, civil and criminal penalties or injunctions. If any governmental sanctions are imposed, or if we do not prevail in any possible civil or criminal litigation, our business, operating results and financial condition could be harmed. In addition, responding to any action will likely result in a significant diversion of management's attention and resources and an increase in professional fees. Enforcement actions and sanctions could further harm our business, operating results and financial condition.
Catastrophic events may disrupt our business.
We rely heavily on our data centers, network infrastructure and information technology systems for our business operations. A disruption or failure of these systems in the event of online attack, earthquake, fire, terrorist attack, power loss, telecommunications failure or other similar catastrophic event could cause system interruptions, delays in accessing our service, reputational harm and loss of critical data or could prevent us from providing our solutions to our customers. Our service is delivered from data centers operated by third parties in California, Texas, Virginia and the United Kingdom. In addition, we are headquartered and most of our employees reside in the San Francisco Bay Area, an area particularly susceptible to earthquakes, and a major earthquake or other catastrophic event could affect our employees, who may not be able to access our systems or otherwise continue to provide our solutions to our customers. A catastrophic event that results in the destruction or disruption of our data centers, or our network infrastructure or information technology systems, or access to our systems, could affect our ability to conduct normal business operations and adversely affect our operating results.
The requirements of being a public company may strain our systems and resources, divert management's attention and be costly.
As a public company, we will be subject to the reporting requirements of the Securities Exchange Act of 1934 (Exchange Act) the Sarbanes-Oxley Act of 2002 (Sarbanes-Oxley Act), the recently enacted Dodd-Frank Wall Street Reform and Consumer Protection Act (Dodd-Frank Act), and the rules and regulations of The NASDAQ Stock Market. The requirements of these rules and regulations will increase our legal, accounting and financial compliance costs, will make some activities more difficult, time-consuming and costly and may also place undue strain on our personnel, systems and resources.
The Exchange Act requires, among other things, that we file annual, quarterly and current reports with respect to our business and operating results. The Sarbanes-Oxley Act requires,
29
among other things, that we maintain effective disclosure controls and procedures and internal control over financial reporting. We are continuing the costly process of implementing and testing our systems to report our results as a public company, to continue to manage our growth and to implement internal controls. We will be required to implement and maintain various other control and business systems related to our equity, finance, treasury, information technology, other recordkeeping systems and other operations. As a result of this implementation and maintenance, management's attention may be diverted from other business concerns, which could adversely affect our business. Furthermore, we rely on third-party software and system providers for ensuring our reporting obligations and effective internal controls, and to the extent these third parties fail to provide adequate service including as a result of any inability to scale to handle our growth and the imposition of these increased reporting and internal controls and procedures, we could incur material costs for upgrading or switching systems and our business could be materially affected.
In addition, changing laws, regulations and standards relating to corporate governance and public disclosure are creating uncertainty for public companies, increasing legal and financial compliance costs and making some activities more time consuming. These laws, regulations and standards are subject to varying interpretations, in many cases due to their lack of specificity, and, as a result, their application in practice may evolve over time as new guidance is provided by regulatory and governing bodies. This could result in continuing uncertainty regarding compliance matters and higher costs necessitated by ongoing revisions to disclosure and governance practices. We intend to invest resources to comply with evolving laws, regulations and standards, and this investment may result in increased general and administrative expenses and a diversion of management's time and attention from revenue-generating activities to compliance activities. If our efforts to comply with new laws, regulations and standards differ from the activities intended by regulatory or governing bodies due to ambiguities related to their application and practice, regulatory authorities may initiate legal proceedings against us and our business may be adversely affected.
In addition, we expect these laws, rules and regulations to make it more difficult and more expensive for us to obtain director and officer liability insurance, and we may be required to incur substantial costs to maintain appropriate levels of coverage. These factors could also make it more difficult for us to attract and retain qualified members of our board of directors, particularly to serve on our audit committee, and qualified executive officers.
As a result of disclosure of information in this prospectus and in filings required of a public company, our business and financial condition will become more visible, which we believe may result in threatened or actual litigation, including by competitors and other third parties. If such claims are successful, our business and operating results could be adversely affected, and even if the claims do not result in litigation or are resolved in our favor, these claims, and the time and resources necessary to resolve them, could divert the time and resources of our management and adversely affect our business and operating results.
Changes in financial accounting standards or practices may cause adverse, unexpected financial reporting fluctuations and affect our reported operating results.
Generally accepted accounting principles in the United States are subject to interpretation by the Financial Accounting Standards Board (FASB), the SEC and various bodies formed to promulgate and interpret appropriate accounting principles. A change in accounting standards or practices can have a significant effect on our reported results and may even affect our reporting of transactions completed before the change is effective. New accounting pronouncements and varying interpretations of accounting pronouncements have occurred and may occur in the future. Changes to existing rules or the questioning of current practices may adversely affect our reported financial results or the way we conduct our business. Accounting for revenue from sales of
30
subscriptions to software is particularly complex, is often the subject of intense scrutiny by the SEC, and will evolve as FASB continues to consider applicable accounting standards in this area.
For example, we recognize subscription revenue in accordance with Accounting Standards Update 2009-13, Revenue Recognition (Topic 605) — Multiple-Deliverable Revenue Arrangements — a Consensus of the Emerging Issues Task Force (ASU 2009-13) (formerly known as EITF 08-01). The FASB and the SEC continue to issue interpretations and guidance for applying the relevant accounting standards to a wide range of sales contract terms and business arrangements that are prevalent in software licensing and subscription arrangements. As a result of future interpretations or applications of existing accounting standards, including ASU 2009-13, we could be required to delay revenue recognition into future periods, which would adversely affect our operating results.
In addition, certain factors have in the past and may in the future cause us to defer recognition for subscription fees. For example, the inclusion in our customer contracts of material non-standard terms, such as acceptance criteria, could require the deferral of subscription revenue. To the extent that such contracts become more prevalent in the future our revenue may be adversely affected.
Because of these factors and other specific requirements under accounting principles generally accepted in the United States for revenue recognition, we must have very precise terms in our arrangements in order to recognize revenue when we initially deliver our hosting services or perform our professional services. Negotiation of mutually acceptable terms and conditions can extend our sales cycle, and we may accept terms and conditions that do not permit revenue recognition at the time of delivery.
Risks Related to this Offering and Our Common Stock
There has been no prior market for our common stock and an active market may not develop or be sustained, and you may not be able to resell your shares at or above the initial public offering price, if at all.
There has been no public market for our common stock prior to this offering. The initial public offering price for our common stock will be determined through negotiations between the underwriters and us and may vary from the market price of our common stock following this offering. If you purchase shares of our common stock in this offering, you may not be able to resell those shares at or above the initial public offering price. An active or liquid market in our common stock may not develop upon closing of this offering or, if it does develop, it may not be sustainable, which could adversely affect your ability to sell your shares and could depress the market price of our common stock.
Our stock price may be volatile and may decline regardless of our operating performance resulting in substantial losses for investors purchasing shares in this offering.
The trading prices of the securities of technology companies, including providers of software via the cloud-based model, have been highly volatile. The market price of our common stock may fluctuate significantly in response to numerous factors, many of which are beyond our control, including:
- •
- actual or anticipated fluctuations in our revenue and other operating results, including as a result of the addition or
loss of any number of customers;
- •
- announcements by us or our competitors of significant technical innovations, acquisitions, strategic partnerships, joint ventures or capital commitments;
31
- •
- the financial projections we may provide to the public, any changes in these projections or our failure to meet these
projections;
- •
- failure of securities analysts to initiate or maintain coverage of us, changes in ratings and financial estimates by any
securities analysts who follow our company, or our failure to meet these estimates or the expectations of investors;
- •
- changes in operating performance and stock market valuations of cloud-based software or other technology companies, or
those in our industry in particular;
- •
- price and volume fluctuations in the trading of our common stock and in the overall stock market, including as a result of
trends in the economy as a whole;
- •
- announcements by us with regard to the effectiveness of our internal controls and our ability to accurately report
financial results;
- •
- new laws or regulations or new interpretations of existing laws or regulations applicable to our business our industry;
- •
- lawsuits threatened or filed against us;
- •
- changes in key personnel; and
- •
- other events or factors, including those resulting from war, incidents of terrorism or responses to these events.
In addition, the stock markets have experienced extreme price and volume fluctuations that have affected and continue to affect the market prices of equity securities of many technology companies. Stock prices of many technology companies have fluctuated in a manner unrelated or disproportionate to the operating performance of those companies.
In the past, stockholders have instituted securities class action litigation following periods of market volatility. If we were to become involved in securities litigation, it could subject us to substantial costs, divert resources and the attention of management from our business and adversely affect our business.
If securities or industry analysts do not publish research or publish incorrect or unfavorable research about our business, our stock price and trading volume could decline.
The trading market for our common stock depends in part on the research and reports that securities or industry analysts publish about us or our business, our market and our competitors. If no or few securities or industry analysts cover our company, the trading price for our stock would be negatively impacted. If one or more of the analysts who covers us downgrades our stock or publishes incorrect or unfavorable research about our business, our stock price would likely decline. If one or more of these analysts ceases coverage of our company or fails to publish reports on us regularly, demand for our stock could decrease, which could cause our stock price or trading volume to decline.
The concentration of our capital stock ownership with insiders upon the completion of this offering and the concurrent private placement will likely limit your ability to influence corporate matters including the ability to influence the outcome of director elections and other matters requiring stockholder approval.
We anticipate that our executive officers, directors, current five percent or greater stockholders and affiliated entities will together beneficially own approximately 76.0% of our common stock outstanding after this offering and the concurrent private placement. As a result, these stockholders, acting together, will have significant influence over all matters that require approval by our
32
stockholders, including the election of directors and approval of significant corporate transactions. Corporate action might be taken even if other stockholders, including those who purchase shares in this offering, oppose them. This concentration of ownership might also have the effect of delaying or preventing a change of control of our company that other stockholders may view as beneficial.
As a public company, we will be obligated to develop and maintain proper and effective internal control over financial reporting. We may not complete our analysis of our internal control over financial reporting in a timely manner, or these internal controls may not be determined to be effective, which may adversely affect investor confidence in our company and, as a result, the value of our common stock.
We will be required, pursuant to Section 404 of the Sarbanes-Oxley Act, to furnish a report by management on, among other things, the effectiveness of our internal control over financial reporting commencing with our annual report covering the year ending December 31, 2014. This assessment will need to include disclosure of any material weaknesses identified by our management in our internal control over financial reporting. Prior to this offering, we have never been required to test our internal controls within a specified period, and, as a result, we may experience difficulty in meeting these reporting requirements in a timely manner, particularly if material weaknesses or significant deficiencies persist. In the past certain significant deficiencies have been identified in our internal financial and accounting controls and procedures. In addition, our independent registered public accounting firm will not be required to formally attest to the effectiveness of our internal control over financial reporting pursuant to Section 404 until the later of the year following our first annual report required to be filed with the SEC, or the date we are no longer an "emerging growth company" as defined in the Jumpstart Our Business Startups Act of 2012 (JOBS Act). If we are unable to comply with the requirements of Section 404 in a timely manner, the market price of our stock could decline and we could be subject to sanctions or investigations by the stock exchange on which our common stock is listed, the SEC or other regulatory authorities, which would require additional financial and management resources.
Any failure to develop or maintain effective controls, or any difficulties encountered in their implementation or improvement, could harm our operating results or cause us to fail to meet our reporting obligations. Any failure to implement and maintain effective internal controls also could adversely affect the results of periodic management evaluations regarding the effectiveness of our internal control over financial reporting. Ineffective disclosure controls and procedures or internal control over financial reporting could also cause investors to lose confidence in our reported financial and other information, which would likely have a negative effect on the trading price of our common stock.
Implementing any appropriate changes to our internal controls may require specific compliance training of our directors, officers and employees, entail substantial costs in order to modify our existing accounting systems, and take a significant period of time to complete. Such changes may not, however, be effective in maintaining the adequacy of our internal controls, and any failure to maintain that adequacy, or consequent inability to produce accurate financial statements on a timely basis, could increase our operating costs and could materially impair our ability to operate our business. In the event that we are not able to demonstrate compliance with Section 404 of the Sarbanes-Oxley Act in a timely manner, that our internal controls are perceived as inadequate or that we are unable to produce timely or accurate financial statements, investors may lose confidence in our operating results and our stock price could decline.
33
Our ability to raise capital in the future may be limited, and our failure to raise capital when needed could prevent us from growing.
Our business and operations may consume resources faster than we anticipate. In the future, we may need to raise additional funds to invest in future growth opportunities. Additional financing may not be available on favorable terms, if at all. If adequate funds are not available on acceptable terms, we may be unable to invest in future growth opportunities, which could seriously harm our business and operating results. If we incur debt, the debt holders would have rights senior to common stockholders to make claims on our assets, and the terms of any debt could restrict our operations, including our ability to pay dividends on our common stock. Furthermore, if we issue additional equity securities, stockholders will experience dilution, and the new equity securities could have rights senior to those of our common stock. Because our decision to issue securities in any future offering will depend on market conditions and other factors beyond our control, we cannot predict or estimate the amount, timing or nature of our future offerings. As a result, our stockholders bear the risk of our future securities offerings reducing the market price of our common stock and diluting their interest.
Substantial future sales of shares of our common stock by existing stockholders could depress the market price of our common stock.
The market price for our common stock could decline as a result of the sale of substantial amounts of our common stock, particularly sales by our directors, executive officers and significant stockholders, a large number of shares of our common stock becoming available for sale or the perception in the market that holders of a large number of shares intend to sell their shares. Based on shares outstanding as of March 31, 2013, after giving effect to the issuance of 221,303 shares of our common stock to be acquired by certain selling stockholders through option exercises and vesting and settlement of restricted stock units in order to sell shares in this offering, upon completion of this offering and the concurrent private placement, we will have outstanding approximately 35.8 million shares of common stock, approximately 29.7 million of which are subject to the 180-day contractual lock-up more fully described in "Underwriting". Goldman, Sachs & Co. and Credit Suisse Securities (USA) LLC may permit our officers, directors, employees and current stockholders to sell shares prior to the expiration of the lock-up agreements.
After this offering and the concurrent private placement, holders of an aggregate of 26,376,142 shares of our common stock as of March 31, 2013, will have rights, subject to some conditions, to require us to file registration statements covering their shares or to include their shares in registration statements that we may file for ourselves or our stockholders. Substantially all of these shares are subject to the 180-day contractual lock-up referred to above.
In addition, the shares of common stock subject to outstanding options under our equity incentive plans and the shares reserved for future issuance under our equity incentive plans will become eligible for sale in the public market in the future, subject to certain legal and contractual limitations. See "Shares Eligible for Future Sale" for a more detailed description of sales that may occur in the future.
If a substantial number of shares are sold, or if it is perceived that they will be sold, in the public market, before or after the expiration of the 180-day contractual lock-up period, the trading price of our common stock could decline substantially.
Anti-takeover provisions in our charter documents and Delaware law may delay or prevent an acquisition of our company.
Our amended and restated certificate of incorporation, amended and restated bylaws and Delaware law contain provisions that may have the effect of delaying or preventing a change in
34
control of us or changes in our management. Our amended and restated certificate of incorporation and bylaws, which will become effective upon the closing of this offering, include provisions that:
- •
- authorize "blank check" preferred stock, which could be issued by the board without stockholder approval and may contain
voting, liquidation, dividend and other rights superior to our common stock;
- •
- create a classified board of directors whose members serve staggered three-year terms;
- •
- specify that special meetings of our stockholders can be called only by our board of directors, the chairperson of the
board, the chief executive officer or the president;
- •
- prohibit stockholder action by written consent;
- •
- establish an advance notice procedure for stockholder approvals to be brought before an annual meeting of our
stockholders, including proposed nominations of persons for election to our board of directors;
- •
- provide that our directors may be removed only for cause;
- •
- provide that vacancies on our board of directors may be filled only by a majority of directors then in office, even though
less than a quorum;
- •
- specify that no stockholder is permitted to cumulate votes at any election of directors;
- •
- authorize our board of directors to modify, alter or repeal our amended and restated bylaws; and
- •
- require supermajority votes of the holders of our common stock to amend specified provisions of our charter documents.
These provisions, alone or together, could delay or prevent hostile takeovers and changes in control or changes in our management.
In addition, because we are incorporated in Delaware, we are governed by the provisions of Section 203 of the Delaware General Corporation Law, which limits the ability of stockholders owning in excess of 15% of our outstanding voting stock to merge or combine with us in certain circumstances.
Any provision of our amended and restated certificate of incorporation or amended and restated bylaws or Delaware law that has the effect of delaying or deterring a change in control could limit the opportunity for our stockholders to receive a premium for their shares of our common stock, and could also affect the price that some investors are willing to pay for our common stock.
If you purchase shares of our common stock in this offering, you will experience substantial and immediate dilution.
If you purchase shares of our common stock in this offering, you will experience substantial and immediate dilution in the pro forma net tangible book value per share after giving effect to this offering and the concurrent private placement of $9.48 per share as of March 31, 2013, based on an assumed initial public offering price of $12.00 per share, which is the midpoint of the estimated offering price range set forth on the cover page of this prospectus, because the price that you pay will be substantially greater than the pro forma net tangible book value per share of the common stock that you acquire. This dilution is due in large part to the fact that our earlier investors paid substantially less than the initial public offering price when they purchased their shares of our capital stock. You will experience additional dilution upon exercise of any warrant, upon exercise of options to purchase common stock under our equity incentive plans, if we issue restricted stock to
35
our employees under our equity incentive plans or if we otherwise issue additional shares of our common stock. For a further description of the dilution that you will experience immediately after this offering, see "Dilution".
Our management will have broad discretion over the use of the proceeds we receive in this offering and the concurrent private placement and might not apply the proceeds in ways that increase the value of your investment.
Our management will have broad discretion to use the net proceeds from this offering and the concurrent private placement, and you will be relying on the judgment of our management regarding the application of these proceeds. Our management might not apply the net proceeds in ways that increase the value of your investment. We intend to use the net proceeds for working capital and other general corporate purposes. We may use a portion of the net proceeds to us to expand our current business through acquisitions of other businesses, products and technologies. Until we use the net proceeds from this offering and the concurrent private placement, we plan to invest them, and these investments may not yield a favorable rate of return. If we do not invest or apply the net proceeds from this offering and the concurrent private placement in ways that enhance stockholder value, we may fail to achieve expected financial results, which could cause our stock price to decline.
We do not currently intend to pay dividends on our common stock and, consequently, your ability to achieve a return on your investment will depend on appreciation in the price of our common stock.
We have never declared or paid any cash dividends on our common stock and do not currently intend to do so for the foreseeable future. In addition, any future financing or credit agreements may prohibit us from paying any type of dividends. We currently intend to invest our future earnings, if any, to fund our growth. Therefore, you are not likely to receive any dividends on your common stock for the foreseeable future and the success of an investment in shares of our common stock will depend upon any future appreciation in its value. Consequently, investors may need to sell all or part of their holdings of our common stock after price appreciation, which may never occur, as the only way to realize any future gains on their investment. There is no guarantee that shares of our common stock will appreciate in value or even maintain the price at which our stockholders have purchased their shares. Investors seeking cash dividends should not purchase our common stock.
We are an "emerging growth company" and the reduced disclosure requirements applicable to emerging growth companies may make our common stock less attractive to investors.
We are an "emerging growth company", as defined in the JOBS Act, and we may take advantage of certain exemptions from various reporting requirements that are applicable to other public companies that are not "emerging growth companies" including, but not limited to, not being required to comply with the auditor attestation requirements of Section 404 of the Sarbanes-Oxley Act, reduced financial disclosure obligations, reduced disclosure obligations regarding executive compensation in our periodic reports and proxy statements, and exemptions from the requirements of holding a nonbinding advisory vote on executive compensation and any golden parachute payments not previously approved. We may take advantage of these provisions for up to five years or such earlier time that we are no longer an "emerging growth company". We would cease to be an "emerging growth company" upon the earliest to occur of: the last day of the fiscal year in which we have more than $1.0 billion in annual revenue; the date we qualify as a "large accelerated filer", with at least $700 million of equity securities held by non-affiliates; the issuance, in any three-year period, by us of more than $1.0 billion in non-convertible debt securities; and the
36
last day of the fiscal year ending after the fifth anniversary of our initial public offering. We may choose to take advantage of some but not all of these reduced reporting burdens. If we take advantage of any of these reduced reporting burdens in future filings, the information that we provide our security holders may be different than you might get from other public companies in which you hold equity interests. We cannot predict if investors will find our common stock less attractive because we may rely on these exemptions. If some investors find our common stock less attractive as a result, there may be a less active trading market for our common stock and our stock price may be more volatile.
In addition, Section 107 of the JOBS Act provides that an "emerging growth company" can take advantage of the extended transition period provided in Section 7(a)(2)(B) of the Securities Act for complying with new or revised accounting standards. In other words, an "emerging growth company" can delay the adoption of certain accounting standards until those standards would otherwise apply to private companies. However, we have chosen to "opt out" of such extended transition period, and as a result, we will comply with new or revised accounting standards on the relevant dates on which adoption of such standards is required for non-emerging growth companies. Section 107 of the JOBS Act provides that our decision to opt out of the extended transition period for complying with new or revised accounting standards is irrevocable.
37
SPECIAL NOTE REGARDING FORWARD-LOOKING STATEMENTS
This prospectus contains forward-looking statements that involve substantial risks and uncertainties. Forward-looking statements generally relate to future events or our future financial or operating performance. In some cases you can identify forward-looking statements because they contain words such as "anticipates", "believes", "could", "estimates", "expects", "intends", "may", "might", "likely", "plans", "potential", "predicts, "projects", "seeks", "should", "target", "will", "would" or similar expressions and the negatives of those terms. Forward-looking statements contained in this prospectus include, but are not limited to, statements about:
- •
- our future financial performance, including our expectations regarding our revenue, cost of revenue, gross profit or gross
margin, operating expenses, ability to generate cash flow, and ability to achieve, and maintain, future profitability;
- •
- anticipated trends, growth rates and challenges in our business and in the markets in which we operate;
- •
- our ability to anticipate market needs and develop new and enhanced products and services to meet those needs, and our
ability to successfully monetize them;
- •
- maintaining and expanding our customer base and our relationships with other companies;
- •
- the impact of competition in our industry and innovation by our competitors;
- •
- our anticipated growth and growth strategies and our ability to effectively manage that growth and effect these
strategies;
- •
- our ability to sell our products and expand internationally;
- •
- our failure to anticipate and adapt to future changes in our industry;
- •
- the impact of seasonality on our business;
- •
- our ability to hire and retain necessary qualified employees to expand our operations;
- •
- the impact of any failure of our solutions or solution innovations;
- •
- our reliance on our third-party service providers;
- •
- the evolution of technology affecting our products, services and markets;
- •
- our ability to adequately protect our intellectual property;
- •
- the anticipated effect on our business of litigation to which we are or may become a party;
- •
- our ability to stay abreast of new or modified laws and regulations that currently apply or become applicable to our
business both in the United States and internationally;
- •
- the increased expenses and administrative workload associated with being a public company;
- •
- failure to maintain an effective system of internal controls necessary to accurately report our financial results and
prevent fraud;
- •
- our liquidity and working capital requirements;
- •
- our spending of the net proceeds from this offering and the concurrent private placement;
- •
- the estimates and estimate methodologies used in preparing our consolidated financial statements and determining option exercise prices; and
38
- •
- the future trading prices of our common stock and the impact of securities analysts' reports on these prices.
We caution you that the foregoing list may not contain all of the forward-looking statements made in this prospectus.
You should not rely upon forward-looking statements as predictions of future events. We have based the forward-looking statements contained in this prospectus primarily on our current expectations and projections about future events and trends that we believe may affect our business, financial condition, operating results and growth prospects. The outcome of the events described in these forward-looking statements is subject to risks, uncertainties and other factors described in the section titled "Risk Factors" and elsewhere in this prospectus. Moreover, we operate in a very competitive and rapidly changing environment. New risks and uncertainties emerge from time to time, and it is not possible for us to predict all risks and uncertainties that could have an impact on the forward-looking statements contained in this prospectus. Further, our forward-looking statements do not reflect the potential impact of any future acquisitions, mergers, dispositions, joint ventures or investments we may make. We cannot assure you that the results, events and circumstances reflected in the forward-looking statements will be achieved or occur, and actual results, events or circumstances could differ materially from those described in the forward-looking statements.
The forward-looking statements made in this prospectus relate only to events as of the date on which the statements are made. We undertake no obligation to update any forward-looking statements made in this prospectus to reflect events or circumstances after the date of this prospectus or to reflect new information or the occurrence of unanticipated events, except as required by law. We may not actually achieve the plans, intentions or expectations disclosed in our forward-looking statements and you should not place undue reliance on our forward-looking statements.
39
This prospectus contains estimates and other statistical data, including those relating to our industry and the market in which we operate, that we have obtained or derived from industry publications and reports, including reports from CMO Council, Gartner, Inc. and International Data Corporation (IDC). These industry publications and reports generally indicate that they have obtained their information from sources believed to be reliable, but do not guarantee the accuracy and completeness of their information. This information involves a number of assumptions and limitations, and you are cautioned not to give undue weight to these estimates, as there is no assurance that any of them will be reached. Based on our industry experience, we believe that the publications and reports are reliable and that the conclusions contained in the publications and reports are reasonable. The industry in which we operate is subject to a high degree of uncertainty and risk due to a variety of factors, including those described in the section titled "Risk Factors". These and other factors could cause our actual results to differ materially from those expressed in the industry publications and reports.
The Gartner Reports described herein represent data, research opinion or viewpoints published as part of a syndicated subscription service, by Gartner, and are not representations of fact. Each Gartner Report speaks as of its original publication date (and not as of the date of this prospectus) and the opinions expressed in the Gartner Reports are subject to change without notice.
The sources of industry and market data contained in this prospectus are listed below:
- (1)
- CMO
Council's The 2011 State of Marketing;
- (2)
- Gartner's
Forecast: Enterprise Software Markets, Worldwide, 2009-2016, 4Q12 Update; and
- (3)
- IDC's 2012 CMO Tech Marketing Barometer Study: Trends, Forecast, and Essential Guidance for Tech Marketing Executives.
40
We estimate that the net proceeds to us from the sale of shares of our common stock in this offering and the concurrent private placement will be $66.7 million, based on an assumed initial public offering price of $12.00 per share, which is the midpoint of the estimated offering price range set forth on the cover page of this prospectus, after deducting estimated underwriting discounts and commissions and estimated offering expenses. If the underwriters' option to purchase additional shares from us is exercised in full, we estimate that our net proceeds would be $76.8 million, after deducting estimated underwriting discounts and commissions and estimated offering expenses.
Each $1.00 increase or decrease in the assumed initial public offering price of $12.00 per share would increase or decrease the net proceeds that we receive from this offering and the concurrent private placement by $5.8 million, assuming that the number of shares offered by us, as set forth on the cover page of this prospectus, remains the same, and after deducting estimated underwriting discounts and commissions. Similarly, each increase or decrease of one million shares in the number of shares of common stock offered by us in this offering would increase or decrease the net proceeds that we receive from this offering by $11.2 million, assuming the assumed initial public offering price remains the same and after deducting estimated underwriting discounts and commissions.
The principal purposes of this offering are to increase our financial flexibility, improve brand awareness, create a public market for our common stock and facilitate our future access to the public capital markets. As of the date of this prospectus, we have no specific plans for the use of the net proceeds we receive from this offering and the concurrent private placement. However, we currently intend to use the net proceeds that we will receive for working capital and other general corporate purposes, including the expansion of our sales organization, international expansion, and further development and expansion of our solutions. We may also use a portion of the net proceeds that we receive to acquire or invest in complementary businesses, products, services, technologies or other assets. We have not entered into any agreements or commitments with respect to any potential acquisitions or investments at this time.
We cannot specify with certainty all of the particular uses of the net proceeds that we will receive from this offering and the concurrent private placement. Accordingly, we will have broad discretion in using these proceeds. Furthermore, the amount and timing of our actual expenditures will depend on numerous factors, including the cash used in or generated by our operations, the status of our development, the level of our sales and marketing activities, the pace of our international expansion plans, and our investments and acquisitions. Pending the use of proceeds as described above, we plan to invest the net proceeds that we receive in short-term and intermediate-term interest-bearing obligations, investment-grade investments, certificates of deposit or direct or guaranteed obligations of the U.S. government. We cannot predict whether the invested proceeds will yield a favorable return.
We have never declared or paid cash dividends on our common stock. We currently intend to retain all available funds and any future earnings for use in the operation of our business and do not anticipate paying any dividends on our common stock in the foreseeable future. Any future determination to declare dividends will be made at the discretion of our board of directors and will depend on our financial condition, operating results, capital requirements, general business conditions and other factors that our board of directors may deem relevant.
41
The following table sets forth our consolidated cash and cash equivalents and capitalization as of March 31, 2013 on:
- •
- an actual basis;
- •
- on a pro forma basis to reflect the automatic conversion of all outstanding shares of our convertible preferred stock into
25,876,142 shares of our common stock upon the completion of this offering; and
- •
- on a pro forma as adjusted basis to reflect our receipt of the net proceeds from (i) our sale of 5,750,000 shares of common stock in this offering at an assumed initial public offering price of $12.00 per share, which is the midpoint of the estimated offering price range set forth on the front cover of this prospectus, after deducting estimated underwriting discounts and commissions and estimated offering expenses, (ii) the sale of 500,000 shares of common stock to be purchased from us by Battery Ventures in the concurrent private placement at an assumed offering price of $12.00 per share, the midpoint of the price range for our initial public offering set forth on the cover of this prospectus, and (iii) the issuance of shares of common stock to be acquired by certain selling stockholders upon the exercise of options and the vesting and settlement of restricted stock units in order to sell those shares in this offering.
42
The information below is illustrative only and our capitalization following the completion of this offering and the concurrent private placement will be adjusted based on the actual initial public offering price and other terms of this offering determined at pricing. You should read this table together with the section titled "Management's Discussion and Analysis of Financial Condition and Results of Operations" and our financial statements and the related notes appearing elsewhere in this prospectus.
| |
March 31, 2013
|
|||||||||
|---|---|---|---|---|---|---|---|---|---|---|
| |
Actual
|
Pro Forma
|
Pro Forma As Adjusted(1) |
|||||||
| |
(in thousands, except share and per share data) |
|||||||||
| |
(unaudited) |
|||||||||
Cash and cash equivalents |
$ | 36,176 | $ | 36,176 | $ | 102,872 | ||||
Total indebtedness |
$ |
3,640 |
$ |
3,640 |
$ |
3,640 |
||||
Stockholders' equity: |
||||||||||
Convertible preferred stock, $0.0001 par value: 51,752,313 shares authorized, 25,876,142 shares issued and outstanding, actual; no shares authorized, issued or outstanding, pro forma and pro forma as adjusted |
119,121 | — | — | |||||||
Common stock, $0.0001 par value; 100,000,000 shares authorized, 3,436,704 shares issued and outstanding, actual; 100,000,000 shares authorized, 29,312,846 shares issued and outstanding, pro forma; and 1,000,000,000 shares authorized, 35,784,149 shares issued and outstanding, pro forma as adjusted |
0 | 3 | 4 | |||||||
Additional paid-in capital |
8,021 | 127,139 | 193,834 | |||||||
Accumulated other comprehensive income |
183 | 183 | 183 | |||||||
Accumulated deficit |
(91,725 | ) | (91,725 | ) | (91,725 | ) | ||||
Total stockholders' equity |
35,600 | 35,600 | 102,296 | |||||||
Total capitalization |
$ | 39,240 | $ | 39,240 | $ | 105,936 | ||||
- (1)
- Each $1.00 increase or decrease in the assumed initial public offering price of $12.00 per share, which is the midpoint of the estimated offering price range set forth on the cover page of this prospectus, would increase or decrease each of cash and cash equivalents, additional paid-in capital, total stockholders' equity and total capitalization by approximately $5.8 million, assuming the number of shares offered by us, as set forth on the cover page of this prospectus, remains the same, and after deducting estimated underwriting discounts and commissions. Similarly, each increase or decrease of one million shares in the number of shares offered by us in this offering would increase or decrease, as applicable, cash and cash equivalents, additional paid-in capital, total stockholders' equity and total capitalization by approximately $11.2 million, assuming an initial public offering price of $12.00 per share, which is the midpoint of the estimated offering price range set forth on the cover page of this prospectus, and after deducting estimated underwriting discounts and commissions.
43
The number of shares of our common stock set forth in the table above excludes:
- •
- 7,982,829 shares of common stock issuable upon the exercise of options outstanding as of March 31, 2013 (other than
144,915 shares to be sold in this offering by certain selling stockholders upon the exercise of options), with a weighted average exercise price of $4.17 per share;
- •
- 345,614 shares of common stock issuable upon vesting of restricted stock units outstanding as of March 31, 2013
(other than 76,388 shares to be sold in this offering by certain selling stockholders upon the vesting and settlement of restricted stock units); and
- •
- 4,199,832 shares of common stock reserved for future issuance under our stock-based compensation plans, consisting of 509,670 shares of common stock reserved for future issuance under our 2006 Stock Plan, which shares will be added to the shares to be reserved under our 2013 Equity Incentive Plan, 2,952,130 shares of common stock reserved for future issuance under our 2013 Equity Incentive Plan, which will become effective in connection with this offering, 738,032 shares of common stock reserved for future issuance under our 2013 Employee Stock Purchase Plan, which will become effective in connection with this offering, and shares that become available under our 2013 Equity Incentive Plan and 2013 Employee Stock Purchase Plan, pursuant to provisions thereof that automatically increase the share reserves under the plans each year, as more fully described in the section titled "Executive Compensation — Employee Benefit and Stock Plans".
44
If you invest in our common stock in this offering, your interest will be diluted to the extent of the difference between the initial public offering price per share of our common stock and the pro forma as adjusted net tangible book value per share of our common stock immediately after this offering and the concurrent private placement. Net tangible book value dilution per share to new investors represents the difference between the amount per share paid by purchasers of shares of common stock in this offering and the pro forma as adjusted net tangible book value per share of common stock immediately after completion of this offering and the concurrent private placement.
Net tangible book value per share is determined by dividing our total tangible assets less our total liabilities by the number of shares of common stock outstanding. Our pro forma net tangible book value as of March 31, 2013 was $23.5 million, or $0.80 per share, based on the total number of shares of our common stock outstanding as of March 31, 2013, after giving effect to the conversion of all outstanding shares of our convertible preferred stock into shares of common stock, which will occur upon the completion of this offering.
After giving effect to (i) the sale by us of 5,750,000 shares of our common stock in this offering at the assumed initial public offering price of $12.00 per share, which is the midpoint of the estimated offering price range set forth on the cover page of this prospectus, after deducting estimated underwriting discounts and commissions and estimated offering expenses, (ii) the sale of 500,000 shares of common stock to be purchased from us by Battery Ventures in the concurrent private placement at an assumed offering price of $12.00 per share, the midpoint of the price range for our initial public offering set forth on the cover of this prospectus and (iii) the issuance of 221,303 shares of common stock to be acquired by certain selling stockholders upon the exercise of options and the vesting and settlement of restricted stock units in order to sell those shares in this offering, our pro forma as adjusted net tangible book value as of March 31, 2013 would have been approximately $90.2 million, or $2.52 per share. This represents an immediate increase in pro forma net tangible book value of $1.72 per share to our existing stockholders and an immediate dilution of $9.48 per share to investors purchasing shares of common stock in this offering at the assumed initial public offering price. The following table illustrates this dilution:
Assumed initial public offering price per share |
$ | 12.00 | |||||
Pro forma net tangible book value per share as of March 31, 2013 |
$ | 0.80 | |||||
Increase in pro forma net tangible book value per share attributable to new investors in this offering |
1.72 | ||||||
Pro forma as adjusted net tangible book value per share immediately after this offering |
$ | 2.52 | |||||
Dilution in pro forma net tangible book value per share to new investors in this offering |
$ | 9.48 | |||||
Each $1.00 increase or decrease in the assumed initial public offering price of $12.00 per share, which is the midpoint of the estimated offering price range set forth on the cover page of this prospectus, would increase or decrease, as applicable, our pro forma as adjusted net tangible book value per share to new investors by $0.16, and would increase or decrease, as applicable, dilution per share to new investors in this offering by $0.84, assuming that the number of shares offered by us, as set forth on the cover page of this prospectus, remains the same, after deducting estimated underwriting discounts and commissions. In addition, to the extent any outstanding options to purchase common stock are exercised, new investors will experience further dilution.
If the underwriters exercise their option to purchase additional shares from us in full, the pro forma as adjusted net tangible book value per share of our common stock immediately after this
45
offering and the concurrent private placement would be $2.73 per share, and the dilution in pro forma net tangible book value per share to new investors in this offering would be $9.27 per share.
The following table summarizes, on a pro forma as adjusted basis as of March 31, 2013, assuming the conversion of all outstanding shares of our convertible preferred stock into common stock, the total number of shares of common stock purchased from us, the total consideration paid to us, and the average price per share paid to us by existing stockholders, by new investors purchasing shares in this offering at the initial public offering price of $12.00 per share, which is the midpoint of the estimated offering price range set forth on the front cover of this prospectus, before deducting estimated underwriting discounts and commissions and estimated offering expenses, and the private placement investors purchasing shares at an assumed offering price of $12.00 per share, the midpoint of the price range for our initial public offering set forth on the cover of this prospectus:
| |
Shares Purchased | Total Consideration | |
|||||||||||||
|---|---|---|---|---|---|---|---|---|---|---|---|---|---|---|---|---|
| |
Average Price Per Share |
|||||||||||||||
| |
Number
|
Percent
|
Amount
|
Percent
|
||||||||||||
Existing stockholders |
29,534,149 | 82.5 | % | $ | 109,288,668 | 59.3 | % | $ | 3.70 | |||||||
New public investors |
5,750,000 | 16.1 | 69,000,000 | 37.4 | 12.00 | |||||||||||
Private placement investors |
500,000 | 1.4 | 6,000,000 | 3.3 | 12.00 | |||||||||||
Total |
35,784,149 | 100.0 | % | $ | 184,288,668 | 100.0 | % | $ | 5.15 | |||||||
Each $1.00 increase or decrease in the assumed initial public offering price of $12.00 per share would increase or decrease the total consideration paid by new investors and total consideration paid by all stockholders by approximately $5.8 million, assuming that the number of shares offered by us, as set forth on the cover page of this prospectus, remains the same, after deducting estimated underwriting discounts and commissions. In addition, to the extent any outstanding options to purchase common stock are exercised, new investors will experience further dilution.
If the underwriters exercise their option to purchase additional shares from us in full, our existing stockholders would own 80.5%, our new investors would own 18.1% and the private placement investors would own 1.4% of the total number of shares of our common stock outstanding upon the completion of this offering and the concurrent private placement.
The foregoing discussion and tables exclude:
- •
- 7,982,829 shares of common stock issuable upon the exercise of options outstanding as of March 31, 2013 (other than
144,915 shares to be sold in this offering by certain selling stockholders upon the exercise of options), with a weighted average exercise price of $4.17 per share;
- •
- 345,614 shares of common stock issuable upon vesting of restricted stock units outstanding as of March 31, 2013
(other than 76,388 shares to be sold in this offering by certain selling stockholders upon the vesting and settlement of restricted stock units); and
- •
- 4,199,832 shares of common stock reserved for future issuance under our stock-based compensation plans, consisting of 509,670 shares of common stock reserved for future issuance under our 2006 Stock Plan, which shares will be added to the shares to be reserved under our 2013 Equity Incentive Plan, 2,952,130 shares of common stock reserved for future issuance under our 2013 Equity Incentive Plan, which will become effective in connection with this offering, 738,032 shares of common stock reserved for future issuance under our 2013 Employee Stock Purchase Plan, which will become effective in connection with this offering, and shares that become available under our 2013 Equity Incentive Plan and 2013 Employee Stock Purchase Plan, pursuant to provisions thereof that automatically increase the share reserves under the plans each year, as more fully described in the section titled "Executive Compensation — Employee Benefit and Stock Plans".
46
SELECTED CONSOLIDATED FINANCIAL DATA
You should read the following selected consolidated financial data below in conjunction with "Management's Discussion and Analysis of Financial Condition and Results of Operations" and the consolidated financial statements, related notes and other financial information included elsewhere in this prospectus. The selected consolidated financial data in this section are not intended to replace the consolidated financial statements and are qualified in their entirety by the consolidated financial statements and related notes included elsewhere in this prospectus.
The consolidated statements of operations data for the years ended December 31, 2010, 2011 and 2012 and the consolidated balance sheet data as of December 31, 2011 and 2012 are derived from our audited consolidated financial statements included elsewhere in this prospectus. The consolidated statements of operations data for the year ended December 31, 2009 and the consolidated balance sheet data as of December 31, 2009 and 2010 are derived from our audited consolidated financial statements not included in this prospectus. The consolidated statements of operations data for the three months ended March 31, 2012 and 2013 and the consolidated balance sheet data as of March 31, 2013 are derived from our unaudited interim consolidated financial statements included elsewhere in this prospectus. Our unaudited interim consolidated financial statements were prepared on a basis consistent with our audited consolidated financial statements and include, in our opinion, all adjustments, consisting only of normal recurring adjustments that we consider necessary for a fair presentation of the financial information set forth in those statements included elsewhere in this prospectus. Our historical results are not necessarily
47
indicative of the results that may be expected in any future period, and our interim results are not necessarily indicative of the results that may be expected for the full year or any other period.
| |
Year Ended December 31, | Three Months Ended March 31, |
|||||||||||||||||
|---|---|---|---|---|---|---|---|---|---|---|---|---|---|---|---|---|---|---|---|
| |
2009
|
2010
|
2011
|
2012
|
2012
|
2013
|
|||||||||||||
| |
(in thousands, except per share data) |
||||||||||||||||||
| |
|
|
|
|
(unaudited) |
||||||||||||||
Consolidated Statement of Operations Data: |
|||||||||||||||||||
Revenue: |
|||||||||||||||||||
Subscription and support |
$ | 4,478 | $ | 13,473 | $ | 29,823 | $ | 52,756 | $ | 11,021 | $ | 17,555 | |||||||
Professional services and other |
— | 559 | 2,569 | 5,657 | 1,190 | 2,181 | |||||||||||||
Total revenue |
4,478 | 14,032 | 32,392 | 58,413 | 12,211 | 19,736 | |||||||||||||
Cost of revenue(1): |
|||||||||||||||||||
Subscription and support |
2,128 | 4,612 | 9,386 | 16,216 | 3,135 | 5,820 | |||||||||||||
Professional services and other |
— | 2,534 | 5,550 | 8,442 | 1,805 | 2,618 | |||||||||||||
Total cost of revenue |
2,128 | 7,146 | 14,936 | 24,658 | 4,940 | 8,438 | |||||||||||||
Gross profit: |
|||||||||||||||||||
Subscription and support |
2,350 | 8,861 | 20,437 | 36,540 | 7,886 | 11,735 | |||||||||||||
Professional services and other |
— | (1,975 | ) | (2,981 | ) | (2,785 | ) | (615 | ) | (437 | ) | ||||||||
Total gross profit |
2,350 | 6,886 | 17,456 | 33,755 | 7,271 | 11,298 | |||||||||||||
Operating expenses(1): |
|||||||||||||||||||
Research and development |
2,573 | 5,498 | 10,677 | 18,799 | 3,835 | 4,996 | |||||||||||||
Sales and marketing |
4,921 | 11,019 | 23,088 | 37,776 | 7,819 | 12,318 | |||||||||||||
General and administrative |
1,206 | 2,135 | 6,154 | 11,388 | 2,255 | 3,427 | |||||||||||||
Total operating expenses |
8,700 | 18,652 | 39,919 | 67,963 | 13,909 | 20,741 | |||||||||||||
Loss from operations |
(6,350 | ) | (11,766 | ) | (22,463 | ) | (34,208 | ) | (6,638 | ) | (9,443 | ) | |||||||
Other income (expense), net |
8 | (50 | ) | (137 | ) | (158 | ) | (15 | ) | (61 | ) | ||||||||
Loss before provision for income taxes |
(6,342 | ) | (11,816 | ) | (22,600 | ) | (34,366 | ) | (6,653 | ) | (9,504 | ) | |||||||
Provision for income taxes |
1 | 1 | 6 | 19 | 3 | 20 | |||||||||||||
Net loss |
$ | (6,343 | ) | $ | (11,817 | ) | $ | (22,606 | ) | $ | (34,385 | ) | $ | (6,656 | ) | $ | (9,524 | ) | |
Net loss attributable to common stockholders: |
|||||||||||||||||||
Basic and diluted |
$ | (6,343 | ) | $ | (11,817 | ) | $ | (22,606 | ) | $ | (34,385 | ) | $ | (6,656 | ) | $ | (9,524 | ) | |
Net loss per share attributable to common stockholders: |
|||||||||||||||||||
Basic and diluted |
$ | (4.43 | ) | $ | (5.99 | ) | $ | (9.94 | ) | $ | (12.26 | ) | $ | (2.60 | ) | $ | (2.99 | ) | |
Weighted average shares used in computing net loss per share attributable to common stockholders: |
|||||||||||||||||||
Basic and diluted |
1,432 | 1,972 | 2,274 | 2,806 | 2,558 | 3,181 | |||||||||||||
Pro forma net loss per share attributable to common stockholders: |
|||||||||||||||||||
Basic and diluted |
$ | (1.21 | ) | $ | (0.33 | ) | |||||||||||||
Weighted average shares used in computing pro forma net loss per share attributable to common stockholders: |
|||||||||||||||||||
Basic and diluted |
28,435 | 29,057 | |||||||||||||||||
48
- (1)
- Amounts include stock-based compensation expense as follows:
| |
Year Ended December 31, | Three Months Ended March 31, |
|||||||||||||||||
|---|---|---|---|---|---|---|---|---|---|---|---|---|---|---|---|---|---|---|---|
| |
2009
|
2010
|
2011
|
2012
|
2012
|
2013
|
|||||||||||||
| |
(in thousands) |
||||||||||||||||||
| |
|
|
|
|
(unaudited) |
||||||||||||||
Cost of subscription and support revenue |
$ | 5 | $ | 50 | $ | 108 | $ | 216 | $ | 30 | $ | 63 | |||||||
Cost of professional services and other revenue |
— | 8 | 49 | 169 | 31 | 93 | |||||||||||||
Research and development |
25 | 73 | 294 | 575 | 111 | 210 | |||||||||||||
Sales and marketing |
14 | 57 | 509 | 966 | 206 | 230 | |||||||||||||
General and administrative |
14 | 131 | 349 | 1,046 | 135 | 405 | |||||||||||||
Total stock-based compensation expense |
$ | 58 | $ | 319 | $ | 1,309 | $ | 2,972 | $ | 513 | $ | 1,001 | |||||||
| |
December 31, | March 31, 2013 |
||||||||||||||
|---|---|---|---|---|---|---|---|---|---|---|---|---|---|---|---|---|
| |
2009
|
2010
|
2011
|
2012
|
||||||||||||
| |
(in thousands) |
|||||||||||||||
| |
|
|
|
|
(unaudited) |
|||||||||||
Consolidated Balance Sheet Data: |
||||||||||||||||
Cash and cash equivalents |
$ | 8,906 | $ | 34,457 | $ | 67,400 | $ | 44,247 | $ | 36,176 | ||||||
Working capital |
8,289 | 31,579 | 59,651 | 28,346 | 18,931 | |||||||||||
Total assets |
11,601 | 39,551 | 79,738 | 79,156 | 75,866 | |||||||||||
Total indebtedness |
— | — | — | 3,640 | 3,640 | |||||||||||
Deferred revenue |
1,671 | 4,552 | 10,968 | 20,642 | 24,508 | |||||||||||
Total liabilities |
2,862 | 7,335 | 18,430 | 35,592 | 40,266 | |||||||||||
Convertible preferred stock |
21,976 | 56,887 | 106,821 | 119,121 | 119,121 | |||||||||||
Total stockholders' equity |
8,739 | 32,216 | 61,308 | 43,564 | 35,600 | |||||||||||
49
MANAGEMENT'S DISCUSSION AND ANALYSIS OF
FINANCIAL CONDITION AND RESULTS OF OPERATIONS
The following discussion and analysis of our financial condition and results of operations should be read in conjunction with our consolidated financial statements and the related notes to those statements included elsewhere in this prospectus. In addition to historical financial information, the following discussion and analysis contains forward-looking statements that involve risks, uncertainties and assumptions. Our actual results and timing of selected events may differ materially from those anticipated in these forward-looking statements as a result of many factors, including those discussed under the section titled "Risk Factors" and elsewhere in this prospectus.
We are the provider of a leading cloud-based marketing software platform that enables organizations to engage in modern relationship marketing. Our software platform is designed to enable the effective execution, management and analytical measurement of marketing activities, helping organizations to acquire new customers more efficiently, build stronger relationships with existing customers, improve sales effectiveness and drive faster revenue growth. On our platform, we deliver an easy-to-use, integrated suite of advanced applications, which today include Marketing Automation, Social Marketing, Sales Insight and Revenue Analytics. To enable our customers to obtain maximum value from our platform, we have created an ecosystem of third-party applications, as well as a network of resources to foster marketing thought leadership, sharing and collaboration among our users. Furthermore, we provide our customers with expert professional services, delivered by marketers, for marketers, to enable rapid time to value through effective implementation and usage of our solutions.
We designed our platform to be valuable across large enterprises and SMBs that sell to both businesses and consumers in virtually any industry. We market and sell our products directly and through a growing network of distribution partners. Our client base is diverse, with over 2,300 customers across a wide range of industries including business services, consumer, financial services, healthcare, manufacturing, media, technology and telecommunications. Representative customers include one or more divisions of the following companies: Capgemini, CenturyLink, Citrix, Gannett, General Electric, Medtronic, Moody's, Panasonic, Symantec and Universal Music Group. Except for a single customer in 2011 who was slightly over 1%, no single customer represented more than 1% of subscription and support revenue in 2010, 2011, 2012 and for the three months ended March 31, 2012 and 2013. For each of 2011 and 2012, our 20 largest customers accounted for less than 10% of our total revenue. Our subscription dollar retention rate was approximately 100% for each of 2011 and 2012.
We provide our solutions on a subscription basis and generated revenue of $14.0 million, $32.4 million and $58.4 million in 2010, 2011 and 2012, respectively, representing year-over-year increases of 131% and 80%, respectively. During the three months ended March 31, 2012 and 2013, we generated revenue of $12.2 million and $19.7 million, respectively, representing an increase of 62% during the first quarter of 2013 as compared to the first quarter of 2012. We had net losses of $11.8 million, $22.6 million, $34.4 million, $6.7 million and $9.5 million in 2010, 2011, 2012 and for the three months ended March 31, 2012 and 2013, respectively, due to increased investments in our growth.
Since our founding in 2006, we have achieved the following significant milestones:
- •
- In 2008, we launched our first product to address marketing automation and lead management, which we called Marketing Lead Management.
50
- •
- In 2009, we released Marketo Sales Insight to enable sales professionals to easily prioritize their best opportunities and
understand the actions and behaviors of their prospects and customers.
- •
- By the end of 2009, we had over 200 customers.
- •
- In 2010, we introduced Revenue Cycle Analytics, designed to provide marketers with a comprehensive analytics solution to
capture, analyze and better understand every stage of the revenue process, from lead generation to new business to customer lifetime value.
- •
- In 2011, as part of our commitment to expand sales in Europe, the Middle East and Africa (EMEA), we opened our first
international office in Dublin, Ireland.
- •
- By the end of 2011, we had over 1,000 customers.
- •
- In April 2012, we completed our first acquisition by acquiring Crowd Factory, which enabled us to integrate a rich set of
social media marketing capabilities into our application suite.
- •
- In the third quarter of 2012, we opened our Sydney, Australia office, to address increasing customer demand for our
solution in the Asia Pacific region.
- •
- By the end of 2012, we had over 2,000 customers.
We deliver our solutions entirely through a multi-tenant cloud-based, or Software as a Service (SaaS), architecture which customers can configure to their specific needs. We initially focused our selling efforts on the SMB market, but beginning in late 2010, to address growing enterprise demand, we began to invest in an enterprise sales organization. We define the SMB market as companies with fewer than 1,500 employees and the enterprise market as companies with 1,500 or more employees. The percentage of our revenue from enterprise customers increased to over 20% in 2012.
Our direct sales force has separate sales teams for the enterprise market and for the SMB market. Within our direct sales force, we also have a team that is responsible for selling to existing customers, who may renew their subscriptions, increase their usage of our platform and applications, acquire additional applications from our product family, or broaden the deployment of our solutions across their organizations. In addition, we have indirect sales teams that sell to distributors, agencies, resellers and OEMs, who in turn resell or use our platform to provide managed marketing services to their end customers. To date, substantially all of our revenue has been derived from direct sales, but we intend to invest in our indirect sales teams to increase indirect revenue as a percentage of our total revenue over time.
We derive most of our revenue from subscriptions to our cloud-based software and related customer support services. Subscription and support revenue accounted for 96.0%, 92.1%, 90.3%, 90.3% and 88.9% of our total revenue during 2010, 2011, 2012 and for the three months ended March 31, 2012 and 2013, respectively. We price our products based on customer usage measures, which can include the number of leads in each customer's database and the number of user seats authorized to access our service. Our subscription contracts range in length from one quarter to three years, and the weighted average length of the subscription contacts we entered into in 2012, weighted based on contracted revenue, was approximately 13 months.
Professional services revenue accounted for 4.0%, 7.9%, 9.7%, 9.7% and 11.1% of our total revenue during 2010, 2011, 2012 and for the three months ended March 31, 2012 and 2013, respectively. Our software is designed to be ready to use immediately upon provisioning of a new customer subscription. However, we believe that our customers' success is enhanced by the effective use of modern relationship marketing strategies performed with our software, which we foster primarily through the sale and delivery of expert services that educate our customers on the
51
best use of our solutions as well as assist in the implementation of our solution. In addition, some of our customers require services to support integrating their existing systems with our solution. Enterprise customers exhibit a higher demand for all of these services. Over the near term, due to market demand for expertise in modern relationship marketing, we expect our professional services revenue to grow faster than our subscription and support revenue, and therefore, to increase as a percentage of our total revenue. In addition, we also partner with third party consulting organizations that provide similar services to our customers in connection with their use of our platform.
Our customer base has grown from over 200 at the end of 2009 to over 2,000 at the end of 2012, which has resulted in rapid revenue growth. We generate the majority of our revenue in the United States; however, we are focused on growing our international business. Revenue generated from our international customers was 10.6%, 10.7%, 12.8%, 11.4% and 13.9% of our total revenue in 2010, 2011, 2012 and for the three months ended March 31, 2012 and 2013, respectively.
We have focused on rapidly growing our business and plan to continue to invest in growth. We expect our cost of revenue and operating expenses to continue to increase in absolute dollars in future periods. Marketing and sales expenses are expected to increase as we continue to expand our sales teams, increase our marketing activities and grow our international operations. Research and development expenses are expected to increase in absolute dollars to support the enhancement of our existing products and the development of new products. We also intend to invest in maintaining a high level of customer service and support which we consider critical for our continued success. We plan to continue investing in our data center infrastructure and services capabilities in order to support continued future customer growth. We also expect to incur additional general and administrative expenses as a result of both our growth and the infrastructure required to be a public company. Considering our plans for investment, we do not expect to be profitable in the near term and, in order to achieve profitability, we will need to grow revenue at a rate faster than our investments in cost of revenue and operating expenses.
Since our inception, we have financed our operations through cash collected from customers as well as preferred equity financings, with gross proceeds from such financings totaling $107.1 million. We also maintain an equipment financing facility. As of December 31, 2012 and March 31, 2013, we had outstanding borrowings of $3.6 million under this facility.
In May 2013, we entered into a stock purchase agreement with funds affiliated with Battery Ventures, which currently beneficially owns approximately 2.1 million shares of our common stock, pursuant to which such funds will purchase 500,000 shares of our common stock at a price per share equal to the initial public offering price in a private placement to close immediately subsequent to the closing of this offering. After giving effect to this offering and the private placement, Battery Ventures will beneficially own approximately 7.3% of our outstanding common stock.
We use the following key metrics to evaluate our business, measure our performance, identify trends affecting our business, formulate financial projections and make strategic decisions.
- •
- Number of Customers. Since we launched our first product we have made the expansion of our customer base a priority. We believe that our ability to expand our customer base is an indicator of our market penetration, the growth of our business and our potential future business opportunities. We define the number of customers at the end of any particular period as the number of customers with paid subscriptions to our software platform at the end of the period. Multiple companies or divisions within a single consolidated enterprise that each have a separate paid subscription to our platform are each treated as a separate
52
- •
- Subscription Dollar Retention Rate. We believe that our subscription dollar retention rate provides insight into our ability to retain and grow revenue from our customers, as well as their potential long-term value to us. Accordingly, we compare the aggregate monthly subscription revenue of our customer base in the last month of the prior year fiscal quarter, which we refer to as Retention Base Revenue, to aggregate monthly subscription revenue generated from the same group in the last month of the current quarter, which we refer to as Retained Subscription Revenue. Our Subscription Dollar Retention Rate is calculated on an annual basis by first dividing Retained Subscription Revenue by Retention Base Revenue, and then using the weighted average Subscription Dollar Retention Rate of the four fiscal quarters within the year. Our Subscription Dollar Retention Rate was approximately 100% for each of 2011 and 2012.
customer. In cases where our customers have subscriptions to our platform obtained through resellers or other distributors, each end customer is counted separately. As of December 31, 2012, we had over 2,000 customers.
Key Components of Consolidated Statements of Operations
Revenue
We generate revenue principally from fixed commitment subscription contracts under which we provide customers with various services, principally access to our cloud-based software platform as well as related customer support. We sell these services under contractual agreements that are typically one year in length, but which range from one quarter to three years based upon demands of the individual customer. We believe this flexibility in contract duration is important to meet the needs of customers of differing sizes and circumstances. A customer typically commits to fixed fees for the service term, which may be adjusted upward based on expanded usage volumes. Revenue from these agreements is recognized ratably over the period of service and any revenue that does not meet recognition criteria is recorded as deferred revenue on our balance sheet.
We invoice customers on varying billing cycles, primarily quarterly and annually; therefore, our deferred revenue balance represents the billed portion of our customer contracts. The number of customers that are billed quarterly or annually fluctuates from quarter to quarter based on deal mix and so is not fully predictable. Consequently, changes in deferred revenue may not be indicative of revenue growth in any given future period. Fees payable under our subscription contracts are generally due in full and non-refundable regardless of the actual use of the service.
Professional services revenue consists of fees associated with providing expert services that educate and assist our customers on the best use of our solutions as well as assist in the implementation of our solution. Historically, our professional and enablement services for our SMB customers were bundled as part of our subscription services at no additional fee to our customers. However, in November 2011, we began to charge a separate fixed fee for implementation and initial education for users of a new subscription. Most of our professional services contracts for our SMB customers are recognized over three to six months. Professional services for our enterprise customers are typically priced on a time-and-materials basis. We recognize revenue for these contracts as the work is performed, and the customer is billed. Our time-and-materials professional services are generally billed monthly in arrears based on actual hours of work delivered and expenses incurred.
Cost of Revenue
Cost of subscription revenue primarily consists of expenses related to hosting our service and providing support to our customers. These expenses are comprised of data center operations costs and personnel and related costs directly associated with our cloud infrastructure, customer support
53
and customer success organizations, including salaries, benefits, bonuses and stock-based compensation, as well as allocated overhead. Overhead associated with facilities, IT and depreciation, excluding depreciation related to our data center infrastructure, is allocated to our cost of revenue and operating expenses based on headcount. In 2012, to improve the responsiveness and cost efficiency of our data center operations, we began an effort to transition from a managed hosting service provider to co-location data center facilities for which we are purchasing and managing our own computer equipment and systems. This effort increased our costs in 2012 due to expenses associated with the project. This effort has resulted in increased cost of revenue during the three months ended March 31, 2013 when compared to the same quarter of 2012. We expect it will result in continued increased costs in 2013. However, this effort is designed to result in improved cost efficiencies over the longer term as our business scales, resulting in improved gross margins.
Cost of professional services and other revenue consists primarily of personnel and related costs directly associated with our professional services and education organizations, including salaries, benefits, bonuses and stock-based compensation, the costs of sub-contracted third-party vendors, as well as allocated overhead.
Research and Development Expenses
Research and development expenses consist primarily of personnel costs for our product development employees and executives. Also included are non-personnel costs such as professional fees payable to third-party development services, license and subscription fees for software development tools, and an allocation of our general overhead expenses. A substantial portion of our research and development efforts are focused on enhancing our software architecture and adding new features and functionality to our platform and we anticipate continuing to invest in innovation and technology development. Since 2011, we have expensed all our software development costs as they did not meet the criteria for capitalization. We expect our research and development expenses to increase in absolute dollars in future periods.
Sales and Marketing Expenses
Sales and marketing expenses consist primarily of personnel costs for our sales, marketing and business development employees and executives, including commissions earned by our sales and marketing personnel, which are expensed when a customer contract is executed. Also included are the costs of our lead generation marketing and brand awareness programs. Our marketing programs include a broad mix of paid marketing activities, such as digital content marketing, search engine marketing and social media marketing campaigns, including the use of our own marketing applications, as well as traditional offline advertising, direct mail and public relations. We also incur other non-personnel costs such as professional fees and an allocation of our general overhead expenses. In addition, we invest in several key industry events offered by our partners, as well as our own annual user conference.
We plan to continue investing in sales and marketing globally by increasing the number of direct and indirect sales personnel, expanding our domestic and international marketing activities, building brand awareness and sponsoring additional marketing events in an effort to add new customers and increase revenue from our existing customer base. We expect that, in the future, sales and marketing expenses will increase and continue to be our largest operating cost in absolute dollars.
54
General and Administrative Expenses
General and administrative expenses consist primarily of personnel costs for our administrative, legal, human resources, finance and accounting employees and executives. Also included are non-personnel costs, such as travel-related expenses, legal and other professional fees and other corporate expenses, along with an allocation of our general overhead expenses. We expect to incur incremental costs associated with supporting the growth of our business, both in terms of size and geographical diversity, and to meet the increased compliance requirements associated with our transition to and operation as a public company. Those costs include increases in our accounting, human resources, IT and legal personnel, additional consulting, legal and audit fees, insurance costs, board of directors' compensation and the costs of achieving and maintaining compliance with Section 404 of the Sarbanes-Oxley Act. As a result, we expect our general and administrative expenses to increase in absolute dollars in future periods.
Other Income (Expense), Net
Other income (expense), net consists primarily of interest expense, interest income and foreign exchange gains and losses. Interest expense represents interest paid on debt from our equipment financing facility. Interest income represents interest received on our cash and investments.
55
The following tables set forth our results of operations for the periods presented and as a percentage of our total revenue for those periods. The period-to-period comparison of financial results is not necessarily indicative of financial results to be achieved in future periods.
| |
Year Ended December 31,
|
Three Months Ended March 31, |
||||||||||||||
|---|---|---|---|---|---|---|---|---|---|---|---|---|---|---|---|---|
| |
2010
|
2011
|
2012
|
2012
|
2013
|
|||||||||||
| |
(in thousands) |
|||||||||||||||
| |
|
|
|
(unaudited) |
||||||||||||
Revenue: |
||||||||||||||||
Subscription and support |
$ | 13,473 | $ | 29,823 | $ | 52,756 | $ | 11,021 | $ | 17,555 | ||||||
Professional services and other |
559 | 2,569 | 5,657 | 1,190 | 2,181 | |||||||||||
Total revenue |
14,032 | 32,392 | 58,413 | 12,211 | 19,736 | |||||||||||
Cost of revenue(1): |
||||||||||||||||
Subscription and support |
4,612 | 9,386 | 16,216 | 3,135 | 5,820 | |||||||||||
Professional services and other |
2,534 | 5,550 | 8,442 | 1,805 | 2,618 | |||||||||||
Total cost of revenue |
7,146 | 14,936 | 24,658 | 4,940 | 8,438 | |||||||||||
Gross profit |
6,886 | 17,456 | 33,755 | 7,271 | 11,298 | |||||||||||
Operating expenses(1): |
||||||||||||||||
Research and development |
5,498 | 10,677 | 18,799 | 3,835 | 4,996 | |||||||||||
Sales and marketing |
11,019 | 23,088 | 37,776 | 7,819 | 12,318 | |||||||||||
General and administrative |
2,135 | 6,154 | 11,388 | 2,255 | 3,427 | |||||||||||
Total operating expenses |
18,652 | 39,919 | 67,963 | 13,909 | 20,741 | |||||||||||
Loss from operations |
(11,766 | ) | (22,463 | ) | (34,208 | ) | (6,638 | ) | (9,443 | ) | ||||||
Other income (expense), net |
(50 | ) | (137 | ) | (158 | ) | (15 | ) | (61 | ) | ||||||
Loss before provision for income taxes |
(11,816 | ) | (22,600 | ) | (34,366 | ) | (6,653 | ) | (9,504 | ) | ||||||
Provision for income taxes |
1 | 6 | 19 | 3 | 20 | |||||||||||
Net loss |
$ | (11,817 | ) | $ | (22,606 | ) | $ | (34,385 | ) | $ | (6,656 | ) | $ | (9,524 | ) | |
- (1)
- Amounts include stock-based compensation expense as follows:
| |
Year Ended December 31,
|
Three Months Ended March 31, |
|||||||||||||||
|---|---|---|---|---|---|---|---|---|---|---|---|---|---|---|---|---|---|
| |
2010
|
2011
|
2012
|
2012
|
2013
|
||||||||||||
| |
(in thousands) |
||||||||||||||||
| |
|
|
|
(unaudited) |
|||||||||||||
Cost of subscription and support revenue |
$ | 50 | $ | 108 | $ | 216 | $ | 30 | $ | 63 | |||||||
Cost of professional services and other revenue |
8 | 49 | 169 | 31 | 93 | ||||||||||||
Research and development |
73 | 294 | 575 | 111 | 210 | ||||||||||||
Sales and marketing |
57 | 509 | 966 | 206 | 230 | ||||||||||||
General and administrative |
131 | 349 | 1,046 | 135 | 405 | ||||||||||||
Total stock-based compensation expense |
$ | 319 | $ | 1,309 | $ | 2,972 | $ | 513 | $ | 1,001 | |||||||
56
| |
Year Ended December 31,
|
Three Months Ended March 31, | ||||||||||||||
|---|---|---|---|---|---|---|---|---|---|---|---|---|---|---|---|---|
| |
2010
|
2011
|
2012
|
2012
|
2013
|
|||||||||||
| |
(percent of total revenue) |
|||||||||||||||
| |
|
|
|
(unaudited) |
||||||||||||
Revenue: |
||||||||||||||||
Subscription and support |
96.0 | % | 92.1 | % | 90.3 | % | 90.3 | % | 88.9 | % | ||||||
Professional services and other |
4.0 | 7.9 | 9.7 | 9.7 | 11.1 | |||||||||||
Total revenue |
100.0 | 100.0 | 100.0 | 100.0 | 100.0 | |||||||||||
Cost of revenue: |
||||||||||||||||
Subscription and support |
32.9 | 29.0 | 27.8 | 25.7 | 29.5 | |||||||||||
Professional services and other |
18.0 | 17.1 | 14.4 | 14.8 | 13.3 | |||||||||||
Total cost of revenue |
50.9 | 46.1 | 42.2 | 40.5 | 42.8 | |||||||||||
Gross margin |
49.1 | 53.9 | 57.8 | 59.5 | 57.2 | |||||||||||
Operating expenses: |
||||||||||||||||
Research and development |
39.2 | 33.0 | 32.2 | 31.4 | 25.3 | |||||||||||
Sales and marketing |
78.5 | 71.3 | 64.7 | 64.0 | 62.4 | |||||||||||
General and administrative |
15.2 | 19.0 | 19.5 | 18.5 | 17.4 | |||||||||||
Total operating expenses |
132.9 | 123.3 | 116.4 | 113.9 | 105.1 | |||||||||||
Loss from operations |
(83.8 | ) | (69.4 | ) | (58.6 | ) | (54.4 | ) | (47.8 | ) | ||||||
Other income (expense), net |
(0.4 | ) | (0.4 | ) | (0.3 | ) | (0.1 | ) | (0.3 | ) | ||||||
Loss before provision for income taxes |
(84.2 | ) | (69.8 | ) | (58.9 | ) | (54.5 | ) | 48.2 | |||||||
Provision for income taxes |
0 | 0 | 0 | 0 | 0.1 | |||||||||||
Net loss |
(84.2 | )% | (69.8 | )% | (58.9 | )% | (54.5 | )% | (48.3 | )% | ||||||
Three Months Ended March 31, 2013 Compared to Three Months Ended March 31, 2012
Revenue
| |
Three Months Ended March 31, |
|
|
||||||||||
|---|---|---|---|---|---|---|---|---|---|---|---|---|---|
| |
2012
|
2013
|
$ Change
|
% Change
|
|||||||||
| |
(unaudited) |
|
|
||||||||||
| |
(in thousands) |
|
|||||||||||
Subscription and support |
$ | 11,021 | $ | 17,555 | $ | 6,534 | 59 | % | |||||
Professional services and other |
1,190 | 2,181 | 991 | 83 | |||||||||
Total revenue |
$ | 12,211 | $ | 19,736 | $ | 7,525 | 62 | ||||||
Revenue increased $7.5 million, or 62%, during the first quarter of 2013 compared to the comparable period in 2012, due to the increase in subscription and support revenue of $6.5 million and an increase in professional services revenue of $1.0 million. Of the total increase in subscription and support revenue, 82% was attributable to revenue from new customers acquired from April 1, 2012 through March 31, 2013, and 18% was attributable to revenue from customers existing on or before March 31, 2012. The increase in revenue from new customers was mostly
57
attributable to an increasing number of enterprise customers, whose contracts were of larger value per customer. In addition, the increase was due primarily to volume increase resulting from customers increasing the size of the lead databases managed by our solution, and also from price increases resulting from the lapsing of introductory discounts on these subscriptions. The customers we added in the first quarter of 2013 generally had larger lead databases on average than the customers we added in the first quarter of 2012 due to our increased penetration into the enterprise market.
The increase in professional services revenue resulted from increased delivery of services across our customer base. A majority of the increase was attributable to increased delivery of professional services to enterprise customers, and the balance of the increase was attributable to our SMB customers. During the latter half of 2012 and the first quarter of 2013, we added a high proportion of enterprise customers for whom we delivered services during the first quarter of 2013. Our enterprise customers typically exhibit a higher demand for professional services than our SMB customers.
Cost of Revenue and Gross Margin
| |
Three Months Ended March 31, |
|
|
||||||||||
|---|---|---|---|---|---|---|---|---|---|---|---|---|---|
| |
2012
|
2013
|
$ Change
|
% Change
|
|||||||||
| |
(unaudited) |
|
|
||||||||||
| |
(in thousands) |
|
|||||||||||
Cost of revenue: |
|||||||||||||
Subscription and support |
$ | 3,135 | $ | 5,820 | $ | 2,685 | 86 | % | |||||
Professional services and other |
1,805 | 2,618 | 813 | 45 | |||||||||
Total cost of revenue |
$ | 4,940 | $ | 8,438 | $ | 3,498 | 71 | ||||||
Gross margin: |
|||||||||||||
Subscription and support |
71.6 | % | 66.8 | % | |||||||||
Professional services and other |
(51.7 | ) | (20.0 | ) | |||||||||
Total gross margin |
59.5 | 57.2 | |||||||||||
Cost of subscription and support revenue increased $2.7 million, or 86%, during the first quarter of 2013 compared to the comparable quarter in 2012. The increase in cost of subscription and support revenue was primarily a result of an increase in personnel-related costs and hosting costs necessary to support our growth. Salary and benefits costs increased by $0.9 million during the first quarter of 2013 compared to the same period in 2012, primarily related to increases in headcount to support our growth and to a lesser extent, increases in headcount to support our transition to co-location data center facilities. During 2012, to improve the responsiveness and cost efficiency of our data center operations, we began an effort to transition from our managed hosting service provider to co-location data center facilities for which we are purchasing and managing our own computer equipment and systems. As a result, we hired additional personnel associated with the project. Data center hosting costs, which consist of fees paid to our managed hosting service provider, increased by $0.8 million during the first quarter of 2013 compared to the same period of 2012, primarily as a result of our increase in computing and network capacity to support our customer growth. In addition, we incurred an increase of $0.7 million of other expenses such as rent, IT costs, depreciation and amortization in order to support our growth.
Our subscription and support gross margin decreased to 66.8% in the first quarter of 2013 from 71.6% in the first quarter of 2012. This decrease was primarily a result of additional expenses
58
incurred associated with the migration of our data centers from our managed hosting service provider to new co-location facilities.
Cost of professional services and other revenue increased $0.8 million, or 45%, during the first quarter of 2013 compared to the comparable quarter in 2012. The increase in cost of professional services and other revenue was primarily due to an increase in salary and benefits costs of $0.6 million, as we hired additional personnel during the first quarter of 2013 to support demand for our services.
Our professional services and other gross margin improved from (51.7)% in the first quarter of 2012 to (20.0)% in the first quarter of 2013. The improvement in gross margin was primarily due to improved staff utilization resulting primarily from higher demand for professional services from our customers.
Research and Development
| |
Three Months Ended March 31, |
|
|
||||||||||
|---|---|---|---|---|---|---|---|---|---|---|---|---|---|
| |
2012
|
2013
|
$ Change
|
% Change
|
|||||||||
| |
(unaudited) |
|
|
||||||||||
| |
(in thousands) |
|
|||||||||||
Research and development |
$ | 3,835 | $ | 4,996 | $ | 1,161 | 30 | % | |||||
Percentage of total revenue |
31.4 | % | 25.3 | % | |||||||||
Research and development expenses increased $1.2 million, or 30%, in the first quarter of 2013 compared to the comparable quarter of 2012. The increase in research and development expenses was primarily due to an increase in salary and benefits costs of $0.8 million, consisting of increased employee compensation and benefits costs due to an increase in headcount during the first quarter of 2013, in part due to the acquisition of Crowd Factory in April 2012. In addition, consulting fees increased by $0.3 million in the first quarter of 2013, resulting from the use of more outside consultants, as we continued to enhance our existing product suite.
Sales and Marketing
| |
Three Months Ended March 31, |
|
|
||||||||||
|---|---|---|---|---|---|---|---|---|---|---|---|---|---|
| |
2012
|
2013
|
$ Change
|
% Change
|
|||||||||
| |
(unaudited) |
|
|
||||||||||
| |
(in thousands) |
|
|||||||||||
Sales and marketing |
$ | 7,819 | $ | 12,318 | $ | 4,499 | 58 | % | |||||
Percentage of total revenue |
64.0 | % | 62.4 | % | |||||||||
Sales and marketing expenses increased $4.5 million, or 58%, in the first quarter of 2013 compared to the comparable quarter of 2012. The increase in sales and marketing expenses was due primarily to an increase in personnel-related costs of $3.5 million, consisting primarily of increased employee compensation and benefits costs of $1.7 million and commissions of $1.8 million, driven by an increase in headcount during the first quarter of 2013 compared to the comparable quarter of 2012. In addition, marketing program costs and consulting fees increased by $0.4 million to support growth in our business.
59
General and Administrative
| |
Three Months Ended March 31, |
|
|
||||||||||
|---|---|---|---|---|---|---|---|---|---|---|---|---|---|
| |
2012
|
2013
|
$ Change
|
% Change
|
|||||||||
| |
(unaudited) |
|
|
||||||||||
| |
(in thousands) |
|
|||||||||||
General and administrative |
$ | 2,255 | $ | 3,427 | $ | 1,172 | 52 | % | |||||
Percentage of total revenue |
18.5 | % | 17.4 | % | |||||||||
General and administrative expenses increased $1.2 million, or 52%, in the first quarter of 2013 compared to the comparable quarter of 2012. The increase in general and administrative expenses was primarily due to an increase in salary and benefits costs of $0.8 million, consisting of increased employee compensation and benefits costs due to an increase headcount. Consulting fees increased by $0.3 million, as we increased our use of external consultants to assist with preparatory work associated with our initial public offering and with implementing new systems to support our growth. Advisory professional fees increased by $0.2 million, primarily associated with external audit, tax and legal, as a result of services provided to prepare us for our initial public offering.
Year Ended December 31, 2012 Compared to Year Ended December 31, 2011
Revenue
| |
Year Ended December 31, |
|
|
||||||||||
|---|---|---|---|---|---|---|---|---|---|---|---|---|---|
| |
2011
|
2012
|
$ Change
|
% Change
|
|||||||||
| |
(in thousands) |
|
|||||||||||
Subscription and support |
$ | 29,823 | $ | 52,756 | $ | 22,933 | 76.9 | % | |||||
Professional services and other |
2,569 | 5,657 | 3,088 | 120.2 | |||||||||
Total revenue |
$ | 32,392 | $ | 58,413 | $ | 26,021 | 80.3 | ||||||
Revenue increased $26.0 million, or 80%, in 2012 compared to 2011, due to the increase in subscription and support revenue of $22.9 million and an increase in professional services revenue of $3.1 million. Of the total increase in subscription and support revenue, 45% was attributable to revenue from new customers acquired after December 31, 2011, and 55% was attributable to revenue from customers existing at December 31, 2011. The increase in revenue from existing customers was almost entirely attributable to their having been customers for a full year in 2012. As we generate subscription fees only during the duration of a customer's subscription to our solution, when a customer is a subscriber to the solution for a full year we generate more revenues from them during such year than we do when they are a subscriber for merely a portion of the year, which typically occurs in the first calendar year of their subscription. To a much lesser extent, the increase was due approximately equally to price increases resulting from the lapsing of introductory discounts on these subscriptions and to volume increases resulting from these customers increasing the size of the lead database managed by our solution.
The pricing of our solutions, including the extent of any introductory discounts, remained substantially the same between 2011 and 2012. The customers we added in 2012, however, generally had larger lead databases on average than the customers we added in 2011 due to our increased penetration into the enterprise market.
60
The increase in professional services revenue resulted from the introduction of new service offerings during the period as well as an increased focus on selling those services.
Cost of Revenue and Gross Margin
| |
Year Ended December 31, |
|
|
||||||||||
|---|---|---|---|---|---|---|---|---|---|---|---|---|---|
| |
2011
|
2012
|
$ Change
|
% Change
|
|||||||||
| |
(in thousands) |
|
|||||||||||
Cost of revenue: |
|||||||||||||
Subscription and support |
$ | 9,386 | $ | 16,216 | $ | 6,830 | 72.8 | % | |||||
Professional services and other |
5,550 | 8,442 | 2,892 | 52.1 | |||||||||
Total cost of revenue |
$ | 14,936 | $ | 24,658 | $ | 9,722 | 65.1 | ||||||
Gross margin: |
|||||||||||||
Subscription and support |
68.5 | % | 69.3 | % | |||||||||
Professional services and other |
(116.0 | ) | (49.2 | ) | |||||||||
Total gross margin |
53.9 | 57.8 | |||||||||||
Cost of subscription and support revenue increased $6.8 million, or 73%, in 2012 compared to 2011. The increase in cost of subscription and support revenue was primarily a result of increased data center hosting costs of $2.7 million paid to our managed hosting service provider as we increased computing and network capacity to support our customer growth, and to increased personnel-related costs of $2.4 million necessary to support our growth. In addition, we incurred an increase of $1.3 million of other expenses such as rent, IT costs, depreciation and amortization in order to support our growth in 2012. Also, during 2012, to improve the responsiveness and cost efficiency of our data center operations, we began an effort to transition from our managed hosting service provider to co-location data center facilities for which we are purchasing and managing our own computer equipment and systems. During 2012, this resulted in both increased personnel costs and depreciation expense related to expenses associated with the project. We expect the cost of subscription and support revenue to continue to increase as we continue to hire employees and purchase capital equipment for our co-location facilities and to hire employees for support organizations to meet our growing customer demands.
Our subscription and support gross margin increased to 69.3% in 2012 from 68.5% in 2011. This increase was driven by economies of scale resulting from our ability to hold hiring growth below revenue growth, offset by expenses associated with the migration of our data centers from our managed hosting service provider to new co-location facilities.
Cost of professional services and other revenue increased $2.9 million, or 52%, in 2012 compared to 2011. Increases were primarily due to an increase in personnel costs of $2.4 million, consisting primarily of increased employee compensation and benefits costs of $2.2 million as we grew our headcount to support demand for expert services. Outside services costs decreased by $0.5 million as we hired employees to perform functions previously outsourced. We also incurred an increase of $0.6 million of allocated expenses such as rent, IT costs, depreciation and amortization in order to support our growth.
Our professional services and other gross margin improved from (116)% in 2011 to (49)% in 2012. The improvement in gross margin was due in part to improved staff utilization resulting primarily from higher demand for professional services from our enterprise customers as well as to the introduction of enhanced fee-based enablement services for our SMB customers. Prior to 2012, our professional and enablement services for our SMB customers were bundled as part of subscription services at no additional fee to the customer.
61
Research and Development
| |
Year Ended December 31, | |
|
||||||||||
|---|---|---|---|---|---|---|---|---|---|---|---|---|---|
| |
2011
|
2012
|
$ Change
|
% Change
|
|||||||||
| |
(in thousands) |
|
|||||||||||
Research and development |
$ | 10,677 | $ | 18,799 | $ | 8,122 | 76.1 | % | |||||
Percentage of total revenue |
33.0 | % | 32.2 | % | |||||||||
Research and development expenses increased $8.1 million, or 76%, in 2012 compared to 2011. The increase in research and development expenses was primarily due to an increase in salary and benefits costs of $5.6 million, consisting of increased employee compensation and benefits costs due to an increase in headcount during the period in part due to the acquisition of Crowd Factory. In addition, outside services expenses mostly related to sub-contracted development increased by $1.1 million. We also incurred an increase of $1.2 million of other expenses such as rent, IT costs, depreciation and amortization in order to support growth.
Sales and Marketing
| |
Year Ended December 31, | |
|
||||||||||
|---|---|---|---|---|---|---|---|---|---|---|---|---|---|
| |
2011
|
2012
|
$ Change
|
% Change
|
|||||||||
| |
(in thousands) |
|
|||||||||||
Sales and marketing |
$ | 23,088 | $ | 37,776 | $ | 14,688 | 63.6 | % | |||||
Percentage of total revenue |
71.3 | % | 64.7 | % | |||||||||
Sales and marketing expenses increased $14.7 million, or 64%, in 2012 compared to 2011. The increase in sales and marketing expenses was due primarily to an increase in personnel-related costs of $8.9 million, consisting primarily of increased employee compensation and benefits costs of $6.3 million, commissions of $2.1 million and additional stock-based compensation of $0.5 million driven by an increase in headcount during the period. In addition, marketing program costs increased by $2.9 million to support growth in our business, and travel increased by $0.6 million related to expansion of our enterprise sales efforts as well as our international expansion. We also incurred an increase of $2.0 million of other expenses such as rent, IT costs, depreciation and amortization in order to support growth.
General and Administrative
| |
Year Ended December 31, | |
|
||||||||||
|---|---|---|---|---|---|---|---|---|---|---|---|---|---|
| |
2011
|
2012
|
$ Change
|
% Change
|
|||||||||
| |
(in thousands) |
|
|||||||||||
General and administrative |
$ | 6,154 | $ | 11,388 | $ | 5,234 | 85.1 | % | |||||
Percentage of total revenue |
19.0 | % | 19.5 | % | |||||||||
General and administrative expenses increased $5.2 million, or 85%, in 2012 compared to 2011. The increase in general and administrative expenses was primarily due to increases in personnel-related expenses of $3.2 million, consisting of increased employee compensation and benefits costs of $2.5 million and additional stock-based compensation of $0.7 million, as we increased headcount during the period. In addition, professional and outside service costs increased $2.0 million, due primarily to fees related to our external audit, tax, and legal advisory services as well as costs associated with our international expansion. These increases were offset
62
by a decrease of $0.4 million in outside IT consulting services incurred in the prior year related to the implementation of financial reporting systems and related data conversion activities.
Year Ended December 31, 2011 Compared to Year Ended December 31, 2010
Revenue
| |
Year Ended December 31, | |
|
||||||||||
|---|---|---|---|---|---|---|---|---|---|---|---|---|---|
| |
2010
|
2011
|
$ Change
|
% Change
|
|||||||||
| |
(in thousands) |
|
|||||||||||
Subscription and support |
$ | 13,473 | $ | 29,823 | $ | 16,350 | 121.4 | % | |||||
Professional services and other |
559 | 2,569 | 2,010 | 359.6 | |||||||||
Total revenue |
$ | 14,032 | $ | 32,392 | $ | 18,360 | 130.8 | ||||||
Revenue increased $18.4 million, or 131%, in 2011 compared to 2010, primarily due to the increase in subscription and support revenue of $16.4 million. Of the total increase in subscription and support revenue, 50% was attributable to revenue from new customers acquired after December 31, 2010, and 50% was attributable to revenue from customers existing at December 31, 2010. The increase in revenue from existing customers was almost entirely attributable to their having been customers for a full year in 2011. As we generate subscription fees only during the duration of a customer's subscription to our solution, when a customer is a subscriber to the solution for a full year we generate more revenues from them during such year than we do when they are a subscriber for merely a portion of the year, which typically occurs in the first calendar year of their subscription. To a much lesser extent, the increase was due approximately equally to price increases resulting from the lapsing of introductory discounts on these subscriptions and to volume increases resulting from these customers increasing the size of the lead database managed by our solution.
The pricing of our solutions, including the extent of any introductory discounts, remained substantially the same between 2010 and 2011. The customers we added in 2011, however, generally had larger lead databases on average than the customers we added in 2010 due to our increased penetration into the enterprise market.
Professional services revenue increased $2.0 million in 2011 compared to 2010, reflecting increased demand resulting from the increase in subscription sales to enterprise customers.
Cost of Revenue and Gross Margin
| |
Year Ended December 31, | |
|
||||||||||
|---|---|---|---|---|---|---|---|---|---|---|---|---|---|
| |
2010
|
2011
|
$ Change
|
% Change
|
|||||||||
| |
(in thousands) |
|
|||||||||||
Cost of revenue: |
|||||||||||||
Subscription and support |
$ | 4,612 | $ | 9,386 | $ | 4,774 | 103.5 | % | |||||
Professional services and other |
2,534 | 5,550 | 3,016 | 119.0 | |||||||||
Total cost of revenue |
$ | 7,146 | $ | 14,936 | $ | 7,790 | 109.0 | ||||||
Gross margin: |
|||||||||||||
Subscription and support |
65.8 | % | 68.5 | % | |||||||||
Professional services and other |
(353.3 | ) | (116.0 | ) | |||||||||
Total gross margin |
49.1 | 53.9 | |||||||||||
63
Cost of subscription and support revenue increased $4.8 million, or 104%, in 2011 compared to 2010. The overall increase in cost of subscription and support revenue was primarily attributable to hosting costs of $2.7 million for our data centers as we increased our managed data center capacity to support our customer growth. In addition, personnel-related costs increased by $1.8 million driven by increases in headcount during the period to support our growth. Our subscription and support gross margin increased from 66% in 2010 to 69% in 2011. This improvement was driven by economies of scale in our operations during the period reflected by our ability to keep expense growth below revenue growth.
Cost of professional services and other revenue increased 3.0 million, or 119% in 2011 compared to 2010. The year-over-year increase was primarily attributable to increased personnel-related costs of $2.3 million driven by increases in headcount during the period. In addition, outside services costs increased $0.4 million primarily due to sub-contracted consulting services. Our professional services and other gross margin improved from (353)% in 2010 to (116)% in 2011. The improved gross margin was due to improved utilization resulting from increased demand for expert services driven by increases in our customer base.
Research and Development
| |
Year Ended December 31, | |
|||||||||||
|---|---|---|---|---|---|---|---|---|---|---|---|---|---|
| |
2010
|
2011
|
$ Change
|
% Change
|
|||||||||
| |
(in thousands) |
|
|||||||||||
Research and development |
$ | 5,498 | $ | 10,677 | $ | 5,179 | 94.2 | % | |||||
Percentage of total revenue |
39.2 | % | 33.0 | % | |||||||||
Research and development expenses increased $5.2 million, or 94%, in 2011 compared to 2010 primarily due to an increase in personnel-related costs of $4.4 million driven by increases in headcount during the period. In addition, our technology costs increased $0.5 million primarily related to the cost of third party quality assurance and development resources. Total headcount in research and development increased in 2011 compared to 2010 as we added employees to improve and extend our offerings and develop new technologies.
Sales and Marketing
| |
Year Ended December 31, | |
|
||||||||||
|---|---|---|---|---|---|---|---|---|---|---|---|---|---|
| |
2010
|
2011
|
$ Change
|
% Change
|
|||||||||
| |
(in thousands) |
|
|||||||||||
Sales and marketing |
$ | 11,019 | $ | 23,088 | $ | 12,069 | 109.5 | % | |||||
Percentage of total revenue |
78.5 | % | 71.3 | % | |||||||||
Sales and marketing expenses increased $12.1 million, or 110%, in 2011 compared to 2010. The year over year increase was primarily attributable to a $7.5 million increase in personnel-related costs primarily due to the expansion of our sales force. In addition, the cost of marketing programs increased by $2.7 million and the cost of travel by $0.6 million as a result of increased enterprise sales. Other expenses, including consulting and recruiting costs and facilities allocations, increased by $1.3 million.
64
General and Administrative
| |
Year Ended December 31, | |
|
||||||||||
|---|---|---|---|---|---|---|---|---|---|---|---|---|---|
| |
2010
|
2011
|
$ Change
|
% Change
|
|||||||||
| |
(in thousands) |
|
|||||||||||
General and administrative |
$ | 2,135 | $ | 6,154 | $ | 4,019 | 188.2 | % | |||||
Percentage of total revenue |
15.2 | % | 19.0 | % | |||||||||
General and administrative expenses increased $4.0 million, or 188%, in 2011 compared to 2010 primarily due to professional and outside service costs of $1.4 million, comprised primarily of fees related to our external audit, tax, and legal advisory services, recruiting fees as well as costs associated with our international expansion. Personnel-related expenses increased $1.4 million, as we added employees to support the growth of our business. We also incurred approximately $0.4 million related to outside IT consulting services incurred in connection with the implementation of financial reporting systems and related data conversion activities.
65
Quarterly Results of Operations
The following table sets forth our unaudited quarterly consolidated statements of operations data for each of the nine quarters ended March 31, 2013. In management's opinion, the data below have been prepared on the same basis as the audited consolidated financial statements included elsewhere in this prospectus, and reflect all necessary adjustments, consisting only of normal recurring adjustments, necessary for a fair statement of this data. The results of historical periods are not necessarily indicative of the results to be expected for a full year or any future period. The following quarterly financial data should be read in conjunction with our audited financial statements and related notes included elsewhere in this prospectus.
| |
Three Months Ended | |||||||||||||||||||||||||||
|---|---|---|---|---|---|---|---|---|---|---|---|---|---|---|---|---|---|---|---|---|---|---|---|---|---|---|---|---|
| |
MAR 31, 2011 |
JUN 30, 2011 |
SEP 30, 2011 |
DEC 31, 2011 |
MAR 31, 2012 |
JUN 30, 2012 |
SEP 30, 2012 |
DEC 31, 2012 |
MAR 31, 2013 |
|||||||||||||||||||
| |
(unaudited) (in thousands) |
|||||||||||||||||||||||||||
Revenue: |
||||||||||||||||||||||||||||
Subscription and support |
$ | 5,665 | $ | 6,851 | $ | 8,016 | $ | 9,291 | $ | 11,021 | $ | 12,379 | $ | 14,064 | $ | 15,292 | $ | 17,555 | ||||||||||
Professional services and other |
434 | 582 | 698 | 855 | 1,190 | 1,549 | 1,363 | 1,555 | 2,181 | |||||||||||||||||||
Total revenue |
6,099 | 7,433 | 8,714 | 10,146 | 12,211 | 13,928 | 15,427 | 16,847 | 19,736 | |||||||||||||||||||
Cost of revenue(1): |
||||||||||||||||||||||||||||
Subscription and support |
2,008 | 2,232 | 2,432 | 2,714 | 3,135 | 3,607 | 4,402 | 5,072 | 5,820 | |||||||||||||||||||
Professional services and other |
1,194 | 1,322 | 1,455 | 1,579 | 1,805 | 2,101 | 2,162 | 2,374 | 2,618 | |||||||||||||||||||
Total cost of revenue |
3,202 | 3,554 | 3,887 | 4,293 | 4,940 | 5,708 | 6,564 | 7,446 | 8,438 | |||||||||||||||||||
Gross profit: |
||||||||||||||||||||||||||||
Subscription and support |
3,657 | 4,619 | 5,584 | 6,577 | 7,886 | 8,772 | 9,662 | 10,220 | 11,735 | |||||||||||||||||||
Professional services and other |
(760 | ) | (740 | ) | (757 | ) | (724 | ) | (615 | ) | (552 | ) | (799 | ) | (819 | ) | (437 | ) | ||||||||||
Total gross profit |
2,897 | 3,879 | 4,827 | 5,853 | 7,271 | 8,220 | 8,863 | 9,401 | 11,298 | |||||||||||||||||||
Operating expenses(1): |
||||||||||||||||||||||||||||
Research and development |
2,390 | 2,532 | 2,771 | 2,984 | 3,835 | 5,339 | 4,661 | 4,964 | 4,996 | |||||||||||||||||||
Sales and marketing |
3,970 | 5,325 | 6,311 | 7,482 | 7,819 | 9,788 | 10,844 | 9,325 | 12,318 | |||||||||||||||||||
General and administrative |
720 | 978 | 1,503 | 2,953 | 2,255 | 3,020 | 3,086 | 3,027 | 3,427 | |||||||||||||||||||
Total operating expenses |
7,080 | 8,835 | 10,585 | 13,419 | 13,909 | 18,147 | 18,591 | 17,316 | 20,741 | |||||||||||||||||||
Loss from operations |
(4,183 | ) | (4,956 | ) | (5,758 | ) | (7,566 | ) | (6,638 | ) | (9,927 | ) | (9,728 | ) | (7,915 | ) | (9,443 | ) | ||||||||||
Other income (expense), net |
(10 | ) | (6 | ) | (42 | ) | (79 | ) | (15 | ) | — | (36 | ) | (107 | ) | (61 | ) | |||||||||||
Loss before provision for income taxes |
(4,193 | ) | (4,962 | ) | (5,800 | ) | (7,645 | ) | (6,653 | ) | (9,927 | ) | (9,764 | ) | (8,022 | ) | (9,504 | ) | ||||||||||
Provision for income taxes |
2 | 3 | — | 1 | 3 | — | 2 | 14 | 20 | |||||||||||||||||||
Net loss |
$ | (4,195 | ) | $ | (4,965 | ) | $ | (5,800 | ) | $ | (7,646 | ) | $ | (6,656 | ) | $ | (9,927 | ) | $ | (9,766 | ) | $ | (8,036 | ) | $ | (9,524 | ) | |
- (1)
- Amounts include stock-based compensation expense as follows:
| |
Three Months Ended | |||||||||||||||||||||||||||
|---|---|---|---|---|---|---|---|---|---|---|---|---|---|---|---|---|---|---|---|---|---|---|---|---|---|---|---|---|
| |
MAR 31, 2011 |
JUN 30, 2011 |
SEP 30, 2011 |
DEC 31, 2011 |
MAR 31, 2012 |
JUN 30, 2012 |
SEP 30, 2012 |
DEC 31, 2012 |
MAR 31, 2013 |
|||||||||||||||||||
| |
(unaudited) (in thousands) |
|||||||||||||||||||||||||||
Cost of subscription and support revenue |
$ | 23 | $ | 30 | $ | 27 | $ | 28 | $ | 30 | $ | 38 | $ | 75 | $ | 73 | $ | 63 | ||||||||||
Cost of professional services and other revenue |
8 | 8 | 14 | 19 | 31 | 60 | 30 | 48 | 93 | |||||||||||||||||||
Research and development |
52 | 68 | 72 | 102 | 111 | 170 | 110 | 184 | 210 | |||||||||||||||||||
Sales and marketing |
56 | 151 | 143 | 159 | 206 | 217 | 377 | 166 | 230 | |||||||||||||||||||
General and administrative |
54 | 78 | 107 | 110 | 135 | 236 | 334 | 341 | 405 | |||||||||||||||||||
Total stock-based compensation expense |
$ | 193 | $ | 335 | $ | 363 | $ | 418 | $ | 513 | $ | 721 | $ | 926 | $ | 812 | $ | 1,001 | ||||||||||
66
| |
Three Months Ended | |||||||||||||||||||||||||||
|---|---|---|---|---|---|---|---|---|---|---|---|---|---|---|---|---|---|---|---|---|---|---|---|---|---|---|---|---|
| |
MAR 31, 2011 |
JUN 30, 2011 |
SEP 30, 2011 |
DEC 31, 2011 |
MAR 31, 2012 |
JUN 30, 2012 |
SEP 30, 2012 |
DEC 31, 2012 |
MAR 31, 2013 |
|||||||||||||||||||
| |
(unaudited) (percent of total revenue) |
|||||||||||||||||||||||||||
Revenue: |
||||||||||||||||||||||||||||
Subscription and support |
92.9 | % | 92.2 | % | 92.0 | % | 91.6 | % | 90.2 | % | 88.9 | % | 91.2 | % | 90.8 | % | 88.9 | % | ||||||||||
Professional services and other |
7.1 | 7.8 | 8.0 | 8.4 | 9.8 | 11.1 | 8.8 | 9.2 | 11.1 | |||||||||||||||||||
Total revenue |
100.0 | 100.0 | 100.0 | 100.0 | 100.0 | 100.0 | 100.0 | 100.0 | 100.0 | |||||||||||||||||||
Cost of revenue: |
||||||||||||||||||||||||||||
Subscription and support |
32.9 | 30.0 | 27.9 | 26.7 | 25.7 | 25.9 | 28.6 | 30.1 | 29.5 | |||||||||||||||||||
Professional services and other |
19.6 | 17.8 | 16.7 | 15.6 | 14.8 | 15.1 | 14.0 | 14.1 | 13.3 | |||||||||||||||||||
Total cost of revenue |
52.5 | 47.8 | 44.6 | 42.3 | 40.5 | 41.0 | 42.6 | 44.2 | 42.8 | |||||||||||||||||||
Gross margin: |
||||||||||||||||||||||||||||
Subscription and support |
60.0 | 62.1 | 64.1 | 64.8 | 64.6 | 63.0 | 62.6 | 60.7 | 59.5 | |||||||||||||||||||
Professional services and other |
(12.5 | ) | (10.0 | ) | (8.7 | ) | (7.1 | ) | (5.0 | ) | (4.0 | ) | (5.2 | ) | (4.9 | ) | (2.2 | ) | ||||||||||
Total gross margin |
47.5 | 52.1 | 55.4 | 57.7 | 59.6 | 59.0 | 57.4 | 55.8 | 57.2 | |||||||||||||||||||
Operating expenses: |
||||||||||||||||||||||||||||
Research and development |
39.2 | 34.1 | 31.8 | 29.4 | 31.4 | 38.3 | 30.2 | 29.5 | 25.3 | |||||||||||||||||||
Sales and marketing |
65.1 | 71.6 | 72.4 | 73.8 | 64.0 | 70.3 | 70.3 | 55.3 | 62.4 | |||||||||||||||||||
General and administrative |
11.8 | 13.2 | 17.3 | 29.1 | 18.5 | 21.7 | 20.0 | 18.0 | 17.4 | |||||||||||||||||||
Total operating expenses |
116.1 | 118.9 | 121.5 | 132.3 | 113.9 | 130.3 | 120.5 | 102.8 | 105.1 | |||||||||||||||||||
Loss from operations |
(68.6 | ) | (66.7 | ) | (66.1 | ) | (74.6 | ) | (54.4 | ) | (71.3 | ) | (63.1 | ) | (47.0 | ) | (47.8 | ) | ||||||||||
Other income (expense), net |
(0.2 | ) | (0.1 | ) | (0.5 | ) | (0.8 | ) | (0.1 | ) | — | (0.2 | ) | (0.6 | ) | (0.3 | ) | |||||||||||
Loss before provision for income taxes |
(68.8 | ) | (66.8 | ) | (66.6 | ) | (75.4 | ) | (54.5 | ) | (71.3 | ) | (63.3 | ) | (47.6 | ) | (48.2 | ) | ||||||||||
Provision for income taxes |
0.0 | 0.0 | — | 0.0 | 0.0 | — | 0.0 | 0.1 | 0.1 | |||||||||||||||||||
Net Loss |
(68.8 | )% | (66.8 | )% | (66.6 | )% | (75.4 | )% | (54.5 | )% | (71.3 | )% | (63.3 | )% | (47.7 | )% | (48.3 | )% | ||||||||||
Seasonality, Cyclicality and Quarterly Trends
We have historically experienced seasonality in terms of when we enter into customer agreements for our service. We sign a significantly higher percentage of agreements with new customers as well as renewal agreements with existing customers in the fourth quarter of each year as compared to any of the prior quarters. The first quarter is typically the slowest in this regard. Furthermore, we usually sign a significant portion of these agreements during the last month, and often the last two weeks, of each quarter. This seasonality is reflected to a much lesser extent, and sometimes is not immediately apparent, in our revenue, because we recognize subscription revenue over the term of the license agreement, which is typically one year, but ranges from one quarter to three years. As a result, a slowdown in our ability to enter into customer agreements may not be apparent in our revenue for the quarter, as the revenue recognized in any quarter is primarily from customer agreements entered into in prior quarters. Historical patterns should not be considered a reliable indicator of our future sales activity or performance.
Our revenue has increased over the periods presented due to increased sales to new customers, as well as increased usage of existing and new products by existing customers. Our operating expenses generally have increased sequentially in every quarter primarily due to increases in headcount and other related expenses to support our growth. However, in the quarter ended June 30, 2012, operating expenses grew due to compensation costs of $0.9 million in connection with the acquisition of Crowd Factory, which affected research and development and marketing and sales expenses, and outside expenses including legal and accounting services, which impacted general and administrative expenses. Additionally, during the quarter ended December 31, 2011 we incurred consulting and related outside services costs of $0.4 million associated with the implementation of our financial reporting systems and related data migration efforts. We anticipate our operating expenses will continue to increase in absolute dollars in future periods as we invest in the long-term growth of our business.
In addition, we may experience variances in the number of our customers over a particular quarter for a variety of business reasons, and the extent to which we gain or lose customers over a
67
particular quarter will not necessarily correlate to the changes in revenue in that quarter or in future periods. As a result of the foregoing factors, a slowdown in our ability to enter into customer agreements or to renew customer agreements may not be apparent in our revenue for the quarter, as the revenue recognized in any quarter is primarily from customer agreements entered into in prior quarters. In addition, each year we typically participate in several key industry trade shows, as well as host our own annual user conference. The timing of these events can vary from year to year, and the costs associated with these events typically have a significant effect on our sales and marketing expenses for the applicable quarter and cause our quarterly results to fluctuate. For example, our user summit was held in the second quarter of 2012 and we participated in a large trade show in the third quarter of 2012 increasing costs during those respective quarters.
Liquidity and Capital Resources
| |
Year Ended December 31, | Three Months Ended March 31, |
||||||||||||||
|---|---|---|---|---|---|---|---|---|---|---|---|---|---|---|---|---|
| |
2010
|
2011
|
2012
|
2012
|
2013
|
|||||||||||
| |
(in thousands) |
|||||||||||||||
| |
|
|
|
(unaudited) |
||||||||||||
Net cash used in operating activities |
$ | (8,948 | ) | $ | (15,985 | ) | $ | (23,848 | ) | $ | (5,657 | ) | $ | (4,905 | ) | |
Net cash used in investing activities |
(531 | ) | (1,675 | ) | (3,656 | ) | (531 | ) | (2,877 | ) | ||||||
Net cash provided by (used in) financing activities |
35,030 | 50,396 | 4,386 | 152 | (306 | ) | ||||||||||
Net increase (decrease) in cash and cash equivalents, net of impact of foreign exchange rates on cash |
25,551 | 32,943 | (23,153 | ) | (6,059 | ) | (8,071 | ) | ||||||||
To date, we have financed our operations primarily through cash received from customers for use of our service and private placements of preferred stock, as well as proceeds from equipment financings. As of December 31, 2012 and March 31, 2013, we had $44.2 million and $36.2 million, respectively, of cash and cash equivalents, most of which was held in money market accounts.
During 2012, we entered into a loan and security agreement with a bank under which we borrowed $3.6 million to acquire equipment. The interest rate associated with this equipment facility is the greater of 4% or 0.75 of a percentage point above the bank's prime rate, as determined on the applicable funding date. For each equipment loan advance, we pay interest only for approximately nine months. Subsequently, we make thirty-six equal monthly payments of principal and interest. We are required to maintain our operating accounts and maintain $2.0 million in deposit accounts with the lender at all times as well as maintain certain monthly financial reporting covenants. As of December 31, 2012 and March 31, 2013, we were in compliance with all of the covenants contained in the loan and security agreement.
A substantial source of our cash provided by operating activities is our deferred revenue, which is included on our consolidated balance sheet as a liability. Deferred revenue consists of the unearned portion of billed fees for our software subscriptions and professional services, which is amortized into revenue in accordance with our revenue recognition policy. As of December 31, 2012 and March 31, 2013, we had working capital of $28.3 million and $18.9 million, respectively, which included $20.6 million and $24.5 million, respectively, of deferred revenue recorded as a current liability. This deferred revenue will be recognized as revenue when all of the revenue recognition criteria are met.
We assess our liquidity primarily through our cash on hand as well as the projected timing of billings under contract with our customers and related collection cycles. We believe our current
68
cash and cash equivalents, cash to be received from existing and new customers and net proceeds of this offering and the concurrent private placement will be sufficient to meet our working capital and capital expenditure requirements for at least the next 12 months.
Our future capital requirements will depend on many factors, including equipment required in connection with the transition from our managed hosting service provider to co-location data center facilities, revenue growth and costs incurred to support customer growth, international expansion, research and development and increased general and administrative expenses to support the anticipated growth in our operations. Our capital expenditures in future periods are expected to grow in line with our business. To the extent that existing cash and cash from operations are not sufficient to fund our future operations, we may need to raise additional funds through public or private equity or additional debt financing. Although we currently are not a party to any agreement and do not have any understanding with any third parties with respect to potential investments in, or acquisitions of, businesses or technologies, we may enter into these types of arrangements in the future, which could also require us to seek additional equity or debt financing. Additional funds may not be available on terms favorable to us or at all.
Net cash used in operating activities. Cash used in operating activities is significantly influenced by the amount of cash we invest in personnel and infrastructure to support the anticipated growth of our business, the increase in the number of customers using our cloud-based software and services, and the amount and timing of customer payments. Cash used in operating activities has historically come from a net loss driven by sales of subscriptions to our software services and adjusted for non-cash expenses items, such as depreciation and amortization of property and equipment, stock-based compensation, and intangible assets acquired in connection with the acquisition of Crowd Factory. The percentage of customers that pay quarterly rather than annually changes every quarter. The percentage of customers who pay us quarterly has a material impact on our net cash used in operating activities.
Our cash used in operating activities during the three months ended March 31, 2013 primarily reflected our net loss of $9.5 million, offset by non-cash expenses that included $0.8 million of depreciation and amortization and $1.0 million in stock-based compensation. Working capital sources of cash included a $3.9 million increase in deferred revenue resulting primarily from the addition of new customers invoiced during the period. These sources of cash were partially offset by a $1.8 million increase in prepaid expenses and other current assets, primarily associated with amounts paid for annual subscription software services which are amortized over the contracted service period, as well as prepaid costs associated with our annual user summit which occurred in April 2013.
Our cash used in operating activities during 2012 primarily reflected our net loss of $34.4 million, offset by non-cash expenses that included $1.7 million of depreciation and amortization, including $0.4 million of amortization of intangible assets related to the acquisition of Crowd Factory, and $3.0 million in stock-based compensation. Working capital sources of cash included a $9.5 million increase in deferred revenue resulting primarily from the addition of new customers invoiced during the period, and a $2.0 million net increase in accounts payable and accrued expenses and other current liabilities primarily related to commissions, bonuses and accrued vacation payable after the end of the year, as well as increases in accruals for services, including marketing programs, resulting from our growth during 2012. These sources of cash were offset by a $5.0 million increase in accounts receivable due to higher customer billings related to the increase in the number of customers during the period, which was partially offset by a decrease in days sales outstanding from 97 days at December 31, 2011 to 88 days at December 31, 2012.
Our cash used in operating activities during 2011 primarily reflected our net loss of $22.6 million, offset by $2.0 million in non-cash expenses that included $1.3 million in stock-based
69
compensation and $0.6 million of depreciation and amortization. Working capital sources of cash included a $6.4 million increase in deferred revenue resulting primarily from the growth in the number of customers invoiced during the period and a $4.5 million increase in accounts payable and accrued expenses and other current liabilities due to a higher level of expenses consistent with the overall growth of the business which are payable after the end of the year. These sources of cash were partially offset by a $1.2 million increase in prepaid expenses and other current assets related in part to amounts paid for subscription software services which are amortized over the contracted service period and a $5.0 million increase in accounts receivable due to higher customer billings related to the increase in the number of customers during the period, and to a lesser extent, an increase in days outstanding from 92 days at December 31, 2010 to 97 days at December 31, 2011.
Our cash used in operating activities during 2010 primarily reflected our net loss of $11.8 million, offset by $0.6 million in non-cash expenses comprised of $0.3 million of depreciation and amortization and $0.3 million in stock-based compensation. Working capital sources of cash included a $2.9 million increase in deferred revenue due to an increase in customers invoiced during the period and a $1.5 million increase in accounts payable and accrued expenses and other current liabilities due to a higher level of expenses consistent with the overall growth of our business. These sources of cash were offset in part by a $1.7 million increase in accounts receivable due to higher customer billing volume compared to the prior year resulting from increases in the number of customers.
Net cash used in investing activities. Our primary investing activities have consisted of capital expenditures to purchase equipment required in connection with the transition from our managed hosting provider to co-location data center facilities for which we are purchasing and managing our own computer equipment and systems. As our business grows, we expect our capital expenditures and our activity to continue to increase.
For the three months ended March 31, 2013, cash used in investing activities consisted of $2.9 million for the purchases of property and equipment, primarily associated with our transition from a managed hosting service provider to co-location data center facilities for which we are purchasing and managing our own computer equipment and system, and to a lesser extent, an increase in equipment, furniture and fixtures and leasehold improvements associated with supporting our increasing employee headcount.
For the years ended December 31, 2010, 2011 and 2012, cash used in investing activities consisted of $0.2 million, $1.7 million and $4.4 million, respectively, for purchases of property and equipment. In 2012, our purchases of computer and network equipment were primarily for building out our co-location facilities to support our customer base, as well as equipment and furniture and fixtures for supporting our increasing employee headcount. In 2012, we also acquired $0.7 million in cash in connection with the acquisition of Crowd Factory. In 2010 and 2011, we purchased computer equipment and furniture and fixtures for supporting our increasing headcount.
Net cash provided by (used in) financing activities. Our primary financing activities have consisted of equity issuances raised to fund our operations as well as proceeds from and payments on equipment debt obligations entered into to finance our property and equipment, primarily equipment used in our data centers. For the year ended December 31, 2012, cash provided by financing activities consisted primarily of $3.6 million in proceeds from borrowings under the credit line and $0.9 million in proceeds from the issuance of common stock upon the exercise of stock options.
For the three months ended March 31, 2013, cash used in financing activities consisted of $0.8 million in cash payments related to costs associated with our initial public offering, partially
70
offset by $0.5 million of proceeds received from the issuance of common stock upon the exercise of stock options.
For the year ended December 31, 2011, cash provided by financing activities consisted primarily of $49.9 million in net proceeds from issuing Series F convertible preferred stock.
For the year ended December 31, 2010, cash provided by financing activities consisted primarily of $34.9 million in net proceeds from issuing Series D and E convertible preferred stock.
Contractual Obligations and Commitments
Our principal commitments consist of obligations under our outstanding term loan, operating leases for our office space, and contractual commitments for hosting and other support services. The following table summarizes our credit facility, including interest, operating lease obligations and contractual commitments at December 31, 2012:
| |
Payment Due by Period | |||||||||||||||
|---|---|---|---|---|---|---|---|---|---|---|---|---|---|---|---|---|
| |
Total
|
Less than 1 Year |
1-3 Years
|
3-5 Years
|
More than 5 Years |
|||||||||||
| |
(in thousands) |
|||||||||||||||
Credit facility, including interest |
$ | 3,941 | $ | 719 | $ | 2,581 | $ | 641 | $ | — | ||||||
Operating lease obligations |
10,218 | 2,367 | 5,779 | 2,072 | — | |||||||||||
Contractual commitments |
3,431 | 2,702 | 729 | — | — | |||||||||||
Total |
$ | 17,590 | $ | 5,788 | $ | 9,089 | $ | 2,713 | $ | — | ||||||
Off-Balance Sheet Arrangements
During 2010, 2011, 2012 and the three months ended March 31, 2013, we did not have any relationships with unconsolidated entities or financial partnerships, such as entities often referred to as structured finance or special purpose entities, which would have been established for the purpose of facilitating off-balance sheet arrangements or other contractually narrow or limited purposes. As such, we are not exposed to any financing, liquidity, market or credit risk that could arise if we had engaged in those types of relationships.
Qualitative and Quantitative Disclosures About Market Risk
Foreign Currency Exchange Risk
We have foreign currency risks related to our revenue and operating expenses denominated in currencies other than the U.S. dollar, primarily the Euro, British Pound Sterling, and Australian dollar. Revenue outside of the United States as a percentage of revenue was 10.6%, 10.7%, 12.8%, 11.4% and 13.9% in 2010, 2011 2012 and for the three months ended March 31, 2012 and 2013, respectively. Decreases in the relative value of the U.S. dollar to other currencies may negatively affect our revenue and other operating results as expressed in U.S. dollars.
We have experienced and will continue to experience fluctuations in our net income (loss) as a result of transaction gains or losses related to revaluing certain current asset and current liability balances that are denominated in currencies other than the functional currency of the entities in which they are recorded. We recognized foreign currency losses of $0.1 million, $0.1 million, $12,000 and $27,000 in 2011, 2012 and for the three months ended March 31, 2012 and 2013, respectively. While we have not engaged in the hedging of our foreign currency transactions to date, we are evaluating the costs and benefits of initiating such a program and may in the future hedge selected significant transactions denominated in currencies other than the U.S. dollar.
71
Interest Rate Sensitivity
We hold cash and cash equivalents for working capital purposes. We do not have material exposure to market risk with respect to investments, as any investments we enter into are primarily highly liquid investments.
We have a credit facility with equipment advances of approximately $3.6 million as of both December 31, 2012 and March 31, 2013. The interest rate associated with this facility is the greater of 4% or three quarters of a percentage point above the prime rate. A one percent increase in the prime rate would not have an impact on our operating results as the greater of the two rates is 4%, and we would still pay interest of 4%. A 10% increase or decrease in interest rates would not result in a material change in either our obligations under this facility or in the returns on our cash and cash equivalents.
Inflation Risk
We do not believe that inflation has had a material effect on our business. However, if our costs, in particular personnel, sales and marketing and cloud-based infrastructure costs, were to become subject to significant inflationary pressures, we may not be able to fully offset such higher costs through price increases. Our inability or failure to do so could harm our business, operating results and financial condition.
Critical Accounting Policies and Significant Judgments and Estimates
Our management's discussion and analysis of financial condition and results of operations is based on our consolidated financial statements, which have been prepared in accordance with accounting principles generally accepted in the United States. The preparation of these consolidated financial statements requires us to make estimates and assumptions that affect the reported amounts of assets and liabilities and the disclosure of contingent assets and liabilities at the date of the consolidated financial statements, as well as the reported revenue and expenses during the reporting periods. These items are monitored and analyzed by us for changes in facts and circumstances, and material changes in these estimates could occur in the future. We base our estimates on historical experience and on various other factors that we believe are reasonable under the circumstances, the results of which form the basis for making judgments about the carrying value of assets and liabilities that are not readily apparent from other sources. Changes in estimates are reflected in reported results for the period in which they become known. Actual results may differ from these estimates under different assumptions or conditions.
Revenue Recognition
We derive our revenue from two sources:
- •
- Subscription and support revenue. Subscription and support revenue consists of subscription fees from customers accessing
our cloud-based software platform and applications, as well as related customer support services; and
- •
- Professional services and other revenue. Professional services and other revenue consists of fees associated with providing expert services that educate and assist our customers on the best use of our solutions as well as assist in the implementation of our solution.
Revenue recognition commences when all of the following conditions are met:
- •
- Persuasive evidence of an arrangement exists;
- •
- Delivery or performance has occurred;
72
- •
- Fees are fixed or determinable; and
- •
- Collectability is reasonably assured.
In the majority of instances, revenue from new customers is generated under sales agreements with multiple elements, comprised of subscription and support fees from customers accessing our cloud based application suite and professional consultation services. We evaluate each element in a multiple-element arrangement to determine whether it represents a separate unit of accounting. An element constitutes a separate unit of accounting when the delivered item has standalone value and delivery of the undelivered element is probable and within our control. Subscription and support have standalone value because they are routinely sold separately by us. Most of the professional services have standalone value because we have sold professional services separately, and there are several third party vendors that routinely provide similar professional services to our customers on a standalone basis. For professional services that do not have standalone value, revenue is recognized ratably over the related subscription period, not to exceed billings amounts. Prior to the fourth quarter of 2011, some of the our professional services did not have stand-alone value because they were sold together with the subscription and support services. As such, revenue was recognized ratably over the related subscription period, not to exceed billings amounts.
In October 2009, the Financial Accounting Standards Board (FASB) issued Accounting Standards Update No. 2009-13, Revenue Recognition (Topic 605): Multiple Deliverable Revenue Arrangements — a consensus of the FASB Emerging Issues Task Force (ASU 2009-13), which amended the previous multiple deliverable arrangements' accounting guidance. ASU 2009-13 amended the accounting standards for multiple-element revenue arrangements to:
- •
- Provide updated guidance on whether multiple deliverables exist, how the elements in an arrangement should be separated,
and how the consideration should be allocated;
- •
- Require an entity to allocate revenue in an arrangement using estimated selling prices (ESP) of each element if a vendor
does not have vendor specific objective evidence of selling price (VSOE) or third party evidence of selling price (TPE); and
- •
- Eliminate the use of the residual method and require a vendor to allocate revenue using the relative selling price method, which eliminated the requirement to have VSOE of fair value on undelivered elements for revenue recognition.
We adopted this accounting guidance prospectively beginning January 1, 2011, for applicable arrangements entered into or materially modified on or after January 1, 2011 (the beginning of our fiscal year).
Prior to the adoption of ASU 2009-13, we were not able to establish VSOE of fair value for the undelivered elements, which in most instances was subscription and support services. As a result, we typically recognized subscription, support and professional services revenue ratably over the subscription and support contract period and presented subscription and support revenue and professional services revenue in the consolidated statements of operations and comprehensive loss based on the respective contractual prices.
As a result of the adoption of ASU 2009-13, we allocate total arrangement fees to each element in a multiple-element arrangement based on the relative selling price hierarchy of each element unless the fee allocated to the subscription and support under this method is less than the fee subject to refund if the performance conditions are not met. In these instances, since the professional services are generally completed prior to completion of the subscription and support, the allocation of the fee for subscription and support is at least equal to the contractual amounts subject to the performance condition.
73
The relative selling price hierarchy consists of the following: Selling price for a deliverable is based on its 1) VSOE, if available, 2) TPE, if VSOE is not available, or 3) ESP, if neither VSOE nor TPE is available. Because we have been unable to establish VSOE or TPE for the elements of our arrangements, we establish the ESP for each element primarily by considering the median of actual sales prices of each type of subscription and support sold and the weighted average of actual sales prices of professional services sold. For subscription and support arrangements, management considered other factors such as database sizes, pricing practices and market considerations.
Subscription and support revenue is recognized commencing upon delivery of our cloud-based services, which is the date a new subscription is provisioned and made available to a new customer, or new or expanded capabilities are provisioned and added to an existing subscription, provided that all of the other revenue recognition criteria are first met, referred to as the "Commencement Date". Subscription and support revenue is recognized from the Commencement Date ratably thereafter over the remaining contractual term, which is generally three to 36 months. Amounts that have been invoiced are recorded in accounts receivable and in deferred revenue or revenue, depending on whether the revenue recognition criteria have been met.
Professional services and other have stand-alone value from the related subscription services. The majority of our professional services contracts are offered on a time and material basis. When these services are not combined with subscription and support revenue in a multiple-element arrangement, services revenue is recognized as the services are rendered. In 2010 and 2011, our professional services also consisted of a small number of fixed price contracts, where revenue is recognized on a proportional performance method, based on input measures, which include making reasonably dependable estimates of the total effort to complete the project. Certain standard and non-standard professional service arrangements include customer acceptance provisions. Services provided under arrangements that include customer acceptance provisions are typically provided on a time and material basis, and the revenue is deferred and recognized upon customer acceptance of the service deliverable.
Our professional services also consist of short-term implementation services, which are offered at a flat fee. The enablement services teams assist customers with standard adoption procedures for our platform. Most such enablement services consist of short-term (usually spanning 90 days) "use it or lose it" services to assist customers with standard implementation and to implement the customer's first marketing campaign, which are offered at a flat fee. Such flat fees are recognized over the 90 day period.
Education revenue is recognized after the services are performed.
We have established processes to determine ESP, allocate revenue in multiple-element arrangements using ESP, and make reasonably dependable estimates of the proportional performance method for professional services. Had we not adopted ASU 2009-13 effective January 1, 2011, and recognized all arrangements ratably, our revenue for the year ended December 31, 2011 would have been lower by approximately $453,000.
At December 31, 2011, our deferred professional services under the previous accounting guidance were not significant.
Sales and other taxes collected from customers to be remitted to government authorities are excluded from revenue.
Cost of subscriptions, support, professional services and other revenue are expensed as incurred. Cost of subscription and support revenue primarily consists of expenses related to hosting our service and providing support to our customers. These expenses are comprised of data center operations costs and personnel and related costs directly associated with our cloud infrastructure, customer support and customer success organizations, including salaries, benefits, bonuses and
74
stock-based compensation, as well as allocated overhead. Overhead associated with facilities and depreciation, excluding depreciation related to our data center infrastructure, is allocated to our cost of revenue and operating expenses based on headcount. Cost of professional services and other revenue consists primarily of personnel and related costs directly associated with our professional services and training organizations, including salaries, benefits, bonuses and stock-based compensation, the costs of sub-contracted third-party vendors, as well as allocated overhead.
Allowance for Doubtful Accounts
Trade accounts receivable are carried at the original invoiced amount less an allowance made for doubtful accounts. We maintain an allowance for doubtful accounts based on the probability of future collection. When we become aware of circumstances that may decrease the likelihood of collection, we record a specific allowance against amounts due which reduces the net receivable to the amount that management reasonably believes will be collected. For all other customers, we determine the adequacy of the allowance based on historical loss patterns, the number of days that billings are past due and an evaluation of the potential risk of loss associated with specific accounts. We review the allowance for doubtful accounts monthly and write off receivable balances which are deemed to be uncollectible. Increases in the allowance are recorded in general and administrative to expense in the period incurred. We do not have any off balance sheet credit exposure related to our customers.
Goodwill and Other Intangible Assets
Goodwill represents the excess of the purchase price over the fair value of net assets acquired. We allocated a portion of the purchase price of the acquisition of Crowd Factory to intangible assets, including existing technology, customer relationships, domain names and non-compete agreements that are being amortized over their estimated useful lives of two to eight and one-half years. We also allocated a portion of the purchase price to tangible assets and assessed the liabilities to be recorded as part of the purchase price. The estimates we made in allocating the purchase price to tangible and intangible assets, and in assessing liabilities recorded as part of the purchase, involved the application of judgment and the use of estimates, and these could significantly affect our operating results and financial position.
We review the carrying value of goodwill for impairment annually and whenever events or changes in circumstances indicate that the carrying value of goodwill may exceed its fair value. Conditions that could trigger a more frequent impairment assessment include, but are not limited to, a significant adverse change in certain agreements, significant underperformance relative to historical or projected future operating results, an economic downturn in customers' industries, increased competition, a significant reduction in our stock price for a sustained period or a reduction of our market capitalization relative to net book value. Additionally, we are required to test our goodwill for impairment at the reporting unit level. Currently, our goodwill is evaluated at the entity level as there is only one reporting unit.
The goodwill impairment test is a two-step process. The first step compares the fair value of each reporting unit with its respective carrying amount, including goodwill. If the fair value of the reporting unit exceeds its carrying amount, goodwill of the reporting unit is not considered to be impaired, and the second step of the impairment test is unnecessary. The second step in the goodwill impairment test compares the implied fair value of each reporting unit's goodwill with the respective carrying amount of that goodwill. If the carrying amount of the reporting unit goodwill exceeds the implied fair value of that goodwill, an impairment loss would be recognized in an amount equal to any such excess.
75
Determining the fair value of a reporting unit is subjective and requires judgment at many points during the test. Actual results may differ materially from these estimates. The estimates we make in determining the fair value of our reporting unit involve the application of judgment, which could affect the timing and size of any future impairment charges. Impairment of our goodwill could significantly affect our operating results and financial position.
During 2012, we completed the first step of our annual impairment test in which we compared the carrying value of the reporting unit to our enterprise value. As a result of this analysis, we determined that the value of our reporting unit is substantially in excess of its carrying value and therefore determined that the reporting unit was not at risk of failing the first step of the impairment test and that it was not necessary to perform the second step of the impairment test.
We continually evaluate whether events or circumstances have occurred that indicate that the estimated remaining useful life of our long-lived assets may warrant revision or that the carrying value of these assets may be impaired. Any write-downs are treated as permanent reductions in the carrying amount of the assets. We must use judgment in evaluating whether events or circumstances indicate that useful lives should change or that the carrying value of assets has been impaired. Any resulting revision in the useful life or the amount of an impairment also requires judgment. Any of these judgments could affect the timing or size of any future impairment charges. Revision of useful lives or impairment charges could significantly affect our operating results and financial position.
Capitalized Software Development Costs
Costs incurred to develop our cloud-based platform and applications consist of (a) certain external direct costs of materials and services incurred in developing or obtaining internal-use computer software and (b) payroll and payroll-related costs for employees who are directly associated with, and who devote time to, a given project. These costs generally consist of internal labor during configuration, coding and testing activities. Research and development costs incurred during the preliminary project stage or costs incurred for data conversion activities, training, maintenance and general and administrative or overhead costs are expensed as incurred. Capitalization begins when the preliminary project stage is complete, management with the relevant authority authorizes and commits to the funding of the software project, it is probable the project will be completed, and the software will be used to perform the functions intended and certain functional and quality standards have been met. Capitalized software development costs are amortized on a straight-line basis over the technology's estimated useful life of approximately three years. No software development costs were capitalized during 2011 or 2012. Amortization expense during the years ended December 31, 2010, 2011 and 2012 and for the three months ended March 31, 2012 and 2013 was $192,000, $181,000, $143,000, $43,000 and $34,000, respectively.
Costs incurred during the operating stage of our software applications relating to upgrades and enhancements that resulted in added functionality are not capitalized because such upgrades and enhancements are essentially maintenance and, because upgrades and enhancements are provided frequently, do not have a useful life longer than one year. Costs that cannot be separated between maintenance of, and minor upgrades and enhancements to, internal-use software are expensed as incurred.
Income Taxes
As part of the process of preparing our consolidated financial statements we are required to estimate our taxes in each of the jurisdictions in which we operate. We account for income taxes in accordance with the asset and liability method. Under this method, deferred tax assets and liabilities are recognized based on temporary differences between the financial reporting and
76
income tax bases of assets and liabilities using statutory rates. In addition, this method requires a valuation allowance against net deferred tax assets if, based upon the available evidence, it is more likely than not that some or all of the deferred tax assets will not be realized. We have provided a full valuation allowance against our net deferred tax assets at December 31, 2011, December 31, 2012 and March 31, 2013.
We adopted the provisions of ASC 740 Income taxes (ASC 740) on January 1, 2009. The adoption of ASC 740 with respect to uncertain tax positions did not have a material impact on our financial position or results of operations. At the adoption date of January 1, 2009, we had no unrecognized tax benefits. We continued to have no unrecognized tax benefits as of December 31, 2012 and March 31, 2013.
Stock-Based Compensation
We measure compensation expense related to our stock options granted to employees and consultants based upon the fair market value as of the date of the award using the Black-Scholes option-pricing model. We recognize stock-based compensation cost as an expense ratably on a straight-line basis over the requisite service period which is generally the vesting period of the respective award.
We measure compensation expense related to our RSUs granted to employees based on the value of our common stock on the date of grants. RSUs are subject to time-based vesting, which generally occurs over a period of two or four years, and a performance-based condition, which will be satisfied upon the first to occur of the sale of our business or upon our initial public offering. If an employee terminates employment prior to the occurrence of the performance-based condition, the employee will not forfeit the RSUs to the extent the time-based vesting requirement was satisfied prior to termination.
The following assumptions were used for each respective period to calculate our stock option compensation.
| |
Year Ended December 31, |
Three Months Ended March 31, |
||||||||||||
|---|---|---|---|---|---|---|---|---|---|---|---|---|---|---|
| |
2010
|
2011
|
2012
|
2012
|
2013
|
|||||||||
| |
|
|
|
(unaudited) |
||||||||||
Expected term (in years) |
6 | 6 | 6 | 6 | 6 | |||||||||
Risk-free interest rate |
2.18 | % | 2.14 | % | 1.02 | % | 1.09 | % | 1.09% - 1.18% | |||||
Expected volatility |
66 | % | 84 | % | 65 | % | 65 | % | 57% | |||||
Expected dividend rate |
0 | % | 0 | % | 0 | % | 0 | % | 0% | |||||
The assumptions are based on the following for each of the years presented.
- •
- Expected Term — we estimate the expected term consistent with the simplified method. We elected to use
the simplified method because of our limited history of exercise activity and our stock options meet the criteria of "plain-vanilla" options as defined by the SEC. The simplified method calculates the
expected term as the average of the vesting and contractual terms of the award.
- •
- Volatility — since we have no trading history by which to determine the volatility of our common stock
price, the expected volatility being used is derived from the historical stock volatilities of a representative industry peer group of comparable publicly listed companies over a period approximately
equal to the expected term of the options.
- •
- Fair Value of Common Stock — because our stock is not publicly traded, we must estimate the fair value of our common stock, see "— Common Stock Valuations" below.
77
- •
- Risk Free Interest Rate — the risk free interest rate is based on U.S. Treasury zero coupon issues with
remaining terms similar to the expected term on the options.
- •
- Expected Dividend — we have never declared or paid any cash dividends and do not plan to pay cash
dividends in the foreseeable future.
- •
- Forfeiture — we estimate forfeitures at the time of grant and revise our estimates in subsequent periods if actual forfeitures differ from those estimates. We use historical data to estimate pre-vesting forfeitures and record stock-based compensation expense only for those awards that are expected to vest. All stock-based payment awards are amortized on a straight-line basis over the requisite service periods of the awards, which are generally the vesting periods.
If any assumptions used in the Black-Scholes model change significantly, stock option compensation for future awards may differ materially compared with the awards granted previously.
Common Stock Valuations
The fair value of the common stock underlying our stock options was determined by our board of directors, which intended all options granted to be exercisable at a price per share not less than the per share fair value of our common stock underlying those options on the date of grant. The valuations of our common stock were determined in accordance with the guidelines outlined in the American Institute of Certified Public Accounts Practice Aid, Valuation of Privately-Held-Company Equity Securities Issued as Compensation. The assumptions we used in the valuation model were based on future expectations combined with management judgment. In the absence of a public trading market, our board of directors, with input from management, exercised significant judgment and considered numerous objective and subjective factors in determining the fair value of our common stock as of the date of each option grant, including the following factors:
- •
- contemporaneous valuations performed at periodic intervals by an independent, third-party valuation firm;
- •
- the prices, rights, preferences and privileges of our preferred stock relative to the common stock;
- •
- current business conditions and projections;
- •
- the market performance of comparable public traded technology companies;
- •
- secondary sales of shares of our common stock in arm's length transactions;
- •
- the likelihood of achieving a liquidity event, such as an initial public offering or sale given prevailing market
conditions and the nature and history of our business;
- •
- any adjustment necessary to recognize a lack of marketability for our common stock; and
- •
- U.S. and global capital market conditions.
78
We have granted the following stock-based awards since January 1, 2012:
Grant Date
|
Options or RSUs |
Number of Awards Granted |
Exercise Price |
Common Stock Fair Value at Grant Date |
Aggregate Common Stock Fair Value at Grant Date |
|||||||||||
|---|---|---|---|---|---|---|---|---|---|---|---|---|---|---|---|---|
January 10, 2012 |
Options | 213,249 | $ | 4.24 | $ | 4.24 | $ | 904,176 | ||||||||
February 2, 2012 |
Options | 240,500 | 4.24 | 4.24 | 1,019,720 | |||||||||||
March 2, 2012 |
Options | 486,500 | 4.24 | 4.24 | 2,062,760 | |||||||||||
April 17, 2012 |
Options | 20,549 | (1) | 4.90 | 4.56 | 93,703 | ||||||||||
April 17, 2012 |
Options | 65,459 | (1) | 5.44 | 4.56 | 298,493 | ||||||||||
April 17, 2012 |
Options | 3,397 | (1) | 9.24 | 4.56 | 15,490 | ||||||||||
May 1, 2012 |
Options | 1,202,250 | 4.56 | 4.56 | 5,482,260 | |||||||||||
May 1, 2012 |
RSUs | 308,218 | N/A | 4.56 | 1,405,474 | |||||||||||
May 25, 2012 |
Options | 301,199 | 4.56 | 4.56 | 1,373,467 | |||||||||||
July 24, 2012 |
Options | 504,750 | 4.74 | 4.74 | 2,392,515 | |||||||||||
August 29, 2012 |
Options | 231,000 | 4.74 | 4.74 | 1,094,940 | |||||||||||
August 29, 2012 |
RSUs | 25,000 | N/A | 4.74 | 118,500 | |||||||||||
September 11, 2012 |
Options | 18,000 | 4.74 | 4.74 | 85,320 | |||||||||||
October 31, 2012 |
Options | 166,999 | 4.94 | 4.94 | 824,975 | |||||||||||
October 31, 2012 |
RSUs | 8,248 | N/A | 4.94 | 40,745 | |||||||||||
February 7, 2013 |
Options | 1,261,749 | 7.42 | 7.42 | 9,362,178 | |||||||||||
February 7, 2013 |
RSUs | 13,148 | N/A | 7.42 | 97,558 | |||||||||||
February 13, 2013 |
Options | 491,750 | 7.42 | 7.42 | 3,648,785 | |||||||||||
February 13, 2013 |
RSUs | 4,000 | N/A | 7.42 | 29,680 | |||||||||||
May 1, 2013 |
Options | 345,800 | 12.00 | 12.00 | 4,149,600 | |||||||||||
May 1, 2013 |
RSUs | 3,250 | N/A | 12.00 | 39,000 | |||||||||||
- (1)
- Stock options assumed in connection with the Crowd Factory acquisition.
The aggregate intrinsic value of vested and unvested stock options and vested and unvested RSUs as of March 31, 2013, based on an assumed initial public offering price of $12.00 per share, which is the midpoint of the estimated offering price range set forth on the front cover of this prospectus, was $22.7 million, $39.8 million, $0 and $4.1 million, respectively.
In order to determine the fair value of our common stock and underlying option grants, we considered contemporaneous valuations of our stock from an independent third party valuation firm that provided us with its estimation of our enterprise value and the allocation of that value to each element of our capital structure (preferred stock, common stock, warrants and options). Management provides the independent third party valuation firm with our quarterly financial statements, forecast and capitalization information, and holds a call with representatives of the independent third party valuation firm to discuss the state of our business. When the independent third party valuation firm provides us with its valuation report, the report is reviewed internally by management and then by our board of directors.
In connection with these valuations, our enterprise value was generally estimated or reconciled using an income approach. Under the income approach, the enterprise value is based on the expected present value of our projected future debt-free cash flows. These future cash flows are discounted to their present values using a discount rate which is derived from an analysis of the cost of capital of comparable publicly traded enterprises in the same industry or similar lines of business as of each valuation date and is adjusted to reflect the risks inherent in the business cash flows.
79
Once the enterprise value is determined, that value is then allocated among the various classes of securities to arrive at the fair market value of the common stock. For this allocation, the option pricing method (OPM) was used for grants made prior to February 7, 2013, which treats each class of stock as a call option on all or part of the enterprise's value, with exercise prices based on the liquidation preference of the preferred stock. Under this method, the common stock has value only if funds available for distribution to stockholders exceed the value of the liquidation preference at the time of a liquidity event. The common stock is treated as a call option that gives the owner the right but not the obligation to buy the underlying enterprise value at an exercise price that is priced using the Black-Scholes option pricing model. For options granted on and after February 7, 2013, the probability weighted expected return method (PWERM) was used. Under the PWERM, the value of equity is estimated based on analyses of future values for the enterprise assuming various possible outcomes. Share value is based on the probability-weighted present value of expected future returns to the equity investor considering the likely future scenarios available to the enterprise, and the rights and preferences of each share class. Applying the OPM or PWERM results in an undiscounted fair value of our common stock. A marketability discount based on empirical evidence from sources incorporating studies of companies with characteristics similar to ours is then applied, yielding a fair value of our common stock on a non-marketable basis.
The most significant factors considered by our board of directors in determining the fair value of our common stock in connection with these particular grants were as follows:
January - March 2012 Option Grants. We obtained a contemporaneous independent third-party valuation of our common stock as of November 15, 2011, which determined the fair value of our common stock to be $4.24 per share. The valuation took into account the $50.0 million Series F Preferred Stock financing that we completed in November 2011. The financing was led by an external investor, with participation by some of our existing investors. Given that the financing was led by an external investor, it was determined that the price paid by the investors in the Series F financing was the most meaningful indication of our enterprise value on a marketable basis. As such, the income approach was not utilized in estimating our enterprise value, although it was used as a reconciling tool. The OPM was then utilized, assuming a time to liquidity event of 3.0 years, a risk-free rate of 0.5%, a dividend yield of 0% and volatility of 74%. A marketability discount of 8% was then applied. The discount for lack of marketability was well below the typical discounts for similar company valuations because it was determined that there is a marketability discount that was already factored into the price of the Series F Preferred Stock.
After a consideration of this valuation, our board of directors determined that the fair value of our common stock to be $4.24 per share as of November 15, 2011. In granting stock options with an exercise price of $4.24 per share in January through March 2012, our board of directors determined in connection with each grant that there were no material changes in our business since November 15, 2011, or in the assumptions upon which the valuation was based, that affected the fair value of our common stock.
April - May 2012 Grants. We obtained a contemporaneous independent third-party valuation of our common stock as of March 31, 2012, which determined the fair value of our common stock to be $4.56 per share. This valuation applied an income approach, utilizing a three-year forecast, as the primary method for determining our enterprise value. This valuation utilized a weighted average cost of capital (WACC) of 33%, which included a 19% company-specific risk premium. The OPM was then applied, assuming a time to liquidity event of 3.0 years, a risk-free rate of 0.5%, a dividend yield of 0% and volatility of 74.6%. The undiscounted fair value was then discounted for lack of marketability by 32% to yield the fair value of our common stock on a non-marketable, minority basis. The increase in the value reflected an increase in our enterprise value as a result of the growth in our business over the four and a half month period since the November 15, 2011
80
valuation. This valuation also took into account the expected closing of our acquisition of Crowd Factory for $13.0 million through the issuance of Series G Preferred Stock at a per share price of $14.60, as well as common stock and stock options, in April 2012.
The valuation also took into account the purchase of an aggregate of 202,667 shares of common stock from five of our employees, including our chief executive officer, by an existing preferred stockholder, for a purchase price of $13.20 per share in March 2012. Based on the terms of the transaction, the relatively small number of shares purchased in the transaction (less than 1% of our equity value), the limited number of parties involved in the transaction, the expectation at the time that this was a one-time transaction and no future similar transactions were then contemplated, and the purchaser's desire to increase the size of its investment in us and its belief that our value would appreciate over time, it was determined that the transaction was not determinative of fair value and so less weight was placed on that transaction price when compared with other indications of fair value.
After a consideration of this valuation, our board of directors determined the fair value of our common stock to be $4.56 per share as of March 31, 2012. In connection with our acquisition of Crowd Factory in April 2012, we assumed 89,405 fully vested stock options as part of the total merger consideration. The exercise price of these options were adjusted pursuant to the exchange ratio established in the acquisition. Also, in granting stock options with an exercise price of $4.56 per share and RSUs in May 2012, our board of directors determined in connection with each grant that there were no material changes in our business since March 31, 2012, or in the assumptions upon which the valuation was based, that affected the fair value of our common stock.
July - September 2012 Grants. We obtained a contemporaneous independent third-party valuation of our common stock as of June 30, 2012, which determined the fair value of our common stock to be $4.74 per share. This valuation applied an income approach, utilizing a three-year forecast, as the primary method for determining our enterprise value. This valuation utilized a WACC of 31.5%, which included a 17.5% company-specific risk premium. The WACC was reduced by 1.5% from the previous valuation primarily due to a decrease in forecast risk as well as consideration of our other risks and opportunities. The OPM was then applied, assuming a time to liquidity event of 2.5 years, a risk-free rate of 0.37%, a dividend yield of 0% and volatility of 70.57%. The volatility decrease was consistent with and a result of the contemporaneous relative decrease in the volatility of the stock market. The undiscounted fair value was then discounted for lack of marketability by 27% to yield the fair value of our common stock on a non-marketable, minority basis. The decrease in the marketability discount from the previous valuation was due to a decrease in the number of years to liquidity and a slightly lower volatility rate. The increase in the value from the March 31, 2012 valuation principally reflected a slight increase in our enterprise value and the effect of the decreased term to liquidity, lower WACC and decreased marketability discount described above, offset by the effect of a modest downward adjustment in our forecasted financial results.
After a consideration of this valuation, our board of directors determined the fair value of our common stock to be $4.74 per share as of June 30, 2012. In granting stock options with an exercise price of $4.74 per share in July through September 2012 and RSUs in August 2012, our board of directors determined in connection with each grant that there were no material changes in our business since June 30, 2012, or in the assumptions upon which the valuation was based, that affected the fair value of our common stock.
October 2012 Grants. We obtained a contemporaneous independent third-party valuation of our common stock as of September 30, 2012, which determined the fair value of our common stock to be $4.94 per share. This valuation applied an income approach, utilizing a three-year forecast, as the primary method for determining our enterprise value. This valuation utilized a WACC of 26.0%, which included a 15.0% company-specific risk premium. The WACC was reduced
81
by 5.5% from the previous valuation primarily due to a relative increase in our size. Our company-specific risk premium was also decreased by 250 basis points due to a decrease in forecast risk as well as consideration of our other risks and opportunities. The OPM was then applied, assuming a time to liquidity event of 2.5 years, a risk-free rate of 0.27%, a dividend yield of 0% and volatility of 67.05%. The volatility decreased consistent with the relative decrease in the volatility of the broader stock market. The undiscounted fair value was then discounted for lack of marketability by 25% to yield the fair value of our common stock on a non-marketable, minority basis. The decrease in the marketability discount from the previous valuation driven primarily by the lower volatility rate and general downward trend in interest rates. The increase in the value from the June 30, 2012 valuation principally reflected the effect of the lower WACC, decreased volatility and decreased marketability discount described above, offset by the effect of a further modest downward adjustment in our forecasted financial results.
The valuation also took into account the purchase of an aggregate of 15,000 shares of common stock from one of our employees by the same existing preferred stockholder who purchased shares in August 2012, for a purchase price of $13.20 per share. Based on the terms of the transaction, the small number of shares purchased in the transaction, the limited number of parties involved in the transaction, the expectation that this was a one-time transaction and no future similar transactions were contemplated, and the purchaser's desire to increase the size of its investment in us and its belief that our value would appreciate over time, it was determined the transaction was not determinative of fair value and so less weight was placed on that transaction price when compared with other indications of fair value.
After a consideration of this valuation, our board of directors determined that the fair value of our common stock to be $4.94 per share as of September 30, 2012. In granting stock options with an exercise price of $4.94 per share and RSUs in October 2012, our board of directors determined that there were no material changes in our business since September 30, 2012, or in the assumptions upon which the valuation was based, that affected the fair value of our common stock.
February 2013 Grants. We obtained a contemporaneous independent third-party valuation of our common stock as of December 31, 2012, which determined the fair value of our common stock to be $7.42 per share. This valuation applied an income approach as the primary method for determining our enterprise value. This valuation utilized a WACC of 27.0%, which included a 15.0% company-specific risk premium. Given the accelerated rate at which we were approaching a potential liquidity event, the PWERM was determined to be the more appropriate allocation method for valuing our common stock at this point. In applying the PWERM, a 40% probability was placed on the likelihood of an initial public offering, a 40% probability was placed on the likelihood of a sale, a 5% probability was placed on the likelihood of a dissolution, and a 15% probability was placed on the likelihood of our continuing as a going concern. The undiscounted fair value was then discounted for lack of marketability by 8.0% for the initial public offering scenario, 11.0% for the sale scenario, 16% for the dissolution scenario and 27% for the continuation as a going concern scenario, to yield the fair value of our common stock on a non-marketable, minority basis. The increase in the value from the September 30, 2012 valuation principally reflected the increased likelihood of an initial public offering as a result of our commencement of our initial public offering efforts in November 2012, our performance during the year and our outlook for 2013 and beyond. Our efforts in this regard included discussions with potential underwriters for our initial public offering in November 2012, the selection of the underwriters for the initial public offering in December 2012, and the scheduling in December of an organizational meeting for participants in the initial public offering process in early January 2013. The increased likelihood of an initial public offering led to the potentially greater value of our common stock than other scenarios primarily due to the elimination of the liquidation preferences of the preferred stock as a result of their conversion to common stock in an initial public offering, and the related reduction in the marketability discount in connection with an initial public offering. These changes shortened the term to liquidity used in
82
the valuation to 1.5 years, which has the effect of increasing our overall enterprise value. The increase also reflected an increase in our enterprise value due primarily to growth in our business during the period.
After a consideration of this valuation, our board of directors determined that the fair value of our common stock to be $7.42 per share as of December 31, 2012. In connection with granting stock options with an exercise price of $7.42 per share and RSUs on February 7 and 13, 2013, our board of directors determined that there were no material changes in our business since December 31, 2012, or in the assumptions upon which the valuation was based, that affected the fair value of our common stock.
May 2013 Grants. We obtained a contemporaneous independent third-party valuation of our common stock as of March 31, 2013, which determined the fair value of our common stock to be $10.70 per share. This valuation applied an income approach as the primary method for determining our enterprise value. This valuation utilized a WACC of 27%, which included a 15% company-specific risk premium, which was the same as the prior valuation report. Similar to the prior valuation report, the accelerated rate at which we were approaching a potential liquidity event led to the use of the PWERM as the more appropriate allocation method for valuing our common stock. In applying the PWERM, an 80% probability was placed on the likelihood of an initial public offering given our preparation for the launch of this offering, a 15% probability was placed on the likelihood of a sale, a 0% probability was placed on the likelihood of a dissolution, and a 5% probability was placed on the likelihood of our continuing as a going concern. The undiscounted fair value was then discounted for lack of marketability by 6% for the initial public offering scenario, 9% for the sale scenario and 27% for the continuation as a going concern scenario, to yield the fair value of our common stock on a non-marketable, minority basis. The increase in the value from the December 31, 2012 valuation principally reflected the increased likelihood of an initial public offering as a result of our continuing efforts toward our initial public offering efforts throughout the first quarter of 2013, our performance during the year and our outlook for 2013 and beyond, including a slight improvement in our outlook. These changes, in particular the pending launch of our marketing efforts for this initial public offering, shortened the term to liquidity used in the valuation to 0.5 years, which has the effect of increasing our overall enterprise value.
In the determination by our board of directors of the fair value of our common stock for purposes of the May 2013 option grants, we assumed the completion of this offering and that a public market for our common stock had been created. We also considered the valuation range proposed by the underwriters, evidenced by the estimated offering price range set forth on the cover page of this prospectus, relative to our financial results, current economic and market conditions, the removal of any illiquidity discount and a 100% weighting that we would complete this offering. After such considerations, our board of directors determined the fair value of our common stock to be $12.00 per share as of May 1, 2013, which is the midpoint of the estimated offering price range, and granted stock options with an exercise price of $12.00 per share as well as restricted stock units on May 1, 2013.
Recently Adopted Accounting Standards
Comprehensive Income
In June 2011, Financial Accounting Standards Board (FASB) issued Accounting Standards Update No. 2011-05, Presentation of Comprehensive Income (ASU 2011-05), which addresses the presentation of comprehensive income in interim and annual reporting of financial statements. ASU 2011-05 is intended to improve the comparability, consistency, and transparency of financial reporting and to increase the prominence of items reported in other comprehensive income by eliminating the option to present components of other comprehensive income as part of the statement of changes in stockholders' equity. ASU 2011-05 requires such changes in stockholders'
83
equity to be disclosed in either a single continuous statement of comprehensive income or in two separate but consecutive statements. ASU 2011-05 is effective for fiscal years, and interim periods within those years, beginning after December 15, 2011, and should be applied retrospectively for all periods presented. Early adoption is permitted. We early adopted ASU 2011-05 effective January 1, 2011. The adoption of ASU 2011-05 did not have a material impact on our consolidated financial statements.
Comprehensive loss as reported in the Consolidated Statements of Operations and Comprehensive Loss consists of two components, net loss and other comprehensive income (loss). Our other comprehensive income (loss) pertained to foreign currency translation gains and losses from those subsidiaries not using the U.S. dollar as their functional currency.
In February 2013, the FASB issued Accounting Standards Update No. 2013-02, Reporting of Amounts Reclassified Out of Accumulated Other Comprehensive Income. The amendments require an entity to provide information about the amounts reclassified out of accumulated other comprehensive income by component. This new accounting pronouncement is effective for interim and fiscal reporting periods beginning after December 15, 2012, with early adoption permitted. We adopted this standard during the first quarter of 2013. The adoption of this standard has expanded the consolidated financial statement footnote disclosures.
Goodwill Impairment
In September 2011, FASB issued Accounting Standards Update No. 2011-08, Testing Goodwill for Impairment (ASU 2011-08). ASU 2011-08 is intended to reduce the cost and complexity of the annual goodwill impairment test by providing entities an option to perform a "qualitative" assessment to determine whether further impairment testing is necessary. The revised standard is effective for annual and interim goodwill impairment tests performed for fiscal years beginning after December 15, 2011. Early adoption is permitted provided that the entity has not yet performed its 2011 annual impairment test or issued its financial statements. An entity has the option to first assess qualitative factors to determine whether it is necessary to perform the current two-step test. If an entity believes, as a result of its qualitative assessment, that it is more-likely-than-not that the fair value of a reporting unit is less than its carrying amount, the quantitative impairment test is required. Otherwise, no further testing is required. We did not adopt ASU 2011-08 in 2012. We performed the goodwill impairment test using the two-step test and determined that the value of our reporting unit is substantially in excess of its carrying value, resulting in no impairment being identified.
84
We are the provider of a leading cloud-based marketing software platform that enables organizations to engage in modern relationship marketing. Our software platform is designed to enable the effective execution, management and analytical measurement of marketing activities, helping organizations to acquire new customers more efficiently, build stronger relationships with existing customers, improve sales effectiveness and drive faster revenue growth. On our platform, we deliver an easy-to-use, integrated suite of advanced applications, which today include Marketing Automation, Social Marketing, Sales Insight and Revenue Analytics. To enable our customers to obtain maximum value from our platform, we have created an ecosystem of third-party applications, as well as a network of resources to foster marketing thought leadership, sharing and collaboration among our users. Furthermore, we provide our customers with expert professional services, delivered by marketers, for marketers, to enable rapid time to value through effective implementation and use of our solutions.
We designed our platform to be valuable across large enterprises and SMBs that sell to both businesses and consumers in virtually any industry. Our client base is diverse, with over 2,300 customers across a wide range of industries including business services, consumer, financial services, healthcare, manufacturing, media, technology and telecommunications. We market and sell our products directly and through a growing network of distribution partners. Representative customers include one or more divisions of the following companies: Capgemini, CenturyLink, Citrix, Gannett, General Electric, Medtronic, Moody's, Panasonic, Symantec and Universal Music Group. Except for a single customer in 2011 who was slightly over 1%, no single customer represented more than 1% of subscription and support revenue in 2010, 2011, 2012 and for the three months ended March 31, 2013.
We provide our solutions on a subscription basis and generated revenue of $14.0 million, $32.4 million and $58.4 million in 2010, 2011 and 2012, respectively, representing year-over-year increases of 131% and 80%, respectively. During the three months ended March 31, 2012 and 2013, we generated revenue of $12.2 million and $19.7 million, respectively, representing an increase of 62% during the first quarter of 2013 as compared to the first quarter of 2012. We had net losses of $11.8 million, $22.6 million, $34.4 million, $6.7 million and $9.5 million in 2010, 2011, 2012 and for the three months ended March 31, 2012 and 2013, respectively, due to increased investments in our growth. As of March 31, 2013, we had an accumulated deficit of $91.7 million.
The Rise of the Self-Directed Buyer
The manner in which people obtain information and make decisions about purchases of goods and services is undergoing a dramatic transformation. Buyers today are increasingly self directed in their purchase decision making. They spend more time gathering information across a number of digital channels, including search engines, company websites, blogs, online product reviews and social networks. At the same time, they can easily opt out of or ignore unwanted marketing communications. As a result, buyers today often form brand perceptions and make significant purchasing decisions based on online research and prior to or without any direct contact with a salesperson or evaluating a product in a retail setting.
The growing use of social networks and rapid adoption of mobile devices are further accelerating the change in how people make purchase decisions. Social networks, for example, enable easy sharing of recommendations and solicitation of feedback from trusted sources. They also enable providers of goods and services to engage with buyers in an interactive dialog that can
85
amplify marketing messages as people share information with others in their network. Mobile devices make information easy to access anytime and anywhere, expanding the ease and frequency with which consumers access online information.
These trends are fundamentally transforming both B2C and B2B purchasing processes. For example, buying a car historically entailed the prospective buyer visiting various dealerships to look at, learn about and test-drive cars before making a purchase decision. Today, consumers have access to a broad range of information online that guides and influences their pre-purchase decisions, and most car buying decisions are made before visiting a dealership. Similarly, business buyers evaluating prospective vendors at every stage of the supply chain, from basic materials, to business services, to technology products, often turn to online resources and social media to help with their decisions. Even customers evaluating sophisticated multi-million dollar industrial equipment are likely to use social networks and blogs to seek information such as pricing and discount terms from other customers before negotiating a purchase contract. In summary, the self-directed buyer increasingly expects to be able to access relevant information such as price, model numbers, configuration data and comparison charts across a diverse set of communications channels and from trusted third parties well in advance of their actual purchase decision.
Transformation of Marketing
As a result of the rise of the self-directed buyer, marketers are being pushed to fundamentally change how they engage with customers across online and offline channels and throughout the entire customer lifecycle. In virtually every organization, it is the responsibility of the marketer to create, curate and publish information about their products and services. Moreover, the marketer is tasked with managing all digital and social channels that buyers use to find information about their products and services. Given this responsibility, marketing departments are being asked to take a much larger, more direct role in communicating with prospects and customers. It is no longer sufficient for marketers to simply push static information to buyers in a mass advertising model. They must utilize new relationship-building strategies and tools to engage individually and personally with prospects and customers over the course of their self-directed decision making process; and, after the initial purchase is made, to foster retention, renewal, and maximum customer lifetime value.
Increasing usage of digital communication channels offers opportunities to aggregate a significant and ever growing amount of information about prospects and customers and their path to purchase. In addition to traditional demographic data, this information includes unstructured and diverse behavioral data such as purchase history, website visits, webinar attendance, video consumption, document downloads, telephonic and email inquiries and social network activity. This presents an opportunity for marketers to capture, analyze and leverage this information to deliver timely and relevant messages to their targeted audiences and to enable their salespeople to focus on their most promising opportunities.
The ability to more effectively leverage behavioral data and engage with prospects and customers in a more personalized fashion over time can empower marketers to have a direct and measurable impact on revenue. Organizations are therefore demanding that their marketers be more accountable for marketing spending and to be able to measure return on that spending. As a result, marketers are seeking tools that can help them keep track of expenditures across channels, campaigns and customer engagement lifecycles, and to measure, analyze and compare returns on that spending. As marketing measurement matures, organizations are increasingly able to move from thinking about "measuring marketing spending" to thinking about "optimizing marketing investments in future revenue".
86
Emergence of Modern Relationship Marketing
The rise of the self-directed buyer and the changing role of the marketer have led to the emergence of a modern approach to relationship marketing, which requires marketers to:
- •
- Create and publish relevant and personalized content across multiple channels, including search engines, email, social
media, online videos, and buying guides, to provide the information that buyers seek and expect in their decision making;
- •
- Engage in a dialog with prospects and customers based on their actions and influence them throughout a long term
relationship;
- •
- Capture data about, analyze and respond to consumer behavior both online and offline to educate prospects, identify
qualified buyers, and maximize customer lifetime value; and
- •
- Closely integrate marketing activities and information with other parts of the organization, such as sales or call centers, to create a seamless experience for buyers.
When implemented effectively, modern relationship marketing can significantly enhance an organization's ability to grow revenue, maximize return on investments in marketing and increase customer lifetime value.
Traditional Marketing and Sales Technology Tools Do Not Meet the Needs of Today's Marketers
Many software tools have been developed to enable marketers to manage campaigns and communicate with prospects and customers. These tools include internally developed and commercial software for automation and management of certain marketing functions, such as email marketing and database marketing, as well as CRM software for sales professionals. However, traditional software tools are increasingly ineffective in meeting the demands of today's marketers. Their limitations include:
- •
- Isolation by
channel. Traditional marketing software tools have been designed to address single communication channels, such as email, direct mail or
social networks. Yet today's buyers shift rapidly and continuously across different communication channels, engaging with email one moment, a web site the next and social media the next. As a result,
existing software solutions cannot adequately address multi-channel customer engagement and do not comprehensively capture all the online and offline behavioral patterns that marketers need in order
to know their customers.
- •
- Ineffective use of
data. Traditional marketing strategies and software tools primarily rely on targeting audiences based on demographics. However,
demographic targeting alone ignores valuable information about immediate and historical buyer behavior that can be obtained by examining a buyer's actions, or lack of actions, as they engage with
content and trusted sources online and in social networks. As a result, with legacy tools marketers cannot build meaningful relationships with prospects and customers.
- •
- Inability to allow dynamic and interactive one-to-one communication over time. Most commonly-used marketing software tools today primarily enable batch distribution of messages to defined populations of prospects and customers at a single point in time, such as an email or direct mail blast sent to a list of prospects or customers. They are not designed to establish and weave together evolving and customized two-way conversations between buyers and sellers over time and across channels. Legacy tools cannot adapt and respond to individual buyer actions in real time. As a result, marketers using traditional solutions are limited in their ability to have an interactive, dynamic and customized dialog with prospects and customers.
87
- •
- Lack of effective integration with other enterprise systems and
teams. Existing marketing software tools generally lack the ability to integrate seamlessly or affordably with other enterprise
applications. Thus, when buyer behavior changes, legacy systems do not effectively or in a timely manner trigger action in other parts of the organization such as sales or call centers. This often
results in uncoordinated and less relevant communications with prospects and customers, and lost opportunities.
- •
- Limited ability to measure
results. Traditional marketing software tools have limited ability to track and measure over time the impact of marketing spending on
revenue. Without a comprehensive, unified view of the impact of marketing spending across all of their channels and programs, marketers cannot compare relative effectiveness of their investments. As a
result, marketers are challenged in how to allocate and re-allocate resources to the channels and methods that have the greatest positive impact on revenue.
- •
- Difficult to implement and
use. Traditional marketing software tools can be complex and difficult to learn, implement and use, requiring significant involvement of
IT resources, extensive training and centralized expertise, thereby limiting the number of qualified users. This in turn constrains the productivity of marketing departments and delays time to value
as marketers spend extra time managing technology tools instead of focusing on customer strategy and idea generation.
- •
- Not addressed by CRM software. Traditional CRM systems have been designed primarily for the needs of salespeople and thus focus on sales execution workflow and the status of prospects at a point in time. These systems do not capture trends and changes in the behavior of prospects and customers over time, nor do they automate customer communication across various engagement channels. As a result, traditional CRM systems are not designed for marketers who need to engage with prospects and customers throughout their lifecycle.
Opportunity For a Modern Relationship Marketing Solution
The rise of self-directed buyers, the need for organizations to effectively engage in dynamic, personalized interactions with prospects and customers, and the inadequacies of existing marketing and sales software tools have created a significant opportunity for a modern relationship marketing solution. This new generation of sophisticated marketing software includes a unified set of tools spanning a wide variety of marketing communication channels, facilitates coherent customer communications over time, and captures demographic and deep behavioral information about prospects and customers in one database of record to facilitate long-term relationship building. Furthermore, the increasingly central role of marketing departments in the customer lifecycle is leading organizations to demand marketing software solutions that can accurately manage and analyze marketing effectiveness, measure return on investments in marketing and enable more efficient allocation of marketing budgets.
Large Addressable Market
Since marketing is becoming a central catalyst for revenue growth in most companies, marketers are increasingly adopting advanced technology-based solutions to keep up with changes in how buyers make purchasing decisions. Marketers already invest significant funds in pursuit of revenue. According to the CMO Council's report, The 2011 State of Marketing, global marketing and communications spending exceeds $1.5 trillion annually. Companies of all sizes are increasingly spending greater portions of their marketing budgets on technology to achieve higher productivity and better business results. For instance, according to research firm IDC's 2012 CMO Tech Marketing Barometer Study, technology CMOs estimate that 8.7% of their total marketing
88
program budget will be spent on marketing IT. We believe that our platform addresses several established segments of marketing-related software that in aggregate have been estimated by Gartner to be approximately $32 billion in 2013. These segments include customer relationship management, business intelligence, and web conferencing, teaming platforms and social software suites. Our Marketing Automation and Sales Insight applications deliver capabilities such as Relationship Marketing, Email Marketing, and Campaign Management that serve the needs of buyers in the customer relationship management segment. Our Revenue Analytics and Marketing Automation applications deliver reporting and analytics insights that address the needs of buyers in the business intelligence segment. Finally, our Social Marketing and Marketing Automation applications deliver capabilities such as Event Management, Social Campaigns, and Content Marketing that address the needs of buyers in the combined web conferencing, teaming platforms and social software suites segment. Gartner expects the aggregate of these segments to grow to nearly $41 billion by 2016.
Our leading cloud-based marketing software platform is purpose-built to enable organizations ranging from SMBs to the world's largest enterprises to engage in modern relationship marketing. Our platform enables the effective execution, management and analytical measurement of online, social media and offline marketing activities and customer interactions in today's data-centric, multi-channel business environment. We deliver an integrated suite of advanced applications built upon our software platform, which today include Marketing Automation, Social Marketing, Sales Insight and Revenue Analytics.
Many of the strategies and business processes that our solution supports are new and rapidly evolving, and there is relatively little accumulated experience in many of our prospective customers about how best to take advantage of modern relationship marketing. We therefore complement our software products with an extensive network of resources to assist our customers with the strategic and practical use of our products. Among these resources are expert consulting services, peer-to-peer discussion communities, a library of pre-built marketing programs and templates, rich content on marketing best practices and an integrated ecosystem of partner products. We collectively refer to this extended set of resources as the Marketing Nation.
89
The following graphic depicts how our platform, applications and the Marketing Nation combine to provide our overall solution for relationship marketing:
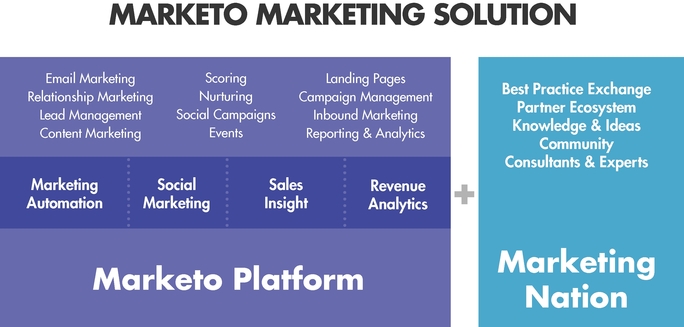
The key benefits of our solution include:
- •
- Drives faster revenue
growth. Our solution enables organizations to more effectively and efficiently acquire new customers, improve sales effectiveness and
generate faster revenue growth.
- •
- Enables organizations to better build and retain long-term
customer relationships. Our solution enables organizations to engage in personalized and interactive multi-channel dialogs with their
prospects and customers, resulting in deep, long-lasting relationships that increase customer lifetime value.
- •
- Streamlines the marketer's
world. Our solution enables organizations to manage entire multi-channel marketing campaigns and related customer interactions from a
single platform. This combines and advances the capabilities of a broad array of discrete point products in the market today, reducing complexity and cost.
- •
- Increases efficiency and speed of marketing
execution. Our solution is designed to be intuitive and easy to use so that marketers can efficiently use its many features without
requiring extensive training or specialized technical skills. The elements of our solution work together to simplify and automate repetitive tasks, such as identifying and segmenting target
populations and building and managing campaigns, so organizations can rapidly turn new marketing ideas into revenue opportunities. Our platform integrates with systems including sales,
e-commerce and call center, and synchronizes with and processes data across these systems, enabling rapid and targeted responses to customer behaviors.
- •
- Provides deep analytical insight. Our solution serves as the system of record for data across marketing campaigns and channels and connects to other complementary enterprise data sources. Our analytics capabilities help our customers measure the effectiveness and the revenue generation impact of various marketing activities. Our customers can leverage this data to measure marketing performance, forecast future revenue results, and more efficiently allocate marketing resources among different channels, programs, and initiatives.
90
We believe that our leadership position is based on key competitive strengths, including:
- •
- Ease of
use. We developed our platform to be intuitive and easy to use. We strive to enable any professional user to rapidly adopt and use our
platform to manage their marketing activities, from the simple to the most sophisticated tasks, and to do so with little or no need for technical skills or IT support. In smaller organizations, this
ease of use enables them to adopt and get value from modern and sophisticated marketing strategies that would be beyond reach with legacy tools. In large and global enterprises, this ease of use
enables distributed teams to learn and adopt the solution without the need for extensive training or expensive centralized resources.
- •
- Powerful
capabilities. As our users become proficient with modern relationship marketing strategies and with our solution, experience has shown
us that many desire to create increasingly sophisticated and impactful marketing campaigns. Moreover, as our users gain experience, they tend to pursue more insightful analytic questions about the
impact of their marketing investments and revenue outcomes. Our solution is designed to give users progressive access to increasingly powerful features when they need them, and offers significant
headroom in the richness of the campaigns they can create as well as the analytic questions they can answer. Yet at all times this power is balanced with ease of use, so that powerful features do not
get in the way of getting simple things done quickly.
- •
- Complete
platform. We offer a suite of applications that are tightly integrated and deliver a broad range of capabilities that would otherwise
require the purchase and use of multiple disparate point solutions such as email marketing tools, social campaign products and business intelligence software. By offering a complete platform, we
enable our customers seamlessly to engage in relationship marketing across multiple online and offline channels and to easily integrate with complementary enterprise software solutions to manage the
complete customer lifecycle, all from a single user interface. We designed our platform to be broadly applicable across large and small organizations that sell to both businesses and consumers in
virtually any industry. We also enable third parties to build and offer complementary marketing solutions on our platform.
- •
- Enterprise
integration. Our platform offers extensible integration with a range of enterprise-wide processes and systems, including CRM
systems, e-commerce platforms and in-house databases and custom applications. In addition, we have developed specialized integrations with industry-leading CRM solutions
including salesforce.com and Microsoft Dynamics CRM. These specialized integrations perform continuous data and task synchronization between our platform and the CRM system, thus allowing marketing,
sales and service professionals to work collaboratively. Our customers can take advantage of these specialized CRM integrations with little or no need for IT support, and we believe these features to
be substantially more advanced than the CRM integration offerings from competitive products.
- •
- Thought leadership. We strive to be a thought leader in our industry, identifying and interpreting emerging trends in relationship marketing, shaping and guiding industry dialog, and creating and sharing best marketing practices. We deliver our thought leadership and innovation through the expertise of our employees, and the authoring and dissemination of rich content about modern marketing strategies that complement and leverage our technology solution. We believe our thought leadership differentiates us and increases our customers' return on their investment in our solutions.
91
- •
- Network
effects. The Marketing Nation includes over 2,300 customers, 27,000 online community members and over 100 partners who share their
experiences, best practices and ready-to-use marketing campaign templates with other Marketo users. The growth of this community creates a network effect as the expanded access
to expertise and information benefits all participants and becomes increasingly valuable to our current and prospective customers.
- •
- Independence. We are an independent marketing software company exclusively focused on providing innovative marketing technologies, solutions and content for the modern marketing professional. Our independence enables us to continue to innovate and deliver advanced, differentiated marketing solutions, and to work with a broader set of partners, providing us a competitive advantage in the industry.
Key elements of our growth strategy are to:
- •
- Acquire new
customers. We believe the market for a modern strategic marketing platform is large and underserved. We will continue to invest in our
business to pursue this global market opportunity. We plan to acquire an increasing number of customers through the expansion of our direct sales teams. We also intend to expand our indirect sales
teams to pursue additional channel, agency and OEM distribution partnerships, and to selectively enter new geographic markets with a combination of a direct sales presence and distribution
partnerships with local and regional resellers.
- •
- Expand within our existing customer
base. Many of our customers initially purchase a component of our solution for a subset of users within a specific working group or
division. As they derive value from use of our solution, many customers decide to expand their use of our solutions, thereby providing us with an opportunity to increase our revenue from them and
increase the value of our customer relationships.
- •
- Further penetrate additional markets and
verticals. Our solution is broadly useful to many different industries and market segments because most industries and market segments
utilize the same core marketing channels, such as email, web sites, social media, online and offline events, direct mail and online advertising. Although to date a majority of our customers and
revenue has been derived from the B2B market, we have had initial success in selling into the B2C market and intend to continue to target a range of B2C industries. In addition, we intend to expand
our vertical marketing efforts in order to increase the depth of our market penetration in certain industries including healthcare, financial services, manufacturing, media and entertainment, and
others, across both B2B and B2C market segments.
- •
- Continue to innovate and extend our marketing thought
leadership. We plan to continually develop new applications that enhance the functionality of our solution and address the latest
opportunities and challenges for marketers. We will endeavor to sell these new solutions to both existing and new customers, yielding an increase in revenue as the breadth and depth of our solution
expands. In addition, we intend to leverage our competitive strength in marketing thought leadership to advance our solutions and to deliver rich content and robust services that provide
differentiated value to our customers.
- •
- Pursue selective strategic acquisitions. We intend to selectively acquire businesses and technologies as we did with the acquisition of Crowd Factory in April 2012. We plan to evaluate opportunities that will strengthen and expand the functionality of our platform and provide access to new customers or markets.
92
We design, build, and market a suite of integrated applications to broadly address the needs of modern marketing professionals. Our customers use these applications individually and in combination to streamline and automate marketing processes; develop, retain and extend customer relationships; and measure the positive impact on revenue of marketing programs. These applications are built upon a common software platform and database system of record, which also supports an ecosystem of complementary partner applications that we call LaunchPoint. Our platform and suite of applications is hosted and delivered over the web using a cloud-based, or SaaS, model, and is built using a modern multi-tenant architecture.
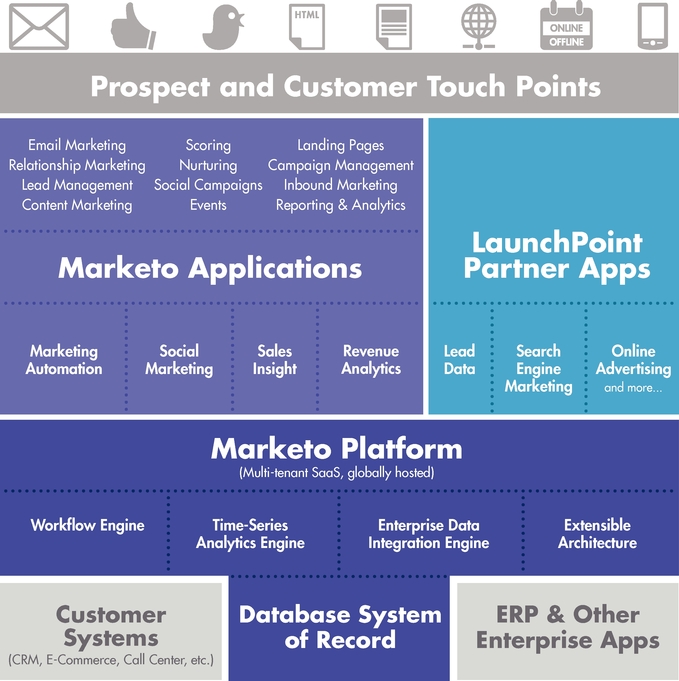
93
Platform
Our software platform includes a common set of core capabilities used across our application family, including:
- •
- A database system of
record. For each Marketo customer organization, our platform stores and maintains an individual, secure and trusted database repository
of demographic and behavioral data about each of their prospects and customers. At our larger and more active customers, this database can contain tens of millions of customer and prospect records,
and a billion or more individual data points about their behaviors. It serves as the system of record for all prospect and customer interactions with an organization's marketing, sales and
e-commerce systems, enabling organizations to build deep, lasting relationships from first contact with a prospect, during the buying process and throughout an ongoing relationship,
thereby encouraging loyalty and increasing customer lifetime value and retention.
- •
- A workflow
engine. Our platform is built around a robust, yet easy-to-use, environment for the creation, management and
automation of complex marketing campaigns across online and offline channels. This enables organizations to script and manage streams of customer interactions and engage in personalized, interactive
dialogs with their prospects and customers, and thereby build deep relationships over the entire customer lifecycle.
- •
- A time-series analytics
engine. Our platform was designed to leverage a very large volume of data and advanced analytics to help our customers pose and answer
sophisticated business questions, and particularly those that involve trends and changes over time. Examples include: how to choose personalized marketing messages and offers for each of their
prospects and customers; how to best allocate marketing resources among different channels, programs, and initiatives; and how to measure and prove the impact, effectiveness and revenue generation
results of their various marketing and sales activities.
- •
- An enterprise data integration
engine. Our platform includes interfaces for data exchange with other enterprise systems and applications, including integration with
website and web applications; business applications such as ERP, e-commerce, call center and CRM; and other marketing products such as event management and data augmentation solutions.
- •
- An extensible architecture. Our platform is designed to be extensible so that we can introduce new applications of our own and enable third-party application providers in our partner ecosystem to integrate with our database system of record, our workflow engine, and our time-series analytic engine to complement the applications we build and market ourselves.
Integrated Applications
We have built a suite of applications that run on our platform. There are currently four applications, with the following core capabilities and features:
- •
- Marketing Automation provides a complete set of capabilities for marketers to create, automate, and track personalized multi-channel marketing campaigns and sophisticated relationship-marketing workflows. It includes functionality for marketers to finely segment their prospect and customer database based on collected demographic and behavioral data; generate custom web pages without programming; send batch and individual personalized marketing messages over email, SMS text, and other channels; streamline the entire process of running online (e.g., webinar) and offline (e.g., trade show) marketing events; and to execute multi-step lead nurturing and relationship-marketing campaigns that can run over days, weeks, or months.
94
- •
- Social Marketing enables marketers to run dedicated social media marketing
campaigns, as well as to augment traditional marketing campaigns with a social marketing aspect in order to amplify marketing messages across leading social networks. Our solution lets marketers add
intelligent social sharing buttons to existing web content and videos; publish new Facebook pages with the touch of a button; build social engagement applications such as polls, sweepstakes, and
referral offers to engage their audience and promote social cross-posting; and augment existing customer and prospect information with social profiles and sharing behavior.
- •
- Sales Insight enables customers to improve the effectiveness of their
salespeople with an automated "Best Bets" view that highlights the best leads and opportunities; easy-to-read lead scoring that identifies both lead quality and urgency; online
behavior tracking with "Interesting Moments" which highlight key activities that indicate buying interest; and the ability for salespeople to turn insight into action by sending tracked emails or
entire campaigns directly within the CRM system or Microsoft Outlook. Sold on a per-seat basis, we offer this application to customers utilizing Microsoft Dynamics CRM or salesforce.com as
their CRM system.
- •
- Revenue Analytics takes advantage of our database system of record and time-series analytics engine to help organizations answer sophisticated questions about their revenue performance over time. This application enables organizations to prove — and improve — the impact that marketing has on every stage of the revenue process, from the "top of the funnel" as new prospects are acquired, to selling to new customers, to maximizing customer lifetime value. Revenue Analytics provides multiple ways to help companies understand the correlation between marketing programs and revenue outcomes, and includes: a library of operational reports detailing email and landing page performance, web activity, and lead performance; intuitive analyzers that show the influence of marketing on individual customer outcomes; analytics that compute and illustrate the impact, effectiveness and return on investment of marketing programs individually and in aggregate; and an ad-hoc report builder for completely customized reports and dashboards.
We strive to achieve tight integration among all of our applications, so that when our customers purchase and deploy more than one, they operate as a single extended application. In particular, this means they share a common user interface and one underlying database system of record, and that the combination of applications yields synergy that would not be practical or possible with multiple independent tools. For example, a social media interaction tracked by the Social Marketing application can be used by the Marketing Automation application to initiate a workflow that sends a series of personalized emails and creates a task for a salesperson in the integrated CRM system. Similarly, the segmentation logic created for a campaign executed by the Marketing Automation application can be re-used to search for valuable insights in the Revenue Analytics application.
We have introduced a new integrated application approximately once every eighteen months over the history of the company, and we intend to continue this pace of innovation in the future. For example, we recently introduced our newest integrated application, adding capabilities for Marketing Management.
Packaging for Markets
We market and sell to both large global enterprises, which we currently define as businesses with 1,500 or more employees, and SMBs, which we currently define as businesses with fewer than 1,500 employees. Our core platform and suite of integrated applications are common across all of the market segments we serve. However, we package and market our products in different
95
configurations, and we selectively enable or disable specific product capabilities based on how we evaluate the requirements and competitive dynamics of each market segment.
Many global enterprise customers have highly sophisticated procurement processes and typically select software using detailed feature-by-feature evaluations. Moreover, many enterprise customers have distributed teams, international language requirements, and the need for high capacity and scale. To respond to these enterprise requirements, we package and price our products for this segment on an individual-application basis. Customers can select one, two or more of our applications as part of an initial purchase, and can add additional applications later as their needs evolve. In addition, our platform and applications as packaged for enterprise customers includes specialized and valuable features for supporting distributed teams, and to meet large scale needs. We currently package and sell our enterprise applications as:
- •
- Marketo Lead Management includes the core Marketo platform, plus all of
the Marketing Automation capabilities available on the platform.
- •
- Marketo Social Marketing enables dedicated social media campaigns such as
referrals, sweepstakes, and other customer engagement campaigns, and also includes features to add social marketing extensions to traditional marketing campaigns.
- •
- Marketo Sales Insight provides valuable insights to salespeople about
their customers and prospects.
- •
- Marketo Revenue Cycle Analytics is a suite of analytic tools, analyzers, and ad hoc reporting capabilities taking advantage of our time-series analytics engine.
We believe that SMBs value simplicity in their evaluation and purchasing processes. For this market segment, we package and price our products in simple, complete editions. Each edition combines our platform with selected features and functions from each of our application categories to suit the varied needs of smaller businesses. SMBs purchase one of three editions:
- •
- Spark Edition is optimized for small businesses and first-time
marketing automation users, particularly those transitioning from stand-alone email marketing tools. Spark Edition provides complete email marketing functionality, plus CRM integration and
relationship marketing campaigns, and includes entry-level lead nurturing, scoring, landing pages, social campaigns, event management, and reporting.
- •
- Standard Edition includes all Spark Edition features, with additional
features including more advanced lead scoring and CRM integration, dynamic content in emails and landing pages, A/B testing, social engagement applications, and revenue analysis dashboards.
- •
- Select Edition is built for companies with more sophisticated marketing requirements. It includes all Standard Edition features along with additional features including time-series revenue analytics; more sophisticated social promotion tools; and permission-based access controls to support extended teams.
Marketing Nation
Our software solution is complemented with a network of resources, tools, and expertise designed to help our customers get better results faster. We call this the Marketing Nation. There are five pillars to the Marketing Nation:
- •
- Best Practice Exchange. Thousands of sophisticated marketing programs have been designed, built, optimized, and proven across our customer base. Our best practice Program Exchange gives customers access to a shared library of pre-built and
96
- •
- LaunchPoint Partner
Ecosystem. With our LaunchPoint partner ecosystem, we offer a robust directory of more than 100 partners and integrated solutions in
each of a broad set of application categories, providing customers with a single source to search and identify trusted and complementary marketing solutions.
- •
- Knowledge and
Ideas. We provide our customers access to hundreds of online resources including e-books and videos, an award-winning blog,
and insights from key marketing leaders across the industry. We also provide the ability for our customers to learn from other customers at our annual Marketo User Summit as well as regional user
groups in 26 cities around the world.
- •
- Community. The Marketo community has tens of thousands of marketing users with broad
experience and expertise in using our solutions creatively and effectively. Customers use the community to ask for advice and answers to specific questions, respond to questions from other users,
suggest new product features, and provide ideas and inspiration to each other.
- •
- Consultants and Experts. The Marketing Nation offers Marketo-employed and third-party professional services consultants and experts that help customers with marketing strategy, process design, change management, and technical integration.
Marketo-verified marketing programs as well as the ability to directly exchange programs with each other, so they can accelerate their success.
We believe the combined benefits of our software solution and the Marketing Nation provide our customers with the ability to quickly adopt our solutions, create effective relationship marketing programs, grow revenue faster and achieve a rapid and measureable return on investment.
Our client base is diverse, with over 2,300 customers across a wide range of industries including business services, consumer, financial services, healthcare, manufacturing, media, technology and telecommunications. Except for a single customer in 2011 who was slightly over 1%, no single customer represented more than 1% of subscription and support revenue in 2010, 2011, 2012 and for the three months ended March 31, 2013.
97
The following is a representative sample of our current customers across the industries we serve. The customers below vary in size of their respective business and the size of revenue we derive from them.
Business & Financial Services
|
Communications & Infrastructure
|
Health & Life Sciences
|
||
|---|---|---|---|---|
| Brinker Capital | 8x8 | Bio-Rad Laboratories | ||
| Capgemini | British Telecom | Christiana Care Health System | ||
| Deluxe | CenturyLink | Medtronic | ||
| Egencia, an Expedia, Inc. Company | CommScope | Northwestern Memorial Hospital | ||
| Fonecta | Equinix | |||
| Kelly Services | F5 Networks | |||
| Moody's | Fluke Networks | |||
| Vantiv | Rackspace |
Manufacturing & Hardware
|
Media & Consumer
|
Software & Cloud
|
||
|---|---|---|---|---|
| DuPont | Algonquin College | Bazaarvoice | ||
| General Electric | Crain Communications | CA Technologies | ||
| Panasonic | Gannett Company | Citrix Systems | ||
| United States Gypsum | K12 | SITA | ||
| Xylem | Universal Music Group | SunGard Availability Services | ||
| Symantec |
Customer Case Studies
We believe that the following case studies provide a representative sample of how our customers use our solutions. These case studies have been approved by the applicable customers.
Egencia, an Expedia, Inc. Company
Situation: Egencia, an Expedia, Inc. company and the fifth largest travel management company in the world, experienced several inefficiencies that hindered its sales and marketing efforts. Egencia had limited insight into open and click-through rates, and no ability to segment, track and engage prospects based on buying behavior. In addition, it took days to perform email campaigns since the prospect list had to be rebuilt from scratch each time the company undertook an email campaign. This resulted in missed opportunities, strained resources and a frustrated sales force.
Solution and benefits: Egencia selected Marketo Lead Management, Sales Insight, and Revenue Cycle Analytics in 2010 based on the solution's ability to generate, nurture, qualify and close more high quality sales leads with less effort. Working closely with Marketo's implementation team, Egencia was able to deploy our solution within weeks. Today the Marketo solution has become a strategic platform for all of Egencia's marketing and sales processes in the U.S., and they are expanding globally; the UK division of Egencia selected Marketo Standard Edition in 2012. Egencia has reported that our software was a factor in their achievement of the following benefits:
- •
- Marketing focused on building and delivering the right content, to the right person, at the right time, as opposed to
getting mired down in the execution details;
- •
- Allowed the company to launch landing pages and campaigns in less than a day as opposed to weeks;
- •
- Reduced failure-to-launch rates by half, and increased email marketing open and click-through rates significantly; and
98
- •
- Improved the ability of sales and marketing teams to work together collaboratively to drive higher revenue and increase marketing ROI.
CenturyLink Business
Situation: CenturyLink Business, a division of the third largest telecommunications company in the United States, had millions of contacts, but the marketing department could not determine which lead generation activities were most effective and which should be eliminated. CenturyLink was reliant on an outside vendor for email campaign management, which lacked real-time access to actionable campaign result metrics. CenturyLink needed better coordination and integration of its marketing efforts with its sales team. CenturyLink also needed to better test and target marketing messages to various segments of their audience so it could better develop customer relationships over time.
Solution and benefits: CenturyLink Business selected Marketo Lead Management, Sales Insight, and Revenue Cycle Analytics in 2011 based on functionality, ease of use, fast implementation, CRM integration and robust analytics. Within 90 days, the company launched its first Marketo campaign and completed the CRM integration. CenturyLink Business Marketing credits our software solution with helping them realize the following benefits within eight months of deployment:
- •
- Transformed their ability to manage campaigns, gaining full control over their campaigns;
- •
- Improved their ability to define and target prospective customers; and
- •
- Enabled the Business Marketing teams to track individual program ROI and understand and improve the effectiveness of inbound and outbound marketing programs.
Christiana Care Health System
Situation: While Christiana Care Health System, one of the largest health care providers in the mid-Atlantic region, received positive patient reviews, the organization was facing increased competition. In order to maintain market share and remain competitive and profitable, the company needed a marketing solution that would help them cost-effectively reach more prospective patients and promote its brand, while lowering its acquisition and operating cost per patient.
Solution and benefits: Christiana Care deployed Marketo Lead Management in 2010 and added Revenue Cycle Analytics in 2012 based on the products' ease of use, integration with existing systems, and ability to conduct A/B testing to determine the best campaigns to achieve the company's marketing objectives. Christiana Care funded the project with a reduction in direct mail and print advertising expenses, and is now using our solutions to build brand awareness with efficiently run email marketing campaigns. Christiana Care is also building relationships with the community with automated preventative care campaigns. The company has reported that our software was a factor in their achievement of the following benefits:
- •
- Increased ROI and reduced expense on advertising, lowering the costs of patient acquisition;
- •
- Continued expansion of the Christiana Care brand;
- •
- Reduced number of emergency room visits resulting from preventative-care nurture campaigns run using
the Marketo platform;
- •
- Lowered healthcare costs per patient; and
- •
- Increased preventative care revenue.
99
Algonquin College
Situation: Algonquin College, an arts and technology college in Canada, was using traditional batch and blast email to generate student leads. However, it knew it needed to modernize its communications with prospective students and their families so they could build and maintain relationships over sales cycles that last as long as four years.
Solution and benefits: In 2010, Algonquin deployed the precursor of our Marketo Standard Edition based on its ease of use and depth of integration with Algonquin's CRM system, as well as its ability to provide real-time insight into how customers progress through Algonquin's website, interact with landing pages, and respond to marketing campaigns. In 2012, Algonquin added Marketo Social Boost and Promotion. Algonquin has reported that our solutions have helped it achieve the following benefits:
- •
- Provided actionable insight that enabled Algonquin to measure which campaigns were most valuable in terms of generating
business;
- •
- Improved Algonquin's understanding of the factors that move prospective students from consideration to enrollment;
- •
- Improved lead generation by 71% and increased sales by 18%;
- •
- Lowered costs of distribution and marketing; print fulfillment decreased by 50%; and
- •
- Allowed the marketing department to measure ROI and take a leadership role in driving higher revenue for the organization.
Citrix Systems
Situation: Citrix was using an antiquated marketing system that was only applicable to North America and that made it difficult to track the performance of marketing efforts. With this technology, it would at times take up to three weeks to pass qualified leads onto the sales team. Citrix needed a centralized marketing platform powerful enough to be used worldwide, yet agile enough to adapt to the needs of local marketing teams.
Solution and benefits: In 2010, Citrix deployed Marketo Lead Management because it wanted a tool that could support its growth and that was easy and intuitive to use. Citrix completed their global rollout in just a few months, and after two workshops had over 70 marketers creating customized marketing campaigns in 19 languages. Citrix reported that our software has helped them achieve the following benefits:
- •
- Developed the ability to act on leads in a matter of minutes, rather than weeks;
- •
- Doubled sales lead-to-opportunity conversion from 10% to 20% percent using lead scoring; and
- •
- Aligned four different geographic regions on a single marketing platform in two months.
We sell subscriptions to our cloud-based software and services primarily through our direct sales force, whose primary sales operations are in San Mateo, California, Dublin, Ireland and Sydney, Australia. Our direct sales force is also responsible for selling to existing customers, who may renew their subscriptions, increase the usage of our products over time, add new products from our solution suite, and expand the deployment of our solutions across their organizations. In addition, we have an indirect sales organization which sells to distributors, agencies, resellers, and OEMs who in turn resell our solution to their end customers, or who use our solution to provide a variety of managed services offerings to their customers.
100
Our marketing activities are designed to build broad brand awareness, generate thought leadership and create demand and leads for our sales organizations within our target markets. Our marketing programs target influencers and decision-makers participating in a buying cycle, including the chief marketing officer, the chief information officer, the chief financial officer, the functional heads of marketing and other key technology managers. Additionally, we conduct marketing programs to engage with industry analysts, consulting firms, marketing service providers, marketing agencies, business and trade press, and other industry pundits who exert considerable influence in our market.
We use our own solution to run our marketing operations.
As of March 31, 2013, we had 147 employees in our sales and marketing organization. Our sales and marketing expenses were $11.0 million, $23.1 million and $37.8 million for the years ended December 31, 2010, 2011 and 2012, respectively, and $7.8 million and $12.3 million for the three months ended March 31, 2012 and 2013, respectively.
We devote a substantial portion of our resources to developing new solutions and enhancing existing solutions, conducting quality assurance testing and improving our core technology. We continually enhance our existing software platform and develop new applications to meet our customers' evolving relationship marketing needs.
Our staff monitors and tests our software on a regular basis, and maintains regular release processes to refine and update our solutions. We typically deploy new releases and updates ten or more times per year.
As of March 31, 2013, we had 79 employees in our research and development organization. Our research and development expenses were $5.5 million, $10.7 million and $18.8 million for the years ended December 31, 2010, 2011 and 2012, respectively, and $3.8 million and $5.0 million for the three months ended March 31, 2012 and 2013, respectively.
Technology Infrastructure and Operations
We have designed our technology infrastructure to provide a highly available and secure multi-tenant cloud-based platform for marketing solutions. We utilize leading hardware and software components and modern systems architecture, which enable us to incrementally increase computing capacity as our customer base grows and adoption of our solution increases. Our solutions use a single code base for all customers and are globally available via standard web browsers. Our multi-tenancy model uses a common data model for all customers but provides data isolation with separate tables and schemas for each customer.
The architecture and deployment of our services are guided by a number of key goals:
- •
- Reliability and
Availability. Our solutions are deployed in modular components. Servers and software components are replicated to provide
fault-tolerance and high-availability with uptimes greater than 99.99%. Customer data is replicated among our data centers, within region, to protect against disaster and loss.
- •
- Scalability. Our ability to partition customer data onto multiple servers across
multiple datacenters allows our solution to scale to serve a large number of customers, and to process and manage significant volumes of data for those customers.
- •
- Security, Compliance and Certification. Our services are designed and reviewed regularly in an effort to ensure the security and integrity of our services and to protect the confidentiality of our customers' data. We enforce the use of secure protocols and
101
- •
- Cost Effectiveness. Our architecture takes advantage of standard computing hardware and open source software to allow us to scale operations efficiently and cost-effectively.
authentication by our customers and our employees to access the Marketo services. We protect our data centers with modern intrusion detection systems, and we regularly run security tests on each release of the platform before deployment. We obtain third-party audits and examinations relating to our technical operations practices, security and data privacy, including a Statement on Standards for Attestation Engagements (SSAE) No. 16 Type II certification.
We host our solutions at several facilities in the United States and the European Union. Each data center provides physical security including staffed security 24 hours per day, seven days a week, biometric access controls, and redundant power, environmental controls and Internet connection points. We continuously monitor our services for availability, performance and security.
In 2012, to improve the responsiveness and cost efficiency of our data center operations, we began an effort to transition from a managed hosting service provider to co-location data center facilities for which we are purchasing and managing our own computer equipment and systems. We began to serve customers with our first wholly self-managed data center in the third quarter of 2012, and intend to conduct a long term program to migrate the majority of our customers to our self-managed data centers over time.
The market for cloud-based marketing software and related solutions is new and evolving, highly competitive and significantly fragmented. We expect competition to continue to increase in the future. We believe the principal factors that generally determine a company's competitive advantage in our market include the following:
- •
- ease of use;
- •
- product features and fit for purpose;
- •
- domain expertise and brand in relationship marketing;
- •
- price of products and services;
- •
- integration with third-party applications and data sources;
- •
- pace of innovation and product roadmap;
- •
- ability to make customers successful through demonstrated return on investment;
- •
- breadth and expertise of sales organization;
- •
- strength of professional services organization;
- •
- platform scalability, reliability and availability; and
- •
- company size and financial stability of operations.
While we believe that we compete effectively with respect to each of the factors identified above, given the large number, disparate sizes and varying areas of focus of other software companies with which we compete, we may not always compare favorably with respect to certain of the foregoing factors.
102
We face intense competition from other software companies that develop marketing software. Some of these competitors include:
- •
- cloud-based marketing automation providers such as Act-On, Eloqua (which was recently acquired by Oracle) and
HubSpot;
- •
- traditional database marketing software vendors such as Aprimo (a division of Teradata), SAS Institute and Unica (a
division of IBM);
- •
- email marketing software vendors, such as ExactTarget, Responsys and Silverpop; and
- •
- large scale enterprise suites such as Oracle Corporation and SAP AG.
Our current and potential competitors may have significantly more financial, technical, marketing and other resources than we have, are able to devote greater resources to the development, promotion, sale and support of their products and services, have more extensive customer bases and broader customer relationships than we have, and may have longer operating histories and greater name recognition than we have. As a result, these competitors may be able to respond quicker to new technologies and to undertake more extensive marketing campaigns. In a few cases, these vendors may also be able to offer marketing software at little or no cost by bundling them with their existing software products. To the extent any of our competitors have existing relationships with potential customers for either marketing software or other solutions, those customers may be unwilling to purchase our solutions because of pre-existing relationships with these competitors.
If one or more of our competitors were to merge or partner with another of our competitors, the change in the competitive landscape could adversely affect our ability to compete effectively. For example, Oracle recently acquired our competitor Eloqua, and ExactTarget acquired our competitor Pardot. Other companies such as Adobe, IBM and salesforce.com have also recently acquired companies in the marketing automation and/or social marketing and related spaces. These acquisitions have resulted in fewer but larger companies with whom we compete for customers.
We also expect that new competitors, such as enterprise software vendors that have traditionally focused on enterprise resource planning or back office applications, will continue to enter the marketing software market with competing products, which could have an adverse effect on our business, operating results and financial condition. In addition, sales force automation and customer relationship management system vendors, such as Microsoft, NetSuite and salesforce.com, could acquire or develop solutions that compete with our offerings.
We rely on a combination of patents, copyrights, trademarks, service marks, trade secret laws, confidentiality procedures and contractual restrictions to establish and protect our proprietary rights in our products and services. As of March 31, 2013, we had three pending U.S. patent applications. We intend to pursue additional patent protection to the extent we believe it would be beneficial and cost effective.
We registered "Marketo", the Marketo logo and certain other marks as trademarks in the United States and several other jurisdictions. We also have filed trademark applications for Marketing Nation, LaunchPoint and others in the United States and certain other jurisdictions, and will pursue additional trademark registrations to the extent we believe it would be beneficial and cost effective.
We are the registered holder of a variety of domestic and international domain names that include "marketo.com" and similar variations.
103
We license software from third parties for integration into our products, including open source software and other software available on commercially reasonable terms.
All of our employees and independent contractors are required to sign agreements acknowledging that all inventions, trade secrets, works of authorship, developments and other processes generated by them on our behalf are our property and assigning to us any ownership that they may claim in those works. In addition, we generally enter into confidentiality agreements with our employees, consultants, vendors and customers, and generally limit access to and distribution of our proprietary information.
Despite our precautions, it may be possible for unauthorized third parties to copy our products and use information that we regard as proprietary to create products and services that compete with ours.
Some license provisions protecting against unauthorized use, copying, transfer and disclosure of our products may be unenforceable under the laws of certain jurisdictions and foreign countries. In addition, the laws of some countries do not protect proprietary rights to as great an extent as the laws of the United States, and many foreign countries do not enforce these laws as diligently as government agencies and private parties in the United States. To the extent we expand our international activities, our exposure to unauthorized copying and use of our products and misappropriation of our proprietary information may increase.
We expect that software and other solutions in our industry may be increasingly subject to third-party infringement claims as the number of competitors grows and the functionality of products in different industry segments overlaps. Moreover, many of our competitors and other industry participants have been issued patents and/or have filed patent applications, and have asserted claims and related litigation regarding patent and other intellectual property rights. From time to time, third parties, including certain of these leading companies, have asserted patent, copyright, trademark, trade secret and other intellectual property rights within the industry. Any of these third parties might make a claim of infringement against us at any time.
Certain aspects of how our customers utilize our solution are subject to regulations in the United States, European Union and elsewhere. New and expanding "Do Not Track" regulations have recently been enacted or proposed that protect users' right to choose whether or not to be tracked online. These regulations seek, among other things, to allow consumers to have greater control over the use of private information collected online, to forbid the collection or use of online information, to demand a business to comply with their choice to opt out of such collection or use, and to place limits upon the disclosure of information to third party websites. These policies could have a significant impact on the operation of our marketing software or cause us to make changes to our solution in the future.
The Controlling the Assault of Non-Solicited Pornography and Marketing Act of 2003 (CAN-SPAM Act) establishes certain requirements for commercial email messages and specifies penalties for the transmission of commercial email messages that are intended to deceive the recipient as to source or content. The CAN-SPAM Act, among other things, obligates the sender of commercial emails to provide recipients with the ability to opt out of receiving future commercial emails from the sender. In addition, the CAN-SPAM Act, regulations issued pursuant to the CAN-SPAM Act, and the Telephone Consumer Protection Act allow companies to send some types of commercial text messages only when the recipient has opted in to the receipt of such text messages. The ability of our customers' message recipients to opt out of receiving commercial emails may minimize the effectiveness of the email components of our marketing software offerings. In addition, certain states and foreign jurisdictions, such as Australia, Canada and the European
104
Union, have enacted laws that regulate sending email, and some of these laws are more restrictive than U.S. laws. For example, some foreign laws prohibit sending unsolicited email unless the recipient has provided the sender advance consent to receipt of such email, or in other words has "opted-in" to receiving it. A requirement that recipients opt into, or the ability of recipients to opt out of, receiving commercial emails may minimize the effectiveness of our software. We require that our customers comply with our email use policy, which prohibits, among other things, using the Marketo solution to send unsolicited emails, though we cannot guarantee compliance with the policy by each customer.
Our solutions include features that enable our customers to run sweepstakes, contests and similar events that are subject to regulation by various jurisdictions. To the extent that these regulations and the enforcement of these regulations dissuade our customers from conducting these types of events, they could impact customer demand for these features and ultimately customer demand for our solutions.
In addition, U.S., state and foreign jurisdictions are considering and may in the future enact legislation or laws restricting the ability to conduct marketing activities in mobile, social and web channels. Any of the foregoing existing or future restrictions could require us to change one or more aspects of the way we operate our business, which could impair our ability to attract and retain customers, or increase our operating costs or otherwise harm our business. We may be unable to pass along those costs to our clients in the form of increased subscription fees.
While these laws and regulations generally govern our customers' use of our solution, we may be subject to certain laws as a data processor on behalf of, or as a business associate of, our customers. For example, these laws and regulations governing the collection, use and disclosure of personal information include, in the United States, rules and regulations promulgated under the authority of the Federal Trade Commission, the Health Insurance Portability and Accountability Act of 1996, the Gramm-Leach-Bliley Act of 1999 and state breach notification laws, and internationally, the Data Protection Directive in the European Union and the Federal Data Protection Act in Germany. If we were found to be in violation of any of these or similar laws or regulations as a result of government enforcement or private litigation, we could be subjected to civil and criminal sanctions, including both monetary fines and injunctive action that forces us to change our business practices.
Additionally, our customers collect and use personal information about consumers to conduct their marketing campaigns, which subjects them to federal, state and foreign privacy laws that regulate the use, collection and disclosure of consumers' personal information. In European Union member states and certain other countries outside the United States, data protection is more highly regulated and diligently enforced under privacy regulations and not email regulations. Non-compliance with these laws and regulations carries significant financial penalties.
Our terms and conditions and acceptable use policies require that our customers comply with all applicable laws, including, among others, the CAN-SPAM Act and other applicable privacy regulations, in the use of our solutions and hold our customers liable for any violations of such laws. If we become aware that a customer has violated a law applicable to its activities while using our solutions and/or breached our terms and conditions, we can suspend or terminate their use of our solutions and professional services. Although we believe that our customers' use of our solutions will comply with existing laws, if challenged, we may be unable to demonstrate adequate compliance with existing or future laws or regulations.
We are subject to a number of federal, state, and international laws and regulations regarding data governance and the privacy and protection of consumer data that affect companies conducting business on the Internet. In addition, many of our customers and potential customers in the healthcare, financial services and other industries are subject to substantial regulation regarding
105
their collection, use and protection of data and may be the subject of further regulation in the future. In the area of information security and data protection, there are many domestic, at both the federal and state-level, and international laws requiring notification to users when there is a security breach of their sensitive personal data, such as the 2002 amendment to California's Information Practices Act. Other similar laws and regulations require the adoption of minimum information security standards to protect data as it is in transit. We expect the costs of compliance with these laws to increase in the future as changes in legal interpretation and as continued data breaches impose further requirements on the online industry. Furthermore, any failure on our part to comply with these laws may subject us to significant liabilities and fines to our customers and us.
As of March 31, 2013, we had 373 employees, including 79 in research and development, 147 in sales and marketing, 111 in operations, customer support and professional services, and 36 in general and administrative. As of March 31, 2013, we had 342 employees in the United States and 31 employees internationally. None of our employees are covered by collective bargaining agreements. We believe our employee relations are good and we have not experienced any work stoppages.
Our corporate headquarters and executive offices are located in San Mateo, California, where we occupy approximately 67,230 square feet of office space under a lease that expires in August 2016. We maintain additional offices in Portland, Oregon, Dublin, Ireland and Sydney, Australia.
We lease all of our facilities, and we do not own any real property. We believe that our existing facilities are adequate for our current needs and that we will be able to lease suitable additional or alternative space on commercially reasonable terms if and when we need it.
On May 7, 2013, iHance, Inc. sent us a communication alleging that a salesperson email tracking feature in our Marketo Sales Insight application infringed upon certain of iHance's patents. While no litigation has been filed to date related to these claims, iHance indicated that such a filing is imminent in the federal district court for the Northern District of California. We are continuing to evaluate iHance's claims, but based on the information available to us today, we currently believe that this threat and any related litigation will not be material to us. However, addressing these claims and any subsequent litigation could cause us to incur significant expenses and costs and, even if we were to prevail, this litigation could be costly and time consuming, could divert the attention of our management and key personnel from our business operations, and may discourage customers from purchasing our solution or renewing their subscriptions. In addition, as a result of any litigation, we may be required to pay settlement fees or damages, agree to a license to iHance's patents on terms that are unfavorable to us, or become subject to an injunction that requires us to modify our salesperson email tracking feature. Any of these outcomes could harm our business. We intend to vigorously defend any litigation related to these claims.
From time to time we may become involved in legal proceedings or be subject to claims arising in the ordinary course of our business. Although the results of litigation and claims cannot be predicted with certainty, we currently believe that the final outcome of these ordinary course matters will not have a material adverse effect on our business, operating results, financial condition or cash flows. Regardless of the outcome, litigation can have an adverse impact on us because of defense and settlement costs, diversion of management resources and other factors.
106
Executive Officers and Directors
The following table sets forth the names, ages and positions of our executive officers and directors as of April 1, 2013:
Name
|
Age
|
Position
|
|||
|---|---|---|---|---|---|
Executive Officers |
|||||
Phillip M. Fernandez |
52 | President, Chief Executive Officer and Chairman of the Board | |||
Frederick A. Ball |
50 | Senior Vice President and Chief Financial Officer | |||
William B. Binch |
42 | Senior Vice President, Sales | |||
Sanjiv P. Dholakia |
43 | Senior Vice President and Chief Marketing Officer | |||
Jason L. Holmes |
44 | Senior Vice President, Client Services | |||
Srinivasan Venkatesan |
42 | Senior Vice President, Products and Engineering | |||
Sharon S. Zezima |
48 | Vice President, General Counsel and Corporate Secretary | |||
Non-Employee Directors |
|||||
Neeraj Agrawal(1) |
40 | Director | |||
Susan L. Bostrom(2) |
52 | Director | |||
Tae Hea Nahm(1)(3) |
53 | Director | |||
Douglas A. Pepper(2) |
39 | Director | |||
Roger S. Siboni(1)(3) |
58 | Director | |||
Wesley R. Wasson(2)(3) |
46 | Director | |||
- (1)
- Member
of the audit committee
- (2)
- Member
of the compensation and leadership development committee
- (3)
- Member of the nominating and governance committee
Executive Officers
Phillip M. Fernandez co-founded our company and has served as our President, Chief Executive Officer and Chairman of our board of directors since January 2006. Prior to joining us, Mr. Fernandez was with Epiphany, Inc., a customer relationship management (CRM) software company acquired by SSA Global Technologies, Inc. in September 2005. From April 1999 to September 2005, he served in various executive roles at Epiphany, most recently as President and Chief Operating Officer from July 2003 until September 2005. Mr. Fernandez holds a B.A. in History from Stanford University.
We believe Mr. Fernandez is qualified to serve as a member of our board of directors because of his operational and historical expertise gained from serving as our President and Chief Executive Officer. As one of our founders and the longest serving member of our board of directors, we also value his deep understanding of our business as it has evolved over time.
Frederick A. Ball has served as our Senior Vice President and Chief Financial Officer since May 2011. Prior to joining us, Mr. Ball served as the Chief Financial Officer of Webroot Software, Inc., a software security solutions provider, from June 2008 to April 2011. From August 2004 to October 2007, Mr. Ball served as Senior Vice President and Chief Financial Officer at BigBand Networks, Inc., a digital video networking company, and as an advisor from October 2007 to June 2008. From October 2003 to May 2004, Mr. Ball served as Chief Operating Officer and director of CallTrex Corporation, a provider of customer service solutions. From September 1999 to July 2003, Mr. Ball served in various executive roles at Borland Software Corporation, a software company, most recently as Executive Vice President of Corporate Development and Mergers and Acquisitions. Mr. Ball currently serves as a member of the board of directors of Advanced Energy
107
Industries, Inc., a provider of power and control technologies, and Electro Scientific Industries, Inc., a supplier of laser systems. Mr. Ball holds a B.S. in Accounting from Virginia Polytechnic Institute and State University.
William B. Binch has served as our Senior Vice President, Sales since January 2011 and was our Vice President of Sales from May 2008 to January 2011. Prior to joining us, Mr. Binch served as Vice President and General Manager, Distribution at Avolent, Inc., an application software provider, from February 2007 to May 2008. Mr. Binch holds a B.S. in Business from Arizona State University.
Sanjiv P. Dholakia has served as our Senior Vice President and Chief Marketing Officer since July 2012, and was our Senior Vice President of Product Marketing from April 2012 to July 2012. Prior to joining us, Mr. Dholakia served as Chief Executive Officer from April 2010 to April 2012 at Crowd Factory, Inc., a social marketing application company we acquired in April 2012. From November 2008 to April 2010, he served as Chief Marketing Officer at Lithium Technologies Inc., a social-media marketing software company. Mr. Dholakia was with SumTotal Systems, Inc., a talent development enterprise software company, from February 2001 to October 2008, where he served in various executive roles, most recently as Senior Vice President and General Manager, Learning and Talent Management Business Unit from October 2007 until October 2008. Mr. Dholakia holds a B.S. in Economics from the Wharton School at the University of Pennsylvania and an M.B.A. in Strategy and Marketing from the Kellogg School of Management.
Jason L. Holmes has served as our Senior Vice President, Client Services since February 2012. Prior to joining us, Mr. Holmes served as Vice President, Global Professional Services at Adobe Systems Incorporated, a computer software company, from October 2009 to February 2012. From October 2008 to October 2009, he served as Vice President, Worldwide Consulting at Omniture, Inc., an online marketing and web analytics company acquired by Adobe in November 2009. From April 2007 to September 2008, Mr. Holmes served as Vice President, Consulting at Oracle Corporation, a computer technology company. Mr. Holmes holds a B.S. in Finance from Arizona State University and an M.B.A. in Marketing from Northern Illinois University.
Srinivasan Venkatesan has served as our Senior Vice President, Products and Engineering since May 2012. Prior to joining us, Mr. Venkatesan was with StubHub, Inc., an online ticket marketplace and wholly-owned subsidiary of eBay, Inc., an online auction and shopping website, from October 2007 until May 2012, where he served in various executive roles, including Vice President, New Platforms from November 2011 to May 2012, Chief Technology Officer and Vice President of Product and Technology from January 2010 to November 2011 and Chief Technology Officer from October 2007 to January 2010. From October 2000 to October 2007, Mr. Venkatesan was with eBay, where he served in various executive roles, most recently as Senior Director, Product Development from March 2007 to October 2007. Mr. Venkatesan holds a Bachelor's degree in Electrical Engineering from Bharathidasan University in India.
Sharon S. Zezima has served as our Vice President, General Counsel since February 2012 and as our Corporate Secretary since May 2012. Prior to joining us, Ms. Zezima was with Electronic Arts Inc., an interactive entertainment software company, from September 2000 until February 2012, where she held various senior roles, most recently as Vice President and Deputy General Counsel. Ms. Zezima holds an A.B. in American Studies from Smith College and a J.D. from the University of Chicago Law School.
Board of Directors
Neeraj Agrawal has served as a member of our board of directors since November 2011. Since May 2007, Mr. Agrawal has been a general partner of Battery Ventures, a venture capital firm he joined in 2000. He is a member of the board of directors of Bazaarvoice, Inc., a social commerce solutions company. Mr. Agrawal holds a B.S. in Computer Science from Cornell University and an M.B.A. from the Harvard Business School.
108
We believe Mr. Agrawal is qualified to serve as a member of our board of directors because of his substantial corporate governance, business strategy and corporate development expertise gained from his significant experience in the venture capital industry analyzing, investing in and serving on the boards of directors of various public and private technology companies. We also value his perspective as a representative of one of our largest stockholders.
Susan L. Bostrom has served as a member of our board of directors since May 2012. Ms. Bostrom was with Cisco Systems, Inc., a networking equipment provider, from October 1997 to January 2011, where she served in various executive roles, most recently as Chief Marketing Officer from January 2006 and as Executive Vice President from August 2007 until January 2011. She is a member of the board of directors of Cadence Design Systems, Inc., an electronic design company, and Varian Medical Systems, Inc., a medical devices and software manufacturer. Ms. Bostrom holds a B.S. in Marketing from the University of Illinois and an M.B.A. from the Stanford Graduate School of Business.
We believe Ms. Bostrom is qualified to serve as a member of our board of directors because of her substantial corporate governance, operational and financial expertise gained from holding various executive positions at a publicly traded technology company and from serving on the boards of directors for several public companies.
Tae Hea Nahm has served as a member of our board of directors since July 2008. Mr. Nahm has been a managing director of Storm Ventures, a venture capital firm he co-founded, since September 2000. Prior to Storm Ventures, Mr. Nahm was a partner at the law firms of Venture Law Group and Wilson Sonsini Goodrich & Rosati, P.C. Mr. Nahm also serves on the board of directors of Com2uS, a South Korean mobile game development company. Mr. Nahm holds an A.B. in Applied Mathematics from Harvard University and a J.D. from the University of Chicago Law School.
We believe Mr. Nahm is qualified to serve as a member of our board of directors because of his substantial corporate finance, business strategy and corporate development expertise gained from his significant experience in the venture capital industry analyzing, investing in and serving on the boards of directors of various private technology companies. We also value his perspective as a representative of one of our largest stockholders.
Douglas A. Pepper has served as a member of our board of directors since October 2006. Mr. Pepper is a general partner of InterWest Partners, a venture capital firm, which he joined in September 2000. Mr. Pepper holds a B.A. in History from Dartmouth College and an M.B.A. from the Stanford Graduate School of Business.
We believe Mr. Pepper is qualified to serve as a member of our board of directors because of his substantial corporate finance, business strategy and corporate development expertise gained from his significant experience in the venture capital industry analyzing, investing in and serving on the boards of directors of various private technology companies. We also value his deep understanding of our business and customer base he gained as a longstanding member of our board of directors as well as his perspective as a representative of one of our largest stockholders.
Roger S. Siboni has served as a member of our board of directors since October 2011. Mr. Siboni was with Epiphany, Inc., a provider of customer interaction software, where he served as president and chief executive officer from August 1998 to July 2003 and as chairman of the board of directors until it was acquired by SSA Global Technologies, Inc. in September 2005. Prior to joining Epiphany, Mr. Siboni spent more than 20 years at KPMG Peat Marwick LLP, a member firm of KPMG International, an accounting and consulting firm, most recently as its deputy Chairman and Chief Operating Officer. Mr. Siboni also serves on the board of directors of Cadence Design Systems, Inc., an electronic design company, and Dolby Laboratories, Inc., a provider of audio entertainment systems. Previously, Mr. Siboni served on the board of directors of infoGROUP Inc. from January 2009 until it was acquired by CCMP Capital Advisors, LLC in July 2010, ArcSight, Inc.
109
from June 2009 until it was acquired by Hewlett-Packard Company in October 2010, and Classmates Media Corporation, a wholly owned subsidiary of United Online, Inc. from 2007 to 2010. Mr. Siboni is also a past chairman of the advisory board for the Walter A. Haas School of Business at the University of California at Berkeley. Mr. Siboni holds a B.S. in Business Administration from the University of California at Berkeley.
We believe Mr. Siboni is qualified to serve as a member of our board of directors because of his substantial corporate governance, operational and financial expertise gained as an executive at several companies in the technology and finance industries, including his experience as deputy Chairman and Chief Operating Officer at KPMG and his experience serving on the boards of directors of several public companies.
Wesley R. Wasson has served as a member of our board of directors since September 2009. Mr. Wasson joined Citrix Systems, Inc., a cloud and mobile computing technology company, in August 2005 and has served in various executive roles including as its Senior Vice President of Strategy since October 2012 and Senior Vice President and Chief Marketing Officer from October 2007 to September 2012. He joined Citrix in August 2005 through its acquisition of NetScaler, Inc., where he was Vice President of Worldwide Marketing. Mr. Wasson holds a B.S. in Business Administration from Biola University and an M.B.A. from the University of Phoenix.
We believe Mr. Wasson is qualified to serve as a member of our board of directors because of his extensive operational and technical expertise gained from his experience serving in various senior management positions at several technology companies, including a publicly traded company.
There are no family relationships among any of our directors or executive officers.
Our business and affairs are managed under the direction of our board of directors. The number of directors will be fixed by our board of directors, subject to the terms of our amended and restated certificate of incorporation and amended and restated bylaws that will become effective immediately prior to the completion of this offering. Our board of directors currently consists of seven directors, six of whom will qualify as "independent" under The NASDAQ Stock Market listing standards.
In accordance with our amended and restated certificate of incorporation and our amended and restated bylaws, immediately after the completion of this offering our board of directors will be divided into three classes with staggered three-year terms. Only one class of directors will be elected at each annual meeting of our stockholders, with the other classes continuing for the remainder of their respective three-year terms. Our directors will be divided among the three classes as follows:
- •
- the Class I directors will be Ms. Bostrom and Mr. Siboni, and their terms will expire at the annual meeting
of stockholders to be held in 2014;
- •
- the Class II directors will be Messrs. Pepper and Wasson, and their terms will expire at the annual meeting of
stockholders to be held in 2015; and
- •
- the Class III directors will be Messrs. Agrawal, Fernandez and Nahm, and their terms will expire at the annual meeting of stockholders to be held in 2016.
The division of our board of directors into three classes with staggered three-year terms may delay or prevent a change of our management or a change of control. Under Delaware law, our directors may be removed for cause by the affirmative vote of the holders of a majority of our outstanding voting stock. Directors may not be removed by our stockholders without cause.
110
Any increase or decrease in the number of directors will be distributed among the three classes so that, as nearly as possible, each class will consist of one-third of the directors.
Our board of directors has undertaken a review of the independence of each director. Based on information provided by each director concerning his or her background, employment and affiliations, our board of directors determined that Messrs. Agrawal, Nahm, Pepper, Siboni and Wasson and Ms. Bostrom do not have a relationship that would interfere with the exercise of independent judgment in carrying out the responsibilities of a director and that each of these directors is "independent" as that term is defined under the applicable rules and regulations of the SEC and the listing requirements and rules of The NASDAQ Stock Market. In making these determinations, our board of directors considered the current and prior relationships that each non-employee director has with our company and all other facts and circumstances our board of directors deemed relevant in determining their independence, including the beneficial ownership of our capital stock by each non-employee director, and the transactions involving them described in the section titled "Certain Relationships, Related Party and Other Transactions".
Our board of directors has appointed Roger S. Siboni to serve as our lead independent director. As lead independent director, Mr. Siboni will preside over periodic meetings of our independent directors, serve as a liaison between our Chairman and the independent directors and perform such additional duties as our board of directors may otherwise determine and delegate.
Our board of directors currently has an audit committee, a compensation and leadership development committee and a nominating and governance committee. The composition and responsibilities of each of the committees of our board of directors is described below. Members will serve on these committees until their resignation or until otherwise determined by our board of directors.
Audit Committee
Our audit committee is comprised of Messrs. Agrawal, Nahm and Siboni. Mr. Siboni serves as our audit committee chairperson. Messrs. Agrawal and Siboni meet the requirements for independence of audit committee members under current NASDAQ Stock Market listing standards and SEC rules and regulations, and before the expiration of the phase-in period applicable to initial public offerings under the applicable NASDAQ Stock Market rules, all members of our audit committee will be independent for audit committee purposes. Each member of our audit committee meets the financial literacy requirements of the current listing standards. In addition, our board of directors has determined that each of Messrs. Siboni and Agrawal is an audit committee financial expert within the meaning of Item 407(d) of Regulation S-K under the Securities Act. The responsibilities of our audit committee include, among other things:
- •
- selecting and hiring the independent registered public accounting firm to audit our financial statements;
- •
- helping to ensure the independence and performance of the independent registered public accounting firm;
- •
- approving audit and non-audit services and fees;
- •
- reviewing financial statements and discussing with management and the independent registered public accounting firm our annual audited and quarterly financial statements, the
111
- •
- preparing the audit committee report that the SEC requires to be included in our annual proxy statement;
- •
- reviewing reports and communications from the independent registered public accounting firm;
- •
- reviewing the adequacy and effectiveness of our internal controls and disclosure controls and procedures;
- •
- reviewing our policies on risk assessment and risk management;
- •
- reviewing related party transactions;
- •
- establishing and overseeing procedures for the receipt, retention and treatment of accounting related complaints and the
confidential submission by our employees of concerns regarding questionable accounting or auditing matters; and
- •
- reviewing annually the audit committee charter and the committee's performance.
results of the independent audit and the quarterly reviews, and the reports and certifications regarding internal controls over financial reporting and disclosure controls;
Our audit committee will operate under a written charter, to be effective prior to the completion of this offering, that satisfies the applicable rules of the SEC and the listing standards of The NASDAQ Stock Market. We intend to comply with future requirements to the extent they become applicable to us.
Compensation and Leadership Development Committee
Our compensation and leadership development committee is comprised of Ms. Bostrom and Messrs. Pepper and Wasson. Ms. Bostrom serves as our compensation and leadership development committee chairperson. The composition of our compensation and leadership development committee meets the requirements for independence under current listing standards and SEC rules and regulations. Each member of the compensation and leadership development committee is also a non-employee director, as defined pursuant to Rule 16b-3 promulgated under the Exchange Act, and an outside director, as defined pursuant to Section 162(m) of the Internal Revenue Code, as amended (the Code). The purpose of our compensation and leadership development committee is to oversee our compensation policies, plans and benefit programs and to discharge the responsibilities of our board of directors relating to compensation of our executive officers. The responsibilities of our compensation and leadership development committee include, among other things:
- •
- overseeing our overall compensation philosophy and compensation policies, plans and benefit programs;
- •
- reviewing and approving for our executive officers (other than the CEO, for which the committee makes a recommendation to
the board of directors): the annual base salary, annual incentive bonus (including the specific goals and amounts), equity compensation, employment agreements, severance agreements, change in control
arrangements, and any other benefits, compensation or arrangements;
- •
- preparing the compensation committee report that the SEC requires to be included in our annual proxy statement; and
- •
- administering our equity compensation plans.
Our compensation and leadership development committee will operate under a written charter, to be effective prior to the completion of this offering, that satisfies the applicable rules of the SEC
112
and the listing standards of The NASDAQ Stock Market. We intend to comply with future requirements to the extent they become applicable to us.
Nominating and Governance Committee
Our nominating and governance committee is comprised of Messrs. Nahm, Siboni and Wasson. Mr. Nahm serves as our nominating and governance committee chairperson. The composition of our nominating and governance committee meets the requirements for independence under current NASDAQ Stock Market listing standards and SEC rules and regulations. The responsibilities of our nominating and governance committee include, among other things:
- •
- identifying, evaluating and making recommendations to our board of directors regarding, nominees for election to our board
of directors and its committees;
- •
- considering and making recommendations to our board of directors regarding the composition of our board of directors and
its committees;
- •
- reviewing developments in corporate governance practices;
- •
- evaluating the adequacy of our corporate governance practices and reporting;
- •
- developing and making recommendations to our board of directors regarding our corporate governance guidelines;
- •
- reviewing the succession planning for each of our executive officers; and
- •
- evaluating the performance of our board of directors and of individual directors.
Our nominating and governance committee will operate under a written charter, to be effective prior to the completion of this offering, that satisfies the applicable rules of the SEC and the listing standards of The NASDAQ Stock Market. We intend to comply with future requirements to the extent they become applicable to us.
Compensation Committee Interlocks and Insider Participation
No member of our compensation and leadership development committee has ever been an executive officer or employee of ours. None of our executive officers currently serve, or have served during the last completed year, on the compensation committee or board of directors of any other entity that has one or more executive officers serving as a member of our board of directors or compensation and leadership development committee.
Global Code of Business Conduct and Ethics
We have adopted a Global Code of Business Conduct and Ethics, to be effective upon the completion of this offering, that is applicable to all of our employees, officers and directors, including our Chief Executive Officer, Chief Financial Officer and other executive and senior financial officers.
Non-Employee Director Compensation
Prior to May 2013, we had not implemented a formal policy with respect to compensation payable to our non-employee directors for service as directors. From time to time, we have granted stock options to those non-employee directors who are also not affiliated with our venture fund investors for their service on our board of directors. We have not paid cash compensation to any of our non-employee directors. We do, however, reimburse our directors for expenses associated with attending meetings of our board and meetings of committees of our board.
113
The following table provides information regarding stock options granted to certain of our non-employee directors during the year ended December 31, 2012. We did not pay cash or any other compensation to our non-employee directors during the year ended December 31, 2012. Directors who are also our employees receive no additional compensation for their service as a director. During the year ended December 31, 2012, one director, Mr. Fernandez, our President, Chief Executive Officer and Chairman of the Board, was an employee. Mr. Fernandez's compensation is discussed in the section titled "Executive Compensation".
2012 Director Compensation Table
| Name | Option Awards(1)
|
Total
|
|||||
|---|---|---|---|---|---|---|---|
Neeraj Agrawal |
— | — | |||||
Susan L. Bostrom |
$ | 232,974 | $ | 232,974 | |||
Bruce A. Cleveland(2) |
— | — | |||||
Norman A. Fogelsong(3) |
— | — | |||||
Tae Hea Nahm |
— | — | |||||
Douglas A. Pepper |
— | — | |||||
Roger S. Siboni |
— | — | |||||
Robert T. Vasan(4) |
— | — | |||||
Wesley R. Wasson |
— | — | |||||
- (1)
- The
amounts in the "Option Awards" column reflect the aggregate grant date fair value of stock options granted during the fiscal year computed in accordance
with FASB ASC Topic 718. The assumptions that we used to calculate these amounts are discussed in Note 10 to our financial statements included at the end of this prospectus. As required by SEC
rules, the amounts shown exclude the impact of estimated forfeitures related to service-based vesting conditions.
- (2)
- Mr. Cleveland
resigned as a member of our board of directors in May 2012.
- (3)
- Mr. Fogelsong
resigned as a member of our board of directors in March 2013.
- (4)
- Mr. Vasan resigned as a member of our board of directors in March 2013.
The following table lists all outstanding equity awards held by our non-employee directors as of December 31, 2012.
| Name | Option Grant Date |
Number of Securities Underlying Unexercised Options Exercisable(1) |
Number of Securities Underlying Unexercised Options Unexercisable |
Option Exercise Price Per Share |
Option Expiration Date |
|||||||||||
|---|---|---|---|---|---|---|---|---|---|---|---|---|---|---|---|---|
Susan L. Bostrom |
05/01/2012 | (2) | 90,000 | — | $ | 4.56 | 04/30/2022 | |||||||||
Roger S. Siboni |
12/13/2006 | (3) | 12,000 | — | 0.12 | 12/12/2016 | ||||||||||
|
10/04/2011 | (4) | 115,000 | — | 2.74 | 10/03/2021 | ||||||||||
Wesley R. Wasson |
12/18/2009 | (3) | 57,600 | — | 0.74 | 12/17/2019 | ||||||||||
|
07/22/2011 | (5) | 60,000 | — | 2.74 | 07/21/2021 | ||||||||||
- (1)
- The options listed are subject to an early exercise provision and are immediately exercisable. Early-exercised options are subject to repurchase by us at the original exercise price, which right lapses pursuant to the option's vesting schedule.
114
- (2)
- One
thirty-sixth of the shares subject to the option vested on June 1, 2012 and one thirty-sixth of the shares vest monthly thereafter, subject to
continued service to us. This option provides for full vesting acceleration in the event of a change in control.
- (3)
- The
option is fully vested.
- (4)
- 2,500
shares subject to the option vest monthly over thirty-six months starting on the one month anniversary of October 4, 2011, and,
thereafter, 2,084 shares subject to the option vest monthly over 12 months beginning on the one month anniversary of October 4, 2014, subject to continued service to us. This option
provides for full vesting acceleration in the event of a change in control.
- (5)
- One thirty-sixth of the shares subject to the option vested on August 22, 2011 and one thirty-sixth of the shares vest monthly thereafter, subject to continued service to us. This option provides for full vesting acceleration in the event of a change in control.
On May 1, 2013, we granted Messrs. Agrawal, Nahm, Pepper, Siboni and Wasson and Ms. Bostrom each an option to purchase 16,800 shares of our common stock at an exercise price per share of $12.00 pursuant to our 2006 Stock Plan. 100% of the shares subject to each of the options vest upon the earlier of (i) our 2014 annual stockholder meeting or (ii) May 1, 2014. Each option is also an "early exercise" option, immediately exercisable in full, with the underlying unvested shares subject to a right of repurchase in favor of us at the option exercise price.
Outside Director Compensation Policy
In May 2013, the board of directors, upon the recommendation of our compensation and leadership development committee, approved a policy for the compensation for our non-employee directors (Outside Directors). Outside Directors will receive compensation in the form of equity and cash, as described below:
Equity Compensation. On the date of each annual meeting of our stockholders, each Outside Director will be granted an option to purchase shares having a grant date fair value equal to $125,000 computed in accordance with FASB ASC Topic 718 (Annual Grant). The exercise price will be the fair market value, as determined in accordance with our 2013 Equity Incentive Plan on the date of the grant. All of the shares underlying the Annual Grant will vest upon the earlier of (i) the next year's annual stockholder meeting or (ii) one year from grant, subject to continued service on the vesting date. Newly elected directors would receive a pro-rata Annual Grant based on the period of service between their election and the next Annual Grant date.
Cash Compensation. Each Outside Director will receive an annual fee of $26,000 in cash for serving on our board of directors (Annual Fee). In addition to the Annual Fee, the lead independent director will be entitled to an additional annual fee of $10,000 in cash.
The chairperson and members of the three standing committees of our board of directors will be entitled to the following annual cash fees:
Board Committee
|
Chairperson Fee | Member Fee | |||||
|---|---|---|---|---|---|---|---|
Audit Committee |
$ | 16,000 | $ | 8,000 | |||
Compensation and Leadership Development Committee |
$ | 10,000 | $ | 5,000 | |||
Nominating and Governance Committee |
$ | 6,000 | $ | 3,000 | |||
All fees in cash will be paid on a quarterly basis.
115
Our named executive officers for 2012, which consist of our principal executive officer and the next two most highly compensated executive officers, are:
- •
- Phillip M. Fernandez, our President, Chief Executive Officer and Chairman of the Board;
- •
- Sanjiv P. Dholakia, our Senior Vice President and Chief Marketing Officer; and
- •
- Jason L. Holmes, our Senior Vice President, Client Services.
2012 Summary Compensation Table
The following table provides information regarding the compensation of our named executive officers during the year ended December 31, 2012.
| Name and Principal Position | Year | Salary | Bonus | Stock Awards(1) |
Option Awards(2) |
Total | |||||||||||||
|---|---|---|---|---|---|---|---|---|---|---|---|---|---|---|---|---|---|---|---|
Phillip M. Fernandez |
2012 | $ | 325,000 | $ | 308,750 | (3) | — | $ | 1,852,900 | $ | 2,486,650 | ||||||||
Sanjiv P. Dholakia |
2012 |
194,792 |
(4) |
287,623 |
(5) |
$ |
317,914 |
201,165 |
1,001,494 |
||||||||||
Jason L. Holmes |
2012 |
221,591 |
(6) |
168,808 |
(7) |
— |
589,190 |
979,589 |
|||||||||||
- (1)
- The
amounts in the "Stock Awards" column reflect the aggregate grant date fair value of stock awards granted during 2012 computed in accordance with FASB
ASC Topic 718. The assumptions that we used to calculate these amounts are discussed in Note 10 to our financial statements included at the end of this prospectus. As required by SEC rules, the
amounts shown exclude the impact of estimated forfeitures related to service-based vesting conditions.
- (2)
- The
amounts in the "Option Awards" column reflect the aggregate grant date fair value of option awards granted during 2012 computed in accordance with FASB
ASC Topic 718. The assumptions that we used to calculate these amounts are discussed in Note 10 to our financial statements included at the end of this prospectus. As required by SEC rules, the
amounts shown exclude the impact of estimated forfeitures related to service-based vesting conditions.
- (3)
- The
amount represents payments earned under the 2012 Corporate Bonus Plan which were paid on a discretionary basis as discussed under the section titled
"Executive Compensation — 2012 Corporate Bonus Plan". All such amounts were paid in February 2013.
- (4)
- Mr. Dholakia
joined us in April 2012 and received a prorated base salary based on an annual base salary of $275,000.
- (5)
- Of the total amount, (i) $220,027 represents a one-time cash sign-on bonus paid to Mr. Dholakia for joining us in connection with our acquisition of Crowd Factory in April 2012
116
and (ii) $67,596 represents payments earned under the 2012 Corporate Bonus Plan which were (A) paid on a discretionary basis as discussed under the section titled "Executive Compensation — 2012 Corporate Bonus Plan", and (B) prorated to reflect Mr. Dholakia joining us in April 2012. Such bonus amounts were paid in May 2012 and February 2013, respectively.
- (6)
- Mr. Holmes
joined us in February 2012 and received a prorated base salary based on an annual base salary of $250,000.
- (7)
- The amount represents payments earned under the 2012 Corporate Bonus Plan which were (A) paid on a discretionary basis as discussed under the section titled "Executive Compensation — 2012 Corporate Bonus Plan", and (B) prorated to reflect Mr. Holmes joining us in February 2012. All such amounts were paid in February 2013.
Executive Employment Arrangements
We have entered into offer letters with all of our named executive officers, except for Mr. Fernandez. These agreements provide for at-will employment and generally include the named executive officer's initial base salary, an indication of eligibility for an annual cash incentive award opportunity, and equity awards. In addition, each of our named executive officers has executed a management retention agreement with us which provides for potential payments and benefits due upon a termination of employment or a change in control. These employment arrangements are described below.
Phillip M. Fernandez
For 2012, Mr. Fernandez, our President, Chief Executive Officer and Chairman of the Board, had an annual base salary of $325,000 and a target bonus of $325,000. Mr. Fernandez's annual base salary is $350,000 and his target bonus is $350,000 for 2013.
On May 1, 2012 we granted Mr. Fernandez an option to purchase 700,000 shares of our common stock at an exercise price per share of $4.56 pursuant to our 2006 Stock Plan. The option vests over a four-year period as follows: one fourth of the shares subject to the option vests on the first anniversary of the date of grant and thereafter one forty-eighth of the shares subject to the option vests each month. The option is also an "early exercise" option, immediately exercisable in full, with the underlying unvested shares subject to a right of repurchase in favor of us at the option exercise price. In addition, the option is subject to our change in control acceleration policy described in the section titled "Executive Compensation — Executive Employment Arrangements — Change in Control Acceleration Policy".
On February 7, 2013, we granted Mr. Fernandez an option to purchase 375,000 shares of our common stock at an exercise price per share of $7.42 pursuant to our 2006 Stock Plan. The option vests over a two-year period as follows: one twenty-fourth of the shares subject to the option vests monthly for 24 months beginning on February 7, 2015. The option is also an "early exercise" option, immediately exercisable in full, with the underlying unvested shares subject to a right of repurchase in favor of us at the option exercise price.
We have entered into a Management Retention Agreement with Mr. Fernandez with an effective date as of July 24, 2012. The agreement provides that if, during the Change in Control Period, Mr. Fernandez's employment with us is terminated involuntarily by us without Cause and other than by his death or disability, or voluntarily by him for Good Reason, then subject to Mr. Fernandez signing and not revoking a release in our favor, he will be entitled to the following: (i) a lump-sum severance payment equal to 150% of his annual base salary (as in effect immediately prior to a Change in Control or his termination, whichever is greater) plus the greater
117
of 150% percent of his annual target bonus or 150% of his most recent annual bonus; (ii) 100% acceleration of his equity compensation awards; and (iii) in lieu of any other employment benefits, $3,000 per month for 18 months from the date of termination.
Sanjiv P. Dholakia
We have entered into an offer letter dated April 17, 2012 with Mr. Dholakia, our Senior Vice President and Chief Marketing Officer. The offer letter sets forth Mr. Dholakia's annual base salary of $275,000, target bonus of $100,000 and a one-time cash sign-on bonus equal to 25% of a bonus pool we established for employees who joined us in connection with our acquisition of Crowd Factory. Mr. Dholakia's annual base salary and target bonus are the same for 2013.
On May 1, 2012, in accordance with the terms of his offer letter, we granted Mr. Dholakia 69,718 restricted stock units and an option to purchase 11,750 shares of our common stock at an exercise price per share of $4.56, each pursuant to our 2006 Stock Plan. The option vests over a two-year period as follows: one twenty-fourth of the shares subject to the option vests monthly for 24 months beginning on April 17, 2014. The option is an early exercise option, immediately exercisable in full, with the underlying unvested shares subject to a right of repurchase in favor of us at the option exercise price. The restricted stock units vest as to 50% of the shares on each anniversary of April 17, 2012. However, none of the restricted stock units vest until the earlier of our initial public offering or a Sale Event. "Sale Event" means a "change in ownership", "change in effective control" or "change of a substantial portion of our assets", each as defined in Section 409A of the Code, but does not include a capital raising event or a merger effected solely to change our domicile. In the event we terminate Mr. Dholakia without cause at anytime within the two year period following April 17, 2012, 50% of the shares subject to the restricted stock units will also vest. In addition, up to 15% of the shares subject to the restricted stock units are subject to forfeiture during the eighteen month period following April 17, 2012 to satisfy certain indemnification claims we may make in connection with our acquisition of Crowd Factory. The option and restricted stock units granted to Mr. Dholakia on May 1, 2012 are subject to our change in control acceleration policy described in "Executive Compensation — Executive Employment Arrangements — Change in Control Acceleration Policy".
On August 29, 2012, we granted Mr. Dholakia an option to purchase 57,500 shares of our common stock at an exercise price per share of $4.74 pursuant to our 2006 Stock Plan. The option vests over a four-year period as follows: one fourth of the shares subject to the option vests on the first anniversary of the grant date and thereafter one forty-eight of the shares subject to the option vests each month. The option is also an "early exercise" option, immediately exercisable in full, with the underlying unvested shares subject to a right of repurchase in favor of us at the option exercise price.
On February 7, 2013, we granted Mr. Dholakia an option to purchase 75,000 shares of our common stock at an exercise price per share of $7.42 pursuant to our 2006 Stock Plan. The option vests over a two-year period as follows: one twenty-fourth of the shares subject to the option vests monthly for 24 months beginning on February 7, 2015. The option is also an "early exercise" option, immediately exercisable in full, with the underlying unvested shares subject to a right of repurchase in favor of us at the option exercise price.
We have entered into a Management Retention Agreement with Mr. Dholakia with an effective date as of July 24, 2012. The agreement provides that if, during the Change in Control Period, Mr. Dholakia's employment with us is terminated involuntarily by us without Cause and other than by his death or disability, or voluntarily by him for Good Reason, then subject to Mr. Dholakia signing and not revoking a release in our favor, he will be entitled to the following: (i) a lump-sum severance payment equal to 100% of his annual base salary (as in effect immediately prior to a
118
Change in Control or his termination, whichever is greater) plus the greater of 100% percent of his annual target bonus or 100% of his most recent annual bonus; (ii) 100% acceleration of his equity compensation awards; and (iii) in lieu of any other employment benefits, $3,000 per month for 12 months from the date of termination.
Jason L. Holmes
We have entered into an offer letter dated January 13, 2012 with Mr. Holmes, our Senior Vice President, Client Services. The offer letter sets forth Mr. Holmes' annual base salary of $250,000 and target bonus of $200,000. Mr. Holmes' annual base salary and target bonus are the same for 2013.
On March 2, 2012, in accordance with the terms of his offer letter, we granted Mr. Holmes an option to purchase 237,500 shares of our common stock at an exercise price per share of $4.24 pursuant to our 2006 Stock Plan. The option vests over a four-year period as follows: one fourth of the shares subject to the option vests on the first anniversary of February 13, 2012 and thereafter one forty-eighth of the shares subject to the option vests each month. This option is an early exercise option, pursuant to which 166,746 shares are immediately exercisable on the date of grant and an additional 23,584 shares become exercisable on January 1, 2013 and, thereafter, 23,585 shares become exercisable on each of January 1, 2014 and January 1, 2015. Any shares exercised prior to time they vest are subject to a right of repurchase in favor of us at the option exercise price. In addition, this option is subject to our change in control acceleration policy described in "Executive Compensation — Executive Employment Arrangements — Change in Control Acceleration Policy".
On February 7, 2013, we granted Mr. Holmes an option to purchase 60,000 shares of our common stock at an exercise price per share of $7.42 pursuant to our 2006 Stock Plan. The option vests over a two-year period as follows: one twenty-fourth of the shares subject to the option vests monthly for 24 months beginning on February 7, 2015. The option is also an "early exercise" option, immediately exercisable in full, with the underlying unvested shares subject to a right of repurchase in favor of us at the option exercise price.
We have entered into a Management Retention Agreement with Mr. Holmes with an effective date as of July 24, 2012. The agreement provides that if, during the Change in Control Period, Mr. Holmes' employment with us is terminated involuntarily by us without Cause and other than by his death or disability, or voluntarily by him for Good Reason, then subject to Mr. Holmes signing and not revoking a release in our favor, he will be entitled to the following: (i) a lump-sum severance payment equal to 100% of his annual base salary (as in effect immediately prior to a Change in Control or his termination, whichever is greater) plus the greater of 100% percent of his annual target bonus or 100% of his most recent annual bonus; (ii) 100% acceleration of his equity compensation awards; and (iii) in lieu of any other employment benefits, $3,000 per month for 12 months from the date of termination.
For purposes of the Management Retention Agreements described above, the following definitions apply:
"Cause" means (i) an unauthorized use or disclosure of our confidential information or trade secrets, which use or disclosure causes material harm to us; (ii) a deliberate material failure to comply with any of our written policies or rules; (iii) conviction of, or plea of "guilty" or "no contest" to, a felony under the laws of the U.S. or any state thereof; (iv) gross misconduct; (v) following a Change in Control only, a continued failure to perform assigned duties after receiving written notification of such failure from our board of directors, provided that such duties are those customarily performed by a person holding the position that such executive officer holds immediately prior to the Change in Control of a corporation of similar size and engaged in a similar
119
line of business as us; or (vi) failure to cooperate in good faith with a governmental or internal investigation of us or our directors, officers or employees, if we have requested such cooperation.
"Change in Control" means the occurrence of any of the following events:
- •
- any person is or becomes the beneficial owner, directly or indirectly, of our securities representing 50% or more of
(i) the then outstanding shares of our common stock or (ii) the combined voting power of our then outstanding voting securities entitled to vote generally in the election of directors;
- •
- the following individuals cease for any reason to constitute a majority of the number of directors then serving on our
board of directors (Incumbent Board): individuals who, as of July 24, 2012, serve on our board of directors and any new director whose appointment or election by our board of directors or
nomination for election by our stockholders was approved or recommended by a vote of at least two-thirds of the directors then still in office who either were directors as of
July 24, 2012 or whose appointment, election or nomination for election was previously so approved or recommended;
- •
- a merger or consolidation of us or any direct or indirect subsidiary of ours is consummated with any other corporation,
other than a merger or consolidation pursuant to which (i) our voting securities then outstanding immediately prior to such merger or consolidation will continue to represent more than 50% of
the outstanding shares of common stock and the combined voting power of the outstanding voting securities entitled to vote generally in the election of directors, as the case may be, of us or such
surviving entity or any parent thereof outstanding immediately after such merger or consolidation; (ii) no Person will become the beneficial owner, directly or indirectly, of our securities of
the securities of such surviving entity or any parent thereof representing 50% or more of the outstanding shares of common stock or the combined voting power of the outstanding voting securities
entitled to vote generally in the election of directors; and (iii) individuals who were members of the Incumbent Board will constitute at least a majority of the members of the board of
directors of the corporation resulting from such merger or consolidation; or
- •
- our stockholders approve a plan of complete liquidation or dissolution or there is consummated an agreement for the sale or disposition of all or substantially all of our assets, other than a sale or disposition of all or substantially all of our assets to an entity, (i) more than 50% of the outstanding shares of common stock and the combined voting power of the outstanding voting securities entitled to vote generally in the election of directors, as the case may be, of which is owned by our stockholders in substantially the same proportions as their ownership immediately prior to such sale; (ii) in which no person is or becomes the beneficial owner, directly or indirectly, of our securities representing 50% or more of the outstanding shares of common stock resulting from such sale or disposition or the combined voting power of the outstanding voting securities entitled to vote generally in the election of directors; and (iii) in which individuals who were members of the Incumbent Board will constitute at least a majority of the members of the board of directors.
"Change in Control Period" means the period commencing three months prior to a Change in Control and ending twelve months after the Change in Control.
With respect to Mr. Fernandez's Management Retention Agreement only, "Good Reason" means without Mr. Fernandez's consent, (i) a material reduction in his level of responsibility and/or scope of authority, (ii) a material reduction in base salary (other than a reduction generally applicable to other executive officers and in generally the same proportion), or (iii) relocation of his principal workplace by more than 35 miles. In addition, upon any such voluntary termination for Good Reason, Mr. Fernandez must provide written notice of the existence of one or more of the
120
above conditions within 60 days of its initial existence, we must be provided written or e-mailed notice with 30 days to remedy the condition and the resignation must be effective no later than 31 days following the provision of such written or e-mailed notice to us if such condition is not remedied.
With respect to Messrs. Dholakia's and Holmes' Management Retention Agreements only, "Good Reason" means without their consent, (i) a material reduction in their level of responsibility and/or scope of authority, (ii) a material reduction in base salary (other than a reduction generally applicable to other executive officers and in generally the same proportion), or (iii) relocation of their principal workplace by more than 35 miles. For purposes of clause (i) upon or after a Change in Control, a change in responsibility shall not be deemed to occur solely because they are part of a larger organization or solely because of a change in title. In addition, upon any such voluntary termination for Good Reason, they must provide written notice of the existence of one or more of the above conditions within 60 days of its initial existence, we must be provided written or e-mailed notice with 30 days to remedy the condition and the resignation must be effective no later than 31 days following the provision of such written or e-mailed notice to us if such condition is not remedied.
Change in Control Acceleration Policy
We have adopted a change in control acceleration policy applicable to our executive officers and certain other management-level employees. Under this policy, if any executive officer is subject to an Involuntary Termination within 12 months after a Change in Control, then (i) 50% of the then unvested shares subject to a qualifying equity award shall vest and (ii) 50% of the then unexercisable shares subject to an option that is also a qualifying equity award shall become exercisable. A qualifying equity award includes the following awards held by our executive officers and certain other management-level employees: all outstanding options as of July 24, 2012; any stock subject to vesting as of July 24, 2012; and all other option and share awards approved by our board of directors through July 24, 2012 as subject this policy. This policy does not apply to any option or other equity awards made after July 24, 2012. In addition, this policy is superseded in its entirety by the terms of the Management Retention Agreements we have entered into with certain of our executive officers so long as each applicable Management Retention Agreement is effective. See "Executive Compensation — Executive Employment Arrangements" for a description of our Management Retention Agreements.
For purposes our change in control acceleration policy, the following definitions apply:
"Change in Control" means (i) the consummation of a merger or consolidation of us with or into another entity or (ii) the sale of all or substantially all of our assets. Notwithstanding the foregoing, a merger or consolidation of us shall not constitute a "Change in Control" if immediately after such merger or consolidation a majority of the voting power of the capital stock of the continuing or surviving entity, or any direct or indirect parent corporation of such continuing or surviving entity, will be owned by the persons who were our stockholders immediately prior to such merger or consolidation in substantially the same proportions as their ownership of the voting power of our capital stock immediately prior to such merger or consolidation.
"Involuntary Termination" means the occurrence of any of the following events:
- •
- the termination of an employee by us for reasons other than Cause;
- •
- voluntary resignation within 30 days following (i) a change in position that involves a material reduction in the employee's level of responsibility and/or scope of authority, (ii) a material reduction in base salary (other than a reduction generally applicable to our employees and in generally the same proportion), or (iii) receipt of notice that the
121
employee's principal workplace will be relocated more than 35 miles. For the purpose of clause (i) upon or after a Change in Control, a change in responsibility shall not be deemed to occur solely because the employee is part of a larger organization or solely because of a change in title.
For purposes of the definition of "Involuntary Termination", "Cause" has the same meaning as the definition used in the Management Retention Agreements. See "Executive Compensation — Executive Employment Arrangements".
All of our named executive officers participated in our 2012 Corporate Bonus Plan. The 2012 Corporate Bonus Plan provided for bonus payments to eligible employees based upon our achievement of annual financial performance objectives that measure the first year value of all subscriptions purchased by new customers during 2012. Such bonus payments were subject to adjustment in the event we exceeded or did not meet a specified financial performance target based on the annual value of all renewals by our customers in 2012. In addition, up to 40% of payments were subject to adjustment based on individual performance objectives that included certain strategic business goals that are established on an annual basis.
The overall design and structure of our 2012 Corporate Bonus Plan is substantially similar to the design and structure of our 2013 Corporate Bonus Plan, which is described below under "Executive Compensation — 2013 Corporate Bonus Plan".
Our board of directors and compensation and leadership development committee had discretion to increase or decrease payouts under the 2012 Corporate Bonus Plan in the event that they determined that circumstances warranted adjustment. In connection with analyzing our 2012 year-end results, our board of directors and the compensation and leadership development committee exercised discretion in approving payments for 2012, although the pre-established financial performance objectives under the 2012 Corporate Bonus Plan for such payments were not met. As a result, our named executive officers will be treated as having received discretionary bonus payments for 2012. The annual payments earned by our named executive officers and their annual target bonuses under the 2012 Corporate Bonus Plan were as follows:
Named Executive Officer
|
Annual Target Award Opportunity |
Actual Award Amount |
|||||
|---|---|---|---|---|---|---|---|
Phillip M. Fernandez |
$ | 325,000 | $ | 308,750 | |||
Sanjiv P. Dholakia |
100,000 | 67,596 | (1) | ||||
Jason L. Holmes |
200,000 | 168,808 | (2) | ||||
- (1)
- Amount
prorated to reflect Mr. Dholakia joining us in April 2012.
- (2)
- Amount prorated to reflect Mr. Holmes joining us in February 2012.
Our compensation and leadership development committee has approved a 2013 Corporate Bonus Plan on similar terms to the 2012 Corporate Bonus Plan. All of our named executive officers are eligible to participate in the 2013 Corporate Bonus Plan. To be eligible for bonus payments under the 2013 Corporate Bonus Plan, individuals must be employed with us before October 1, 2013. The 2013 Corporate Bonus Plan provides for bonus payments to eligible employees determined based upon our achievement of annual financial performance objectives, with up to 40% of payments subject to adjustment based on individual performance objectives, as described
122
in greater detail below. The following are the target bonuses at 100% funding for each 2012 named executive officer under the 2013 Corporate Bonus Plan: Mr. Fernandez: $350,000; Mr. Dholakia: $100,000; and Mr. Holmes $200,000.
Funding of the 2013 Corporate Bonus Plan is based upon our achievement of a financial performance target that measures the first year value of all subscriptions purchased by new customers during 2013. To fund the 2013 Corporate Bonus Plan, we are required to achieve 80% of this target. Upon reaching the 80% level, we would fund 50% of the 2013 Corporate Bonus Plan pool. Funding of the pool reaches 100% if we achieve 100% of our performance target, and 200% if we achieve 130% of our performance target. Funding scales upward between these achievement levels and is capped at 200%.
Funding levels for the 2013 Corporate Bonus Plan may be adjusted in the event we exceed or do not meet a specified financial performance target that measures the annual value of all new renewals purchased by our customers in 2013. In the event we achieve 100% of this target, there would be no adjustment to funding levels under the 2013 Corporate Bonus Plan. From that level, bonus plan funding scales downward to 50% of funding levels and upward to a maximum of 125% of funding levels based upon our achievement against the performance target.
In addition, the 2013 Corporate Bonus Plan was designed to include an individual performance-based component, tailored to each officer, that applies to 40% of each named executive officer's target bonus opportunity, while 60% of the remaining target bonus opportunity continues to be exclusively tied to our overall financial performance as described above. With respect to this individual performance-based component, 40% of a named executive officer's annual target bonus opportunity may be adjusted in the event such officer exceeds or does not meet an individual performance target. In the event a named executive officer falls short or exceeds his or her performance target, 40% of such executive officer's target bonus would be modified from 0% to 200% on a sliding scale basis.
Payments under the 2013 Corporate Bonus Plan are structured on an annual basis with a mid-year partial payment of up to 35% of each named executive officer's total target bonus opportunity. This partial payment is based on a forecast of our achievement against our financial performance targets over an annualized basis, and will be deducted from any annual payment.
123
Outstanding Equity Awards at Fiscal Year-End
The following table provides information regarding equity awards held by our named executive officers at December 31, 2012.
| |
Option Awards | Stock Awards | ||||||||||||||||||||
|---|---|---|---|---|---|---|---|---|---|---|---|---|---|---|---|---|---|---|---|---|---|---|
| |
|
|
|
|
|
Number of Shares or Units of Stock that have Not Vested |
Market Value of Shares or Units of Stock that have Not Vested |
|||||||||||||||
| |
|
Number of Securities Underlying Unexercised Options | |
|
||||||||||||||||||
| |
Vesting Commencement Date |
Option Exercise Price |
Option Expiration Date |
|||||||||||||||||||
Name
|
Exercisable
|
Unexercisable
|
||||||||||||||||||||
Phillip M. Fernandez |
05/01/2013 | (1) | 700,000 | (2) | — | $ | 4.56 | 04/30/2022 | — | — | ||||||||||||
|
01/25/2012 | (1) | 128,469 | (2) | — | 2.38 | 01/24/2021 | — | — | |||||||||||||
|
05/21/2011 | (1) | 199,999 | (3) | 101,546 | 1.50 | 06/13/2020 | — | — | |||||||||||||
|
01/21/2009 | (4) | 160,000 | (2) | — | 0.22 | 01/20/2019 | — | — | |||||||||||||
Sanjiv P. Dholakia |
08/29/2013 |
(1) |
57,500 |
(2) |
— |
4.74 |
08/28/2022 |
— |
— |
|||||||||||||
|
04/17/2014 | (5) | 11,750 | (2) | — | 4.56 | 04/30/2022 | — | — | |||||||||||||
|
04/17/2012 | (6) | 34,568 | — | 5.44 | 02/27/2021 | — | — | ||||||||||||||
|
04/17/2012 | (6) | 14,069 | — | 4.90 | 06/23/2020 | — | — | ||||||||||||||
|
04/17/2013 | (7) | — | — | — | — | 69,718 | $ | 517,308 | (8) | ||||||||||||
Jason L. Holmes |
02/13/2013 |
(1) |
116,746 |
(9) |
70,754 |
4.24 |
03/01/2022 |
50,000 |
(10) |
$ |
371,000 |
(8) |
||||||||||
- (1)
- One-fourth
of the shares subject to the option vest on the vesting commencement date and one forty-eighth of the shares vest monthly thereafter,
subject to continued service to us.
- (2)
- The
option is subject to an early exercise provision and is immediately exercisable. Early-exercised options are subject to repurchase by us at the original
exercise price, which right lapses pursuant to the option's vesting schedule.
- (3)
- The
option is subject to an early exercise provision pursuant to which an additional 66,666 shares become exercisable on January 1, 2013 and an
additional 34,880 shares become exercisable on January 1, 2014.
- (4)
- One
forty-eighth of the shares subject to the option vested on the vesting commencement date and one forty-eighth of the shares vest monthly thereafter,
subject to continued service to us.
- (5)
- One
twenty-fourth of the shares subject to the option vest on the vesting commencement date and one twenty-fourth of the shares vest monthly thereafter,
subject to continued service to us.
- (6)
- The
option is fully vested and immediately exercisable. The option was formerly a Crowd Factory option prior to its acquisition by us in April 2012.
Effective upon such acquisition, each vested and outstanding Crowd Factory option was assumed by us and converted into an option purchase shares of our common stock.
- (7)
- Shares
are represented by restricted stock units pursuant to which 34,859 restricted stock units vest on each of April 17, 2013 and April 17,
2014, provided, however, that no shares underlying such restricted stock units shall vest until the earlier of our initial public offering or a Sale Event, subject to continued service to us. See
"Executive Compensation — Executive Employment Arrangements — Sanjiv P. Dholakia" for the meaning of Sale Event.
- (8)
- This
amount reflects the fair market value of our common stock of $7.42 per share as of December 31, 2012 multiplied by the amount shown in the
column for the Number of Shares of Units of Stock that have Not Vested.
- (9)
- The
option is subject to an early exercise provision pursuant to which an additional 23,584 shares become exercisable on January 1, 2013 and,
thereafter, 23,585 shares become exercisable on January 1, 2014 and January 1, 2015.
- (10)
- Shares acquired pursuant to an early exercise provision and are subject to a right of repurchase by us at the option exercise price. The right of repurchase lapses on the vesting commencement date.
Employee Benefit and Stock Plans
2013 Equity Incentive Plan
Our board of directors adopted, and our stockholders approved, a 2013 Equity Incentive Plan (2013 Plan). The 2013 Plan will be effective one business day prior to the effective date of the registration statement of which this prospectus forms a part, but is not expected to be utilized until
124
after the completion of this offering. Our 2013 Plan provides for the grant of incentive stock options, within the meaning of Section 422 of the Internal Revenue Code, to our employees and any parent and subsidiary corporations' employees, and for the grant of nonstatutory stock options, restricted stock, restricted stock units, stock appreciation rights, performance units and performance shares to our employees, directors and consultants and our parent and subsidiary corporations' employees and consultants.
Authorized Shares. A total of 2,952,130 shares of our common stock is reserved for issuance pursuant to the 2013 Plan, of which no awards are issued and outstanding. In addition, the shares reserved for issuance under our 2013 Plan also include (a) those shares reserved but unissued under our 2006 Stock Plan (2006 Plan), and (b) shares returned to our 2006 Plan as the result of expiration or termination of awards (provided that the maximum number of shares that may be added to the 2013 Plan pursuant to (a) and (b) is 9,119,341 shares). The number of shares available for issuance under the 2013 Plan will also include an annual increase on the first day of each fiscal year beginning in 2014, equal to the least of:
- •
- 3,250,000 shares;
- •
- 5% of the outstanding shares of common stock as of the last day of our immediately preceding fiscal year; or
- •
- such other amount as our board of directors may determine.
If an award expires or becomes unexercisable without having been exercised in full, is surrendered pursuant to an exchange program, or, with respect to restricted stock, restricted stock units, performance units or performance shares, is forfeited to or repurchased due to failure to vest, the unpurchased shares (or for awards other than stock options or stock appreciation rights, the forfeited or repurchased shares) will become available for future grant or sale under the 2013 Plan. With respect to stock appreciation rights, the net shares issued will cease to be available under the 2013 Plan and all remaining shares will remain available for future grant or sale under the 2013 Plan. Shares used to pay the exercise price of an award or satisfy the tax withholding obligations related to an award will become available for future grant or sale under the 2013 Plan. To the extent an award is paid out in cash rather than shares, such cash payment will not result in reducing the number of shares available for issuance under the 2013 Plan.
Plan Administration. Our board of directors or one or more committees appointed by our board of directors will administer the 2013 Plan. We anticipate that the compensation and leadership development committee of our board of directors will administer our 2013 Plan. In the case of awards intended to qualify as "performance-based compensation" within the meaning of Section 162(m) of the Internal Revenue Code, the committee will consist of two or more "outside directors" within the meaning of Section 162(m). In addition, if we determine it is desirable to qualify transactions under the 2013 Plan as exempt under Rule 16b-3 of the Securities Exchange Act of 1934, as amended (Rule 16b-3), such transactions will be structured to satisfy the requirements for exemption under Rule 16b-3. Subject to the provisions of our 2013 Plan, the administrator has the power to administer the plan, including but not limited to, the power to interpret the terms of the 2013 Plan and awards granted under it, to create, amend and revoke rules relating to the 2013 Plan, including creating sub-plans, and to determine the terms of the awards, including the exercise price, the number of shares subject to each such award, the exercisability of the awards, and the form of consideration, if any, payable upon exercise. The administrator also has the authority to amend existing awards to reduce or increase their exercise price, to allow participants the opportunity to transfer outstanding awards to a financial institution or other person or entity selected by the administrator, and to institute an exchange program by which outstanding awards may be surrendered in exchange for awards of the same type which may have a higher or lower exercise price or different terms, awards of a different type and/or cash.
125
Stock Options. Stock options may be granted under the 2013 Plan. The exercise price of options granted under our 2013 Plan must at least be equal to the fair market value of our common stock on the date of grant. The term of an incentive stock option may not exceed 10 years, except that with respect to any participant who owns more than 10% of the voting power of all classes of our outstanding stock, the term must not exceed 5 years and the exercise price must equal at least 110% of the fair market value on the grant date. The administrator will determine the methods of payment of the exercise price of an option, which may include cash, shares or other property acceptable to the administrator, as well as other types of consideration permitted by applicable law. After the termination of service of an employee, director or consultant, he or she may exercise his or her option for the period of time stated in his or her option agreement. Generally, if termination is due to death or disability, the option will remain exercisable for 12 months. In all other cases, the option will generally remain exercisable for three months following the termination of service. However, in no event may an option be exercised later than the expiration of its term. Subject to the provisions of our 2013 Plan, the administrator determines the other terms of options.
Stock Appreciation Rights. Stock appreciation rights may be granted under our 2013 Plan. Stock appreciation rights allow the recipient to receive the appreciation in the fair market value of our common stock between the exercise date and the date of grant. Stock appreciation rights may not have a term exceeding 10 years. After the termination of service of an employee, director or consultant, he or she may exercise his or her stock appreciation right for the period of time stated in his or her option agreement. However, in no event may a stock appreciation right be exercised later than the expiration of its term. Subject to the provisions of our 2013 Plan, the administrator determines the other terms of stock appreciation rights, including when such rights become exercisable and whether to pay any increased appreciation in cash or with shares of our common stock, or a combination thereof, except that the per share exercise price for the shares to be issued pursuant to the exercise of a stock appreciation right will be no less than 100% of the fair market value per share on the date of grant.
Restricted Stock. Restricted stock may be granted under our 2013 Plan. Restricted stock awards are grants of shares of our common stock that vest in accordance with terms and conditions established by the administrator. The administrator will determine the number of shares of restricted stock granted to any employee, director or consultant and, subject to the provisions of our 2013 Plan, will determine the terms and conditions of such awards. The administrator may impose whatever conditions to vesting it determines to be appropriate (for example, the administrator may set restrictions based on the achievement of specific performance goals or continued service to us); provided, however, that the administrator, in its sole discretion, may accelerate the time at which any restrictions will lapse or be removed. Recipients of restricted stock awards generally will have voting and dividend rights with respect to such shares upon grant without regard to vesting, unless the administrator provides otherwise. Shares of restricted stock that do not vest are subject to our right of repurchase or forfeiture.
Restricted Stock Units. Restricted stock units may be granted under our 2013 Plan. Restricted stock units are bookkeeping entries representing an amount equal to the fair market value of one share of our common stock. Subject to the provisions of our 2013 Plan, the administrator determines the terms and conditions of restricted stock units, including the vesting criteria (which may include accomplishing specified performance criteria or continued service to us) and the form and timing of payment. Notwithstanding the foregoing, the administrator, in its sole discretion, may accelerate the time at which any restrictions will lapse or be removed.
Performance Units and Performance Shares. Performance units and performance shares may be granted under our 2013 Plan. Performance units and performance shares are awards that will result in a payment to a participant only if performance goals established by the administrator are
126
achieved or the awards otherwise vest. The administrator will establish organizational or individual performance goals or other vesting criteria in its discretion, which, depending on the extent to which they are met, will determine the number and/or the value of performance units and performance shares to be paid out to participants. After the grant of a performance unit or performance share, the administrator, in its sole discretion, may reduce or waive any performance criteria or other vesting provisions for such performance units or performance shares. Performance units shall have an initial dollar value established by the administrator prior to the grant date. Performance shares shall have an initial value equal to the fair market value of our common stock on the grant date. The administrator, in its sole discretion, may pay earned performance units or performance shares in the form of cash, in shares or in some combination thereof.
Outside Directors. Our 2013 Plan provides that all non-employee directors will be eligible to receive all types of awards (except for incentive stock options) under the 2013 Plan. In connection with this offering, we adopted a formal policy pursuant to which our non-employee directors will be eligible to receive equity awards under the 2013 Plan. Our 2013 Plan provides that in any given year, a non-employee director will not receive (i) cash-settled awards having a grant date fair value greater than $500,000, increased to $1,000,000 in connection with her or her initial service; and (ii) stock-settled awards having a grant date fair value greater than $500,000, increased to $1,000,000 in connection with her or her initial service, in each case, as determined under generally accepted accounting procedures.
Non-Transferability of Awards. Unless the administrator provides otherwise, our 2013 Plan generally does not allow for the transfer of awards and only the recipient of an award may exercise an award during his or her lifetime.
Certain Adjustments. In the event of certain changes in our capitalization, to prevent diminution or enlargement of the benefits or potential benefits available under the 2013 Plan, the administrator will adjust the number and class of shares that may be delivered under the Plan and/or the number, class, and price of shares covered by each outstanding award, and the numerical share limits set forth in the 2013 Plan. In the event of our proposed liquidation or dissolution, the administrator will notify participants as soon as practicable and all awards will terminate immediately prior to the consummation of such proposed transaction.
Merger or Change in Control. Our 2013 Plan provides that in the event of a merger or change in control, as defined under the 2013 Plan, each outstanding award will be treated as the administrator determines, except that if a successor corporation or its parent or subsidiary does not assume or substitute an equivalent award for any outstanding award, then such award will fully vest, all restrictions on such award will lapse, all performance goals or other vesting criteria applicable to such award will be deemed achieved at 100% of target levels and such award will become fully exercisable, if applicable, for a specified period prior to the transaction. The award will then terminate upon the expiration of the specified period of time. If the service of an outside director is terminated on or following a change of control, other than pursuant to a voluntary resignation, his or her options, restricted stock units and stock appreciation rights, if any, will vest fully and become immediately exercisable, all restrictions on his or her restricted stock will lapse, and all performance goals or other vesting requirements for his or her performance shares and units will be deemed achieved at 100% of target levels, and all other terms and conditions met.
Amendment, Termination. The administrator has the authority to amend, suspend or terminate the 2013 Plan provided such action does not impair the existing rights of any participant. Our 2013 Plan will automatically terminate in 2023, unless we terminate it sooner.
127
2006 Stock Plan, as amended
Our board of directors and our stockholders adopted our 2006 Stock Plan (2006 Plan) in October 2006. Our 2006 Plan was most recently amended in May 2013.
Authorized Shares. Our 2006 Plan will be terminated in connection with this offering, and accordingly, no shares will be available for issuance under this plan. Our 2006 Plan will continue to govern outstanding awards granted thereunder. Our 2006 Plan provided for the grant of incentive stock options and nonqualified stock options. As of March 31, 2013, options to purchase 7,982,829 shares of our common stock and 345,614 restricted stock units remained outstanding under our 2006 Plan.
Plan Administration. Our board of directors or a committee thereof appointed by our board of directors has the authority to administer the 2006 Plan. Following this offering, the compensation and leadership development committee will administer the 2006 Plan. Subject to the provisions of our 2006 Plan, the administrator has the full authority and discretion to take any actions it deems necessary or advisable for the administration of the 2006 Plan. All decisions, interpretations and other actions of the administrator will be final and binding on all participants. The administrator will have the full authority to institute and determine the terms and conditions of an exchange program.
Options. Stock options were available for grant under our 2006 Plan. The exercise price per share of all options must equal at least 100% of the fair market value per share of our common stock on the date of grant. The term of an option may not exceed 10 years. The administrator will determine the methods of payment of the exercise price of an option, which may include cash or cash equivalents or other consideration acceptable to the administrator in its discretion. After the termination of service of an employee, director, or consultant, the participant may generally exercise his or her options, to the extent vested as of such date of termination, for generally three months after termination. If termination is due to disability, the option will generally remain exercisable, to the extent vested as of such date of termination, for at least six months. If termination is due to death, the option will generally remain exercisable, to the extent vested as of such date of termination, for at least 12 months. However, in no event may an option be exercised later than the expiration of its term.
Restricted Stock and Restricted Stock Units. Restricted stock and restricted stock units were available for grant under our 2006 Plan. Restricted stock awards are grants of shares of our common stock that are subject to various restrictions, including restrictions on transferability and forfeiture provisions. Restricted stock units are phantom stock units that may be settled in cash or shares upon vesting. Shares of restricted stock and restricted stock units will vest in accordance with terms and conditions established by the administrator.
Adjustments. In the event of certain changes in our capitalization, the number of shares covered by outstanding options or restricted stock units, and the exercise price of outstanding options will be proportionately adjusted.
Merger or Change in Control. Our 2006 Plan provides that, in the event of a merger or consolidation, each award will be subject to the agreement of merger or consolidation. Such agreement will provide for one or more of the following: the continuation, assumption or substitution of awards, full acceleration of awards, or the cancellation of outstanding awards in exchange for a cash payment.
Amendment; Termination. Our board of directors may amend our 2006 Plan at any time, provided that such amendment does not impair the rights under outstanding awards without the award holder's written consent. Upon the effective date of the registration statement of which this
128
prospectus forms a part, our 2006 Plan will be terminated and no further awards will be granted thereunder. All outstanding awards will continue to be governed by their existing terms.
2013 Employee Stock Purchase Plan
Our board of directors adopted, and our stockholders approved, a 2013 Employee Stock Purchase Plan (ESPP). The ESPP became effective upon adoption.
Authorized Shares. A total of 738,032 shares of our common stock is available for sale under our ESPP. In addition, our ESPP provides for annual increases in the number of shares available for issuance under the ESPP on the first day of each fiscal year beginning in fiscal 2014, equal to the lesser of:
- •
- 1% of the outstanding shares of our common stock on the first day of such fiscal year;
- •
- 650,000 shares; or
- •
- such other amount as may be determined by our board of directors.
Plan Administration. Our board of directors or a committee appointed by our board of directors administers the ESPP. We anticipate that our compensation and leadership development committee will administer the ESPP. The administrator has authority to administer the plan, including but not limited to, full and exclusive authority to interpret the terms of the ESPP, determining eligibility to participate subject to the conditions of our ESPP as described below, and to establish procedures for plan administration necessary for the administration of the Plan, including creating sub-plans.
Eligibility. Generally, all of our employees are eligible to participate if they are employed by us, or any participating subsidiary, for at least 20 hours per week and more than five months in any calendar year. However, an employee may not be granted an option to purchase stock under the ESPP if such employee:
- •
- immediately after the grant would own stock possessing 5% or more of the total combined voting power or value of all
classes of our capital stock; or
- •
- hold rights to purchase stock under all of our employee stock purchase plans that accrue at a rate that exceeds $25,000 worth of stock for each calendar year in which the option is outstanding.
Offering Periods. Our ESPP is intended to qualify under Section 423 of the Code, and provides for six-month offering periods. The offering periods generally start on the first trading day on or after February 15th and August 15th of each year, except that the first offering period will commence on the first trading day following the effective date of the registration statement of which this prospectus forms a part. The administrator may, in its discretion, modify the terms of future offering periods.
Payroll Deductions. Our ESPP permits participants to purchase common stock through payroll deductions of up to 15% of their eligible compensation, which includes a participant's base straight time gross earnings, commissions, overtime and shift premium, but exclusive of payments for incentive compensation, bonuses and other compensation. A participant may purchase a maximum of 1,250 shares during an offering period.
Exercise of Option. Amounts deducted and accumulated by the participant are used to purchase shares of our common stock at the end of each six-month offering period. The purchase price of the shares will be 85% of the lower of the fair market value of our common stock on the first trading day of each offering period or on the exercise date. Participants may end their
129
participation at any time during an offering period, and will be paid their accrued payroll deductions that have not yet been used to purchase shares of common stock. Participation ends automatically upon termination of employment with us.
Non-Transferability. A participant may not transfer rights granted under the ESPP other than by will, the laws of descent and distribution, or as otherwise provided under the ESPP.
Merger or Change in Control. In the event of our merger or change in control, as defined under the ESPP, a successor corporation may assume or substitute for each outstanding option. If the successor corporation refuses to assume or substitute for the option, the offering period then in progress will be shortened, and a new exercise date will be set. The administrator will notify each participant that the exercise date has been changed and that the participant's option will be exercised automatically on the new exercise date unless prior to such date the participant has withdrawn from the offering period.
Amendment, Termination. Our ESPP will automatically terminate in 2033, unless we terminate it sooner. The administrator has the authority to amend, suspend or terminate our ESPP, except that, subject to certain exceptions described in the ESPP, no such action may adversely affect any outstanding rights to purchase stock under our ESPP.
401(k) Plan
We maintain a tax-qualified retirement plan that provides eligible U.S. employees with an opportunity to save for retirement on a tax advantaged basis. Eligible employees are able to defer eligible compensation subject to applicable annual Code limits. We have the ability to make discretionary contributions to the 401(k) plan but have not done so to date. Employees' pre-tax contributions are allocated to each participant's individual account and are then invested in selected investment alternatives according to the participants' directions. Employees are immediately and fully vested in their contributions. The 401(k) plan is intended to be qualified under Section 401(a) of the Code with the 401(k) plan's related trust intended to be tax exempt under Section 501(a) of the Code. As a tax-qualified retirement plan, contributions to the 401(k) plan and earnings on those contributions are not taxable to the employees until distributed from the 401(k) plan.
Limitation on Liability and Indemnification Matters
Our amended and restated certificate of incorporation and amended and restated bylaws, each to be effective upon the completion of this offering, will provide that we will indemnify our directors and officers, and may indemnify our employees and other agents, to the fullest extent permitted by Delaware law. Delaware law prohibits our amended and restated certificate of incorporation from limiting the liability of our directors for the following:
- •
- any breach of the director's duty of loyalty to us or to our stockholders;
- •
- acts or omissions not in good faith or that involve intentional misconduct or a knowing violation of law;
- •
- unlawful payment of dividends or unlawful stock repurchases or redemptions; and
- •
- any transaction from which the director derived an improper personal benefit.
If Delaware law is amended to authorize corporate action further eliminating or limiting the personal liability of a director, then the liability of our directors will be eliminated or limited to the fullest extent permitted by Delaware law, as so amended. Our amended and restated certificate of incorporation does not eliminate a director's duty of care and, in appropriate circumstances, equitable remedies, such as injunctive or other forms of non-monetary relief, remain available under
130
Delaware law. This provision also does not affect a director's responsibilities under any other laws, such as the federal securities laws or other state or federal laws. Under our amended and restated bylaws, we will also be empowered to purchase insurance on behalf of any person whom we are required or permitted to indemnify.
In addition to the indemnification required in our amended and restated certificate of incorporation and amended and restated bylaws, we have entered into an indemnification agreement with each member of our board of directors and each of our officers. These agreements provide for the indemnification of our directors, officers and some employees for certain expenses and liabilities incurred in connection with any action, suit, proceeding or alternative dispute resolution mechanism, or hearing, inquiry or investigation that may lead to the foregoing, to which they are a party, or are threatened to be made a party, by reason of the fact that they are or were a director, officer, employee, agent or fiduciary of our company, or any of our subsidiaries, by reason of any action or inaction by them while serving as an officer, director, agent or fiduciary, or by reason of the fact that they were serving at our request as a director, officer, employee, agent or fiduciary of another entity. In the case of an action or proceeding by or in the right of our company or any of our subsidiaries, no indemnification will be provided for any claim where a court determines that the indemnified party is prohibited from receiving indemnification. We believe that these charter and bylaw provisions and indemnification agreements are necessary to attract and retain qualified persons as directors and officers.
The limitation of liability and indemnification provisions in our amended and restated certificate of incorporation and amended and restated bylaws may discourage stockholders from bringing a lawsuit against directors for breach of their fiduciary duties. They may also reduce the likelihood of derivative litigation against directors and officers, even though an action, if successful, might benefit us and our stockholders. Moreover, a stockholder's investment may be harmed to the extent we pay the costs of settlement and damage awards against directors and officers pursuant to these indemnification provisions. Insofar as indemnification for liabilities arising under the Securities Act may be permitted to our directors, officers and controlling persons pursuant to the foregoing provisions, or otherwise, we have been advised that, in the opinion of the SEC, such indemnification is against public policy as expressed in the Securities Act, and is, therefore, unenforceable. There is no pending litigation or proceeding naming any of our directors or officers as to which indemnification is being sought, nor are we aware of any pending or threatened litigation that may result in claims for indemnification by any director or officer.
131
CERTAIN RELATIONSHIPS, RELATED PARTY AND OTHER TRANSACTIONS
In addition to the director and executive officer compensation arrangements and indemnification arrangements discussed above in the sections titled "Management" and "Executive Compensation" and the registration rights described in the section titled "Description of Capital Stock — Registration Rights", the following is a description of each transaction since January 1, 2010 and each currently proposed transaction in which:
- •
- we have been or are to be a participant;
- •
- the amount involved exceeded or exceeds $120,000; and
- •
- any of our directors, executive officers or holders of more than 5% of our capital stock, or any immediate family member of or person sharing the household with any of these individuals, had or will have a direct or indirect material interest.
Series D Preferred Stock Financing
In April 2010, we sold an aggregate of 2,110,300 shares of Series D preferred stock at a per share purchase price of $4.73866 pursuant to a stock purchase agreement. Purchasers of the Series D preferred stock include venture capital funds that hold 5% or more of our capital stock and were represented on our board of directors. The following table summarizes purchases of Series D preferred stock by such investors:
Name of Stockholder
|
Marketo Director(s)
|
Number of Series D Shares |
Total Purchase Price |
||||||
|---|---|---|---|---|---|---|---|---|---|
Mayfield XIII, a Cayman Islands Exempted Limited Partnership |
Robert T. Vasan(1) | 1,266,181 | $ | 6,000,001 | |||||
InterWest Partners IX, L.P. |
Bruce A. Cleveland(2); Douglas A. Pepper |
570,977 | 2,705,666 | ||||||
Funds affiliated with Storm Ventures(3) |
Tae Hea Nahm | 273,142 | 1,294,327 | ||||||
- (1)
- Mr.
Vasan resigned as a member of our board of directors in March 2013.
- (2)
- Mr. Cleveland
resigned as a member of our board of directors in May 2012.
- (3)
- Storm Ventures affiliates holding our securities whose shares are aggregated for purposes of reporting share ownership information include Storm Ventures Fund III, L.P., Storm Ventures Affiliates Fund III, L.P. and Storm Ventures Principals Fund III, L.L.C.
Series E Preferred Stock Financing
In November 2010, we sold an aggregate of 3,755,658 shares of Series E preferred stock at a per share purchase price of $6.65662 pursuant to a stock purchase agreement. Purchasers of the Series E preferred stock include venture capital funds that hold 5% or more of our capital stock and
132
were represented on our board of directors. The following table summarizes purchases of Series E preferred stock by such investors:
Name of Stockholder
|
Marketo Director(s)
|
Number of Series E Shares |
Total Purchase Price |
||||||
|---|---|---|---|---|---|---|---|---|---|
Funds affiliated with Institutional Venture Partners(1) |
Norman A. Fogelsong(2) | 3,004,528 | $ | 20,000,001 | |||||
Mayfield XIII, a Cayman Islands Exempted Limited Partnership |
Robert T. Vasan(3) | 167,594 | 1,115,610 | ||||||
InterWest Partners IX, L.P. |
Bruce A. Cleveland(4); Douglas A. Pepper |
394,714 | 2,627,461 | ||||||
Funds affiliated with Storm Ventures(5) |
Tae Hea Nahm | 188,822 | 1,256,916 | ||||||
- (1)
- Institutional
Venture Partners affiliates holding our securities whose shares are aggregated for purposes of reporting share ownership information include
Institutional Venture Partners XII, L.P. and Institutional Venture Partners XIII, L.P.
- (2)
- Mr.
Fogelsong resigned as a member of our board of directors in March 2013.
- (3)
- Mr. Vasan
resigned as a member of our board of directors in March 2013.
- (4)
- Mr. Cleveland
resigned as a member of our board of directors in May 2012.
- (5)
- Storm Ventures affiliates holding our securities whose shares are aggregated for purposes of reporting share ownership information include Storm Ventures Fund III, L.P., Storm Ventures Affiliates Fund III, L.P. and Storm Ventures Principals Fund III, L.L.C.
Series F Preferred Stock Financing
In November 2011, we sold an aggregate of 3,787,876 shares of Series F preferred stock at a per share purchase price of $13.20 pursuant to a stock purchase agreement. Purchasers of the Series F preferred stock include venture capital funds that hold 5% or more of our capital stock and were represented on our board of directors. The following table summarizes purchases of Series F preferred stock by such investors:
Name of Stockholder
|
Marketo Director(s)
|
Number of Series F Shares |
Total Purchase Price |
||||||
|---|---|---|---|---|---|---|---|---|---|
Funds affiliated with Battery Ventures(1) |
Neeraj Agrawal | 2,121,212 | $ | 27,999,998 | |||||
Funds affiliated with Institutional Venture Partners(2) |
Norman A. Fogelsong(3) | 757,576 | 10,000,003 | ||||||
Mayfield XIII, a Cayman Islands Exempted Limited Partnership |
Robert T. Vasan(4) | 106,060 | 1,399,992 | ||||||
InterWest Partners IX, L.P. |
Bruce A. Cleveland(5); Douglas A. Pepper |
227,272 | 2,999,990 | ||||||
Funds affiliated with Storm Ventures(6) |
Tae Hea Nahm | 326,702 | 4,312,466 | ||||||
- (1)
- Battery Ventures affiliates holding our securities whose shares are aggregated for purposes of reporting share ownership information include Battery Ventures IX, L.P. and Battery Investment Partners IX, LLC.
133
- (2)
- Institutional
Venture Partners affiliates holding our securities whose shares are aggregated for purposes of reporting share ownership information include
Institutional Venture Partners XII, L.P. and Institutional Venture Partners XIII, L.P.
- (3)
- Mr.
Fogelsong resigned as a member of our board of directors in March 2013.
- (4)
- Mr. Vasan
resigned as a member of our board of directors in March 2013.
- (5)
- Mr. Cleveland
resigned as a member of our board of directors in May 2012.
- (6)
- Storm Ventures affiliates holding our securities whose shares are aggregated for purposes of reporting share ownership information include Storm Ventures Fund III, L.P., Storm Ventures Affiliates Fund III, L.P. and Storm Ventures Principals Fund III, L.L.C.
Concurrent Private Placement
In May 2013, we entered into a stock purchase agreement with funds affiliated with Battery Ventures, which currently beneficially owns approximately 2.1 million shares of our common stock, pursuant to which such funds will purchase 500,000 shares of our common stock at a price per share equal to the initial public offering price in a private placement to close immediately subsequent to the closing of this offering. We will receive the full proceeds and will not pay any underwriting discounts or commissions with respect to the shares that are sold in the private placement. The sale of these shares to Battery Ventures will not be registered in this offering and will be subject to a lock-up of 180 days.
In April 2012, we acquired Crowd Factory. The acquisition of Crowd Factory was effected through the merger of our wholly-owned merger subsidiary with and into Crowd Factory, with Crowd Factory continuing as the surviving corporation and a wholly-owned subsidiary of us. In connection with this acquisition, certain holders of outstanding capital stock of Crowd Factory received an aggregate of 842,458 shares of our Series G preferred stock as consideration for certain of their shares of capital stock of Crowd Factory. Recipients of our Series G preferred stock pursuant to this acquisition include venture capital funds that hold 5% or more of our capital stock and were represented on our board of directors. The following table summarizes the issuance of our Series G preferred stock to such recipients:
Name of Stockholder
|
Marketo Director(s)
|
Number of Series G Shares |
Aggregate Value of Series G Shares |
||||||
|---|---|---|---|---|---|---|---|---|---|
Funds affiliated with Storm Ventures(1) |
Tae Hea Nahm | 208,142 | $ | 3,038,873 | |||||
- (1)
- Storm Ventures affiliates holding our securities whose shares are aggregated for purposes of reporting share ownership information include Storm Ventures Fund III, L.P., Storm Ventures Affiliates Fund III, L.P. and Storm Ventures Principals Fund III, L.L.C.
In addition, effective upon our acquisition of Crowd Factory, we assumed each vested and outstanding Crowd Factory stock option and converted such stock options into options to purchase shares of our common stock under our 2006 Stock Plan. Recipients of such stock options include Sanjiv P. Dholakia, our Chief Marketing Officer. For the terms of Mr. Dholakia's stock options, see "Executive Compensation — Outstanding Equity Awards at Fiscal Year-End". We also entered into an offer letter with Mr. Dholakia in connection with his agreement to join us effective upon the closing of this acquisition. For a description of the terms of Mr. Dholakia's offer letter, see "Executive Compensation — Executive Employment Arrangements — Sanjiv P. Dholakia".
134
All shares of our preferred stock, including shares of our series D, E, F and G preferred stock issued in connection with the transactions described under "Private Placements" above, are convertible into shares of our common stock at a 1:1 ratio. The conversion of all outstanding shares of our preferred stock will result in the issuance of an aggregate of 25,876,142 shares of our common stock.
Transactions with Directors and Their Affiliates
A member of our board of directors, Wesley R. Wasson, is the current Senior Vice President of Strategy of Citrix Systems, a customer of ours. Our revenue from Citrix was $0, $0.3 million and $0.3 million in 2010, 2011 and 2012, respectively.
We entered into an amended and restated investors' rights agreement with the holders of our preferred stock, including entities affiliated with Battery Ventures, Institutional Venture Partners, InterWest Partners, Mayfield Fund and Storm Ventures, which each hold 5% or more of our capital stock and of which certain of our directors are affiliated. Such agreement provides, among other things, for certain rights relating to the registration of their shares of common stock, including those issued upon conversion of their preferred stock and those shares of common stock to be acquired by Battery Ventures upon the closing of the concurrent private placement, including the right to demand that we file a registration statement or request that their shares be covered by a registration statement that we are otherwise filing. For a more detailed description of these registration rights, see "Description of Capital Stock — Registration Rights".
Policies and Procedures for Related Party Transactions
Following the completion of this offering, our audit committee will have the primary responsibility for reviewing and approving or disapproving "related party transactions", which are transactions between us and related persons in which the aggregate amount involved exceeds or may be expected to exceed $120,000 and in which a related person has or will have a direct or indirect material interest. For purposes of this policy, a related person will be defined as a director, executive officer, nominee for director, or greater than 5% beneficial owner of our common stock, in each case since the beginning of the most recently completed year, and their immediate family members. Our audit committee charter provides that the audit committee shall review and approve or disapprove any related party transactions.
135
PRINCIPAL AND SELLING STOCKHOLDERS
The following table sets forth information regarding beneficial ownership of our common stock as of March 31, 2013, as adjusted to reflect the shares of common stock to be issued and sold by us in this offering and the concurrent private placement, by:
- •
- each person or group of affiliated persons known by us to be the beneficial owner of more than 5% of our common stock;
- •
- each of our named executive officers;
- •
- each of our directors;
- •
- all executive officers and directors as a group; and
- •
- all selling stockholders, consisting of the entities and individuals shown as having shares listed in the column "Shares Being Offered".
We have determined beneficial ownership in accordance with the rules of the SEC and the information is not necessarily indicative of beneficial ownership for any other purpose. Unless otherwise indicated below, to our knowledge, the persons and entities named in the table have sole voting and sole investment power with respect to all shares that they beneficially own, subject to community property laws where applicable. In computing the number of shares of our common stock beneficially owned by a person and the percentage ownership of that person, we deemed outstanding shares of our common stock subject to options or restricted stock units held by that person that are currently exercisable or exercisable within 60 days of March 31, 2013. We did not deem these shares outstanding, however, for the purpose of computing the percentage ownership of any other person.
We have based percentage ownership of our common stock prior to this offering and the concurrent private placement on 29,312,846 shares of our common stock outstanding as of March 31, 2013, which includes 25,876,142 shares of common stock resulting from the automatic conversion of all outstanding shares of our convertible preferred stock upon the completion of this offering, as if this conversion had occurred as of March 31, 2013. Percentage ownership of our common stock after this offering assumes (i) our sale of 5,750,000 shares of common stock in this offering, (ii) our sale of 500,000 shares of common stock to Battery Ventures upon the closing of the concurrent private placement and (iii) 221,303 shares to be sold in this offering by certain selling stockholders upon the exercise of options and the vesting and settlement of restricted stock units.
136
Unless otherwise indicated, the address of each beneficial owner listed on the table below is c/o Marketo, Inc., 901 Mariners Island Blvd., Suite 200, San Mateo, California 94404.
| |
Shares Beneficially Owned Prior to the Offering and the Concurrent Private Placement |
Shares Being Offered |
Shares Beneficially Owned After the Offering and the Concurrent Private Placement |
|||||||||||||
|---|---|---|---|---|---|---|---|---|---|---|---|---|---|---|---|---|
Name of Beneficial Owner
|
Shares
|
Percentage
|
Shares
|
Shares
|
Percentage
|
|||||||||||
5% Stockholders: |
||||||||||||||||
Entities affiliated with InterWest Partners(1) |
9,747,191 | 33.3 | % | — | 9,747,191 | 27.2 | % | |||||||||
Entities affiliated with Storm Ventures(2) |
5,088,956 | 17.4 | — | 5,088,956 | 14.2 | |||||||||||
Mayfield XIII, a Cayman Islands Exempted Limited Partnership(3) |
4,148,181 | 14.2 | — | 4,148,181 | 11.6 | |||||||||||
Entities affiliated with Institutional Venture |
3,762,104 | 12.8 | — | 3,762,104 | 10.5 | |||||||||||
Entities affiliated with Battery Ventures(5) |
2,121,212 | 7.2 | — | 2,621,212 | 7.3 | |||||||||||
Phillip M. Fernandez(6) |
2,361,128 | 7.6 | 90,000 | 2,271,128 | 6.1 | |||||||||||
Named Executive Officers and Directors: |
||||||||||||||||
Phillip M. Fernandez(6) |
2,361,128 | 7.6 | 90,000 | 2,271,128 | 6.1 | |||||||||||
Sanjiv P. Dholakia(7) |
192,887 | * | 21,600 | 206,146 | * | |||||||||||
Jason L. Holmes(8) |
250,330 | * | — | 250,330 | * | |||||||||||
Neeraj Agrawal(9) |
2,121,212 | 7.2 | — | 2,621,212 | 7.3 | |||||||||||
Susan L. Bostrom(10) |
90,000 | * | — | 90,000 | * | |||||||||||
Tae Hea Nahm(11) |
5,088,956 | 17.4 | — | 5,088,956 | 14.2 | |||||||||||
Douglas A. Pepper(12) |
9,747,191 | 33.3 | — | 9,747,191 | 27.2 | |||||||||||
Roger S. Siboni(13) |
127,000 | * | 5,700 | 121,300 | * | |||||||||||
Wesley R. Wasson(14) |
117,600 | * | — | 117,600 | * | |||||||||||
All executive officers and directors as a group (13 persons)(15) |
21,286,392 | 65.1 | 126,300 | (16) | 21,694,951 | 55.5 | ||||||||||
Other Selling Stockholders: |
||||||||||||||||
Jonathan Miller(17) |
527,871 | 1.8 | 46,065 | 481,806 | 1.3 | |||||||||||
Paul Albright(18) |
321,109 | 1.1 | 32,110 | 288,999 | * | |||||||||||
Nick Bonfiglio(19) |
190,824 | * | 7,500 | 183,324 | * | |||||||||||
Glen Lipka(20) |
129,394 | * | 5,220 | 124,174 | * | |||||||||||
George Jaquette and Emily Breuner Jaquette |
87,050 | * | 8,705 | 78,345 | * | |||||||||||
Shaun Klopfenstein(21) |
70,542 | * | 13,062 | 83,605 | * | |||||||||||
Chetan Kadam(22) |
61,500 | * | 1,500 | 60,000 | * | |||||||||||
Alexander Mouldovan(23) |
61,485 | * | 16,855 | 70,755 | * | |||||||||||
Jeffrey A. McCarthy and Kelly A. Cushner |
58,458 | * | 5,000 | 53,458 | * | |||||||||||
Ronald Barale and Maroleine M. Barale |
53,217 | * | 5,321 | 47,896 | * | |||||||||||
Amy Guarino(24) |
52,500 | * | 3,750 | 48,750 | * | |||||||||||
David Cain(25) |
49,250 | * | 9,556 | 57,069 | * | |||||||||||
All other selling stockholders(26) |
248,037 | * | 28,565 | 246,222 | * | |||||||||||
- (*)
- Represents
beneficial ownership of less than 1%.
- (1)
- Consists
of 9,747,191 shares held of record by InterWest Partners IX, L.P. (IW9). InterWest Management Partners IX, LLC (IMP9) is the
general partner of IW9 and has sole voting and investment control over the shares held by IW9. Philip T. Gianos, W. Stephen Holmes, Gilbert H. Kliman and Arnold L. Oronsky are the managing
directors of IMP9. Bruce A. Cleveland, Nina Kjellson, Khaled A. Nasr and Douglas A. Pepper are the venture members of IMP9. Each of the managing directors and venture members share
voting and investment control with respect to the shares held by IW9. The address for these entities is c/o InterWest Partners, 2710 Sand Hill Road, Suite 200, Menlo Park, California 94025.
- (2)
- Consists
of (i) 4,687,359 shares held of record by Storm Ventures Fund III, L.P. (SV III), (ii) 256,389 shares held of record by Storm
Ventures Affiliates Fund III, L.P. (SVA III); and (iii) 145,208 shares held of record by Storm Ventures Principals Fund III, L.L.C. (SVP III). Storm Venture Associates III, L.L.C.
(SVA LLC) is the general partner of SV III and SVA III and the managing member of SVP III. Ryan Floyd, M. Alex Mendez, Tae Hea Nahm and Sanjay Subhedar as the managing members of SVA LLC
share voting and investment power with respect to the shares held by SV III, SVA III and SVP III. The address for each of these entities is c/o Storm Ventures, 2440 Sand Hill Road,
Suite 301, Menlo Park, California 94025.
- (3)
- Mayfield XIII, a Cayman Islands Exempted Limited Partnership (MF XIII) currently owns an aggregate of 4,148,181 shares of Preferred Stock of the Company. Mayfield XIII Management (EGP), L.P., a Cayman Islands Exempted Limited Partnership (MF XIII EGP), is the general partner of MF XIII. Mayfield XIII Management (UGP), Ltd., a Cayman Islands Exempted Company (MF XIII UGP), is the general partner of MF XIII EGP. MF XIII UGP is managed by a three person board of directors, which has the power to vote or dispose of the shares held of record by MF XIII. All board action relating to the voting or disposition of the shares held of record by MF XIII requires approval of a majority of the
137
board. James T. Beck, Navin Chaddha, and Robert T. Vasan, are the directors of MF XIII UGP. The address for each of these entities is c/o Mayfield Fund, 2800 Sand Hill Road, Suite 250, Menlo Park, California 94025.
- (4)
- Consists
of (i) 1,881,052 shares held of record by Institutional Venture Partners XII, L.P. (IVP XII) and (ii) 1,881,052 shares held of
record by Institutional Venture Partners XIII, L.P. (IVP XIII). Institutional Venture Management XII LLC (IVM XII) is the general partner of IVP XII and Institutional Venture Management
XIII LLC (IVM XIII) is the general partner of IVP XIII. Todd C. Chaffee, Norman A. Fogelsong, Stephen J. Harrick, J. Sanford Miller and Dennis B. Phelps, as the managing directors of IVM
XII and IVM XIII have shared voting and dispositive power with respect to the shares held by IVP XII and IVP XIII. The address for each of these entities is c/o Institutional Venture Partners, 3000
Sand Hill Road, Building 2, Suite 250, Menlo Park, California 94025.
- (5)
- Consists
of (i) 2,100,212 shares held of record by Battery Ventures IX, L.P. (Battery Ventures IX) and (ii) 21,000 shares held
of record by Battery Ventures Investment Partners IX, LLC (BIP IX). Battery Partners IX, LLC (BPIX) is the sole general partner of Battery Ventures IX and the sole manager of BIP IX.
BPIX's investment adviser is Battery Management Corp. (together with Battery Partners IX, LLC, the "Battery Companies"). Neeraj Agrawal, Michael M. Brown, Thomas J. Crotty, Jesse
Feldman, Richard D. Frisbie, Kenneth P. Lawler, Brian O'Malley, R. David Tabors, Scott R. Tobin and Roger H. Lee are the managing members and officers of the Battery
Companies and share voting and dispositive power with respect to the shares held by the Battery Ventures IX and BIP IX. The address for each of these entities is c/o Battery Ventures, 930 Winter
Street, Suite 2500, Waltham, Massachusetts 02451. Shares beneficially owned after this offering and the concurrent private placement reflect the purchase of 495,050 shares by Battery Ventures
IX and 4,950 shares by BIP IX in the concurrent private placement which is expected to close immediately subsequent to the closing of this offering. For a discussion of the material terms of the
concurrent private placement, see the section of this prospectus titled "Certain Relationships, Related Party and Other Transactions — Concurrent Private Placement".
- (6)
- Consists
of (i) 730,995 shares held of record by the Phillip M. Fernandez Living Trust dated August 4, 2010 for which Mr. Fernandez
serves as trustee; and (ii) 1,630,133 shares exercisable within 60 days of March 31, 2013, 636,099 of which are fully vested.
- (7)
- Consists
of 192,887 shares exercisable within 60 days of March 31, 2013, 48,637 of which are fully vested. Mr. Dholakia also holds
34,859 vested restricted stock units pursuant to which the underlying shares become issuable upon the closing of our initial public offering.
- (8)
- Consists
of (i) 50,000 shares held of record by the Jason L. Holmes Living Trust dated November 22, 2002 for which Mr. Holmes
serves as trustee; and (ii) 200,330 shares exercisable within 60 days of March 31, 2013, 24,219 of which are fully vested.
- (9)
- Consists
of the shares listed in footnote (5) above, which are held by entities affiliated with Battery Ventures.
- (10)
- Consists
of 90,000 shares exercisable within 60 days of March 31, 2013, 30,000 of which are fully vested.
- (11)
- Consists
of the shares listed in footnote (2) above, which are held by entities affiliated with Storm Ventures.
- (12)
- Consists
of the shares listed in footnote (1) above, which are held by entities affiliated with InterWest Partners.
- (13)
- Consists
of 127,000 shares exercisable within 60 days of March 31, 2013, 59,499 of which are fully vested.
- (14)
- Consists
of 117,600 shares exercisable within 60 days of March 31, 2013, 94,266 of which are fully vested.
- (15)
- Consists
of (i) 17,880,629 shares beneficially owned by our current directors and officers; and (ii) 3,405,763 shares subject to options
exercisable within 60 days of March 31, 2013, of which 1,229,730 shares are fully vested.
- (16)
- Includes
9,000 shares beneficially owned by William B. Binch, our Senior Vice President, Sales. Before giving effect to this offering, Mr. Binch
holds 112,275 shares and 183,145 options exercisable within 60 days of March 31, 2013, 49,960 of which are fully vested.
- (17)
- Consists
of (i) 409,787 shares held of record by The Miller Family Trust dated July 12, 2011 for which Mr. Miller serves as a trustee;
and (ii) 118,084 shares exercisable within 60 days of March 31, 2013, 52,057 of which are fully vested.
- (18)
- Consists
of 321,109 shares exercisable within 60 days of March 31, 2013, all of which are fully vested.
- (19)
- Consists
of 190,824 shares exercisable within 60 days of March 31, 2013, 120,618 of which are fully vested.
- (20)
- Consists
of (i) 19,394 shares beneficially owned by Mr. Lipka; and (ii) 110,000 shares exercisable within 60 days of
March 31, 2013, 34,062 of which are fully vested.
- (21)
- Consists
of (i) 29,478 shares held of record by Mr. Klopfenstein; and (ii) 41,064 shares exercisable within 60 days of
March 31, 2013, 9,064 of which are fully vested. Mr. Klopfenstein also holds 26,125 vested restricted stock units pursuant to which the underlying shares become issuable upon the closing
of our initial public offering.
- (22)
- Consists
of 61,500 shares exercisable within 60 days of March 31, 2013, 36,718 of which are fully vested.
- (23)
- Consists
of (i) 40,532 shares held of record by Mr. Mouldovan; and (ii) 20,953 shares exercisable within 60 days of
March 31, 2013, 9,203 of which are fully vested. Mr. Mouldovan also holds 26,125 vested restricted stock units pursuant to which the underlying shares become issuable upon the closing of
our initial public offering.
- (24)
- Consists
of (i) 37,500 shares held of record by Ms. Guarino; and (ii) 15,000 shares exercisable within 60 days of
March 31, 2013, none of which are fully vested.
- (25)
- Consists
of 49,250 shares exercisable within 60 days of March 31, 2013, none of which are fully vested. Mr. Cain also holds 17,375
vested restricted stock units pursuant to which the underlying shares become issuable upon the closing of our initial public offering.
- (26)
- Consists of shares held by sixteen selling stockholders not listed above who, as a group, beneficially own less than 1% of our outstanding common stock prior to this offering and the concurrent private placement. All sixteen of these selling stockholders are current or former service providers, or affiliates thereof, of our company. The selling stockholders hold 26,750 vested restricted stock units pursuant to which the underlying shares become issuable upon the closing of our initial public offering.
138
The following description summarizes the most important terms of our capital stock, as they are expected to be in effect upon the completion of this offering and the concurrent private placement. We expect to adopt an amended and restated certificate of incorporation and amended and restated bylaws in connection with the completion of this offering, and this description summarizes the provisions that are expected to be included in such documents. This summary does not purport to be complete and is qualified in its entirety by the provisions of our amended and restated certificate of incorporation and amended and restated bylaws, copies of which have been filed as exhibits to the registration statement of which this prospectus is a part. For a complete description of our capital stock, you should refer to our amended and restated certificate of incorporation, amended and restated bylaws and investor rights agreement, that are or will be included as exhibits to the registration statement of which this prospectus forms a part, and to the applicable provisions of Delaware law. Immediately following the completion of this offering, our authorized capital stock will consist of 1,000,000,000 shares of common stock, $0.0001 par value per share, and 20,000,000 shares of undesignated preferred stock, $0.0001 par value per share.
Assuming the automatic conversion of all outstanding shares of our convertible preferred stock into an aggregate of 25,876,142 shares of our common stock, which will occur upon the completion of this offering, as of March 31, 2013, there were 29,312,846 shares of our common stock outstanding, held by approximately 175 stockholders of record, and no shares of our preferred stock outstanding. Our board of directors is authorized, without stockholder approval, to issue additional shares of our capital stock.
Dividend Rights
Subject to preferences that may be applicable to any then outstanding preferred stock, holders of our common stock are entitled to receive dividends, if any, as may be declared from time to time by our board of directors out of legally available funds. We have never declared or paid cash dividends on any of our capital stock and currently do not anticipate paying any cash dividends after this offering or in the foreseeable future.
Voting Rights
Each holder of our common stock is entitled to one vote for each share on all matters submitted to a vote of the stockholders, including the election of directors. Our stockholders do not have cumulative voting rights in the election of directors. Accordingly, holders of a majority of the voting shares are able to elect all of the directors.
Right to Receive Liquidation Distributions
In the event of our liquidation, dissolution or winding up, holders of our common stock will be entitled to share ratably in the net assets legally available for distribution to stockholders after the payment of all of our debts and other liabilities and the satisfaction of any liquidation preference granted to the holders of any then outstanding shares of preferred stock.
Rights and Preferences
Holders of our common stock have no preemptive, conversion, subscription or other rights, and there are no redemption or sinking fund provisions applicable to our common stock. The rights, preferences and privileges of the holders of our common stock are subject to and may be
139
adversely affected by, the rights of the holders of shares of any series of our preferred stock that we may designate in the future.
Each currently outstanding share of our convertible preferred stock will be automatically converted into common stock on a one-to-one basis immediately prior to the completion of this offering pursuant to the automatic conversion provisions in our certificate of incorporation based on the proposed offering size or based on the consent of the holders of at least a majority of the outstanding shares of certain series of preferred stock. Holders of a majority of each of our Series E and Series F convertible preferred stock have provided their written consent to approve this conversion contingent upon this offering.
Immediately after the completion of this offering, our board of directors will have the authority, without further action by our stockholders, to issue up to 20,000,000 shares of preferred stock in one or more series and to fix the rights, preferences, privileges and restrictions thereof. These rights, preferences and privileges could include dividend rights, conversion rights, voting rights, terms of redemption, liquidation preferences, sinking fund terms and the number of shares constituting any series or the designation of such series, any or all of which may be greater than the rights of common stock. The issuance of preferred stock by us could adversely affect the voting power of holders of common stock and the likelihood that such holders will receive dividend payments and payments upon liquidation. In addition, the issuance of preferred stock could have the effect of delaying, deferring or preventing a change of control of our company or other corporate action. Upon the completion of this offering, no shares of preferred stock will be outstanding, and we have no present plan to issue any shares of preferred stock.
Stock Options and Restricted Stock Units
As of March 31, 2013, there were 7,982,829 shares of our common stock issuable upon exercise of outstanding stock options pursuant to our 2006 Stock Plan with a weighted average exercise price of $4.17 per share. In addition, as of March 31, 2013, there were 345,614 shares of our common stock issuable upon vesting of restricted stock units outstanding pursuant to our 2006 Stock Plan.
Unless we consent in writing to the selection of an alternative forum, the Court of Chancery of the State of Delaware will be the sole and exclusive forum for: (i) any derivative action or proceeding brought on behalf of us; (ii) any action asserting a claim of breach of a fiduciary duty owed by any of our directors, officers or other employees or agents to the us or the our stockholders; (iii) any action asserting a claim against us arising pursuant to any provision of the Delaware General Corporation Law or our amended and restated certificate of incorporation or amended and restated bylaws; (iv) any action to interpret, apply, enforce or determine the validity of our amended and restated certificate of incorporation or our amended and restated bylaws; or (v) any action asserting a claim against us governed by the internal affairs doctrine, in each such case, subject to said Court of Chancery having personal jurisdiction over the indispensable parties named as defendants therein. The enforceability of similar choice of forum provisions in other companies' certificates of incorporation has been challenged in legal proceedings, and it is possible that, in connection with any action, a court could find the choice of forum provisions contained in our amended and restated certificate of incorporation to be inapplicable or unenforceable in such action.
140
After the completion of this offering and the concurrent private placement, the holders of an aggregate of 26,376,142 shares of our common stock, or their permitted transferees, are entitled to rights with respect to the registration of such shares under the Securities Act. We refer to these shares as "registrable securities". These rights are provided under the terms of our amended and restated investors' rights agreement between us and the holders of registrable securities, and include demand registration rights, short form registration rights and piggyback registration rights.
These registration rights will terminate (i) five years following the completion of this offering, (ii) with respect to any holder of registrable securities holding less than or equal to one percent of our outstanding capital stock following this offering and the concurrent private placement, when such holder (together with its affiliates with whom it must aggregate its sales under Rule 144 of the Securities Act) is able to sell all of its registrable securities during a three-month period without registration in compliance with Rule 144 of the Securities Act or (iii) upon (A) the sale or disposal of all or substantially all of our assets, (B) the closing of our merger or consolidation with another entity (except a merger or consolidation in which the holders of our capital stock would continue to hold at least 50% of the voting power of our capital stock or the capital stock of the surviving entity), (C) the closing of the transfer of our capital stock (whether by merger, consolidation or otherwise) to a person or group (other than an underwriter of our capital stock) if, after such closing, the person or group would hold 50% or more of our outstanding voting stock or (D) our liquidation, dissolution or winding up (except, in each case, where the sole purpose of such transaction is to change our state of incorporation or to create a holding company that will continue to be owned by our existing stockholders in substantially the same proportion).
We will pay the registration expenses (other than underwriting discounts and commissions) in connection with the registrations described below, including the reasonable fees and disbursements of one counsel for participating holders of registrable securities not to exceed $25,000. In an underwritten offering, the underwriters have the right to limit the number of shares registered by these holders for marketing reasons, subject to certain limitations. In connection with the completion of this offering, each holder of registrable securities has agreed or will agree not to sell or otherwise dispose of any securities without the prior written consent of the underwriters for a period of 180 days after the date of this prospectus, subject to certain terms and conditions. See "Shares Eligible for Future Sale — Lock-Up Agreements" for additional information.
Demand Registration Rights
Six months after the completion of this offering, the holders of 50% or more of the then outstanding registrable securities can request that we register the offer and sale of their shares if the anticipated aggregate offering price of such shares is at least $10 million. We are not required to effect more than two demand registrations. If we determine that it would be seriously detrimental to us and our stockholders to effect a demand registration, we have the right to defer such registration, not more than once in any 12-month period, for a period of up to 120 days, provided that we do not register any of our securities or those of any other stockholder during such 120 day period, other than with respect to a registration related to a company stock plan, a registration related to a corporate reorganization or transaction under Rule 145 of the Securities Act, a registration on any form that does not include substantially the same information as would be required to be included in a registration statement covering the sale of registrable securities or a registration in which the only common stock being registered is common stock issuable upon conversion of debt securities that are also being registered. Additionally, we are not required to effect a demand registration during the period beginning with the date sixty days prior to our good faith estimate of the date of filing, and ending 180 days following the effectiveness of a registration statement relating to the initial public offering of our securities.
141
Piggyback Registration Rights
If we propose to register the offer and sale of any of our securities under the Securities Act in connection with the public offering of such securities, the holders of registrable securities will be entitled to certain "piggyback" registration rights allowing such holders to include their shares in such registration, subject to certain limitations. As a result, whenever we propose to file a registration statement under the Securities Act, other than with respect to a registration related to a company stock plan, a registration related to a corporate reorganization or transaction under Rule 145 of the Securities Act, a registration on any form that does not include substantially the same information as would be required to be included in a registration statement covering the sale of registrable securities or a registration in which the only common stock being registered is common stock issuable upon conversion of debt securities that are also being registered, the holders of these shares are entitled to notice of the registration and have the right to include their shares in the registration.
Form S-3 Registration Rights
The holders of at least 30% of our registrable securities may make a written request that we register the offer and sale of their shares on Form S-3 if we are eligible to file a registration statement on Form S-3 so long as the sale of securities registered pursuant to such request would result in an aggregate price to the public (net of any underwriters' discounts and commission) of at least $5 million. These holders may make an unlimited number of requests for registration on Form S-3; however, we will not be required to effect a registration on Form S-3 if we have effected one such registration within the 12-month period preceding the date of the request. Additionally, if we determine that it would be materially detrimental to our stockholders to effect such a registration, we have the right to defer such registration, not more than once in any 12-month period, for a period of up to 120 days, provided that we do not register any of our securities or those of any other stockholder during such 120 day period, other than with respect to a registration related to a company stock plan, a registration related to a corporate reorganization or transaction under Rule 145 of the Securities Act, a registration on any form that does not include substantially the same information as would be required to be included in a registration statement covering the sale of registrable securities or a registration in which the only common stock being registered is common stock issuable upon conversion of debt securities that are also being registered.
Anti-Takeover Effects of Delaware Law and Our Certificate of Incorporation and Bylaws
The provisions of Delaware law, our amended and restated certificate of incorporation and our amended and restated bylaws may have the effect of delaying, deferring or discouraging another person from acquiring control of our company. These provisions, which are summarized below, may have the effect of discouraging takeover bids. They are also designed, in part, to encourage persons seeking to acquire control of us to negotiate first with our board of directors. We believe that the benefits of increased protection of our potential ability to negotiate with an unfriendly or unsolicited acquirer outweigh the disadvantages of discouraging a proposal to acquire us because negotiation of these proposals could result in an improvement of their terms.
Delaware Law
We are governed by the provisions of Section 203 of the Delaware General Corporation Law. In general, Section 203 prohibits a public Delaware corporation from engaging in a "business combination" with an "interested stockholder" for a period of three years after the date of the transaction in which the person became an interested stockholder, unless the business combination is approved in a prescribed manner. A "business combination" includes mergers, asset sales or other transactions resulting in a financial benefit to the stockholder. An "interested stockholder" is a person who, together with affiliates and associates, owns, or within three years of the date on which
142
it is sought to be determined whether such person is an "interested stockholder", did own, 15% or more of the corporation's outstanding voting stock. These provisions may have the effect of delaying, deferring or preventing a change in our control.
Amended and Restated Certificate of Incorporation and Amended and Restated Bylaw Provisions
Our amended and restated certificate of incorporation and our amended and restated bylaws include a number of provisions that could deter hostile takeovers or delay or prevent changes in control of our management team, including the following:
- •
- Board of Directors Vacancies. Our amended and restated
certificate of incorporation and amended and restated bylaws will authorize only our board of directors to fill vacant directorships, including newly created seats. In addition, the number of
directors constituting our board of directors will be permitted to be set only by a resolution adopted by our board of directors. These provisions would prevent a stockholder from increasing the size
of our board of directors and then gaining control of our board of directors by filling the resulting vacancies with its own nominees. This makes it more difficult to change the composition of our
board of directors but promotes continuity of management.
- •
- Classified Board. Our amended and restated certificate of
incorporation and amended and restated bylaws will provide that our board is classified into three classes of directors. A third party may be discouraged from making a tender offer or otherwise
attempting to obtain control of us as it is more difficult and time consuming for stockholders to replace a majority of the directors on a classified board of directors. See
"Management — Board Composition" for additional information.
- •
- Stockholder Action; Special Meeting of Stockholders. Our
amended and restated certificate of incorporation will provide that our stockholders may not take action by written consent, but may only take action at annual or special meetings of our stockholders.
As a result, a holder controlling a majority of our capital stock would not be able to amend our amended and restated bylaws or remove directors without holding a meeting of our stockholders called in
accordance with our amended and restated bylaws. Our amended and restated bylaws will further provide that special meetings of our stockholders may be called only by a majority of our board of
directors, the Chairman of our Board of Directors, our Chief Executive Officer or our president, thus prohibiting a stockholder from calling a special meeting. These provisions might delay the ability
of our stockholders to force consideration of a proposal or for stockholders controlling a majority of our capital stock to take any action, including the removal of directors.
- •
- Advance Notice Requirements for Stockholder Proposals and Director
Nominations. Our amended and restated bylaws will provide advance notice procedures for stockholders seeking to bring business before
our annual meeting of stockholders or to nominate candidates for election as directors at our annual meeting of stockholders. Our amended and restated bylaws will also specify certain requirements
regarding the form and content of a stockholder's notice. These provisions might preclude our stockholders from bringing matters before our annual meeting of stockholders or from making nominations
for directors at our annual meeting of stockholders if the proper procedures are not followed. We expect that these provisions may also discourage or deter a potential acquirer from conducting a
solicitation of proxies to elect the acquirer's own slate of directors or otherwise attempting to obtain control of our company.
- •
- No Cumulative Voting. The Delaware General Corporation Law provides that stockholders are not entitled to the right to cumulate votes in the election of directors unless a
143
- •
- Directors Removed Only for Cause. Our amended and restated
certificate of incorporation will provide that stockholders may remove directors only for cause.
- •
- Amendment of Charter Provisions. Any amendment of the
above provisions in our amended and restated certificate of incorporation would require approval by holders of at least two-thirds of our then outstanding common stock.
- •
- Issuance of Undesignated Preferred Stock. Our board of directors will have the authority, without further action by the stockholders, to issue up to 20,000,000 shares of undesignated preferred stock with rights and preferences, including voting rights, designated from time to time by our board of directors. The existence of authorized but unissued shares of preferred stock would enable our board of directors to render more difficult or to discourage an attempt to obtain control of us by means of a merger, tender offer, proxy contest or other means.
corporation's certificate of incorporation provides otherwise. Our amended and restated certificate of incorporation will not provide for cumulative voting.
Upon the completion of this offering, the transfer agent and registrar for our common stock will be Computershare Trust Company, N.A. The transfer agent and registrar's address is 250 Royall Street, Canton, Massachusetts 02021. Our shares of common stock will be issued in uncertificated form only, subject to limited circumstances.
Our common stock has been approved for listing on The NASDAQ Global Select Market under the symbol "MKTO".
144
SHARES ELIGIBLE FOR FUTURE SALE
Prior to this offering, there has been no public market for our common stock, and we cannot predict the effect, if any, that market sales of shares of our common stock or the availability of shares of our common stock for sale will have on the market price of our common stock prevailing from time to time. Future sales of our common stock in the public market, or the availability of such shares for sale in the public market, could adversely affect market prices prevailing from time to time. As described below, only a limited number of shares will be available for sale shortly after this offering due to contractual and legal restrictions on resale. Nevertheless, sales of our common stock in the public market after such restrictions lapse, or the perception that those sales may occur, could adversely affect the prevailing market price at such time and our ability to raise equity capital in the future.
Following the completion of this offering and the concurrent private placement, and after giving effect to the automatic conversion of all outstanding shares of our convertible preferred stock which will occur upon the completion of this offering and the issuance of 221,303 shares of common stock to be acquired by certain selling stockholders upon the exercise of options and the vesting and settlement of restricted stock units in order to sell in this offering, based on the number of shares of our capital stock outstanding as of March 31, 2013, we will have a total of 35,784,149 shares of our common stock outstanding. Of these outstanding shares, all of the shares of common stock sold in this offering, plus any shares sold upon exercise of the underwriters' option to purchase up to an additional 908,926 shares of common stock from us in this offering, will be freely tradable, except that any shares purchased in this offering by our affiliates, as that term is defined in Rule 144 under the Securities Act, would only be able to be sold in compliance with the Rule 144 limitations described below.
The remaining outstanding shares of our common stock will be deemed "restricted securities" as defined in Rule 144. Restricted securities may be sold in the public market only if they are registered or if they qualify for an exemption from registration under Rule 144 or Rule 701 under the Securities Act, which rules are summarized below. In addition, holders of all or substantially all of our equity securities have entered into or will enter into lock-up agreements with the underwriters under which they have agreed, subject to specific exceptions, not to sell any of our stock for at least 180 days following the date of this prospectus, as described below. As a result of these agreements, subject to the provisions of Rule 144 or Rule 701, based on an assumed offering date of March 31, 2013, shares will be available for sale in the public market as follows:
- •
- beginning on the date of this prospectus, the 6,059,509 shares of common stock sold in this offering will be immediately
available for sale in the public market;
- •
- beginning 181 days after the date of this prospectus, 29,724,640 additional shares of common stock will become
eligible for sale in the public market, of which 26,281,914 shares will be held by affiliates and subject to the volume and other restrictions of Rule 144, as described below; and
- •
- the remainder of the shares of common stock will be eligible for sale in the public market from time to time thereafter, subject in some cases to the volume and other restrictions of Rule 144, as described below.
We, our officers and directors and holders of substantially all of our common stock and securities convertible into or exchangeable for our common stock, have agreed or will agree that, subject to certain exceptions and under certain conditions, for a period of 180 days after the date of this prospectus, we and they will not, without the prior written consent of Goldman, Sachs & Co. and Credit Suisse Securities (USA) LLC, dispose of or hedge any shares or any securities convertible into or exchangeable for shares of our capital stock. Goldman, Sachs & Co. and Credit
145
Suisse Securities (USA) LLC may, in their discretion, release any of the securities subject to these lock-up agreements at any time.
In the event that any of our officers or directors or holders of one percent or more of our common stock (including any securities convertible into or exercisable or exchangeable for common stock) are granted an early release, then certain persons or groups who have executed a lock-up agreement automatically will be granted an early release from their obligations under the lock-up agreement on a pro rata basis.
In general, under Rule 144 as currently in effect, once we have been subject to the public company reporting requirements of Section 13 or Section 15(d) of the Exchange Act for at least 90 days, a person who is not deemed to have been one of our affiliates for purposes of the Securities Act at any time during the 90 days preceding a sale and who has beneficially owned the shares proposed to be sold for at least six months, including the holding period of any prior owner other than our affiliates, is entitled to sell those shares without complying with the manner of sale, volume limitation or notice provisions of Rule 144, subject to compliance with the public information requirements of Rule 144. If such a person has beneficially owned the shares proposed to be sold for at least one year, including the holding period of any prior owner other than our affiliates, then that person would be entitled to sell those shares without complying with any of the requirements of Rule 144.
In general, under Rule 144, as currently in effect, and upon expiration of the lock-up agreements described above, our affiliates or persons selling shares on behalf of our affiliates are entitled to sell within any three-month period, a number of shares that does not exceed the greater of:
- •
- 1% of the number of shares of our common stock then outstanding, which will equal approximately 357,841 shares immediately
after this offering and the concurrent private placement assuming no exercise by the underwriters of their option to purchase up to an additional 908,926 shares of common stock from us in this
offering; or
- •
- the average weekly trading volume of our common stock during the four calendar weeks preceding the filing of a notice on Form 144 with respect to that sale;
provided, in each case, that we have been subject to the Exchange Act periodic reporting requirements for at least 90 days before the sale. Sales under Rule 144 by our affiliates or persons selling shares on behalf of our affiliates are also subject to certain manner of sale provisions and notice requirements and to the availability of current public information about us.
Rule 701 generally allows a stockholder who purchased shares of our common stock pursuant to a written compensatory plan or contract and who is not deemed to have been an affiliate of our company during the immediately preceding 90 days to sell these shares in reliance upon Rule 144, but without being required to comply with the public information, holding period, volume limitation or notice provisions of Rule 144. Rule 701 also permits affiliates of our company to sell their Rule 701 shares under Rule 144 without complying with the holding period requirements of Rule 144. All holders of Rule 701 shares, however, are required by that rule to wait until 90 days after the date of this prospectus before selling those shares pursuant to Rule 701.
On the date beginning 180 days after the date of this prospectus, the holders of 26,376,142 shares of our common stock, or their transferees, will be entitled to various rights with respect to
146
the registration of these shares under the Securities Act. Registration of these shares under the Securities Act would result in these shares becoming fully tradable without restriction under the Securities Act immediately upon the effectiveness of the registration, except for shares purchased by affiliates. See "Description of Capital Stock — Registration Rights" for additional information.
Following the completion of this offering, we intend to file a registration statement on Form S-8 under the Securities Act to register shares of our common stock issued or reserved for issuance under our 2006 Plan, 2013 Plan and ESPP. The registration statement on Form S-8 will become effective immediately upon filing, and shares covered by such registration statement will thereupon be eligible for sale in the public markets, subject to vesting restrictions, the lock-up agreements described above and Rule 144 limitations applicable to affiliates. See "Executive Compensation — Employee Benefit and Stock Plans" for additional information.
147
MATERIAL U.S. FEDERAL INCOME TAX AND ESTATE TAX CONSEQUENCES
TO NON-U.S. HOLDERS
The following is a summary of the material U.S. federal income tax consequences of the ownership and disposition of our common stock to non-U.S. holders, but does not purport to be a complete analysis of all the potential tax considerations relating thereto. This summary is based upon the provisions of the Code, Treasury regulations promulgated thereunder, administrative rulings and judicial decisions, all as of the date hereof. These authorities may be changed, possibly retroactively, so as to result in U.S. federal income tax consequences different from those set forth below. We have not sought any ruling from the Internal Revenue Service (IRS) with respect to the statements made and the conclusions reached in the following summary, and there can be no assurance that the IRS will agree with such statements and conclusions.
This summary also does not address the tax considerations arising under the laws of any non-U.S., state or local jurisdiction or under U.S. federal gift and estate tax laws, except to the limited extent set forth below. In addition, this discussion does not address tax considerations applicable to an investor's particular circumstances or to investors that may be subject to special tax rules, including, without limitation:
- •
- banks, insurance companies or other financial institutions;
- •
- persons subject to the alternative minimum tax;
- •
- tax-exempt organizations;
- •
- controlled foreign corporations, passive foreign investment companies and corporations that accumulate earnings to avoid
U.S. federal income tax;
- •
- dealers in securities or currencies;
- •
- traders in securities that elect to use a mark-to-market method of accounting for their securities
holdings;
- •
- persons that own, or are deemed to own, more than five percent of our capital stock (except to the extent specifically set
forth below);
- •
- certain former citizens or long-term residents of the United States;
- •
- persons who hold our common stock as a position in a hedging transaction, "straddle", "conversion transaction" or other
risk reduction transaction;
- •
- persons who do not hold our common stock as a capital asset within the meaning of Section 1221 of the Code; or
- •
- persons deemed to sell our common stock under the constructive sale provisions of the Code.
In addition, if a partnership or entity classified as a partnership for U.S. federal income tax purposes holds our common stock, the tax treatment of a partner generally will depend on the status of the partner and upon the activities of the partnership. Accordingly, partnerships that hold our common stock, and partners in such partnerships, should consult their tax advisors.
You are urged to consult your tax advisor with respect to the application of the U.S. federal income tax laws to your particular situation, as well as any tax consequences of the purchase, ownership and disposition of our common stock arising under the U.S. federal estate or gift tax rules or under the laws of any state, local, non-U.S. or other taxing jurisdiction or under any applicable tax treaty.
148
For purposes of this discussion, you are a non-U.S. holder if you are any holder other than:
- •
- an individual citizen or resident of the United States (for tax purposes);
- •
- a corporation or other entity taxable as a corporation created or organized in the United States or under the laws of the
United States or any political subdivision thereof;
- •
- an estate whose income is subject to U.S. federal income tax regardless of its source; or
- •
- a trust (x) whose administration is subject to the primary supervision of a U.S. court and that has one or more U.S. persons who have the authority to control all substantial decisions of the trust or (y) that has made an election to be treated as a U.S. person.
We do not anticipate making any distributions on our common stock following the completion of this offering. However, if we do make distributions on our common stock, those payments will constitute dividends for U.S. tax purposes to the extent paid from our current or accumulated earnings and profits, as determined under U.S. federal income tax principles. To the extent those distributions exceed both our current and our accumulated earnings and profits, they will constitute a return of capital and will first reduce your basis in our common stock, but not below zero, and then will be treated as gain from the sale of stock.
Any dividend paid to you generally will be subject to U.S. withholding tax either at a rate of 30% of the gross amount of the dividend or such lower rate as may be specified by an applicable income tax treaty. In order to receive a reduced treaty rate, you must provide us with an IRS Form W-8BEN or other appropriate version of IRS Form W-8 certifying qualification for the reduced rate. A non-U.S. holder of shares of our common stock eligible for a reduced rate of U.S. withholding tax pursuant to an income tax treaty may obtain a refund of any excess amounts withheld by filing an appropriate claim for refund with the IRS. If the non-U.S. holder holds the stock through a financial institution or other agent acting on the non-U.S. holder's behalf, the non-U.S. holder will be required to provide appropriate documentation to the agent, which then will be required to provide certification to us or our paying agent, either directly or through other intermediaries.
Dividends received by you that are effectively connected with your conduct of a U.S. trade or business (and, if an income tax treaty applies, such dividends are attributable to a permanent establishment maintained by you in the United States), are includible in your gross income in the taxable year received, and are exempt from such withholding tax. In order to obtain this exemption, you must provide us with an IRS Form W-8ECI or other applicable IRS Form W-8 properly certifying such exemption. Such effectively connected dividends, although not subject to withholding tax, are taxed at the same graduated rates applicable to U.S. persons, net of certain deductions and credits, subject to an applicable income tax treaty providing otherwise. In addition, if you are a corporate non-U.S. holder, dividends you receive that are effectively connected with your conduct of a U.S. trade or business may also be subject to a branch profits tax at a rate of 30% or such lower rate as may be specified by an applicable income tax treaty.
149
Gain on Disposition of Common Stock
You generally will not be required to pay U.S. federal income tax on any gain realized upon the sale or other disposition of our common stock unless:
- •
- the gain is effectively connected with your conduct of a U.S. trade or business (and, if an income tax treaty applies, the
gain is attributable to a permanent establishment maintained by you in the United States);
- •
- you are an individual who is present in the United States for a period or periods aggregating 183 days or more
during the calendar year in which the sale or disposition occurs and certain other conditions are met; or
- •
- our common stock constitutes a U.S. real property interest by reason of our status as a "United States real property holding corporation" (USRPHC), for U.S. federal income tax purposes at any time within the shorter of the five-year period preceding your disposition of, or your holding period for, our common stock.
We believe that we are not currently and will not become a USRPHC. However, because the determination of whether we are a USRPHC depends on the fair market value of our U.S. real property relative to the fair market value of our other business assets, there can be no assurance that we will not become a USRPHC in the future. Even if we become a USRPHC, however, as long as our common stock is regularly traded on an established securities market, your common stock will be treated as U.S. real property interests only if you actually or constructively hold more than five percent of such regularly traded common stock at any time during the shorter of the five-year period preceding your disposition of, or your holding period for, our common stock.
If you are a non-U.S. holder described in the first bullet above, you will be required to pay tax on the net gain derived from the sale under regular graduated U.S. federal income tax rates, and a corporate non-U.S. holder described in the first bullet above also may be subject to the branch profits tax at a 30% rate, or such lower rate as may be specified by an applicable income tax treaty. If you are an individual non-U.S. holder described in the second bullet above, you will be required to pay a flat 30% tax on the gain derived from the sale, which tax may be offset by U.S. source capital losses for the year. You should consult any applicable income tax or other treaties that may provide for different rules.
Our common stock beneficially owned by an individual who is not a citizen or resident of the United States (as defined for U.S. federal estate tax purposes) at the time of their death will generally be includable in the decedent's gross estate for U.S. federal estate tax purposes, unless an applicable estate tax treaty provides otherwise.
Backup Withholding and Information Reporting
Generally, we must report annually to the IRS the amount of dividends paid to you, your name and address, and the amount of tax withheld, if any. A similar report will be sent to you. Pursuant to applicable income tax treaties or other agreements, the IRS may make these reports available to tax authorities in your country of residence.
Payments of dividends or of proceeds on the disposition of stock made to you may be subject to information reporting and backup withholding at a current rate of 28% unless you establish an exemption, for example, by properly certifying your non U.S. status on a Form W-8BEN or another appropriate version of IRS Form W-8. Notwithstanding the foregoing, backup withholding and
150
information reporting may apply if either we or our paying agent has actual knowledge, or reason to know, that you are a U.S. person.
Backup withholding is not an additional tax; rather, the U.S. income tax liability of persons subject to backup withholding will be reduced by the amount of tax withheld. If withholding results in an overpayment of taxes, a refund or credit may generally be obtained from the IRS, provided that the required information is furnished to the IRS in a timely manner
Legislation Affecting Taxation of our
Common Stock Held by or through Foreign Entities
Code Sections 1471-1474 and the regulations issued thereunder generally will impose a U.S. federal withholding tax of 30% on dividends, and the gross proceeds of a disposition of our common stock, paid to a "foreign financial institution" (as specially defined under these rules), unless such institution enters into an agreement with the U.S. government to withhold on certain payments and to collect and provide to the U.S. tax authorities substantial information regarding the U.S. account holders of such institution (which includes certain equity and debt holders of such institution, as well as certain account holders that are foreign entities with U.S. owners). The legislation also generally will impose a U.S. federal withholding tax of 30% on dividends and the gross proceeds of a disposition of our common stock paid to a non-financial foreign entity unless such entity provides the withholding agent with a certification identifying the direct and indirect U.S. owners of the entity. This withholding obligation under this legislation with respect to dividends on our common stock will not begin until January 1, 2014 and with respect to the gross proceeds of a sale or other disposition of our common stock will not begin until January 1, 2017. Under certain circumstances, a non-U.S. holder might be eligible for refunds or credits of such taxes. An intergovernmental agreement between the United States and an applicable foreign country may modify the requirements described in this paragraph. Prospective investors are encouraged to consult with their own tax advisors regarding the possible implications of this legislation on their investment in our common stock.
The preceding discussion of U.S. federal tax considerations is for general information only. It is not tax advice. Each prospective investor should consult its own tax advisor regarding the particular U.S. federal, state and local and non-U.S. tax consequences of purchasing, holding and disposing of our common stock, including the consequences of any proposed change in applicable laws.
151
We, the selling stockholders and the underwriters named below will enter into an underwriting agreement with respect to the shares being offered. Subject to certain conditions, each underwriter will severally agree to purchase the number of shares indicated in the following table. Goldman, Sachs & Co. and Credit Suisse Securities (USA) LLC are the representatives of the underwriters.
Underwriters
|
Number of Shares |
|||
|---|---|---|---|---|
Goldman, Sachs & Co. |
||||
Credit Suisse Securities (USA) LLC |
||||
UBS Securities LLC |
||||
Canaccord Genuity Inc. |
||||
Raymond James & Associates, Inc. |
||||
JMP Securities LLC |
||||
Total |
6,059,509 | |||
The underwriters will be committed to take and pay for all of the shares being offered, if any are taken, other than the shares covered by the option described below, unless and until this option is exercised.
The underwriters will have an option to buy up to an additional 908,926 shares from us to cover sales by the underwriters of a greater number of shares than the total number set forth in the table above. They may exercise this option for 30 days. If any shares are purchased pursuant to this option, the underwriters will severally purchase shares in approximately the same proportion as set forth in the table above.
The following tables show the per share and total underwriting discounts and commissions to be paid to the underwriters by us and the selling stockholders. Such amounts are shown assuming both no exercise and full exercise of the underwriters' option to purchase 908,926 additional shares.
| |
No Exercise | Full Exercise | |||||
|---|---|---|---|---|---|---|---|
Per Share |
$ | $ | |||||
Total |
$ | $ | |||||
Paid by the Selling Stockholders
| |
No Exercise | Full Exercise | |||||
|---|---|---|---|---|---|---|---|
Per Share |
$ | $ | |||||
Total |
$ | $ | |||||
Shares sold by the underwriters to the public will initially be offered at the initial public offering price set forth on the cover of this prospectus. Any shares sold by the underwriters to securities dealers may be sold at a discount of up to $ per share from the initial public offering price. After the initial offering of the shares, the representatives may change the offering price and the other selling terms. The offering of the shares by the underwriters is subject to receipt and acceptance and subject to the underwriters' right to reject any order in whole or in part.
We and our officers, directors and holders of substantially all of our common stock and securities convertible into or exchangeable for our common stock, including the selling
152
stockholders, have agreed or will agree with the underwriters, subject to certain exceptions, not to dispose of or hedge any of their common stock or securities convertible into or exchangeable for shares of common stock during the period from the date of this prospectus continuing through the date 180 days after the date of this prospectus, except with the prior written consent of the representatives. This agreement does not apply to any existing employee benefit plans. See "Shares Eligible for Future Sale" for a discussion of certain transfer restrictions.
In the event that any of our officers or directors or holders of one percent or more of our common stock (including any securities convertible into or exercisable or exchangeable for common stock) are granted an early release, then certain persons or groups who have executed a lock-up agreement automatically will be granted an early release from their obligations under the lock-up agreement on a pro rata basis.
Prior to the offering, there has been no public market for the shares. The initial public offering price will be negotiated among the company and the representatives. Among the factors to be considered in determining the initial public offering price of the shares, in addition to prevailing market conditions, will be the company's historical performance, estimates of the business potential and earnings prospects of the company, an assessment of the company's management and the consideration of the above factors in relation to market valuation of companies in related businesses.
Our common stock has been approved for listing on The NASDAQ Global Select Market under the symbol "MKTO".
In connection with the offering, the underwriters may purchase and sell shares of common stock in the open market. These transactions may include short sales, stabilizing transactions and purchases to cover positions created by short sales. Short sales involve the sale by the underwriters of a greater number of shares than they are required to purchase in the offering, and a short position represents the amount of such sales that have not been covered by subsequent purchases. A "covered short position" is a short position that is not greater than the amount of additional shares for which the underwriters' option described above may be exercised. The underwriters may cover any covered short position by either exercising their option to purchase additional shares or purchasing shares in the open market. In determining the source of shares to cover the covered short position, the underwriters will consider, among other things, the price of shares available for purchase in the open market as compared to the price at which they may purchase additional shares pursuant to the option described above. "Naked" short sales are any short sales that create a short position greater than the amount of additional shares for which the option described above may be exercised. The underwriters must cover any such naked short position by purchasing shares in the open market. A naked short position is more likely to be created if the underwriters are concerned that there may be downward pressure on the price of the common stock in the open market after pricing that could adversely affect investors who purchase in the offering. Stabilizing transactions consist of various bids for or purchases of common stock made by the underwriters in the open market prior to the completion of the offering.
The underwriters may also impose a penalty bid. This occurs when a particular underwriter repays to the underwriters a portion of the underwriting discount received by it because the representatives have repurchased shares sold by or for the account of such underwriter in stabilizing or short covering transactions.
Purchases to cover a short position and stabilizing transactions, as well as other purchases by the underwriters for their own accounts, may have the effect of preventing or retarding a decline in the market price of the company's stock, and together with the imposition of the penalty bid, may stabilize, maintain or otherwise affect the market price of the common stock. As a result, the price of the common stock may be higher than the price that otherwise might exist in the open market.
153
The underwriters are not required to engage in these activities and may end any of these activities at any time. These transactions may be effected on The NASDAQ Global Select Market, in the over-the-counter market or otherwise.
European Economic Area
In relation to each Member State of the European Economic Area which has implemented the Prospectus Directive (each, a Relevant Member State), each underwriter has represented and agreed that with effect from and including the date on which the Prospectus Directive is implemented in that Relevant Member State (the Relevant Implementation Date) it has not made and will not make an offer of shares to the public in that Relevant Member State prior to the publication of a prospectus in relation to the shares which has been approved by the competent authority in that Relevant Member State or, where appropriate, approved in another Relevant Member State and notified to the competent authority in that Relevant Member State, all in accordance with the Prospectus Directive, except that it may, with effect from and including the Relevant Implementation Date, make an offer of shares to the public in that Relevant Member State at any time:
- •
- to legal entities which are authorized or regulated to operate in the financial markets or, if not so authorized or
regulated, whose corporate purpose is solely to invest in securities;
- •
- to any legal entity which has two or more of (1) an average of at least 250 employees during the last financial
year; (2) a total balance sheet of more than €43,000,000 and (3) an annual net turnover of more than €50,000,000, as shown in its last annual or
consolidated accounts;
- •
- to fewer than 100 natural or legal persons (other than qualified investors as defined in the Prospectus Directive) subject
to obtaining the prior consent of the representatives for any such offer; or
- •
- in any other circumstances which do not require the publication by the Issuer of a prospectus pursuant to Article 3 of the Prospectus Directive.
For the purposes of this provision, the expression an "offer of shares to the public" in relation to any shares in any Relevant Member State means the communication in any form and by any means of sufficient information on the terms of the offer and the shares to be offered so as to enable an investor to decide to purchase or subscribe the shares, as the same may be varied in that Relevant Member State by any measure implementing the Prospectus Directive in that Relevant Member State and the expression Prospectus Directive means Directive 2003/71/EC and includes any relevant implementing measure in each Relevant Member State.
Each underwriter has represented and agreed that:
- •
- it has only communicated or caused to be communicated and will only communicate or cause to be communicated an invitation
or inducement to engage in investment activity (within the meaning of Section 21 of the FSMA) received by it in connection with the issue or sale of the shares in circumstances in which
Section 21(1) of the FSMA would not, if the Issuer was not an authorized person, apply to the Issuer; and
- •
- it has complied and will comply with all applicable provisions of the FSMA with respect to anything done by it in relation to the shares in, from or otherwise involving the United Kingdom.
The shares may not be offered or sold by means of any document other than (i) in circumstances which do not constitute an offer to the public within the meaning of the Companies Ordinance (Cap.32, Laws of Hong Kong), or (ii) to "professional investors" within the meaning of
154
the Securities and Futures Ordinance (Cap.571, Laws of Hong Kong) and any rules made thereunder, or (iii) in other circumstances which do not result in the document being a "prospectus" within the meaning of the Companies Ordinance (Cap.32, Laws of Hong Kong), and no advertisement, invitation or document relating to the shares may be issued or may be in the possession of any person for the purpose of issue (in each case whether in Hong Kong or elsewhere), which is directed at, or the contents of which are likely to be accessed or read by, the public in Hong Kong (except if permitted to do so under the laws of Hong Kong) other than with respect to shares which are or are intended to be disposed of only to persons outside Hong Kong or only to "professional investors" within the meaning of the Securities and Futures Ordinance (Cap. 571, Laws of Hong Kong) and any rules made thereunder.
This prospectus has not been registered as a prospectus with the Monetary Authority of Singapore. Accordingly, this prospectus and any other document or material in connection with the offer or sale, or invitation for subscription or purchase, of the shares may not be circulated or distributed, nor may the shares be offered or sold, or be made the subject of an invitation for subscription or purchase, whether directly or indirectly, to persons in Singapore other than (i) to an institutional investor under Section 274 of the Securities and Futures Act, Chapter 289 of Singapore (SFA), (ii) to a relevant person, or any person pursuant to Section 275(1A), and in accordance with the conditions, specified in Section 275 of the SFA or (iii) otherwise pursuant to, and in accordance with the conditions of, any other applicable provision of the SFA.
Where the shares are subscribed or purchased under Section 275 by a relevant person which is: (a) a corporation (which is not an accredited investor) the sole business of which is to hold investments and the entire share capital of which is owned by one or more individuals, each of whom is an accredited investor; or (b) a trust (where the trustee is not an accredited investor) whose sole purpose is to hold investments and each beneficiary is an accredited investor, shares, debentures and units of shares and debentures of that corporation or the beneficiaries' rights and interest in that trust shall not be transferable for 6 months after that corporation or that trust has acquired the shares under Section 275 except: (1) to an institutional investor under Section 274 of the SFA or to a relevant person, or any person pursuant to Section 275(1A), and in accordance with the conditions, specified in Section 275 of the SFA; (2) where no consideration is given for the transfer; or (3) by operation of law.
The securities have not been and will not be registered under the Financial Instruments and Exchange Law of Japan (the Financial Instruments and Exchange Law) and each underwriter has agreed that it will not offer or sell any securities, directly or indirectly, in Japan or to, or for the benefit of, any resident of Japan (which term as used herein means any person resident in Japan, including any corporation or other entity organized under the laws of Japan), or to others for re-offering or resale, directly or indirectly, in Japan or to a resident of Japan, except pursuant to an exemption from the registration requirements of, and otherwise in compliance with, the Financial Instruments and Exchange Law and any other applicable laws, regulations and ministerial guidelines of Japan.
The underwriters do not expect sales to discretionary accounts to exceed five percent of the total number of shares offered.
We and the selling stockholders estimate that our share of the total expenses of the offering, excluding underwriting discounts and commissions, will be approximately $3.6 million, which includes an amount not to exceed $30,000 that we have agreed to reimburse the underwriters for certain FINRA-related expenses incurred by them in connection with this offering.
We and the selling stockholders have agreed to indemnify the several underwriters against certain liabilities, including liabilities under the Securities Act of 1933.
155
The underwriters and their respective affiliates are full service financial institutions engaged in various activities, which may include securities trading, commercial and investment banking, financial advisory, investment management, investment research, principal investment, hedging, financing and brokerage activities. Certain of the underwriters and their respective affiliates have, from time to time, performed, and may in the future perform, various financial advisory and investment banking services for the issuer, for which they received or will receive customary fees and expenses.
In the ordinary course of their various business activities, the underwriters and their respective affiliates may make or hold a broad array of investments and actively trade debt and equity securities (or related derivative securities) and financial instruments (including bank loans) for their own account and for the accounts of their customers, and such investment and securities activities may involve securities and/or instruments of the issuer (directly, as collateral securing other obligations or otherwise). The underwriters and their respective affiliates may also make investment recommendations and/or publish or express independent research views in respect of such securities or instruments and may at any time hold, or recommend to clients that they acquire, long and/or short positions in such securities and instruments.
156
The validity of the shares of common stock offered hereby will be passed upon for us by Wilson Sonsini Goodrich & Rosati, Professional Corporation, Palo Alto, California. The underwriters are being represented by Goodwin Procter LLP, Menlo Park, California, in connection with this offering.
The consolidated financial statements of Marketo, Inc. as of December 31, 2011 and 2012, and for each of the years in the three-year period ended December 31, 2012, have been included herein in reliance upon the reports of KPMG LLP, independent registered public accounting firm, appearing elsewhere herein and upon the authority of said firm as experts in accounting and auditing.
WHERE YOU CAN FIND MORE INFORMATION
We have filed with the SEC a registration statement on Form S-1 under the Securities Act with respect to the shares of common stock offered by this prospectus. This prospectus, which constitutes a part of the registration statement, does not contain all of the information set forth in the registration statement, some of which is contained in exhibits to the registration statement as permitted by the rules and regulations of the SEC. For further information with respect to us and our common stock, we refer you to the registration statement, including the exhibits filed as a part of the registration statement. Statements contained in this prospectus concerning the contents of any contract or any other document is not necessarily complete. If a contract or document has been filed as an exhibit to the registration statement, please see the copy of the contract or document that has been filed. Each statement in this prospectus relating to a contract or document filed as an exhibit is qualified in all respects by the filed exhibit. You may obtain copies of this information by mail from the Public Reference Section of the SEC, 100 F Street, N.E., Room 1580, Washington, D.C. 20549, at prescribed rates. You may obtain information on the operation of the public reference rooms by calling the SEC at 1-800-SEC-0330. The SEC also maintains an Internet website that contains reports, proxy statements and other information about issuers, like us, that file electronically with the SEC. The address of that website is www.sec.gov.
As a result of this offering, we will become subject to the information and reporting requirements of the Securities Exchange Act of 1934 and, in accordance with this law, will file periodic reports, proxy statements and other information with the SEC. These periodic reports, proxy statements and other information will be available for inspection and copying at the SEC's public reference facilities and the website of the SEC referred to above. We also maintain a website at www.marketo.com. Upon completion of this offering, you may access these materials free of charge as soon as reasonably practicable after they are electronically filed with, or furnished to, the SEC. Information contained on our website is not a part of this prospectus and the inclusion of our website address in this prospectus is an inactive textual reference only.
157
INDEX TO CONSOLIDATED FINANCIAL STATEMENTS
F-1
Report of Independent Registered Public Accounting Firm
The
Board of Directors and Stockholders
Marketo, Inc.:
We have audited the accompanying consolidated balance sheets of Marketo, Inc. and subsidiaries (the Company) as of December 31, 2012 and 2011, and the related consolidated statements of operations and comprehensive loss, stockholders' equity, and cash flows for each of the years in the three-year period ended December 31, 2012. These consolidated financial statements are the responsibility of the Company's management. Our responsibility is to express an opinion on these consolidated financial statements based on our audits.
We conducted our audits in accordance with the standards of the Public Company Accounting Oversight Board (United States). Those standards require that we plan and perform the audit to obtain reasonable assurance about whether the financial statements are free of material misstatement. An audit includes examining, on a test basis, evidence supporting the amounts and disclosures in the financial statements. An audit also includes assessing the accounting principles used and significant estimates made by management, as well as evaluating the overall financial statement presentation. We believe that our audits provide a reasonable basis for our opinion.
In our opinion, the consolidated financial statements referred to above present fairly, in all material respects, the financial position of Marketo, Inc. and subsidiaries as of December 31, 2012 and 2011, and the results of their operations and their cash flows for each of the years in the three-year period ended December 31, 2012, in conformity with U.S. generally accepted accounting principles.
As discussed in note 1 to the consolidated financial statements, Marketo, Inc. changed its method of accounting for revenue arrangements with multiple deliverables as of January 1, 2011 resulting from the adoption of a new accounting pronouncement.
/s/ KPMG LLP
Santa
Clara, California
February 25, 2013, except as to note 14,
which is as of May 6, 2013
F-2
MARKETO, INC.
Consolidated Balance Sheets
(in thousands, except share and per share data)
| |
December 31, | |
Pro Forma Stockholders' Equity March 31, 2013 |
||||||||||
|---|---|---|---|---|---|---|---|---|---|---|---|---|---|
| |
March 31, 2013 |
||||||||||||
| |
2011
|
2012
|
|||||||||||
| |
|
|
(unaudited) |
||||||||||
ASSETS |
|||||||||||||
Current assets: |
|||||||||||||
Cash and cash equivalents |
$ | 67,400 | $ | 44,247 | $ | 36,176 | |||||||
Accounts receivable, net of allowances of $225, $336 and $392 for 2011, 2012 and March 31, 2013 (unaudited), respectively |
8,569 | 14,106 | 14,193 | ||||||||||
Prepaid expenses and other current assets |
1,936 | 2,379 | 4,913 | ||||||||||
Total current assets |
77,905 | 60,732 | 55,282 | ||||||||||
Property and equipment, net |
1,450 | 5,617 | 7,996 | ||||||||||
Goodwill |
— | 9,537 | 9,537 | ||||||||||
Intangible assets, net |
244 | 2,734 | 2,576 | ||||||||||
Other assets |
139 | 536 | 475 | ||||||||||
Total assets |
$ | 79,738 | $ | 79,156 | $ | 75,866 | |||||||
LIABILITIES AND STOCKHOLDERS' EQUITY |
|||||||||||||
Current liabilities: |
|||||||||||||
Accounts payable |
$ | 2,820 | $ | 2,217 | $ | 3,366 | |||||||
Accrued expenses and other current liabilities |
4,466 | 8,945 | 7,602 | ||||||||||
Deferred revenue |
10,968 | 20,642 | 24,508 | ||||||||||
Current portion of credit facility |
— | 582 | 875 | ||||||||||
Total current liabilities |
18,254 | 32,386 | 36,351 | ||||||||||
Credit facility, net of current portion |
— |
3,058 |
2,765 |
||||||||||
Deferred rent |
176 | 148 | 1,150 | ||||||||||
Total liabilities |
18,430 | 35,592 | 40,266 | ||||||||||
Commitments and contingencies (Note 7) |
|||||||||||||
STOCKHOLDERS' EQUITY: |
|||||||||||||
Convertible preferred stock, par value $0.0001 per share — 50,067,383, 51,752,313 and 51,752,313 shares authorized as of December 31, 2011, 2012 and March 31, 2013 (unaudited); 25,033,684, 25,876,142 and 25,876,142 shares issued and outstanding as of December 31, 2011, 2012 and March 31, 2013 (unaudited); liquidation preference of $107,084,942, $119,384,828 and $119,384,828 as of December 31, 2011, 2012 and March 31, 2013 (unaudited), actual; no shares issued and outstanding, pro forma (unaudited) |
106,821 | 119,121 | 119,121 | $ | — | ||||||||
Common stock, par value $0.0001 per share — 75,000,000, 100,000,000 and 100,000,000 shares authorized as of December 31, 2011, 2012 and March 31, 2013 (unaudited); 2,695,291, 3,195,418 and 3,436,704 shares issued and outstanding as of December 31, 2011, 2012 and March 31, 2013 (unaudited), actual; 29,312,846 shares issued and outstanding as of March 31, 2013 pro forma (unaudited) |
— | — | — | 3 | |||||||||
Additional paid-in capital |
2,184 | 6,499 | 8,021 | 127,139 | |||||||||
Accumulated other comprehensive income |
119 | 145 | 183 | 183 | |||||||||
Accumulated deficit |
(47,816 | ) | (82,201 | ) | (91,725 | ) | (91,725 | ) | |||||
Total stockholders' equity |
61,308 | 43,564 | 35,600 | $ | 35,600 | ||||||||
Total liabilities and stockholders' equity |
$ | 79,738 | $ | 79,156 | $ | 75,866 | |||||||
See accompanying notes to consolidated financial statements.
F-3
MARKETO, INC.
Consolidated Statements of Operations and Comprehensive Loss
(in thousands, except per share data)
| |
Year Ended December 31, | Three Months Ended March 31, |
||||||||||||||
|---|---|---|---|---|---|---|---|---|---|---|---|---|---|---|---|---|
| |
2010
|
2011
|
2012
|
2012
|
2013
|
|||||||||||
| |
|
|
|
(unaudited) |
||||||||||||
Revenue: |
||||||||||||||||
Subscription and support |
$ | 13,473 | $ | 29,823 | $ | 52,756 | $ | 11,021 | $ | 17,555 | ||||||
Professional services and other |
559 | 2,569 | 5,657 | 1,190 | 2,181 | |||||||||||
Total revenue |
14,032 | 32,392 | 58,413 | 12,211 | 19,736 | |||||||||||
Cost of revenue(1): |
||||||||||||||||
Subscription and support |
4,612 | 9,386 | 16,216 | 3,135 | 5,820 | |||||||||||
Professional services and other |
2,534 | 5,550 | 8,442 | 1,805 | 2,618 | |||||||||||
Total cost of revenue |
7,146 | 14,936 | 24,658 | 4,940 | 8,438 | |||||||||||
Gross profit: |
||||||||||||||||
Subscription and support |
8,861 | 20,437 | 36,540 | 7,886 | 11,735 | |||||||||||
Professional services and other |
(1,975 | ) | (2,981 | ) | (2,785 | ) | (615 | ) | (437 | ) | ||||||
Total gross profit |
6,886 | 17,456 | 33,755 | 7,271 | 11,298 | |||||||||||
Operating expenses(1): |
||||||||||||||||
Research and development |
5,498 | 10,677 | 18,799 | 3,835 | 4,996 | |||||||||||
Sales and marketing |
11,019 | 23,088 | 37,776 | 7,819 | 12,318 | |||||||||||
General and administrative |
2,135 | 6,154 | 11,388 | 2,255 | 3,427 | |||||||||||
Total operating expenses |
18,652 | 39,919 | 67,963 | 13,909 | 20,741 | |||||||||||
Loss from operations |
(11,766 | ) | (22,463 | ) | (34,208 | ) | (6,638 | ) | (9,443 | ) | ||||||
Other income (expense), net |
(50 |
) |
(137 |
) |
(158 |
) |
(15 |
) |
(61 |
) |
||||||
Loss before provision for income taxes |
(11,816 | ) | (22,600 | ) | (34,366 | ) | (6,653 | ) | (9,504 | ) | ||||||
Provision for income taxes |
1 | 6 | 19 | 3 | 20 | |||||||||||
Net loss |
$ | (11,817 | ) | $ | (22,606 | ) | $ | (34,385 | ) | $ | (6,656 | ) | $ | (9,524 | ) | |
Net loss per share of common stock, basic and diluted |
$ | (5.99 | ) | $ | (9.94 | ) | $ | (12.26 | ) | $ | (2.60 | ) | $ | (2.99 | ) | |
Shares used in computing net loss per share of common stock, basic and diluted |
1,972 | 2,274 | 2,806 | 2,558 | 3,181 | |||||||||||
Pro forma net loss per share of common stock, basic and dilutive (unaudited): |
$ | (1.21 | ) | $ | (0.33 | ) | ||||||||||
Shares used in computing pro forma net loss per share of common stock, basic and diluted (unaudited) |
28,435 | 29,057 | ||||||||||||||
Comprehensive loss: |
||||||||||||||||
Net loss |
$ | (11,817 | ) | $ | (22,606 | ) | $ | (34,385 | ) | $ | (6,656 | ) | $ | (9,524 | ) | |
Other comprehensive income: |
||||||||||||||||
Foreign currency translation adjustments |
— | 119 | 26 | 10 | 38 | |||||||||||
Comprehensive loss |
$ | (11,817 | ) | $ | (22,487 | ) | $ | (34,359 | ) | $ | (6,646 | ) | $ | (9,486 | ) | |
- (1)
- Amounts include stock-based compensation expense as follows (see Note 10):
| |
Year Ended December 31, | Three Months Ended March 31, |
|||||||||||||||
|---|---|---|---|---|---|---|---|---|---|---|---|---|---|---|---|---|---|
| |
2010
|
2011
|
2012
|
2012
|
2013
|
||||||||||||
| |
|
|
|
(unaudited) |
|||||||||||||
Cost of subscription and support revenue |
$ | 50 | $ | 108 | $ | 216 | $ | 30 | $ | 63 | |||||||
Cost of professional services and other revenue |
8 | 49 | 169 | 31 | 93 | ||||||||||||
Research and development |
73 | 294 | 575 | 111 | 210 | ||||||||||||
Sales and marketing |
57 | 509 | 966 | 206 | 230 | ||||||||||||
General and administrative |
131 | 349 | 1,046 | 135 | 405 | ||||||||||||
Total stock-based compensation expense |
$ | 319 | $ | 1,309 | $ | 2,972 | $ | 513 | $ | 1,001 | |||||||
See accompanying notes to consolidated financial statements.
F-4
MARKETO, INC.
Consolidated Statements of Stockholders' Equity
(in thousands, except share data)
| |
Convertible Preferred Stock |
|
|
|
|
|
|
||||||||||||||||||
|---|---|---|---|---|---|---|---|---|---|---|---|---|---|---|---|---|---|---|---|---|---|---|---|---|---|
| |
Common Stock |
Additional Paid-in Capital |
Accumulated Other Comprehensive Income |
|
Total Stockholders' Equity |
||||||||||||||||||||
| |
Accumulated Deficit |
||||||||||||||||||||||||
| |
Shares
|
Amount
|
Shares
|
Amount
|
|||||||||||||||||||||
Balance as of December 31, 2009 |
15,379,850 | $ | 21,976 | 2,156,166 | $ | — | $ | 156 | — | $ | (13,393 | ) | $ | 8,739 | |||||||||||
Issuance of convertible preferred stock, net of issuance costs of $89 |
5,865,958 | 34,911 | — | — | — | — | — | 34,911 | |||||||||||||||||
Issuance of common stock upon exercise and early exercise of stock options |
— | — | 346,722 | — | 36 | — | — | 36 | |||||||||||||||||
Repurchase of common stock |
— | — | (95,000 | ) | — | — | — | — | — | ||||||||||||||||
Vesting of early exercised options |
— | — | — | — | 28 | — | — | 28 | |||||||||||||||||
Stock-based compensation expense |
— | — | — | — | 319 | — | — | 319 | |||||||||||||||||
Net loss |
— | — | — | — | — | — | (11,817 | ) | (11,817 | ) | |||||||||||||||
Balance as of December 31, 2010 |
21,245,808 | 56,887 | 2,407,888 | — | 539 | — | (25,210 | ) | 32,216 | ||||||||||||||||
Issuance of convertible preferred stock, net of issuance costs of $66 |
3,787,876 | 49,934 | — | — | — | — | — | 49,934 | |||||||||||||||||
Issuance of common stock upon exercise and early exercise of stock options |
— | — | 295,840 | — | 239 | — | — | 239 | |||||||||||||||||
Repurchase of common stock |
— | — | (8,437 | ) | — | — | — | — | — | ||||||||||||||||
Vesting of early exercised options |
— | — | — | — | 97 | — | — | 97 | |||||||||||||||||
Stock-based compensation expense |
— | — | — | — | 1,309 | — | — | 1,309 | |||||||||||||||||
Net loss |
— | — | — | — | — | — | (22,606 | ) | (22,606 | ) | |||||||||||||||
Foreign currency translation adjustments |
— | — | — | — | — | 119 | — | 119 | |||||||||||||||||
Balance as of December 31, 2011 |
25,033,684 | 106,821 | 2,695,291 | — | 2,184 | 119 | (47,816 | ) | 61,308 | ||||||||||||||||
Issuance of common stock and convertible preferred stock to acquire Crowd Factory, Inc. |
842,458 | 12,300 | 98,923 | — | 748 | — | — | 13,048 | |||||||||||||||||
Issuance of common stock upon exercise and early exercise of stock options |
— | — | 432,850 | — | 362 | — | — | 362 | |||||||||||||||||
Repurchase of common stock |
— | — | (31,646 | ) | — | — | — | — | — | ||||||||||||||||
Vesting of early exercised options |
— | — | — | — | 233 | — | — | 233 | |||||||||||||||||
Stock-based compensation expense |
— | — | — | — | 2,972 | — | — | 2,972 | |||||||||||||||||
Net loss |
— | — | — | — | — | — | (34,385 | ) | (34,385 | ) | |||||||||||||||
Foreign currency translation adjustments |
— | — | — | — | — | 26 | — | 26 | |||||||||||||||||
Balance as of December 31, 2012 |
25,876,142 | $ | 119,121 | 3,195,418 | $ | — | $ | 6,499 | $ | 145 | $ | (82,201 | ) | $ | 43,564 | ||||||||||
Issuance of common stock upon exercise and early exercise of stock options (unaudited) |
— | — | 247,796 | — | 265 | — | — | 265 | |||||||||||||||||
Repurchase of common stock (unaudited) |
— | — | (6,510 | ) | — | — | — | — | — | ||||||||||||||||
Vesting of early exercised options (unaudited) |
— | — | — | — | 256 | — | — | 256 | |||||||||||||||||
Stock-based compensation expense (unaudited) |
— | — | — | — | 1,001 | — | — | 1,001 | |||||||||||||||||
Net loss (unaudited) |
— | — | — | — | — | — | (9,524 | ) | (9,524 | ) | |||||||||||||||
Foreign currency translation adjustments (unaudited) |
— | — | — | — | — | 38 | — | 38 | |||||||||||||||||
Balance as of March 31, 2013 (unaudited) |
25,876,142 | $ | 119,121 | 3,436,704 | $ | — | $ | 8,021 | $ | 183 | $ | (91,725 | ) | $ | 35,600 | ||||||||||
See accompanying notes to consolidated financial statements.
F-5
MARKETO, INC.
Consolidated Statements of Cash Flows
(in thousands)
| |
Year Ended December 31, | Three Months Ended March 31, |
||||||||||||||
|---|---|---|---|---|---|---|---|---|---|---|---|---|---|---|---|---|
| |
2010
|
2011
|
2012
|
2012
|
2013
|
|||||||||||
| |
|
|
|
(unaudited) |
||||||||||||
CASH FLOWS FROM OPERATING ACTIVITIES: |
||||||||||||||||
Net loss |
$ | (11,817 | ) | $ | (22,606 | ) | $ | (34,385 | ) | $ | (6,656 | ) | $ | (9,524 | ) | |
Adjustments to reconcile net loss to net cash used in operating activities: |
||||||||||||||||
Depreciation and amortization |
349 | 644 | 1,731 | 250 | 806 | |||||||||||
Stock-based compensation expense |
319 | 1,309 | 2,972 | 513 | 1,001 | |||||||||||
Changes in operating assets and liabilities: |
||||||||||||||||
Accounts receivable, net |
(1,662 | ) | (5,030 | ) | (4,989 | ) | (3,368 | ) | (109 | ) | ||||||
Prepaid expenses and other current assets |
(514 | ) | (1,181 | ) | (203 | ) | (94 | ) | (1,848 | ) | ||||||
Other assets |
(41 | ) | (35 | ) | (505 | ) | (18 | ) | 164 | |||||||
Accounts payable |
359 | 2,248 | (1,624 | ) | 1,139 | 1,924 | ||||||||||
Accrued expenses and other current liabilities |
1,144 | 2,244 | 3,647 | (16 | ) | (1,296 | ) | |||||||||
Deferred revenue |
2,880 | 6,391 | 9,536 | 2,606 | 3,906 | |||||||||||
Deferred rent |
35 | 31 | (28 | ) | (13 | ) | 71 | |||||||||
Net cash used in operating activities |
(8,948 | ) | (15,985 | ) | (23,848 | ) | (5,657 | ) | (4,905 | ) | ||||||
CASH FLOWS FROM INVESTING ACTIVITIES: |
||||||||||||||||
Purchase of property and equipment |
(164 | ) | (1,675 | ) | (4,354 | ) | (531 | ) | (2,877 | ) | ||||||
Cash acquired in acquisition |
— | — | 698 | — | — | |||||||||||
Capitalized software development |
(367 | ) | — | — | — | — | ||||||||||
Net cash used in investing activities |
(531 | ) | (1,675 | ) | (3,656 | ) | (531 | ) | (2,877 | ) | ||||||
CASH FLOWS FROM FINANCING ACTIVITIES: |
||||||||||||||||
Proceeds from the sale of convertible preferred stock, net of issuance costs |
34,911 | 49,934 | — | — | ||||||||||||
Proceeds from issuance of common stock upon exercise of stock options |
189 | 464 | 912 | 152 | 490 | |||||||||||
Repurchase of unvested common stock from terminated employees |
(70 | ) | (2 | ) | (67 | ) | — | (2 | ) | |||||||
Proceeds from issuance of debt |
— | — | 3,640 | — | — | |||||||||||
Payment of deferred initial public offering costs |
— | — | (99 | ) | — | (794 | ) | |||||||||
Net cash provided by (used in) financing activities |
35,030 | 50,396 | 4,386 | 152 | (306 | ) | ||||||||||
Effect of foreign exchange rate changes on cash and cash equivalents |
— | 207 | (35 | ) | (23 | ) | 17 | |||||||||
NET INCREASE (DECREASE) IN CASH AND CASH EQUIVALENTS |
25,551 |
32,943 |
(23,153 |
) |
(6,059 |
) |
(8,071 |
) |
||||||||
CASH AND CASH EQUIVALENTS — Beginning of period |
8,906 | 34,457 | 67,400 | 67,400 | 44,247 | |||||||||||
CASH AND CASH EQUIVALENTS — End of period |
$ |
34,457 |
$ |
67,400 |
$ |
44,247 |
$ |
61,341 |
$ |
36,176 |
||||||
SUPPLEMENTAL DISCLOSURES OF CASH FLOW INFORMATION: |
||||||||||||||||
Cash paid for interest |
$ | — | $ | — | $ | 52 | $ | — | $ | 32 | ||||||
Cash paid for income taxes |
1 | — | 4 | 3 | 13 | |||||||||||
SUPPLEMENTAL DISCLOSURE OF NONCASH INVESTING AND FINANCING ACTIVITIES |
||||||||||||||||
Convertible preferred stock and common stock issued in connection with acquisition, including options assumed |
— | — | 13,048 | — | — | |||||||||||
Vesting of early exercise options |
28 | 97 | 233 | 41 | 256 | |||||||||||
Property and equipment acquired through tenant improvement allowance |
— | — | — | — | 929 | |||||||||||
See accompanying notes to consolidated financial statements.
F-6
MARKETO, INC.
Notes to Consolidated Financial Statements
1. The Company and Summary of Significant Accounting Policies and Estimates
Business
Marketo, Inc. ("Marketo" or the "Company") was incorporated in the state of California on January 20, 2006. The Company was reincorporated in the state of Delaware in 2010. The Company operates from its headquarters in San Mateo, California and has operating subsidiaries in Ireland and Australia.
Marketo is a provider of a cloud-based marketing software platform that enables organizations to engage in modern relationship marketing. The Company's software platform is designed to enable the effective management, optimization and analytical measurement of marketing activities, enabling organizations to acquire new customers more efficiently, build stronger relationships with existing customers, improve sales effectiveness and drive faster revenue growth. On this platform, the Company delivers an easy to use, integrated suite of advanced applications. The Company generally offers its services on an annual subscription basis with monthly, quarterly, or annual payment terms.
Principles of Consolidation
The consolidated financial statements are prepared in accordance with accounting principles generally accepted in the U.S. and include the consolidated accounts of the Company and its wholly-owned subsidiaries. All intercompany transactions and balances have been eliminated in consolidation.
Use of Estimates
The preparation of financial statements in conformity with accounting principles generally accepted in the United States of America requires management to make estimates and assumptions that affect the reported amounts of assets, liabilities and disclosure of contingent assets and liabilities at the date of the financial statements and the reported amounts of revenue and expenses during the reporting periods. Such management estimates and assumptions include the estimated selling price for the various elements in our customer contracts, the allowance for doubtful accounts, amounts collectible for sales tax, the fair value of common stock, stock-based compensation expense, useful lives of intangible assets and the valuation of deferred tax assets. Actual results could differ materially from those estimates, and such differences could be material to the financial statements and affect the results of operations reported in future periods.
Foreign Currency Translation
The functional currency of the Company's foreign subsidiaries is their respective local currency. Assets and liabilities denominated in currencies other than the U.S. dollar are translated into U.S. dollars at the exchange rates in effect at the balance sheet dates, with the resulting translation adjustments directly recorded to a separate component of accumulated other comprehensive income. Income and expense accounts are translated at average exchange rates during the year. Foreign currency remeasurement and transaction gains and losses are recorded in other income (expense), net. The Company recognized net foreign currency losses of $0, $126,000, $103,000, $12,000 and $27,000 during the years ended December 31, 2010, 2011, 2012 and for the three months ended March 31, 2012 (unaudited) and 2013 (unaudited), respectively. The effect of
F-7
MARKETO, INC.
Notes to Consolidated Financial Statements (Continued)
1. The Company and Summary of Significant Accounting Policies and Estimates (Continued)
foreign currency exchange rates on cash and cash equivalents was not material for any of the periods presented.
Unaudited Pro Forma Stockholders' Equity
The unaudited pro forma stockholders' equity as of March 31, 2013 presents stockholders' equity as though all of the Company's outstanding convertible preferred stock had automatically converted into 25,876,142 shares of common stock upon the completion of a qualified initial public offering (IPO). The shares of common stock issuable and the proceeds expected to be received in the IPO are excluded from such pro forma information.
Unaudited Interim Financial Information
The accompanying interim consolidated balance sheet as of March 31, 2013, the consolidated interim statements of operations and comprehensive loss and cash flows during the three months ended March 31, 2012 and 2013 and the interim consolidated statements of stockholders' equity during the three months ended March 31, 2013 are unaudited. The unaudited interim consolidated financial statements have been prepared on a basis consistent with the annual consolidated financial statements and, in the opinion of management, reflect all adjustments necessary to present fairly the Company's consolidated financial position as of March 31, 2013 and its consolidated statements of operations and comprehensive loss and cash flows during the three months ended March 31, 2012 and 2013. The financial data and other financial information disclosed in these notes to the consolidated financial statements related to the three months ended March 31, 2012 and 2013 are also unaudited.
Segments
The Company's chief operating decision maker is its Chief Executive Officer (CEO), who reviews financial information presented on a consolidated basis, accompanied by information about revenue by geographic region. Accordingly, the Company has determined that it has a single reportable segment.
Cash and Cash Equivalents
The Company considers all highly liquid investments purchased with original maturity of three months or less to be cash equivalents. Cash equivalents were $63.6 million, $42.5 million and $35.2 million as of December 31, 2011, 2012 and March 31, 2013 (unaudited), respectively, consisting primarily of money market funds.
Allowance for Doubtful Accounts
Trade accounts receivable are carried at the original invoiced amount less an allowance made for doubtful accounts. The Company maintains an allowance for doubtful accounts based on the probability of future collection. When management becomes aware of circumstances that may decrease the likelihood of collection, it records a specific allowance against amounts due, which reduces the net receivable to the amount that management reasonably believes will be collected. For all other customers, management determines the adequacy of the allowance based on historical loss patterns, the number of days that billings are past due and an evaluation of the
F-8
MARKETO, INC.
Notes to Consolidated Financial Statements (Continued)
1. The Company and Summary of Significant Accounting Policies and Estimates (Continued)
potential risk of loss associated with specific accounts. The Company reviews its allowance for doubtful accounts monthly and writes off receivable balances that are deemed to be uncollectible. Increases in the allowance are recorded in general and administrative expense in the period incurred. The Company does not have any off balance sheet credit exposure related to its customers.
Below is a summary of the changes in allowance for doubtful accounts for 2011, 2012 and the three months ended March 31, 2013 (in thousands):
| |
Balance at Beginning of Period |
Provision, net of Recoveries |
Write-offs
|
Balance at End of Period |
|||||||||
|---|---|---|---|---|---|---|---|---|---|---|---|---|---|
Year ended December 31, 2010 |
$ | 110 | $ | 206 | $ | (234 | ) | $ | 82 | ||||
Year ended December 31, 2011 |
82 | 321 | (178 | ) | 225 | ||||||||
Year ended December 31, 2012 |
225 | 362 | (251 | ) | 336 | ||||||||
Three months ended March 31, 2013 (unaudited) |
336 | 158 | (102 | ) | 392 | ||||||||
Property and Equipment
Property and equipment are stated at cost, less accumulated depreciation and amortization. Depreciation is computed using the straight-line method over the estimated useful lives of the asset, which is generally two to three years. Amortization of leasehold improvements is computed using the straight-line method over the shorter of the lease term or the estimated useful life of the asset or improvement. Depreciation and amortization begins when the asset is ready for its intended use. Cost of maintenance and repairs that do not improve or extend the lives of the respective assets are expensed as incurred.
Capitalized Software Development Costs
Costs incurred to develop the Company's cloud-based platform and applications consist of (a) certain external direct costs of materials and services incurred in developing or obtaining internal-use computer software and (b) payroll and payroll-related costs for employees who are directly associated with, and who devote time to, a given project. These costs generally consist of internal labor during configuration, coding and testing activities. Research and development costs incurred during the preliminary project stage or costs incurred for data conversion activities, training, maintenance and general and administrative or overhead costs are expensed as incurred. Capitalization begins when the preliminary project stage is complete, management with the relevant authority authorizes and commits to the funding of the software project, it is probable the project will be completed, and the software will be used to perform the functions intended and certain functional and quality standards have been met. Capitalized software development costs are amortized on a straight-line basis over the technology's estimated useful life of approximately three years. No software development costs were capitalized during 2011 or 2012. Amortization expense during the years ended December 31, 2010, 2011, 2012 and the three months ended March 31, 2012 (unaudited) and 2013 (unaudited) was $192,000, $181,000, $143,000, $43,000 and $34,000, respectively.
F-9
MARKETO, INC.
Notes to Consolidated Financial Statements (Continued)
1. The Company and Summary of Significant Accounting Policies and Estimates (Continued)
Costs incurred during the operating stage of the Company's software applications relating to upgrades and enhancements that resulted in added functionality are not capitalized because such upgrades and enhancements are essentially maintenance and, because upgrades and enhancements are provided frequently, do not have a useful life longer than one year. Costs that cannot be separated between maintenance of, and minor upgrades and enhancements to, internal-use software are expensed as incurred.
Goodwill and Other Intangible Assets
The Company records goodwill when the consideration paid in a purchase acquisition exceeds the fair value of the net tangible assets and the identified intangible assets acquired. Goodwill is not amortized, but rather is tested for impairment. The Company performs testing for impairment of goodwill at the end of each year, or as events occur or circumstances change that would more likely than not reduce the fair value of a reporting unit below its carrying amount. The Company conducts a two-step test for impairment of goodwill. The first step of the test for goodwill impairment compares the fair value of the applicable reporting unit with its carrying value. If the fair value of a reporting unit is less than the reporting unit's carrying value, the Company will perform the second step of the test for impairment of goodwill. During the second step of the test for impairment of goodwill, the Company compares the implied fair value of the reporting unit's goodwill with the carrying value of that goodwill. If the carrying value of the goodwill exceeds the calculated implied fair value, the excess amount will be recognized as an impairment loss. The Company has determined that there is a single reporting unit for the purpose of goodwill impairment tests. Based on the above, the Company determined that its goodwill was not impaired at December 31, 2012.
Other intangible assets, consisting of capitalized software development costs, developed technology, domain names, customer relationships and non-compete agreements, are stated at cost less accumulated amortization. All other intangible assets have been determined to have definite lives and are amortized on a straight-line basis over their estimated remaining economic lives, ranging from one to eight and one-half years. Amortization expense related to capitalized software development costs and developed technology is included in research and development expense. Amortization expense related to customer relationships and non-compete agreements is included in sales and marketing expense. Amortization expense related to domain names is included in general and administrative expense.
Long-Lived Assets
The Company continually monitors events and changes in circumstances that could indicate that carrying amounts of its long-lived assets, including property and equipment and identifiable intangible assets, may not be recoverable. When such events or changes in circumstances occur, the Company assesses the recoverability of long-lived assets by determining whether the carrying value of such assets will be recovered through their undiscounted expected future cash flow. If the future undiscounted cash flow is less than the carrying amount of these assets, the Company recognizes an impairment loss based on the excess of the carrying amount over the fair value of the assets. The Company did not recognize impairment charges on its long-lived assets during any of the periods presented.
F-10
MARKETO, INC.
Notes to Consolidated Financial Statements (Continued)
1. The Company and Summary of Significant Accounting Policies and Estimates (Continued)
Concentration of Credit Risk and Significant Customers
The Company's financial instruments that are exposed to concentrations of credit risk consist primarily of cash and cash equivalents and trade accounts receivable. Although the Company deposits it cash with multiple financial institutions, its deposits exceed federally insured limits. The Company generally does not require collateral from its customers and generally requires payment 30 days from the invoice date. The Company's accounts receivable are derived from revenue earned from customers located primarily in North America and Europe. The Company periodically evaluates the collectability of its accounts receivable and provides an allowance for potential credit losses as necessary, based on the age of the receivable and collection experience.
No single customer accounted for more than 10% of accounts receivable as of December 31, 2011, 2012 and March 31, 2013 (unaudited). No single customer accounted for 10% or more of total revenue during the years ended December 31, 2010, 2011 or 2012 and for the three months ended March 31, 2012 (unaudited) and 2013 (unaudited).
Revenue Recognition
The Company derives its revenue from two sources:
(1) Subscription and support revenue. Subscription and support revenue consists of subscription fees from customers accessing the Company's cloud-based software platform and applications, as well as related customer support services; and
(2) Professional services and other revenue. Professional services and other revenue consists of fees associated with providing expert services that educate and assist the Company's customers on the best use of the Company's solutions as well as assist in the implementation of the Company's solution.
Revenue recognition commences when all of the following conditions are met:
- •
- Persuasive evidence of an arrangement exists;
- •
- Delivery or performance has occurred;
- •
- Fees are fixed or determinable; and
- •
- Collectability is reasonably assured.
In the majority of instances, revenue from new customers is generated under sales agreements with multiple elements, comprised of subscription and support fees from customers accessing the Company's cloud-based platform and applications and professional consultation services. The Company evaluates each element in a multiple-element arrangement to determine whether it represents a separate unit of accounting. An element constitutes a separate unit of accounting when the delivered item has stand-alone value and delivery of the undelivered element is probable and within the Company's control. Subscription and support have stand-alone value because they are routinely sold separately by the Company. Most of the professional services have stand-alone value because the Company has sold professional services separately, and there are several third party vendors that routinely provide similar professional services to the Company's customers on a stand-alone basis. Prior to the fourth quarter of 2011, some of the Company's professional services did not have stand-alone value because they were sold together with the
F-11
MARKETO, INC.
Notes to Consolidated Financial Statements (Continued)
1. The Company and Summary of Significant Accounting Policies and Estimates (Continued)
subscription and support services. As such revenue was recognized ratably over the related subscription period, not to exceed billings amounts.
In October 2009, the Financial Accounting Standards Board (FASB) issued Accounting Standards Update No. 2009-13, Revenue Recognition (Topic 605): Multiple Deliverable Revenue Arrangements — a consensus of the FASB Emerging Issues Task Force (ASU 2009-13), which amended the previous multiple deliverable arrangements' accounting guidance. ASU 2009-13 amended the accounting standards for multiple-element revenue arrangements to:
- •
- Provide updated guidance on whether multiple deliverables exist, how the elements in an arrangement should be separated,
and how the consideration should be allocated;
- •
- Require an entity to allocate revenue in an arrangement using estimated selling prices (ESP) of each element if a vendor
does not have vendor specific objective evidence of selling price (VSOE) or third party evidence of selling price (TPE); and
- •
- Eliminate the use of the residual method and require a vendor to allocate revenue using the relative selling price method, which eliminated the requirement to have VSOE of fair value on undelivered elements for revenue recognition.
The Company adopted this accounting guidance prospectively beginning January 1, 2011, for applicable arrangements entered into or materially modified on or after January 1, 2011 (the beginning of the Company's fiscal year).
Prior to the adoption of ASU 2009-13, the Company was not able to establish VSOE of fair value for the undelivered elements, which in most instances was subscription and support services. As a result, the Company typically recognized subscription, support and professional services revenue ratably over the subscription and support contract period and presented subscription and support revenue and professional services revenue in the consolidated statements of operations and comprehensive loss based on the respective contractual prices.
As a result of the adoption of ASU 2009-13, the Company allocates total arrangement fees to each element in a multiple-element arrangement based on the relative selling price hierarchy of each element unless the fee allocated to the subscription and support under this method is less than the fee subject to refund if the performance conditions are not met. In these instances, since the professional services are generally completed prior to completion of the subscription and support, the allocation of the fee for subscription and support is at least equal to the contractual amounts subject to the performance condition.
The relative selling price hierarchy consists of the following: Selling price for a deliverable is based on its 1) VSOE, if available, 2) TPE, if VSOE is not available, or 3) ESP, if neither VSOE nor TPE is available. Because the Company has been unable to establish VSOE or TPE for the elements of its arrangements, the Company establishes the ESP for each element primarily by considering the median of actual sales prices of each type of subscription and support sold and the weighted average of actual sales prices of professional services sold. For subscription and support arrangements, management considered other factors such as database sizes, pricing practices and market considerations.
Subscription and support revenue is recognized commencing upon delivery of the Company's cloud-based services, which is the date a new subscription is provisioned and made available to a
F-12
MARKETO, INC.
Notes to Consolidated Financial Statements (Continued)
1. The Company and Summary of Significant Accounting Policies and Estimates (Continued)
new customer, or new or expanded capabilities are provisioned and added to an existing subscription, provided that all of the other revenue recognition criteria are first met, referred to as the "Commencement Date". Subscription and support revenue is recognized from the Commencement Date ratably thereafter over the remaining contractual term, which is generally three to 36 months. Amounts that have been invoiced are recorded in accounts receivable and in deferred revenue or revenue, depending on whether the revenue recognition criteria have been met.
Professional services and other have stand-alone value from the related subscription services. The majority of the Company's professional services contracts are offered on a time and material basis. When these services are not combined with subscription and support revenue in a multiple-element arrangement, services revenue is recognized as the services are rendered. In 2010 and 2011, the Company's professional services also consisted of a small number of fixed price contracts, where revenue is recognized on a proportional performance method, based on input measures, which include making reasonably dependable estimates of the total effort to complete the project. Certain standard and non-standard professional service arrangements include customer acceptance provisions. Services provided under arrangements that include customer acceptance provisions are typically provided on a time and material basis, and the revenue is deferred and recognized upon customer acceptance of the service deliverable.
The Company's professional services also consist of short-term implementation services, which are offered at a flat fee. The enablement services teams assist customers with standard adoption procedures for the Company's platform. Because such enablement services typically are completed within a short period (usually one to ten days), the Company recognizes revenue from this service upon completion. The implementation services consist of short-term (usually spanning approximately 90 days) "use it or lose it", services to assist customers with standard implementation and to implement the customer's first marketing campaign which are offered at a flat fee. Such flat fees are recognized ratably over the 90 day period.
Education revenue is recognized after the services are performed.
The Company's time and material and fixed price professional service contracts are generally delivered within one year from the date of the arrangement.
The Company has established processes to determine ESP, allocate revenue in multiple-element arrangements using ESP, and make reasonably dependable estimates of the proportional performance method for professional services. Had the Company not adopted ASU 2009-13 effective January 1, 2011, and recognized all arrangements ratably, the Company's revenue for the year ended December 31, 2011 would have been lower by approximately $453,000.
At December 31, 2011, the Company's deferred professional services under the previous accounting guidance were not significant.
Sales and other taxes collected from customers to be remitted to government authorities are excluded from revenue.
Cost of Revenue
Cost of subscriptions, support, professional services and other revenue are expensed as incurred. Cost of subscription and support revenue primarily consists of expenses related to hosting
F-13
MARKETO, INC.
Notes to Consolidated Financial Statements (Continued)
1. The Company and Summary of Significant Accounting Policies and Estimates (Continued)
the Company's service and providing support to the Company's customers. These expenses are comprised of data center operations costs and personnel and related costs directly associated with the Company's cloud infrastructure, customer support and customer success organizations, including salaries, benefits, bonuses and stock-based compensation, as well as allocated overhead. Overhead associated with facilities and depreciation, excluding depreciation related to the Company's data center infrastructure, is allocated to cost of revenue and operating expenses based on headcount. Cost of professional services and other revenue consists primarily of personnel and related costs directly associated with the Company's professional services and training organizations, including salaries, benefits, bonuses and stock-based compensation, the costs of sub-contracted third-party vendors, as well as allocated overhead.
The Company revised its 2011 cost of revenue to correctly classify $783,000 of costs from cost of professional services revenue and other to cost of subscription and support revenue.
Deferred Revenue
Deferred revenue consists of billings or payments received in advance of revenue recognition and are recognized as the revenue recognition criteria are met. The Company generally invoices its customers annually or in quarterly installments payable in advance. Accordingly, the deferred revenue balance does not represent the total contract value of annual or multi-year, noncancelable arrangements. The current portion of deferred revenue represents the amount that is expected to be recognized as revenue within one year from the balance sheet date. In all of the years presented, the Company did not have any long-term deferred revenue.
Commissions
Sales and marketing commissions are recognized as an expense generally at the time the customer order is signed. Substantially all of the effort by the sales and marketing organization is expended through the time of closing the sale with limited or no involvement thereafter. Commissions paid are subject to clawback by the Company in the event the customer fails to make payment on the agreement.
Warranties and Indemnification
The Company's cloud-based software platform and applications are typically warranted to perform in a manner consistent with general industry standards that are reasonably applicable and materially in accordance with the Company's on-line help documentation under normal use and circumstances.
The Company includes service level commitments to its customers warranting certain levels of uptime reliability and performance and permitting those customers to receive credits in the event that the Company fails to meet those levels. To date, the Company has not incurred any material costs as a result of such commitments and has not accrued any liabilities related to such obligations in the accompanying consolidated financial statements.
The Company's arrangements include provisions indemnifying customers against liabilities if the Company's products infringe a third-party's intellectual property rights. The Company has not incurred any costs as a result of such indemnification and has not accrued any liabilities related to such obligations in the accompanying consolidated financial statements.
F-14
MARKETO, INC.
Notes to Consolidated Financial Statements (Continued)
1. The Company and Summary of Significant Accounting Policies and Estimates (Continued)
The Company has also agreed to indemnify its directors and executive officers for costs associated with any fees, expenses, judgments, fines and settlement amounts incurred by any of those persons in any action or proceeding to which any of those persons is, or is threatened to be, made a party by reason of the person's service as a director or officer, including any action by the Company, arising out of that person's services as the Company's director or officer or that person's services provided to any other company or enterprise at the Company's request. The Company maintains director and officer insurance coverage that may enable the Company to recover a portion of any future indemnification amounts paid.
Advertising Costs
Advertising costs are expensed as incurred. For the years ended December 31, 2010, 2011 and 2012 advertising expenses were $637,000, $1.0 million and $1.2 million, respectively. For the three months ended March 31, 2012 (unaudited) and 2013 (unaudited), advertising expenses were $0.3 million and $0.2 million, respectively.
Stock-Based Compensation
The Company uses the fair value method for recording stock-based compensation. Share-based compensation cost for stock options is estimated at the grant date based on each option's fair-value as calculated by the Black-Scholes option-pricing model. The Company recognizes compensation cost for stock option grants on a straight-line basis over the requisite service period for the entire award.
Stock-based compensation cost for restricted stock units (RSUs) is measured based on the fair value of the underlying shares on the date of grant. RSUs are subject to a time-based vesting condition and a performance-based vesting condition, both of which must be satisfied before the RSUs are vested and settled for shares of common stock. The time-based vesting condition generally ranges from 2 to 4 years, and the performance-based vesting condition is satisfied upon the occurrence of a sale event or the completion of the Company's initial public offering. No expense related to these awards will be recognized unless the performance condition is satisfied. RSUs which have met the time-based vesting condition do not cancel when service to the Company is terminated; however, these shares will not vest until the performance-based vesting condition is met. RSUs that have not satisfied the time-based vesting condition as of termination of employment are automatically forfeited. The RSUs will expire 7 years from the grant date if not previously settled for shares of common stock.
Income Taxes
The provision for income taxes is computed using the asset and liability method, under which deferred tax assets and liabilities are recognized for the expected future tax consequences of temporary differences between the financial reporting and tax bases of assets and liabilities, and for operating losses and tax credit carryforwards. Deferred tax assets and liabilities are measured using the currently enacted tax rates that apply to taxable income in effect for the years in which those tax assets are expected to be realized or settled. The Company records a valuation allowance to reduce deferred tax assets to the amount that is believed more likely than not to be realized.
F-15
MARKETO, INC.
Notes to Consolidated Financial Statements (Continued)
1. The Company and Summary of Significant Accounting Policies and Estimates (Continued)
Compliance with income tax regulations requires the Company to make decisions relating to the transfer pricing of revenue and expenses between each of its legal entities that are located in several countries. The Company's determinations include many decisions based on management's knowledge of the underlying assets of the business, the legal ownership of these assets, and the ultimate transactions conducted with customers and other third parties. The calculation of the Company's tax liabilities involves dealing with uncertainties in the application of complex tax regulations in multiple tax jurisdictions. The Company may be periodically reviewed by domestic and foreign tax authorities regarding the amount of taxes due. These reviews may include questions regarding the timing and amount of deductions and the allocation of income among various tax jurisdictions. In evaluating the exposure associated with various filing positions, the Company records estimated reserves when it is more likely than not that an uncertain tax position will not be sustained upon examination by a taxing authority. Such estimates are subject to change. See Note 12, "Income Taxes".
Net Loss per Share Attributable to Common Stockholders
Basic and diluted net loss per share of common stock is presented in conformity with the two-class method required for participating securities. Holders of Series A, B, C, D, E, F and G convertible preferred stock are each entitled to receive noncumulative dividends out of any funds legally available, when, as and if declared by the board of directors, payable prior and in preference to any dividends on any shares of the Company's common stock. The dividend rates for Series A, B, C, D, E, F and G convertible preferred stock are $0.08, $0.12, $0.20, $0.379, $0.5326, $1.056, and $1.168 per share, respectively. In the event a dividend is paid to common stockholders, the holders of the Series A, B, C, D, E, F and G convertible preferred stock are entitled to a proportionate share of any such dividends as if they were holders of common stock (on an as-if converted basis).
Under the two-class method, net income (loss) attributable to common stockholders is determined by allocating undistributed earnings, calculated as net income less current period convertible preferred stock non-cumulative dividends, between common stock and preferred stock. In computing diluted net income (loss) attributable to common stockholders, undistributed earnings are re-allocated to reflect the potential impact of dilutive securities. Basic net income (loss) per share of common stock is computed by dividing the net income (loss) attributable to common stockholders by the weighted average number of common shares outstanding during the period. Unvested common shares resulting from the early exercises of stock options are excluded from the calculation of the weighted average common shares until they vest as they are subject to repurchase until they are vested. Those shares are added to the calculation of the weighted average common shares outstanding as they vest. Diluted net income per share attributable to common stockholders is computed by dividing net income attributable to common stockholders by the weighted average number of common shares outstanding, including potential dilutive common shares assuming the dilutive effect of potential common shares for the period determined using the treasury stock method. For purposes of this calculation, convertible preferred stock, options to purchase common stock and restricted stock units are considered to be potential dilutive common shares, but have been excluded from the calculation of diluted net loss per share of common stock as their effect is antidilutive for all periods presented.
F-16
MARKETO, INC.
Notes to Consolidated Financial Statements (Continued)
1. The Company and Summary of Significant Accounting Policies and Estimates (Continued)
Holders of convertible preferred stock did not have a contractual obligation to share in the losses of the Company.
Given the Company is in a loss position for all the periods presented, the Company has not allocated losses to any series of convertible preferred stock.
Pro Forma Net Loss per Common Stock (Unaudited)
In contemplation of an initial public offering, the Company has presented the unaudited pro forma basic and diluted net income per share of common stock for the year ended December 31, 2012 and the three months ended March 31, 2013 which has been computed to give effect to the automatic conversion of the convertible preferred stock into shares of common stock as of the beginning of the year.
2. Acquisition
On April 17, 2012, the Company completed its acquisition of Crowd Factory, Inc. (Crowd Factory). Crowd Factory is a SaaS social campaign management platform that helps marketers accelerate social and word-of-mouth marketing, grow their marketing databases with unique social profiles and attract new customers.
The transaction was valued at approximately $13.0 million, which included 842,458 shares of newly issued Series G convertible preferred stock valued at approximately $12.3 million, of which 12 percent or 101,095 shares, was withheld in escrow; 98,923 shares of common stock valued at approximately $453,000, of which 12 percent or 11,872 shares, was withheld in escrow; and the assumption of options to exercise 89,405 shares of common stock valued at approximately $295,100. Escrow shares were withheld for twelve months from acquisition date in order to protect the Company from certain indemnified losses that may arise from any inaccuracies or breach of any of Crowd Factory's general representations and warranties as of the acquisition date, other than certain fundamental representations.
The total purchase price was allocated to the net assets acquired based upon their fair values as of April 17, 2012 as set forth below. The excess of the purchase price over the net assets acquired was recorded as goodwill. The following table summarizes the preliminary estimated fair values of the assets and liabilities assumed at the acquisition date. The primary areas of those preliminary estimates that are not yet finalized related to income and non-income based taxes. The amounts are in thousands.
Net tangible assets acquired |
$ | 481 | ||
Intangible assets: |
||||
Developed technology |
1,300 | |||
Domain names |
700 | |||
Customer relationships |
900 | |||
Non-compete agreements |
130 | |||
Goodwill |
9,537 | |||
Total purchase price |
$ | 13,048 | ||
F-17
MARKETO, INC.
Notes to Consolidated Financial Statements (Continued)
2. Acquisition (Continued)
The Company paid change in control bonuses of approximately $850,000 to former Crowd Factory employees hired by Marketo which were expensed as incurred. These employees were also granted 308,218 RSUs valued at approximately $1.4 million under the terms described at Note 10 to the consolidated financial statements.
Intangible assets are being amortized on a straight-line basis over an estimated useful life ranging from two to eight and one-half years.
Each component of identifiable intangible assets acquired in connection with the above acquisition as of December 31, 2012 are as follows (dollar amounts in thousands):
| |
Estimated Fair Value |
Accumulated Amortization |
Net Carrying Amount |
Weighted Average Remaining Useful Life (in years) |
|||||||||
|---|---|---|---|---|---|---|---|---|---|---|---|---|---|
Developed technology |
$ | 1,300 | $ | 205 | $ | 1,095 | 3.8 | ||||||
Domain names |
700 | 71 | 629 | 6.3 | |||||||||
Customer relationships |
900 | 75 | 825 | 7.8 | |||||||||
Non-compete agreements |
130 | 46 | 84 | 1.3 | |||||||||
|
$ | 3,030 | $ | 397 | $ | 2,633 | |||||||
The expected future amortization expense for purchased intangible assets for each of the Company's years ending is as follows (amounts in thousands):
| |
Amount
|
|||
|---|---|---|---|---|
2013 |
$ | 560 | ||
2014 |
514 | |||
2015 |
495 | |||
2016 |
435 | |||
2017 |
206 | |||
2018 and beyond |
423 | |||
|
$ | 2,633 | ||
Pro forma results of operations have not been presented because the effect of this acquisition was not material to the consolidated financial statements.
F-18
MARKETO, INC.
Notes to Consolidated Financial Statements (Continued)
3. Goodwill and Intangible Assets
Goodwill and intangible assets, including those acquired in connection with the above acquisition, consisted of the following as of December 31, 2011 and 2012 (in thousands):
| |
December 31, 2011 |
Weighted Average Remaining Useful Life (in years) |
December 31, 2012 |
Weighted Average Remaining Useful Life (in years) |
|||||||||
|---|---|---|---|---|---|---|---|---|---|---|---|---|---|
Developed technology |
$ | — | — | $ | 1,300 | 3.8 | |||||||
Domain names |
— | — | 700 | 6.3 | |||||||||
Customer relationships |
— | — | 900 | 7.8 | |||||||||
Non-compete agreements |
— | — | 130 | 1.3 | |||||||||
Capitalized software development costs |
877 | 1.7 | 877 | 0.8 | |||||||||
|
877 | 3,907 | |||||||||||
Less accumulated amortization |
(633 | ) | (1,173 | ) | |||||||||
Intangible assets, net |
244 | 2,734 | |||||||||||
Goodwill |
— | 9,537 | |||||||||||
Goodwill and intangible assets, net |
$ | 244 | $ | 12,271 | |||||||||
Amortization expense related to intangible assets was $192,000, $181,000 and $540,000 in 2010, 2011 and 2012, respectively. Amortization expense related to intangible assets was $43,000 and $158,000 for the three months ended March 31, 2012 (unaudited) and 2013 (unaudited), respectively. Total future expected amortization is as follows for the following years ending December 31 (in thousands):
| |
Developed Technology |
Domain Names |
Customer Relationships |
Non-compete Agreements |
Capitalized Software Development Costs |
|||||||||||
|---|---|---|---|---|---|---|---|---|---|---|---|---|---|---|---|---|
2013 |
$ | 289 | $ | 100 | $ | 106 | $ | 65 | $ | 101 | ||||||
2014 |
289 | 100 | 106 | 19 | — | |||||||||||
2015 |
289 | 100 | 106 | — | — | |||||||||||
2016 |
228 | 100 | 106 | — | — | |||||||||||
2017 |
— | 100 | 106 | — | — | |||||||||||
2018 and beyond |
— | 129 | 295 | — | — | |||||||||||
|
$ | 1,095 | $ | 629 | $ | 825 | $ | 84 | $ | 101 | ||||||
4. Fair Value of Financial Instruments
The Company measures certain financial assets at fair value. Fair value is determined based upon the exit price that would be received to sell an asset or paid to transfer a liability in an orderly transaction between market participants, as determined by either the principal market or the most advantageous market. Inputs used in the valuation techniques to derive fair values are classified based on a three-level hierarchy, as follows:
- •
- Level 1 — Quoted prices in active markets for identical assets or liabilities.
F-19
MARKETO, INC.
Notes to Consolidated Financial Statements (Continued)
4. Fair Value of Financial Instruments (Continued)
- •
- Level 2 — Observable inputs other than Level 1 prices such as quoted prices for similar
assets or liabilities; quoted prices in markets with insufficient volume or infrequent transactions (less active markets); or model-derived valuations in which all significant inputs are observable or
can be derived principally from or corroborated by observable market data for substantially the full term of the assets or liabilities.
- •
- Level 3 — Unobservable inputs to the valuation methodology that are significant to the measurement of fair value of assets or liabilities.
The fair value of the Company's investments in certain money market funds is their face value. Such instruments are classified as Level 1 and are included in cash and cash equivalents. The Company considers all highly liquid investments purchased with a remaining maturity of three months or less to be cash equivalents.
For certain other financial instruments, including accounts receivable, accounts payable and other current liabilities, the carrying amounts approximate their fair value due to the relatively short maturity of these balances.
As of December 31, 2012 and March 31, 2013 (unaudited), financial assets stated at fair value on a recurring basis were comprised of money market funds included within cash and equivalents. The fair value of these financial assets was determined using the following inputs as of December 31, 2011, 2012 and March 31, 2013:
| |
December 31, 2011
|
December 31, 2012
|
|||||||||||||||||
|---|---|---|---|---|---|---|---|---|---|---|---|---|---|---|---|---|---|---|---|
| |
Level 1
|
Level 2
|
Level 3
|
Level 1
|
Level 2
|
Level 3
|
|||||||||||||
| |
(in thousands) |
||||||||||||||||||
Money market funds |
$ | 63,616 | — | — | $ | 42,446 | — | — | |||||||||||
Certificate of deposit |
25 | — | — | 25 | — | — | |||||||||||||
Total |
$ | 63,641 | — | — | $ | 42,471 | — | — | |||||||||||
| |
March 31, 2013 | |||||||||
|---|---|---|---|---|---|---|---|---|---|---|
| |
Level 1 | Level 2 | Level 3 | |||||||
| |
(in thousands, unaudited) |
|||||||||
Money market funds |
$ | 35,199 | $ | — | $ | — | ||||
Certificate of deposit |
25 | |||||||||
Total |
$ | 35,224 | $ | — | $ | — | ||||
F-20
MARKETO, INC.
Notes to Consolidated Financial Statements (Continued)
5. Balance Sheet Components
Cash and Cash Equivalents
Cash and cash equivalents consist of the following:
| |
December 31,
|
March 31, 2013
|
||||||||
|---|---|---|---|---|---|---|---|---|---|---|
| |
2011
|
2012
|
||||||||
| |
(in thousands) |
|||||||||
| |
|
|
(unaudited) |
|||||||
Cash |
$ | 3,759 | $ | 1,776 | $ | 952 | ||||
Cash equivalents |
||||||||||
Money market funds |
63,616 | 42,446 | 35,199 | |||||||
Certificate of deposit |
25 | 25 | 25 | |||||||
|
63,641 | 42,471 | 35,224 | |||||||
Total |
$ | 67,400 | $ | 44,247 | $ | 36,176 | ||||
Property and Equipment, Net
Property and equipment, net consists of the following:
| |
December 31,
|
March 31, 2013
|
||||||||
|---|---|---|---|---|---|---|---|---|---|---|
| |
2011
|
2012
|
||||||||
| |
(in thousands) |
|||||||||
| |
|
|
(unaudited) |
|||||||
Computer equipment |
$ | 549 | $ | 4,385 | $ | 4,969 | ||||
Software |
795 | 788 | 1,084 | |||||||
Office furniture |
343 | 803 | 944 | |||||||
Leasehold improvements |
459 | 986 | 2,187 | |||||||
Construction in progress |
— | 542 | 1,344 | |||||||
Total property and equipment |
2,146 | 7,504 | $ | 10,528 | ||||||
Less accumulated depreciation |
(696 | ) | (1,887 | ) | (2,532 | ) | ||||
Property and equipment, net |
$ | 1,450 | $ | 5,617 | $ | 7,996 | ||||
Depreciation expense was $157,000, $463,000, $1,191,000, $207,000 and $645,000 for the years ended December 31, 2010, 2011, 2012 and for the three months ended March 31, 2012 (unaudited) and 2013 (unaudited), respectively.
F-21
MARKETO, INC.
Notes to Consolidated Financial Statements (Continued)
5. Balance Sheet Components (Continued)
Accrued Expenses and Other Current Liabilities
Accrued expenses and other current liabilities are as follows:
| |
December 31,
|
March 31, 2013
|
||||||||
|---|---|---|---|---|---|---|---|---|---|---|
| |
2011
|
2012
|
||||||||
| |
(in thousands) |
|||||||||
| |
|
|
(unaudited) |
|||||||
Accrued bonuses, commissions and wages |
$ | 1,715 | $ | 4,737 | $ | 3,354 | ||||
Accrued vacation |
936 | 1,502 | 1,756 | |||||||
Liability payable for unvested stock options exercises |
271 | 523 | 488 | |||||||
Accrued legal, consulting and audit fees |
343 | 282 | 407 | |||||||
Accrued sales taxes |
348 | 543 | 475 | |||||||
Accrued marketing expenses |
199 | 395 | 659 | |||||||
Accrued other |
654 | 963 | 463 | |||||||
Total |
$ | 4,466 | $ | 8,945 | $ | 7,602 | ||||
Changes in Accumulated Other Comprehensive Income
Changes in accumulated other comprehensive income are as follows:
| |
Foreign Currency Items |
Total
|
|||||
|---|---|---|---|---|---|---|---|
| |
(in thousands, unaudited) |
||||||
Beginning balance at January 1, 2013 |
$ | 145 | $ | 145 | |||
Other comprehensive income before reclassfications |
38 | 38 | |||||
Amounts reclassified from accumulated other comprehensive income |
— | — | |||||
Ending balance at March 31, 2013 |
$ | 183 | $ | 183 | |||
6. Credit Facility
On May 21, 2012, the Company entered into a loan and security agreement with a bank related to an equipment facility providing the Company with an equipment line of up to $4.0 million. The interest rate associated with this equipment facility is the greater of 4% or three-quarters percentage points above the prime rate, as determined on the applicable funding date. The bank made equipment loan advances of approximately $3.6 million through both December 31, 2012 and March 31, 2013 (unaudited). For each equipment advance, the Company will pay interest only for approximately nine months. Subsequently, the Company will make thirty-six equal monthly payments of principal and interest. The equipment purchased under the agreement serves as the collateral for the loan. The Company is required to maintain $2.0 million in deposit accounts with
F-22
MARKETO, INC.
Notes to Consolidated Financial Statements (Continued)
6. Credit Facility (Continued)
the bank at all times and maintain certain monthly financial reporting covenants. The Company is in compliance with all of the covenants contained in the loan and securities agreement.
Contractual future repayments in relation to the above credit facility are as follows for the year ending December 31:
| |
Principal
|
Interest
|
Total
|
|||||||
|---|---|---|---|---|---|---|---|---|---|---|
| |
(in thousands) |
|||||||||
2013 |
$ | 582 | $ | 137 | $ | 719 | ||||
2014 |
1,188 | 102 | 1,290 | |||||||
2015 |
1,238 | 53 | 1,291 | |||||||
2016 |
632 | 9 | 641 | |||||||
2017 and beyond |
— | — | — | |||||||
Total |
$ | 3,640 | $ | 301 | $ | 3,941 | ||||
7. Commitments and Contingencies
Leases
The Company leases its office facilities in San Mateo, California, Portland, Oregon, Dublin, Ireland and Sydney, Australia under operating lease agreements expiring in 2016. Under terms of the leases, the Company is responsible for certain insurance, property taxes, and maintenance expenses. Rent expense for non-cancellable operating leases with scheduled rent increases is recognized on a straight line basis over the terms of the leases. The difference between required lease payments and rent expense has been recorded as deferred rent. Deferred rent as of December 31, 2011, 2012 and March 31, 2013 (unaudited), of $176,000, $148,000 and $1,150,000, respectively, are all long-term.
Rent expense under these operating leases was $346,000, $798,000, $1,488,000, $275,000 and $608,000 for the years ended December 31, 2010, 2011, 2012 and the three months ended March 31, 2012 (unaudited) and 2013 (unaudited), respectively.
As of December 31, 2012, the Company had no capital leases. Future minimum operating lease payments are as follows for the year ending December 31 (in thousands):
2013 |
$ | 2,367 | ||
2014 |
2,765 | |||
2015 |
3,014 | |||
2016 |
2,072 | |||
2017 and beyond |
— | |||
Total |
$ | 10,218 | ||
Contractual Commitments
Contractual agreements with third parties consist of co-location hosting services, software licenses, maintenance and support for our operations. Future payments for non-cancellable
F-23
MARKETO, INC.
Notes to Consolidated Financial Statements (Continued)
7. Commitments and Contingencies (Continued)
contractual agreements are $2.7 million, $616,000 and $113,000 in 2013, 2014 and 2015, respectively.
Legal Proceedings
From time to time, the Company may be involved in various legal proceedings arising from the normal course of business activities. The Company is not currently a party to any legal proceedings that would have a material adverse effect on its business.
8. Convertible Preferred Stock
On April 9, 2010, the Company completed the private placement and issuance of 2,110,300 shares of its Series D convertible preferred stock (Series D) for gross proceeds of approximately $10.0 million.
On November 15, 2010, the Company completed the private placement and issuance of 3,755,658 shares of its Series E convertible preferred stock (Series E) for gross proceeds of approximately $25.0 million.
On November 15, 2011, the Company completed the private placement and issuance of 3,787,876 shares of its Series F convertible preferred stock (Series F) for gross proceeds of approximately $50.0 million.
On April 17, 2012, the Company completed the acquisition of Crowd Factory. The purchase consideration included issuance of 842,458 shares of its Series G convertible preferred stock (Series G) valued at approximately $12.3 million.
The following table summarizes convertible preferred stock authorized and issued and outstanding as of December 31, 2011:
| |
Shares Authorized |
Shares Issued and Outstanding |
Net Proceeds |
Aggregate Liquidation Preference |
|||||||||
|---|---|---|---|---|---|---|---|---|---|---|---|---|---|
| |
|
|
(in thousands) |
||||||||||
Series A |
10,970,000 | 5,485,000 | $ | 5,487 | $ | 5,485 | |||||||
Series B |
14,492,754 | 7,246,376 | 9,946 | 10,000 | |||||||||
Series C |
5,296,950 | 2,648,474 | 6,543 | 6,600 | |||||||||
Series D |
4,220,603 | 2,110,300 | 9,971 | 10,000 | |||||||||
Series E |
7,511,318 | 3,755,658 | 24,940 | 25,000 | |||||||||
Series F |
7,575,758 | 3,787,876 | 49,934 | 50,000 | |||||||||
Total |
50,067,383 | 25,033,684 | $ | 106,821 | $ | 107,085 | |||||||
F-24
MARKETO, INC.
Notes to Consolidated Financial Statements (Continued)
8. Convertible Preferred Stock (Continued)
The following table summarizes convertible preferred stock authorized and issued and outstanding as of December 31, 2012 and March 31, 2013 (unaudited):
| |
Shares Authorized |
Shares Issued and Outstanding |
Net Proceeds |
Aggregate Liquidation Preference |
|||||||||
|---|---|---|---|---|---|---|---|---|---|---|---|---|---|
| |
|
|
(in thousands) |
||||||||||
Series A |
10,970,000 | 5,485,000 | $ | 5,487 | $ | 5,485 | |||||||
Series B |
14,492,754 | 7,246,376 | 9,946 | 10,000 | |||||||||
Series C |
5,296,950 | 2,648,474 | 6,543 | 6,600 | |||||||||
Series D |
4,220,603 | 2,110,300 | 9,971 | 10,000 | |||||||||
Series E |
7,511,318 | 3,755,658 | 24,940 | 25,000 | |||||||||
Series F |
7,575,758 | 3,787,876 | 49,934 | 50,000 | |||||||||
Series G |
1,684,930 | 842,458 | — | 12,300 | |||||||||
Total |
51,752,313 | 25,876,142 | $ | 106,821 | $ | 119,385 | |||||||
No cash proceeds were received from the issuance of 842,458 shares of the Company's Series G as such shares with aggregate value of approximately $12.3 million were issued in connection with the acquisition of Crowd Factory.
The rights, preference and privileges of the convertible preferred stock are as follows:
Dividends
The holders of the Series A, B, C, D, E, F and G convertible preferred stock are entitled to receive noncumulative dividends at the rate of $0.08, $0.12, $0.20, $0.379, $0.5326, $1.056 and $1.168 per share, per annum, respectively, when and if declared by the board of directors, prior and in preference to dividends on common stock. The holders of the Series A, B, C, D, E, F and G convertible preferred stock are also entitled to participate in dividends on common stock held on an as-if converted basis. No dividends on convertible preferred stock or common stock have been declared by the board of directors as of December 31, 2012 or March 31, 2013 (unaudited).
Liquidation Preferences
In the event of a liquidation or sale of the Company, either voluntary or involuntary, the holders of the Series A, B, C, D, E, F and G convertible preferred stock shall be entitled to receive, prior and in preference to any distribution to the holders of common stock, $1.00, $1.38, $2.492, $4.73866, $6.65662, $13.20 and $14.60 per share, respectively, plus all declared and unpaid dividends. If the assets legally available are insufficient to satisfy the entire liquidation preference of all series of convertible preferred stock, the funds will be distributed ratably to the holders of Series A, B, C, D, E, F and G convertible preferred stock. Any remaining assets beyond those needed to satisfy the liquidation preferences described above will be distributed pro rata among the holders of Marketo common stock and preferred stock (other than Series G preferred stock), assuming full conversion of such preferred stock into Marketo common stock, up to the applicable Participation Cap for holders of Marketo preferred stock. The "Participation Cap" is $3.00 for the Series A preferred stock, $4.14 for Series B preferred stock, $7.476 for Series C Preferred Stock, $14.21598 for Series D preferred stock, $19.96986 for Series E preferred stock and $39.60 for Series F preferred stock (each as adjusted for any stock splits, stock dividends, combinations,
F-25
MARKETO, INC.
Notes to Consolidated Financial Statements (Continued)
8. Convertible Preferred Stock (Continued)
subdivisions, recapitalizations or the like). The holders of Series G preferred stock (the preferred stock issued to holders of Company preferred stock in connection with Crowd Factory acquisition) will not have any liquidation preference participation rights. If there are assets available for distribution, after the applicable Participation Cap has been met for each relevant series of Marketo preferred stock, such assets will be distributed on a pro rata basis to the holders of Marketo common stock.
Conversion Rights
Each share of Series A, B, C, D, E, F and G convertible preferred stock is convertible at the option of the holder into shares of common stock at any time. The conversion rate for the Series A, B, C, D, E, F and G convertible preferred stock is equal to the quotient obtained by dividing the applicable original issue price by the applicable conversion price in effect at the time of conversion. The issue price for the Series A, B, C, D, E, F and G convertible preferred stock is $1.00, $1.38, $2.492, $4.73866, $6.65662, $13.20 and $14.60 per share, respectively, as adjusted for stock splits, stock dividends, combinations, subdivisions, recapitalizations or similar transactions. The conversion price of the Series A, B, C, D, E, F and G convertible preferred stock is equal to the applicable original issue price as adjusted for certain dilutive issuances, splits and combinations.
Each share of Series A, B, C, D, E, F and G convertible preferred stock automatically converts into shares of common stock at the then-effective conversion rate upon the Company's sale of its common stock in a firm commitment underwriting pursuant to a registration statement filed under the Securities Act of 1933, as amended, at an aggregate public offering price of not less than $40.0 million, provided, however, that any conversion of the Series E and F convertible preferred stock shall also require that the public offering price per share be not less than $13.31324 and $19.8, respectively (each as adjusted to reflect any stock splits, stock dividends, combinations, subdivisions, recapitalization or similar transactions). In addition, all shares of any given series of convertible preferred stock will automatically convert into shares of common stock upon a vote by the holders of a majority of the then outstanding shares holding such series (voting together as a single class).
Voting Rights
Holders of shares of Series A, B, C, D, E, F and G convertible preferred stock have voting rights equal to the number of shares of common stock into which their respective preferred shares are then convertible.
9. Common Stock Reserved for Issuance
As of December 31, 2012 and March 31, 2013 (unaudited), the Company was authorized to issue 100,000,000 common shares with a par value of $0.0001 per share. As of December 31,
F-26
MARKETO, INC.
Notes to Consolidated Financial Statements (Continued)
9. Common Stock Reserved for Issuance (Continued)
2010, 2011, 2012 and March 31, 2013, the Company had reserved shares of common stock, on an as-if-converted basis, for issuance as follows:
| |
December 31, | |
|||||||||||
|---|---|---|---|---|---|---|---|---|---|---|---|---|---|
| |
March 31, 2013 |
||||||||||||
| |
2010
|
2011
|
2012
|
||||||||||
| |
|
|
|
(unaudited) |
|||||||||
Exercise of stock options to purchase common stock |
2,350,977 | 4,587,344 | 6,581,481 | 7,982,829 | |||||||||
Issuances of shares available under stock option plans |
2,538,359 | 1,776,912 | 928,105 | 818,323 | |||||||||
Vesting of restricted stock units |
— | — | 328,466 | 345,614 | |||||||||
Conversion of convertible preferred stock |
21,245,808 | 25,033,684 | 25,876,142 | 25,876,142 | |||||||||
|
26,135,144 | 31,397,940 | 33,714,194 | 35,022,908 | |||||||||
10. Stock Option Plans
2006 Stock Plan
On October 5, 2006, the Company adopted the 2006 Stock Plan (the "Plan"). The Plan provides for the issuance of incentive stock options, non-statutory stock options, restricted stock awards and RSUs. Non-statutory stock options, restricted stock awards and RSUs may be granted to employees, outside directors and consultants, but only employees may be granted incentive stock options. The exercise price per share of all options granted under the Plan must equal at least 100% of the fair market value per share of the Company's common stock on the date of grant as determined by the Board of Directors. If, at the time the Company grants an incentive stock option, the optionee directly or by attribution owns stock possessing more than 10% of the total combined voting power of all classes of outstanding stock of the Company, the exercise price per share must be at least 110% of the fair market value per share of the Company's common stock on the date of grant and shall not be exercisable for more than five years after the date of grant. Except as noted above, options expire no more than 10 years after the date of grant, or earlier if services are terminated.
Option awards generally vest over a four year period, with 25% vesting after one year from date of grant and monthly thereafter. Options issued under the Plan may include an early exercise provision. In the event of termination, any unvested shares purchased are subject to repurchase by the Company at the original purchase price. This right of repurchase lapses as the option vests.
Beginning in 2012, the Company began to grant RSUs to certain employees. RSUs are subject to a time-based vesting condition and a performance-based vesting condition, both of which must be satisfied before the RSUs are vested and settled for shares of common stock. The time-based vesting condition generally ranges from 2 to 4 years, and the performance-based vesting condition is satisfied upon the occurrence of a sale event or the completion of the Company's initial public offering. No expense related to these awards will be recognized unless the performance condition is satisfied. RSUs which have met the time-based vesting condition do not cancel when service to the Company is terminated; however, these shares will not vest until the performance-based vesting condition is met. RSUs that have not satisfied the time-based vesting
F-27
MARKETO, INC.
Notes to Consolidated Financial Statements (Continued)
10. Stock Option Plans (Continued)
condition as of termination of employment are automatically forfeited. The RSUs will expire 7 years from the grant date if not previously settled for shares of common stock.
During 2011 and 2012, the Board of Directors increased the number of shares of common stock reserved for issuance under the Plan by 3,637,323 shares to a total of 9,434,548 shares. During the three months ended March 31, 2013 (unaudited), the Board of Directors increased the number of shares of common stock reserved for issuance under the Plan by a further 1,550,000 shares to a total of 10,984,548 shares. At December 31, 2011, 2012 and March 31, 2013 (unaudited), there were 1,776,912, 928,105 and 818,323 shares, respectively, available for grant under the Plan.
F-28
MARKETO, INC.
Notes to Consolidated Financial Statements (Continued)
10. Stock Option Plans (Continued)
A summary of the Company's stock option activity and related information for 2010, 2011, 2012 and for the three months ended March 31, 2013 (unaudited), is as follows:
| |
OPTIONS OUTSTANDING | |||||||||||||||
|---|---|---|---|---|---|---|---|---|---|---|---|---|---|---|---|---|
| |
Shares Available for Grant |
Number of Stock Options Outstanding |
Weighted- Average Exercise Price |
Weighted- Average Remaining Contractual Life (Years) |
Aggregate Intrinsic Value (in thousands) |
|||||||||||
Balance as of December 31, 2009 |
1,167,968 | 1,399,037 | $ | 0.41 | 5.48 | $ | 462 | |||||||||
Additional shares authorized |
2,574,053 | — | — | |||||||||||||
Granted |
(1,673,404 | ) | 1,673,404 | 1.47 | ||||||||||||
Exercised |
— | (346,722 | ) | 0.55 | ||||||||||||
Repurchased |
95,000 | — | 0.74 | |||||||||||||
Cancelled/forfeited |
374,742 | (374,742 | ) | 0.75 | ||||||||||||
Balance as of December 31, 2010 |
2,538,359 | 2,350,977 | 1.09 | 5.71 | $ | 3,042 | ||||||||||
Additional shares authorized |
1,762,323 | — | — | |||||||||||||
Granted |
(3,167,658 | ) | 3,167,658 | 2.47 | ||||||||||||
Exercised |
— | (295,840 | ) | 1.57 | ||||||||||||
Repurchased |
8,437 | — | 0.22 | |||||||||||||
Cancelled/forfeited |
635,451 | (635,451 | ) | 1.71 | ||||||||||||
Balance as of December 31, 2011 |
1,776,912 | 4,587,344 | 1.92 | 6.30 | $ | 10,629 | ||||||||||
Additional shares authorized |
1,875,000 | |||||||||||||||
Granted |
(3,364,447 | ) | 3,364,447 | 4.53 | ||||||||||||
Assumed grants |
(89,405 | ) | 89,405 | 5.46 | ||||||||||||
Exercised |
— | (432,850 | ) | 2.12 | ||||||||||||
Repurchased |
31,646 | — | 2.10 | |||||||||||||
RSUs granted, net of cancellations/forfeitures |
(328,466 | ) | — | |||||||||||||
Cancelled/forfeited |
1,026,865 | (1,026,865 | ) | 2.44 | ||||||||||||
Balance as of December 31, 2012 |
928,105 | 6,581,481 | 3.21 | 8.08 | $ | 11,431 | ||||||||||
Additional shares authorized |
1,550,000 | |||||||||||||||
Granted |
(1,753,499 | ) | 1,753,499 | 7.42 | ||||||||||||
Exercised |
— | (247,796 | ) | 1.98 | ||||||||||||
Repurchased |
6,510 | — | 0.34 | |||||||||||||
RSUs granted, net of cancellations/forfeitures |
(17,148 | ) | — | |||||||||||||
Cancelled/forfeited |
104,355 | (104,355 | ) | 3.38 | ||||||||||||
Balance as of March 31, 2013 (unaudited) |
818,323 | 7,982,829 | 4.17 | 8.30 | $ | 25,945 | ||||||||||
Exercisable as of December 31, 2011 |
4,096,373 | 1.92 | 8.80 | $ | 9,485 | |||||||||||
Vested and expected to vest as of December 31, 2011 |
3,813,963 | 1.85 | 6.28 | $ | 9,097 | |||||||||||
Exercisable as of December 31, 2012 |
6,108,872 | 3.16 | 8.04 | $ | 10,886 | |||||||||||
Vested and expected to vest as of December 31, 2012 |
5,910,677 | 3.12 | 7.97 | $ | 10,825 | |||||||||||
Exercisable as of March 31, 2013 (unaudited) |
7,711,784 | 4.17 | 8.33 | $ | 25,032 | |||||||||||
Vested and expected to vest as of March 31, 2013 (unaudited) |
7,087,179 | $ | 3.98 | 8.17 | $ | 24,357 | ||||||||||
The options exercisable as of December 31, 2011, 2012 and March 31, 2013 include options that are exercisable prior to vesting. The weighted average grant date fair value of options granted during the years ended December 31, 2010, 2011, 2012 and the three months ended March 31, 2012 (unaudited) and 2013 (unaudited) was $0.86, $1.77, $2.69, $2.49 and $4.00, respectively. Aggregate intrinsic value represents the difference between the estimated fair value of the underlying common stock and the exercise price of outstanding, in-the-money options. The total intrinsic value of options exercised was $99,000, $567,000, $948,000 and $1,182,000 for the years
F-29
MARKETO, INC.
Notes to Consolidated Financial Statements (Continued)
10. Stock Option Plans (Continued)
ended December 31, 2010, 2011, 2012 and the three months ended March 31, 2013 (unaudited), respectively. The total estimated grant date fair value of options vested during the years ended December 31, 2010, 2011, 2012 and the three months ended March 31, 2013 (unaudited) was $191,000, $740,000, $3,122,000 and $827,000, respectively.
Additional information regarding options outstanding as of December 31, 2012 is as follows:
Range of Exercise Prices |
Shares Outstanding |
Weighted Average Remaining Contractual Term |
Weighted Average Exercise Price |
Shares Exercisable |
Weighted Average Exercise Price |
|||||||||||||||
|---|---|---|---|---|---|---|---|---|---|---|---|---|---|---|---|---|---|---|---|---|
| $ | 0.12 | $ | 0.74 | 555,600 | 5.80 | $ | 0.38 | 555,600 | $ | 0.38 | ||||||||||
| 1.50 | 1.50 | 733,619 | 7.36 | 1.50 | 632,074 | 1.50 | ||||||||||||||
| 2.38 | 2.38 | 1,678,864 | 6.71 | 2.38 | 1,677,251 | 2.38 | ||||||||||||||
| 2.74 | 2.88 | 369,760 | 8.36 | 2.78 | 369,760 | 2.78 | ||||||||||||||
| 4.24 | 4.24 | 810,749 | 9.12 | 4.24 | 648,915 | 4.24 | ||||||||||||||
| 4.56 | 4.56 | 1,468,949 | 9.33 | 4.56 | 1,261,332 | 4.56 | ||||||||||||||
| 4.74 | 4.74 | 744,250 | 9.59 | 4.74 | 744,250 | 4.74 | ||||||||||||||
| 4.90 | 4.94 | 153,754 | 9.48 | 4.94 | 153,754 | 4.94 | ||||||||||||||
| 5.44 | 5.44 | 63,456 | 7.76 | 5.44 | 63,456 | 5.44 | ||||||||||||||
| 9.24 | 9.24 | 2,480 | 6.65 | 9.24 | 2,480 | 9.24 | ||||||||||||||
| 0.12 | 9.24 | 6,581,481 | 8.08 | 3.21 | 6,108,872 | 3.16 | ||||||||||||||
Additional information regarding options outstanding as of March 31, 2013 (unaudited) is as follows:
Range of Exercise Prices |
Shares Outstanding |
Weighted Average Remaining Contractual Term |
Weighted Average Exercise Price |
Shares Exercisable |
Weighted Average Exercise Price |
|||||||||||||||
|---|---|---|---|---|---|---|---|---|---|---|---|---|---|---|---|---|---|---|---|---|
| $ | 0.12 | $ | 1.50 | 1,146,605 | 6.71 | $ | 1.04 | 1,111,726 | $ | 1.02 | ||||||||||
| 2.38 | 2.38 | 1,567,812 | 6.25 | 2.38 | 1,567,812 | 2.38 | ||||||||||||||
| 2.74 | 4.24 | 1,131,274 | 8.65 | 3.79 | 1,036,938 | 3.75 | ||||||||||||||
| 4.56 | 4.56 | 1,453,699 | 9.08 | 4.56 | 1,311,869 | 4.56 | ||||||||||||||
| 4.74 | 4.74 | 742,750 | 9.34 | 4.74 | 742,750 | 4.74 | ||||||||||||||
| 4.90 | 4.90 | 16,755 | 6.37 | 4.90 | 16,755 | 4.90 | ||||||||||||||
| 4.94 | 4.94 | 121,999 | 9.57 | 4.94 | 121,999 | 4.94 | ||||||||||||||
| 5.44 | 5.44 | 63,456 | 7.52 | 5.44 | 63,456 | 5.44 | ||||||||||||||
| 7.42 | 7.42 | 1,735,999 | 9.83 | 7.42 | 1,735,999 | 7.42 | ||||||||||||||
| 9.24 | 9.24 | 2,480 | 6.41 | 9.24 | 2,480 | 9.24 | ||||||||||||||
| 0.12 | 9.24 | 7,982,829 | 8.30 | 4.17 | 7,711,784 | 4.17 | ||||||||||||||
F-30
MARKETO, INC.
Notes to Consolidated Financial Statements (Continued)
10. Stock Option Plans (Continued)
Restricted Stock Units
There was no RSU activity in 2010 or 2011. A summary of the Company's RSU activity and related information for 2012 and for the three months ended March 31, 2013 is as follows:
| |
Number of RSUs
|
Weighted Average Grant Date Fair Value |
Aggregate Intrinsic Value (in thousands) |
|||||||
|---|---|---|---|---|---|---|---|---|---|---|
Balance as of December 31, 2011 |
— | $ | — | $ | — | |||||
Additional shares authorized |
— | — | — | |||||||
RSUs Granted |
341,466 | 4.58 | — | |||||||
RSUs Exercised |
— | — | — | |||||||
RSUs Repurchased |
— | — | — | |||||||
RSUs Cancelled/Forfeited |
(13,000 | ) | 4.56 | |||||||
Balance as of December 31, 2012 |
328,466 | 4.58 | 2,437 | |||||||
RSUs Granted |
17,148 | 7.42 | — | |||||||
RSUs Exercised |
— | — | — | |||||||
RSUs Repurchased |
— | — | — | |||||||
RSUs Cancelled/Forfeited |
— | — | — | |||||||
Balance as of March 31, 2013 (unaudited) |
345,614 | 4.72 | 2,564 | |||||||
No RSUs vested in 2010, 2011, 2012 or the three months ended March 31, 2013. RSUs granted in 2012 and 2013 vest only upon satisfaction of both a time-based vesting condition, generally annually over two or four years, and a performance-based vesting condition. The performance-based vesting condition is met only on the occurrence of a sale event or the completion of the Company's Initial Public Offering (IPO). Stock-based compensation expense for the entire vesting period for the RSUs granted as of December 31, 2012 and March 31, 2013 (unaudited) adjusted for estimated future forfeitures, is approximately $1.5 million and $1.6 million, respectively, based on the fair value at the date of grant. Upon completion of a sale event or an IPO, the Company will record an expense for the vested portion of the RSUs.
Determining Fair Value of Stock Options
The Company uses the Black-Scholes pricing model to determine the fair value of stock options. The fair value of each option grant is estimated on the date of the grant. The fair value of the common stock underlying the stock options has historically been determined by the Company's board of directors. Because there has been no public market for the Company's common stock, the board of directors has determined the fair value of the common stock at the time of the option grant by considering a number of objective and subjective factors including valuations of comparable companies, sales of convertible preferred stock to unrelated third parties, operating and financial performance, lack of liquidity of capital stock and general and industry-specific economic outlook, amongst other factors. The fair value of the underlying common stock shall be determined by the board of directors until such time that the Company's common stock is listed on an established stock exchange or national market system. The fair value of options granted is
F-31
MARKETO, INC.
Notes to Consolidated Financial Statements (Continued)
10. Stock Option Plans (Continued)
estimated on the date of grant using the Black-Scholes pricing model and the following assumptions for the periods presented:
| |
Year Ended December 31, |
Three Months Ended March 31, |
||||||||||||
|---|---|---|---|---|---|---|---|---|---|---|---|---|---|---|
| |
2010
|
2011
|
2012
|
2012
|
2013
|
|||||||||
| |
|
|
|
(unaudited) |
||||||||||
Expected term (in years) |
6 | 6 | 6 | 6 | 6 | |||||||||
Risk-free interest rate |
2.18 | % | 2.14 | % | 1.02 | % | 1.09 | % | 1.09% - 1.18% | |||||
Expected volatility |
66 | % | 84 | % | 65 | % | 65 | % | 57% | |||||
Expected dividend rate |
0 | % | 0 | % | 0 | % | 0 | % | 0% | |||||
The assumptions are based on the following for each of the years presented.
Valuation Method — The Company estimates the fair value of its stock options using the Black-Scholes option-pricing model.
Expected Term — The Company estimates the expected term consistent with the simplified method identified by the Securities and Exchange Commission (SEC). The Company elected to use the simplified method because of its limited history of stock option exercise activity and its stock options meet the criteria of the "plain-vanilla" options as defined by the SEC. The simplified method calculates the expected term as the average of the vesting and contractual terms of the award.
Volatility — Since the Company has no trading history by which to determine the volatility of its own common stock price, the expected volatility being used is derived from the historical stock volatilities of a representative industry peer group of comparable publicly listed companies over a period approximately equal to the expected term of the options.
Risk Free Interest Rate — The risk free interest rate is based on U.S. Treasury zero coupon issues with remaining terms similar to the expected term on the options.
Expected Dividend — The Company has never declared or paid any cash dividends and does not plan to pay cash dividends in the foreseeable future, and, therefore, used an expected dividend yield of zero in the valuation model.
Forfeiture — The Company estimates forfeitures at the time of grant and revises those estimates in subsequent periods if actual forfeitures differ from those estimates. The Company uses historical data to estimate pre-vesting forfeitures and records stock-based compensation expense only for those awards that are expected to vest. All stock-based payment awards are amortized on a straight-line basis over the requisite service periods of the awards, which are generally the vesting periods. If the Company's actual forfeiture rate is materially different from its estimate, the stock-based compensation expense could be significantly different from what the Company has recorded in the current period.
Stock-based compensation expense included in operating results amounted to approximately $319,000, $1,309,000, $2,972,000, $513,000 and $1,001,000 for the years ended December 31, 2010, 2011, 2012 and the three months ended March 31, 2012 (unaudited) and 2013 (unaudited), respectively.
F-32
MARKETO, INC.
Notes to Consolidated Financial Statements (Continued)
10. Stock Option Plans (Continued)
As of December 31, 2012 and March 31, 2013, total unrecognized compensation cost, adjusted for estimated forfeitures, was as follows:
| |
December 31, 2012 | March 31, 2013 | ||||||||
|---|---|---|---|---|---|---|---|---|---|---|
| |
Unrecognized Expense |
Average Expected Recognition Period |
Unrecognized Expense |
Average Expected Recognition Period |
||||||
| |
(in thousands) |
(in years) |
(in thousands) |
(in years) |
||||||
| |
|
|
(unaudited) |
|||||||
Stock options |
$ | 7,880 | 2.93 | $ | 12,086 | 3.08 | ||||
Restricted stock units |
1,505 | (a) | 1,633 | (a) | ||||||
Total unrecognized stock-based compensation expense |
$ | 9,385 | $ | 13,719 | ||||||
- (a)
- The Company will record an expense for the vested portion of the RSUs upon completion of a sale event or an IPO.
11. Net Loss per Share
Basic net loss per share is computed by dividing the net loss by the weighted-average number of shares of common stock outstanding during the period, less the weighted-average unvested common stock subject to repurchase or forfeiture as they are not deemed to be issued for accounting purposes. Diluted net loss per share is computed by giving effect to all potential shares of common stock, including preferred stock, stock options and RSUs, to the extent they are dilutive.
The following table sets forth the computation of the Company's basic and diluted net loss per share of common stock under the two-class method attributable to common stockholders during
F-33
MARKETO, INC.
Notes to Consolidated Financial Statements (Continued)
11. Net Loss per Share (Continued)
the years ended December 31, 2010, 2011, 2012 and the three months ended March 31, 2012 and 2013:
| |
Year ended December 31,
|
Three Months Ended March 31, |
||||||||||||||
|---|---|---|---|---|---|---|---|---|---|---|---|---|---|---|---|---|
| |
2010
|
2011
|
2012
|
2012
|
2013
|
|||||||||||
| |
(in thousands, except per share data) |
|||||||||||||||
| |
|
|
|
(unaudited) |
||||||||||||
Numerator: |
||||||||||||||||
Net loss |
$ | (11,817 | ) | $ | (22,606 | ) | $ | (34,385 | ) | $ | (6,656 | ) | $ | (9,524 | ) | |
Denominator: |
||||||||||||||||
Weighted-average common shares outstanding |
2,338 | 2,489 | 2,934 | 2,715 | 3,335 | |||||||||||
Less: Weighted-average unvested common shares subject to repurchase or forfeiture |
(366 | ) | (215 | ) | (128 | ) | (157 | ) | (154 | ) | ||||||
Weighted-average shares used in computing net loss per share of common stock, basic and diluted |
1,972 | 2,274 | 2,806 | 2,558 | 3,181 | |||||||||||
Net loss per share of common stock, basic and diluted |
$ | (5.99 | ) | $ | (9.94 | ) | $ | (12.26 | ) | $ | (2.60 | ) | $ | (2.99 | ) | |
The Company applied the two-class method to calculate its basic and diluted net loss per share of common stock, as its convertible preferred stock and common stock subject to repurchase are participating securities. The two-class method is an earnings allocation formula that treats a participating security as having rights to earnings that otherwise would have been available to common shareholders. However, the two-class method does not impact the net loss per share of common stock as the Company was in a loss position for each of the periods presented and preferred shareholders do not have to participate in losses.
Additionally, since the Company was in a loss position for each of the periods presented, diluted net loss per share is the same as basic net loss per share for each periods as the inclusion of all potential common shares outstanding would have been anti-dilutive. Potentially dilutive
F-34
MARKETO, INC.
Notes to Consolidated Financial Statements (Continued)
11. Net Loss per Share (Continued)
securities that were excluded from the diluted per share calculation because they would have been antidilutive were as follows:
| |
Year Ended December 31,
|
Three Months Ended March 31, |
||||||||||||||
|---|---|---|---|---|---|---|---|---|---|---|---|---|---|---|---|---|
| |
2010
|
2011
|
2012
|
2012
|
2013
|
|||||||||||
| |
|
|
|
(unaudited) |
||||||||||||
Convertible preferred stock |
21,245,808 | 25,033,684 | 25,876,142 | 25,033,684 | 25,876,142 | |||||||||||
Stock options to purchase common stock |
2,350,977 | 4,587,344 | 6,581,481 | 5,204,813 | 7,982,829 | |||||||||||
Common stock held in escrow |
— | — | 11,872 | — | 11,872 | |||||||||||
Common stock subject to repurchase |
349,684 | 226,688 | 148,060 | 197,076 | 143,153 | |||||||||||
Restricted stock units |
— | — | 328,466 | — | 345,614 | |||||||||||
|
23,946,469 | 29,847,716 | 32,946,021 | 30,435,573 | 34,359,610 | |||||||||||
The following table sets forth the computation of the Company's unaudited pro forma basic and diluted net loss per share for the year ended December 31, 2012 and the three months ended March 31, 2013:
| |
Year Ended December 31, 2012 |
Three Months Ended March 31, 2013 |
|||||
|---|---|---|---|---|---|---|---|
| |
(in thousands, except for per share amounts) |
||||||
Numerator: |
|||||||
Net loss used in computing pro forma basic and diluted net loss per share |
$ | (34,385 | ) | $ | (9,524 | ) | |
Basic and diluted shares: |
|||||||
Weighted-average common shares outstanding |
2,934 | 3,335 | |||||
Less: Weighted-average unvested common shares subject to repurchase or forfeiture |
(128 | ) | (154 | ) | |||
Pro forma weighted-average adjustment to reflect assumed conversion of preferred stock to common stock |
25,629 | 25,876 | |||||
Pro forma basic and diluted shares |
28,435 | 29,057 | |||||
Pro forma basic and diluted net loss per share |
$ | (1.21 | ) | $ | (0.33 | ) | |
RSUs are subject to a time-based vesting condition and a performance-based vesting condition, both of which must be satisfied before the RSUs are vested and settled for shares of common stock. No pro forma adjustment has been made at December 31, 2012 and March 31, 2013 to show the effect as if the satisfaction of the performance-based vesting condition
F-35
MARKETO, INC.
Notes to Consolidated Financial Statements (Continued)
11. Net Loss per Share (Continued)
(occurrence of a sale event or the completion of the Company's initial public offering) had occurred as of the original date of issuance since no RSUs had met the time-based vesting condition at December 31, 2012 and March 31, 2013.
12. Income Taxes
Income Tax Provision:
Pretax loss was as follows:
| |
Year Ended December 31,
|
|||||||||
|---|---|---|---|---|---|---|---|---|---|---|
| |
2010
|
2011
|
2012
|
|||||||
| |
(in thousands) |
|||||||||
Loss before provision for income taxes: |
||||||||||
Domestic |
$ | (11,816 | ) | $ | (20,295 | ) | $ | (29,119 | ) | |
Foreign |
— | (2,305 | ) | (5,247 | ) | |||||
Total |
$ | (11,816 | ) | $ | (22,600 | ) | $ | (34,366 | ) | |
The provision for income taxes consists of the following:
| |
Year Ended December 31,
|
|||||||||
|---|---|---|---|---|---|---|---|---|---|---|
| |
2010
|
2011
|
2012
|
|||||||
| |
(in thousands) |
|||||||||
Current tax provision: |
||||||||||
Federal |
— | — | — | |||||||
State |
$ | 1 | $ | 6 | $ | 3 | ||||
Foreign |
— | — | 16 | |||||||
Total current tax provision |
1 | 6 | 19 | |||||||
Deferred tax provision |
— | — | — | |||||||
Total provision for income taxes |
$ | 1 | $ | 6 | $ | 19 | ||||
The items accounting for the difference between income taxes computed at the federal statutory rate and the provision for income taxes consist of the following:
| |
Year Ended December 31,
|
|||||||||
|---|---|---|---|---|---|---|---|---|---|---|
| |
2010
|
2011
|
2012
|
|||||||
Federal statutory rate |
34.00 | % | 34.00 | % | 34.00 | % | ||||
Stock-based compensation |
(0.42 | ) | (0.86 | ) | (1.54 | ) | ||||
Valuation allowance |
(38.66 | ) | (31.06 | ) | (26.85 | ) | ||||
Foreign rate differential |
0.00 | (3.47 | ) | (5.24 | ) | |||||
Federal research and development credit |
1.93 | 1.51 | 0.00 | |||||||
Other |
3.15 | (0.15 | ) | (0.43 | ) | |||||
Effective income tax rate |
0.00 | % | (0.03 | )% | (0.06 | )% | ||||
F-36
MARKETO, INC.
Notes to Consolidated Financial Statements (Continued)
12. Income Taxes (Continued)
Deferred tax assets and liabilities:
The components of deferred tax assets and liabilities are as follows:
| |
Year Ended December 31,
|
|||||||||
|---|---|---|---|---|---|---|---|---|---|---|
| |
2010
|
2011
|
2012
|
|||||||
| |
(in thousands) |
|||||||||
Deferred tax assets: |
||||||||||
Accounts receivable principally due to allowance for doubtful accounts |
$ | 32 | $ | 90 | $ | 107 | ||||
Compensated absences, principally due to accruals for financial reporting purposes |
158 | 366 | 1,604 | |||||||
Net operating loss carryforwards |
9,140 | 16,570 | 30,251 | |||||||
Federal tax credits |
442 | 783 | 783 | |||||||
State tax credits |
280 | 508 | 771 | |||||||
Other deductible temporary differences |
213 | 487 | 521 | |||||||
Stock-based compensation |
70 | 351 | 792 | |||||||
Deferred revenue |
47 | — | — | |||||||
Total deferred tax assets |
10,382 | 19,155 | 34,829 | |||||||
Deferred tax liabilities: |
||||||||||
Capitalized software development |
(164 | ) | (98 | ) | (37 | ) | ||||
Acquired intangible assets |
— | — | (964 | ) | ||||||
Total deferred tax liability |
(164 | ) | (98 | ) | (1,001 | ) | ||||
Valuation allowance |
(10,218 | ) | (19,057 | ) | (33,828 | ) | ||||
Net deferred taxes |
$ | — | $ | — | $ | — | ||||
The net valuation allowance increased by $8.8 million and $14.8 million for the years ended December 31, 2011 and 2012, respectively.
As of December 31, 2011 and 2012, the Company's deferred tax assets (net of deferred tax liabilities and valuation allowance) was zero. The deferred tax assets consist primarily of the federal and state net operating loss and research and development credit carryforwards. Realization of deferred tax assets is dependent upon future taxable income, if any, the amount and timing of which are uncertain. In assessing the realizability of deferred tax assets, management determined that it is more likely than not that no deferred tax assets will be realized. Therefore, the Company has provided a full valuation allowance against these deferred tax assets.
The Company has not provided for withholding taxes on the undistributed earnings of its foreign subsidiaries because the Company intends to reinvest such earnings indefinitely. As of December 31, 2012, the cumulative amount of undistributed earnings considered permanently reinvested was not material.
F-37
MARKETO, INC.
Notes to Consolidated Financial Statements (Continued)
12. Income Taxes (Continued)
The Company had net operating loss carryforwards as follows:
| |
Year Ended December 31,
|
|||||||||
|---|---|---|---|---|---|---|---|---|---|---|
| |
2010
|
2011
|
2012
|
|||||||
| |
(in thousands) |
|||||||||
Federal |
$ | 23,958 | $ | 41,554 | $ | 73,491 | ||||
California |
21,592 | 40,278 | 68,906 | |||||||
Foreign |
— | 2,111 | 6,791 | |||||||
Total |
$ | 45,550 | $ | 83,943 | $ | 149,188 | ||||
Net operating loss carryforwards are available to offset future federal, California and foreign taxable income. Federal and California net operating loss carryforwards begin to expire in 2026 and 2016, respectively. Foreign net operating loss carryforwards do not expire.
The Company had research and development credit carryforwards as follows:
| |
Year Ended December 31,
|
|||||||||
|---|---|---|---|---|---|---|---|---|---|---|
| |
2010
|
2011
|
2012
|
|||||||
| |
(in thousands) |
|||||||||
Federal |
$ | 442 | $ | 783 | $ | 783 | ||||
California |
424 | 770 | 1,169 | |||||||
Total |
$ | 866 | $ | 1,553 | $ | 1,952 | ||||
Federal and California research and development tax credit carryforwards are available to reduce future regular income taxes. Federal research and development credit carryforwards begin to expire in 2026. California research and development tax credit carryforwards do not expire.
According to the American Taxpayer Relief Act of 2012 signed into law on January 3, 2013, the federal research credit, which was allowed to expire on January 1, 2012, was retroactively extended through 2013. The entire benefit for the retroactive extension (January 1 through December 31, 2012) will be reflected discretely in the first period which includes the January 3, 2013 enactment.
The entire benefit of approximately $345,000 for the retroactive extension (January 1 - December 31, 2012) was recorded in the quarter ended March 31, 2013 (unaudited). Concurrent with recording of the benefit, a valuation allowance was recorded in the same amount, resulting in a net financial impact of zero for the quarter ended March 31, 2013 (unaudited).
Federal and California laws impose restrictions on the utilization of net operating loss carryforwards and research and development credit carryforwards in the event of a change in ownership of the Company, which constitutes an "ownership change" as defined by Internal Revenue Code Sections 382 and 383. The Company experienced ownership changes in the past that do not materially impact the availability of its net operating losses and tax credits. The amounts reflected in the above tables reflect reduction of approximately $1.2 million of net operating losses and $8,000 of research and development credits as a result of previous ownership changes that the Company experienced. Nevertheless, should there be an ownership change in the future, the Company's ability to utilize existing carryforwards could be substantially restricted.
F-38
MARKETO, INC.
Notes to Consolidated Financial Statements (Continued)
12. Income Taxes (Continued)
Company files tax returns in the US, certain states, Ireland and Australia. All of the tax years, from the date of inception, are open for examination.
Uncertain Tax Positions
The Company accounts for uncertainty in income taxes in accordance with ASC 740. Tax positions are evaluated in a two-step process. The Company first determines whether it is more likely than not that a tax position will be sustained upon examination by the tax authority, including resolutions of any related appeals or litigation processes, based on technical merit. If a tax position meets the more-likely-than-not recognition threshold it is then measured to determine the amount of benefit to recognize in the financial statements. The tax position is measured as the largest amount of benefit that is greater than 50% likely of being realized upon ultimate settlement.
The Company has no unrecognized tax benefits in any of the periods presented.
The Company does not expect any significant change in its unrecognized tax benefits during the next twelve months.
13. Segment Information and Information about Geographic Areas
The accounting principles guiding disclosures about segments of an enterprise and related information establishes standards for the reporting by business enterprises of information about operating segments, products and services, geographic areas, and major customers. The method of determining which information is reported is based on the way that management organizes the operating segments within the Company for making operational decisions and assessments of financial performance. The Company's chief operating decision maker (the CODM) is considered to be the Company's chief executive officer (CEO). The CODM reviews financial information presented on a consolidated basis for purposes of making operating decisions and assessing financial performance. As such, the Company is determined to be operating in one business segment.
All of the Company's principal operations and decision-making functions are located in the United States.
Revenue
The following table set forth the Company's total revenue by geographic areas for the years ended December 31, 2010, 2011, 2012 and for the three months ended March 31, 2012 and 2013, as determined based on the billing address of the customer.
| |
Year Ended December 31,
|
Three Months Ended March 31, |
||||||||||||||
|---|---|---|---|---|---|---|---|---|---|---|---|---|---|---|---|---|
| |
2010
|
2011
|
2012
|
2012
|
2013
|
|||||||||||
| |
(in thousands) |
|||||||||||||||
| |
|
|
|
(unaudited) |
||||||||||||
United States |
$ | 12,551 | $ | 28,913 | $ | 50,910 | $ | 10,825 | $ | 16,992 | ||||||
EMEA |
640 | 1,538 | 3,686 | 687 | 1,407 | |||||||||||
Other |
841 | 1,941 | 3,817 | 699 | 1,337 | |||||||||||
Total |
$ | 14,032 | $ | 32,392 | $ | 58,413 | $ | 12,211 | $ | 19,736 | ||||||
F-39
MARKETO, INC.
Notes to Consolidated Financial Statements (Continued)
13. Segment Information and Information about Geographic Areas (Continued)
No customer accounted for more than 10% of our total revenue in 2010, 2011, 2012 and for the three months ended March 31, 2012 (unaudited) and 2013 (unaudited).
Long-lived Assets
The following table set forth the Company's long-lived assets by geographic areas as of December 31, 2011, 2012 and March 31, 2013:
| |
December 31,
|
March 31, 2013 |
||||||||
|---|---|---|---|---|---|---|---|---|---|---|
| |
2011
|
2012
|
||||||||
| |
(in thousands) |
|||||||||
| |
|
|
(unaudited) |
|||||||
United States |
$ | 1,199 | $ | 5,369 | $ | 7,753 | ||||
EMEA |
251 | 248 | 242 | |||||||
Other |
— | — | 1 | |||||||
Total |
$ | 1,450 | $ | 5,617 | $ | 7,996 | ||||
14. Subsequent Events
2006 Stock Plan
In February 2013, the Board of Directors and stockholders of the Company approved the amendment of the 2006 Stock Plan (Plan) to increase the maximum number of shares of common stock authorized for issuance over the term of the Plan by 1,550,000 shares to 10,984,548 shares.
Reverse Stock Split
On May 3, 2013, the Company effected a one-for-two reverse stock split of the Company's common stock and preferred stock. Upon the effectiveness of the reverse stock split, each two outstanding shares of common stock and each two outstanding shares of preferred stock, were exchanged into one share of common stock and one share of preferred stock, respectively. The reverse stock split also applied to any outstanding securities or rights convertible into, or exchangeable or exercisable for, common stock or preferred stock of the Company. Unless otherwise indicated, all share numbers, share prices and exercise prices (except shares authorized and par values) have been adjusted to reflect the stock split on a retroactive basis.
2013 Equity Incentive Plan
On May 1, 2013, the Company adopted a 2013 Equity Incentive Plan (2013 Plan) which will be effective one business day prior to the effective date of the registration statement for the Company's initial public offering. A total of 2,952,130 shares of common stock is reserved for issuance pursuant to the 2013 Plan. The 2013 Plan provides for an annual increase in the number of shares available for issuance on the first day of each fiscal year beginning in 2014.
2013 Employee Stock Purchase Plan
On May 1, 2013, the Company adopted a 2013 Employee Stock Purchase Plan (ESPP). A total of 738,032 shares of our common stock is available for sale under the ESPP. The ESPP provides for annual increases in the number of shares available for issuance on the first day of each fiscal year beginning in fiscal 2014.
We have evaluated subsequent events through May 6, 2013, the date on which these consolidated financial statements were issued.
F-40

6,059,509 Shares
Marketo, Inc.
Common Stock

Goldman, Sachs & Co. |
Credit Suisse | |||||
UBS Investment Bank |
Canaccord Genuity |
Raymond James |
JMP Securities |
|||
PART II
INFORMATION NOT REQUIRED IN THE PROSPECTUS
Item 13. Other Expenses of Issuance and Distribution.
Estimated expenses, other than underwriting discounts and commissions, payable by the Registrant in connection with the sale of the common stock being registered under this registration statement are as follows:
SEC registration fee |
$ | 12,357 | ||
FINRA filing fee |
14,089 | |||
NASDAQ listing fee |
150,000 | |||
Printing and engraving expenses |
250,000 | |||
Legal fees and expenses |
1,750,000 | |||
Accounting fees and expenses |
1,200,000 | |||
Transfer agent and registrar fees and expenses |
17,500 | |||
Miscellaneous |
206,054 | |||
Total |
$ | 3,600,000 | ||
Item 14. Indemnification of Directors and Officers.
On completion of this offering, the Registrant's amended and restated certificate of incorporation will contain provisions that eliminate, to the maximum extent permitted by the General Corporation Law of the State of Delaware, the personal liability of the Registrant's directors and executive officers for monetary damages for breach of their fiduciary duties as directors or officers. The Registrant's amended and restated certificate of incorporation and bylaws will provide that the Registrant must indemnify its directors and executive officers and may indemnify its employees and other agents to the fullest extent permitted by the General Corporation Law of the State of Delaware.
Sections 145 and 102(b)(7) of the General Corporation Law of the State of Delaware provide that a corporation may indemnify any person made a party to an action by reason of the fact that he or she was a director, executive officer, employee or agent of the corporation or is or was serving at the request of a corporation against expenses (including attorneys' fees), judgments, fines and amounts paid in settlement actually and reasonably incurred by him or her in connection with such action if he or she acted in good faith and in a manner he or she reasonably believed to be in, or not opposed to, the best interests of the corporation and, with respect to any criminal action or proceeding, had no reasonable cause to believe his or her conduct was unlawful, except that, in the case of an action by or in right of the corporation, no indemnification may generally be made in respect of any claim as to which such person is adjudged to be liable to the corporation.
The Registrant has entered into indemnification agreements with its directors and executive officers, in addition to the indemnification provided for in its amended and restated certificate of incorporation and bylaws, and intends to enter into indemnification agreements with any new directors and executive officers in the future.
The Registrant has purchased and currently intends to maintain insurance on behalf of each and any person who is or was a director or officer of the Registrant against any loss arising from any claim asserted against him or her and incurred by him or her in any such capacity, subject to certain exclusions.
II-1
The Underwriting Agreement (Exhibit 1.1 hereto) provides for indemnification by the underwriters of the Registrant and its executive officers and directors, and by the Registrant of the underwriters, for certain liabilities, including liabilities arising under the Securities Act.
See also the undertakings set out in response to Item 17 herein.
Item 15. Recent Sales of Unregistered Securities.
During the last three years, the Registrant sold the following unregistered securities:
- •
- On April 9, 2010, the Registrant sold 2,110,300 shares of its Series D preferred stock to five accredited
investors at a purchase price per share of $4.74 for aggregate gross proceeds of approximately $10.0 million.
- •
- On November 15, 2010, the Registrant sold 3,755,658 shares of its Series E preferred stock to seven
accredited investors at a purchase price per share of $6.66 for aggregate gross proceeds of approximately $25.0 million.
- •
- On November 15, 2011, the Registrant sold 3,787,876 shares of its Series F preferred stock to twelve
accredited investors at a purchase price per share of $13.20 for aggregate gross proceeds of approximately $50.0 million.
- •
- On April 17, 2012, the Registrant issued 98,928 shares of its common stock to seven individuals and 842,458 shares of its Series G preferred stock to five individuals and ten entities in connection with its acquisition of all the outstanding shares of a company.
- •
- From January 1, 2010 through March 31, 2013, the Registrant granted to its directors, employees, consultants
and other service providers options, as well as options assumed in connection with the acquisition of Crowd Factory, to purchase an aggregate of 10,048,413 shares of common stock under the
Registrant's 2006 Stock Plan (2006 Plan) at exercise prices ranging from $0.74 to $7.42 per share, for an aggregate exercise price of approximately $39.0 million.
- •
- From January 1, 2010 through March 31, 2013, the Registrant issued and sold to its directors, employees,
consultants and other service providers an aggregate of 1,288,208 shares of common stock upon the exercise of options under the 2006 Plan at exercise prices ranging from $0.12 to $9.24 per share, for
an aggregate purchase price of approximately $2.1 million.
- •
- From January 1, 2010 through March 31, 2013, the Registrant awarded to its employees, consultants and other
service providers 358,614 restricted stock units under the 2006 Plan.
- •
- On May 1, 2013, the Registrant granted to its directors, employees, consultants and other service providers options to purchase an aggregate of 345,800 shares of common stock under the Registrant's 2006 Plan at an exercise price of $12.00 per share, for an aggregate exercise price of approximately $4.1 million. In addition, on May 1, 2013, the Registrant awarded to its employees 3,250 restricted stock units under the 2006 Plan.
Preferred Stock Issuances
2006 Stock Plan-Related Issuances
None of the foregoing transactions involved any underwriters, underwriting discounts or commissions, or any public offering, and the Registrant believes that each such transaction was exempt from the registration requirements of the Securities Act in reliance on Rule 701 promulgated under the Securities Act as transactions pursuant to a compensatory benefit plan approved by the
II-2
Registrant's board of directors, or Section 4(2) of the Securities Act, as transactions by an issuer not involving a public offering. Each recipient of the securities in these transactions represented his or her intention to acquire the securities for investment only and not with a view to, or for resale in connection with, any distribution thereof, and appropriate legends were affixed to the share certificates issued in each such transaction. In each case, the recipient represented that such recipient had received adequate information about the Registrant or had adequate access, through his or her relationship with the Registrant, to information about the Registrant.
Item 16. Exhibits and Financial Statement Schedules.
(a) Exhibits:
See Exhibit Index immediately following the Signature Pages.
(b) Financial Statement Schedules.
All other schedules have been omitted because the information required to be presented in them is not applicable or is shown in the consolidated financials statements or related notes.
The Registrant hereby undertakes to provide to the underwriters at the closing as specified in the underwriting agreement certificates in such denominations and registered in such names as required by the underwriters to permit prompt delivery to each purchaser.
Insofar as indemnification for liabilities arising under the Securities Act of 1933, as amended, may be permitted to directors, officers and controlling persons of the Registrant pursuant to the foregoing provisions, or otherwise, the Registrant has been advised that in the opinion of the Securities and Exchange Commission such indemnification is against public policy as expressed in the Securities Act of 1933, as amended, and is, therefore, unenforceable. In the event that a claim for indemnification against such liabilities (other than the payment by the Registrant of expenses incurred or paid by a director, officer or controlling person of the Registrant in the successful defense of any action, suit or proceeding) is asserted by such director, officer or controlling person in connection with the securities being registered, the Registrant will, unless in the opinion of its counsel the matter has been settled by controlling precedent, submit to a court of appropriate jurisdiction the question whether such indemnification by it is against public policy as expressed in the Securities Act of 1933, as amended, and will be governed by the final adjudication of such issue.
The Registrant hereby undertakes that:
(1) For purposes of determining any liability under the Securities Act of 1933, as amended, the information omitted from a form of prospectus filed as part of this registration statement in reliance upon Rule 430A and contained in the form of prospectus filed by the Registrant pursuant to Rule 424(b)(1) or (4) or 497(h) under the Securities Act of 1933, as amended, shall be deemed to be part of this registration statement as of the time it was declared effective.
(2) For the purpose of determining any liability under the Securities Act of 1933, as amended, each post-effective amendment that contains a form of prospectus shall be deemed to be a new registration statement relating to the securities offered therein, and the offering of such securities at that time shall be deemed to be the initial bona fide offering thereof.
II-3
Pursuant to the requirements of the Securities Act of 1933, the registrant has duly caused this amendment to registration statement to be signed on its behalf by the undersigned, thereunto duly authorized, in the City of San Mateo, State of California, on May 13, 2013.
| MARKETO, INC. | ||||
By: |
/s/ PHILLIP M. FERNANDEZ Phillip M. Fernandez President and Chief Executive Officer |
|||
Pursuant to the requirements of the Securities Act of 1933, this amendment to registration statement has been signed by the following persons in the capacities indicated below:
Signature
|
Title
|
Date
|
||||
|---|---|---|---|---|---|---|
| /s/ PHILLIP M. FERNANDEZ Phillip M. Fernandez |
President, Chief Executive Officer and Director (Principal Executive Officer) |
May 13, 2013 | ||||
/s/ FREDERICK A. BALL Frederick A. Ball |
Senior Vice President and Chief Financial Officer (Principal Financial and Accounting Officer) |
May 13, 2013 |
||||
* Neeraj Agrawal |
Director |
May 13, 2013 |
||||
* Susan L. Bostrom |
Director |
May 13, 2013 |
||||
* Tae Hea Nahm |
Director |
May 13, 2013 |
||||
* Douglas A. Pepper |
Director |
May 13, 2013 |
||||
* Roger S. Siboni |
Director |
May 13, 2013 |
||||
* Wesley R. Wasson |
Director |
May 13, 2013 |
||||
*by: |
/s/ PHILLIP M. FERNANDEZ |
|||||
| Phillip M. Fernandez As Attorney-in-Fact |
||||||
II-4
Exhibit Number |
Description
|
||
|---|---|---|---|
| 1.1 | # | Form of Underwriting Agreement. | |
3.1 |
# |
Amended and Restated Certificate of Incorporation of the Registrant, as currently in effect. |
|
3.1.1 |
# |
Amendment to the Amended and Restated Certificate of Incorporation of the Registrant |
|
3.2 |
# |
Form of Amended and Restated Certificate of Incorporation of the Registrant, to be in effect upon the completion of this offering. |
|
3.3 |
# |
Amended and Restated Bylaws of the Registrant, as currently in effect. |
|
3.4 |
# |
Form of Amended and Restated Bylaws of the Registrant, to be in effect upon the completion of this offering. |
|
4.1 |
# |
Amended and Restated Investor Rights Agreement, dated November 15, 2011, by and among the Registrant and certain of its stockholders, as amended. |
|
4.1.1 |
# |
Form of Second Amendment to Amended and Restated Investor Rights Agreement |
|
4.2 |
# |
Specimen common stock certificate of the Registrant. |
|
5.1 |
# |
Opinion of Wilson Sonsini Goodrich & Rosati, Professional Corporation. |
|
10.1 |
+# |
Form of Indemnification Agreement between the Registrant and each of its directors and executive officers. |
|
10.2 |
+# |
2006 Stock Plan, as amended, and forms of agreements thereunder. |
|
10.3 |
+# |
2013 Equity Incentive Plan and forms of agreements thereunder, to be in effect upon the completion of this offering. |
|
10.4 |
+# |
2013 Employee Stock Purchase Plan and form of agreement thereunder, to be in effect upon the completion of this offering. |
|
10.5 |
+# |
Compensation Summary Sheet for Phillip M. Fernandez. |
|
10.6 |
+# |
Management Retention Agreement, effective as of July 24, 2012, by and between the Registrant and Phillip M. Fernandez. |
|
10.7 |
+# |
Offer Letter, dated April 5, 2011, by and between the Registrant and Frederick A. Ball. |
|
10.8 |
+# |
Management Retention Agreement, effective as of July 24, 2012, by and between the Registrant and Frederick A. Ball. |
|
10.9 |
+# |
Offer Letter, dated May 7, 2008, by and between the Registrant and William B. Binch. |
|
10.10 |
+# |
Management Retention Agreement, effective as of August 28, 2012, by and between the Registrant and William B. Binch. |
|
10.11 |
+# |
Offer Letter, dated April 17, 2012, by and between the Registrant and Sanjiv P. Dholakia. |
|
10.12 |
+# |
Management Retention Agreement, effective as of July 24, 2012, by and between the Registrant and Sanjiv P. Dholakia. |
|
10.13 |
+# |
Non-Competition and Non-Solicitation Agreement, dated April 17, 2012, by and between the Registrant and Sanjiv P. Dholakia. |
|
10.14 |
+# |
Offer Letter, dated January 13, 2012, by and between the Registrant and Jason L. Holmes. |
|
Exhibit Number |
Description
|
||
|---|---|---|---|
| 10.15 | +# | Management Retention Agreement, effective as of July 24, 2012, by and between the Registrant and Jason L. Holmes. | |
10.16 |
+# |
Offer Letter, dated April 13, 2012, by and between the Registrant and Srinivasan Venkatesan. |
|
10.17 |
+# |
Management Retention Agreement, effective as of July 24, 2012, by and between the Registrant and Srinivasan Venkatesan. |
|
10.18 |
+# |
Offer Letter, dated January 20, 2012, by and between the Registrant and Sharon S. Zezima. |
|
10.19 |
+# |
Management Retention Agreement, effective as of July 24, 2012, by and between the Registrant and Sharon S. Zezima. |
|
10.20 |
+# |
Change in Control Acceleration Policy. |
|
10.21 |
# |
Office Lease, dated August 13, 2009, by and between the Registrant and CA-San Mateo BayCenter Limited Partnership, as amended by the First Amendment dated May 19, 2010, the Second Amendment dated November 16, 2010, the Third Amendment dated May 19, 2011, the Fourth Amendment dated November 22, 2011 and the Fifth Amendment dated May 14, 2012. |
|
10.22 |
# |
Loan and Security Agreement, dated May 21, 2012, by and between the Registrant and Silicon Valley Bank. |
|
10.23 |
# |
Common Stock Purchase Agreement between the Registrant and Battery Ventures IX, L.P. and Battery Investment Partners IX, LLC dated May 3, 2013. |
|
21.1 |
# |
List of subsidiaries of the Registrant. |
|
23.1 |
Consent of KPMG LLP, Independent Registered Public Accounting Firm. |
||
23.2 |
# |
Consent of Wilson Sonsini Goodrich & Rosati, Professional Corporation (included in Exhibit 5.1). |
|
24.1 |
# |
Power of Attorney. |
|
- +
- Indicates
a management contract or compensatory plan.
- #
- Previously filed.