Attached files
| file | filename |
|---|---|
| 8-K - FORM 8-K - DITECH HOLDING Corp | d536091d8k.htm |
| EX-99.1 - EX-99.1 - DITECH HOLDING Corp | d536091dex991.htm |
 First
Quarter 2013 Earnings Presentation May 9, 2013
Exhibit 99.2 |
 Forward-Looking Statements and Non-GAAP
Financial Measures
1
This document contains forward-looking statements, including forward-looking statements within
the meaning of the Private Securities Litigation Reform Act of 1995. Such forward-looking
statements include, but are not limited to, statements concerning Walter Investment's plans, beliefs, objectives, expectations and intentions
and other statements that are not historical or current facts. Forward-looking statements are based
on Walter Investment's current expectations and involve risks and uncertainties that could cause
actual results to differ materially from those expressed or implied in such forward-looking statements. In addition, these
statements are based on a number of assumptions that are subject to change. Accordingly, actual
results may be materially higher or lower than those projected. The inclusion of such projections
herein should not be regarded as a representation by Walter Investment that the projections will prove to be correct. This
document speaks only as of this date. Walter Investment disclaims any duty to update the information
herein except as otherwise required by law.
Factors that could cause Walter Investment's results to differ materially from current expectations or
affect the Company’s ability to achieve anticipated core earnings and EBITDA include, but
are not limited to: •
Regulatory changes and changes in delinquency and default rates that could adversely affect the costs of
our businesses such that they are higher than expected; •
Prepayment speeds, delinquency and default rates of the portfolios we service;
•
Our inability to achieve anticipated incentive fees, which are subject to certain factors beyond the
Company’s control and which are difficult to estimate with any degree of certainty in
advance; •
The achievement of anticipated volumes and margins from the origination of both forward and reverse
mortgages, which can be affected by multiple factors, many of which are beyond our control;
•
Assumptions with regard to the HARP eligible population of the portfolios we service, customer take up
rates, our recapture rates, the origination margins for HARP refinancing and anticipated changes
to the HARP program which may increase competition; •
Assumptions with regard to contributions from originations are also subject to the integration of the
ResCap origination and capital markets platforms, and the organizational structure, capital
requirements and performance of the business after the acquisition; •
The closing of various business and asset acquisitions on schedule, and the addition of new business in
2013; •
The timely and efficient transfer of assets acquired to the Company’s platforms and the efficient
integration of the acquired businesses, including achievement of synergies related thereto;
•
The accuracy of our expectations regarding the value of, and contributions from, acquired MSRs, related
intangibles and other assets, including the accuracy of our assumptions as to the performance of
the assets we acquire, which are subject to and affected by many factors, some of which are beyond our control, and
could differ materially from our estimates;
•
Errors in our financial models or changes in assumptions could result in our estimates and expectations
being materially inaccurate which may adversely affect our earnings;
•
The effects of competition on our existing and potential future business;
•
Our ability to service our existing or future indebtedness;
•
Other factors that may affect the Company’s earnings or costs; and
•
Other factors relating to our business in general as detailed in Walter Investment's 2012 Annual Report
on Form 10-K and other periodic reports filed with the U.S. Securities and Exchange
Commission. To
supplement Walter Investment’s consolidated financial statements prepared in accordance with GAAP and to better reflect period-over-period comparisons,
Walter Investment uses non-GAAP financial measures of performance, financial position, or cash flows
that either exclude or include amounts that are not normally excluded or included in the most
directly comparable measure, calculated and presented in accordance with GAAP. Non-GAAP financial measures do not replace
and are not superior to the presentation of GAAP financial results, but are provided to (i) measure the
Company’s financial performance excluding depreciation and amortization costs, corporate and
MSR facility interest expense, transaction and merger integration-related costs, certain other non-cash adjustments, the net impact
of the consolidated Non-Residual Trust VIEs and certain other items including, but not limited to
pro-forma synergies, (ii) provide investors a means of evaluating our core operating
performance and (iii) improve overall understanding of Walter Investment’s current financial performance and its prospects for the future.
Specifically, Walter Investment believes the non-GAAP financial results provide useful
information to both management and investors regarding certain additional financial and business
trends relating to financial condition, operating results and cash flows. In addition, management uses these measures for reviewing financial
results and evaluating financial performance and cash flows. The non-GAAP adjustments for all
periods presented are based upon information and assumptions available as of the date of this
presentation. Reconciliations can be found in the Appendix to this presentation and our press release dated May 9, 2013.
|
 Q1
2013 Highlights Generated record quarterly financial results, with
GAAP Net Income of $27.7 million, or $0.73 per
diluted share, $1.50 of Core EPS and $140 million
of AEBITDA
Completed the acquisition of the ResCap
originations and capital markets platforms
Completed the acquisitions of the ResCap and
Bank of America MSRs
Acquired $12.2 billion UPB of reverse MSRs from
Wells Fargo
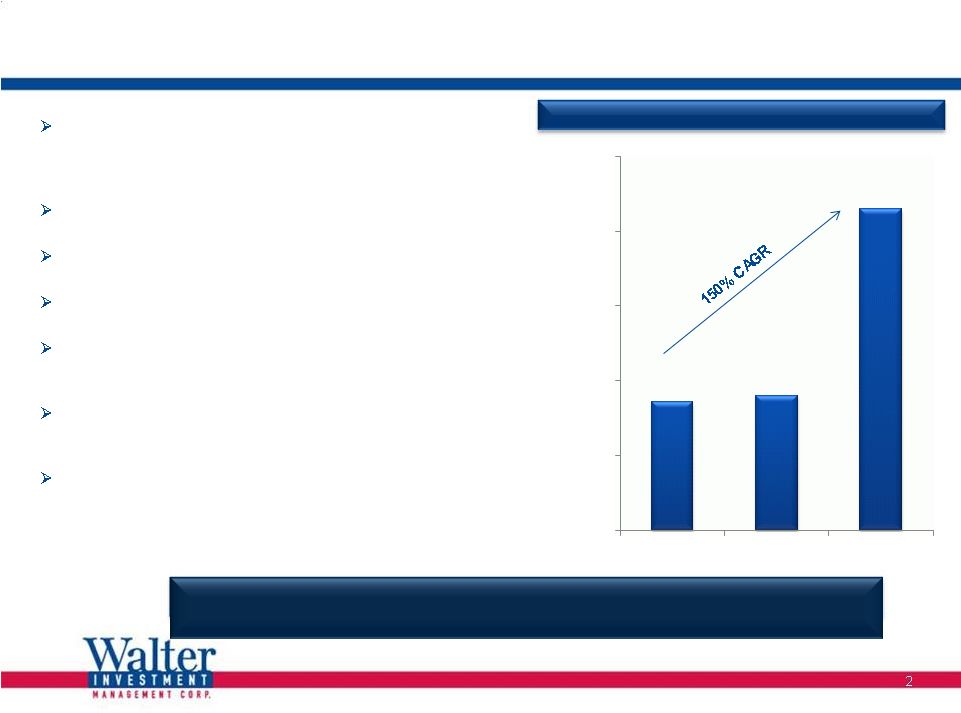
Total serviced UPB of $215 billion and nearly 2
million accounts at March 31; increased 150% as
compared to Q1 2012
Achieved a four STAR designation from Fannie
Mae for the 2012 program year for overall servicing
performance
Added approximately $2 billion of warehouse
capacity and $825 of incremental term loan
borrowings
2
($ in billions)
(1)
Includes both forward and reverse servicing portfolios
$86
$90
$215
$-
$50
$100
$150
$200
$250
Q1 2012
Q4 2012
Q1 2013
Significant
Growth
in
UPB
Serviced
(1)
Please
refer
to
the
introductory
slides
of
this
presentation,
as
well
as
additional
disclosures
in
the
Appendix
and
in
our
March
31,
2013
Form
10-Q
and
other
filings
with
the
SEC,
for
important
information
regarding
Forward-Looking
Statements
and
the
use
of
Non-GAAP
Financial
Measures.
Transitional first quarter produced strong financial results, with new
business
additions
establishing
a
solid
foundation
for
growth
in
2013. |
 Q1
2013 Consolidated Financial Results GAAP net income of $27.7 MN, or $0.73 per
diluted share •
Total revenues of $291.8 MN, $139.0 MN higher than prior year period
•
Strong
level
of
incentive
and
performance
fees
at
$30.3
MN,
$7.3
MN
higher
than
the
previous
year
period
•
Strong contributions from Reverse Mortgage and Originations
Core earnings after tax of $56.5 MN, or $1.50 per diluted share,
an increase of $35.9 MN or $0.79 per
share compared to Q1 2012
•
New servicing portfolio additions are earning attractive margins
•
Solid, growing contributions from new business segments
•
Core
earnings
deducts
$27.7
million
of
depreciation,
amortization
and
MSR
related
fair
value
adjustments;
compares
to
$4.7
million
in
prior
year
period;
excludes
step
up
depreciation
and
amortization
of
$21.0
million
3
Q1 2012
Q1 2013
Q4 2012
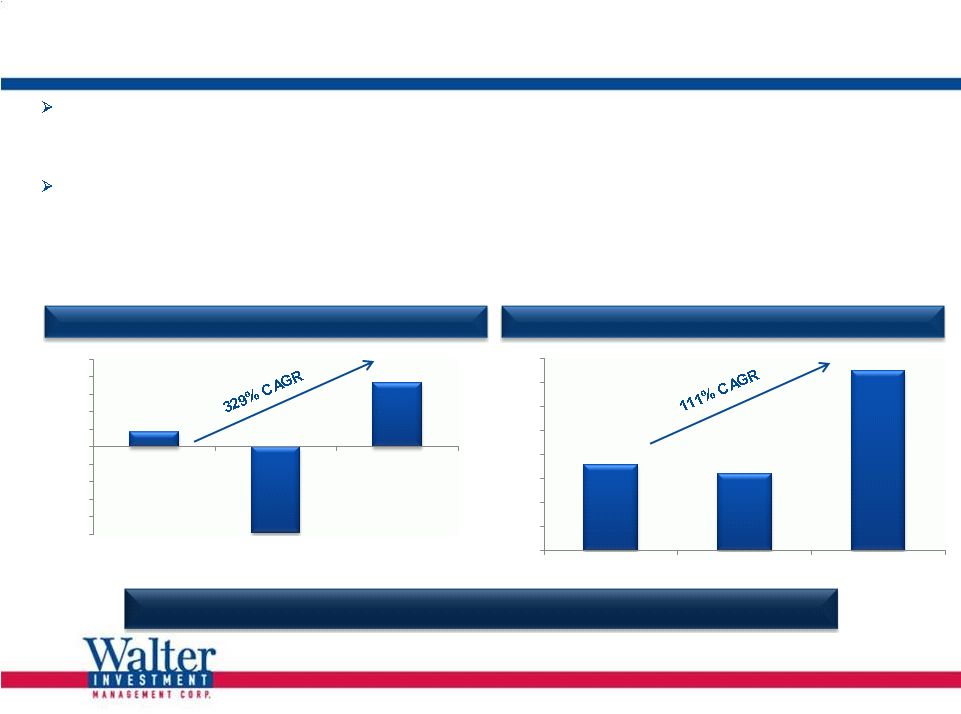
$0.71
$0.64
$1.50
$-
$0.20
$0.40
$0.60
$0.80
$1.00
$1.20
$1.40
$1.60
Q1 2012
Q4 2012
Q1 2013
Record earnings and growth in the first quarter of 2013.
$0.17
($0.98)
$0.73
$(1.00)
$(0.80)
$(0.60)
$(0.40)
$(0.20)
$-
$0.20
$0.40
$0.60
$0.80
$1.00
Core EPS
GAAP EPS
Please refer to the introductory slides of this presentation, as well as additional disclosures in the
Appendix and in our March 31, 2013 Form 10-Q and other filings with the SEC, for important
information regarding Forward-Looking Statements and the use of Non-GAAP Financial Measures.
|
 Q1
2013 EBITDA and Core Earnings Adjustments 4
Note:
Columns may not total due to rounding.
(1)
Includes MSR related fair value adjustments , excludes step-up
depreciation and amortization.
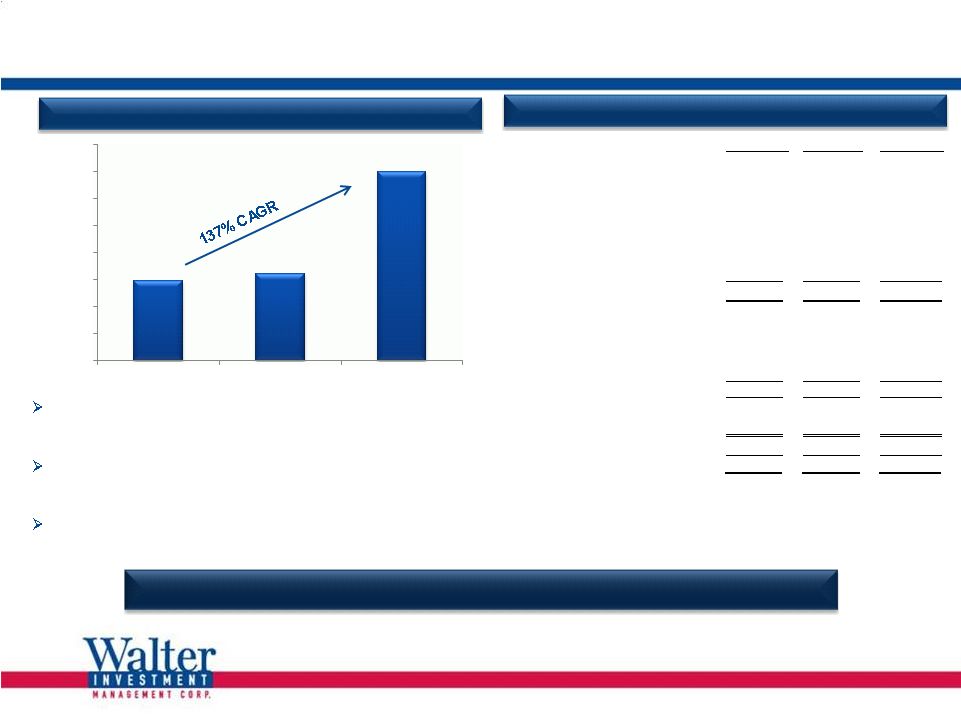
Servicing AEBITDA growth driven by recent
acquisitions, and strong results in incentive,
performance-based and ancillary fees
Reverse Mortgage AEBITDA driven by record
origination volumes and strong cash gain on sale
margins
Originations AEBITDA includes value of growing
loans HFS and locked pipeline volume
$59.1
$64.1
$140.0
$-
$20.0
$40.0
$60.0
$80.0
$100.0
$120.0
$140.0
$160.0
Q1 2012
Q4 2012
Q1 2013
($ In millions except per share amounts)
Q1 2012
Q4 2012
Q1 2013
Servicing
37
$
36
$
64
$
ARM
3
5
4
Insurance
11
11
9
Loans and Residuals
6
6
6
Reverse Mortgage
-
8
19
Originations
-
(2)
36
Other
2
-
1
AEBITDA
59
$
64
$
140
$
Less:
Depreciation and Amortization
(1)
(5)
(6)
(28)
Interest Expense
(20)
(17)
(23)
Other
(1)
(5)
3
Pre-tax core earnings
33
$
36
$
93
$
After-tax core earnings
21
$
23
$
57
$
Diluted shares outstanding
29.0
34.9
37.6
Core EPS
0.71
$
0.64
$
1.50
$
Adjusted EBITDA by Segment / Core Earnings
Adjusted EBITDA
Significant AEBITDA growth translates into solid Core Earnings.
Please
refer
to
the
introductory
slides
of
this
presentation,
as
well
as
additional
disclosures
in
the
Appendix
and
in
our
March
31,
2013
Form
10-Q
and
other
filings
with
the
SEC,
for
important
information
regarding
Forward-Looking
Statements
and
the
use
of
Non-GAAP
Financial
Measures. |
 Servicing Segment Overview
Stable, recurring servicing fees plus incentive,
performance-based, ancillary and other fees
Segment pre-tax core earnings of 15 bps of average UPB
Weighted average contractual servicing fee of 28 bps
Net run-off rate of 20%, better than expectations
5
Net revenue and fees of $139.7 million; includes incentives
of $20.4 million, 37% greater than Q1 2012; net of $17.4
million of amortization and change in fair value of servicing
rights
GAAP Income before income taxes of $36.1 million
Pre-tax core earnings of $52.1 million
$86
$77
$201
1,036,096
961,042
1,914,441
0
500,000
1,000,000
1,500,000
2,000,000
$0
$25
$50
$75
$100
$125
$150
$175
$200
$225
Q1 2012
Q4 2012
Q1 2013
UPB
UNITS
Please
refer
to
the
introductory
slides
of
this
presentation,
as
well
as
additional
disclosures
in
the
Appendix
and
in
our
March
31,
2013
Form
10-Q
and
other
filings
with
the
SEC,
for
important
information
regarding
Forward-Looking
Statements
and
the
use
of
Non-GAAP
Financial
Measures.
$ in billions
$ in millions
$76
$72
$122
$15
$20
$9
$11
$15
$0
$25
$50
$75
$100
$125
$150
$175
Q1 2012
Q4 2012
Q1 2013
Contractual
Incentive
Ancillary
$103
$157
$100
$20
Total Segment UPB and Number of Accounts
Breakdown of Servicing Revenue
Portfolio
Earnings |
 Portfolio Run-off/Net Disappearance Rates
6
Q4 2012
Q1 2013
MH
12%
12%
All GSE
16%
21%
Total
15%
20%
BAC
22%
ResCap
26%
FNMA sub-serviced
15%
(1)
Quicken Loans solicits FNMA sub-serviced portfolio for HARP
refinancings. Under agreement with Quicken and FNMA,
sub-servicing rights for recaptured loans are returned to Green Tree
within 60-90 days of
refinancing. Run-off rates shown above assumes sub-servicing is
returned in same month as refinancing. Loans in process of return at
3/31/2013 were $2.8 BN UPB and $5.2 BN UPB at 12/31/2012. Uptick in Q1 2013
for GSE portfolio due to addition of BofA and ResCap portfolios
Disappearance rates for BofA and ResCap reflect February & March
activity: Adjusted
For
Timing
Difference
on
Recapture
of
Quicken
Loans
(1)
Q1 2013 GSE by Portfolio
•
Gross disappearance approximates net disappearance due to minimal recapture
activity during these two months
•
Actual disappearance lower than recent history and projections
•
Opportunity to reduce net disappearance rates as Originations recapture pipeline
builds
•
Portfolios performing better than acquisition models
|
 Reverse Segment Overview
Originated $968 million of UPB in Q1
•
18% through Retail channel
•
82% through Correspondent and Wholesale channels
•
Average cash gain on sale margin of 325 bps
•
Issued over $900 million of HECM securitizations
Originations pipeline going into Q2 remains strong; shift
from fixed to ARM product is already occurring; margins
remain firm
7
Servicing
Originations
Servicing portfolio doubled with the reverse MSR
acquisition from Wells Fargo
$825 million of servicing added through originations versus
disappearance of 7% on average UPB of $13.5 billion
Pre-tax servicing margins of 50%
Funded Volume (UPB)
$ in millions
Servicing Portfolio* (UPB)
$ in billions
* Proforma for announced acquisition of MSRs, closed effective April 1,
2013. Income before income taxes of $12.1 million
Pre-tax core earnings of $18.4 million
Segment Profitability
$235
$275
$354
$298
$316
Nov-12
Dec-12
Jan-13
Feb-13
Mar-13
$12.9
$25.0
Q4 2012
Q1 2013*
Please refer to the introductory slides of this presentation, as well as additional disclosures in the
Appendix and in our March 31, 2013 Form 10-Q and other filings with the SEC, for
important information regarding Forward-Looking Statements and the use of Non-GAAP Financial Measures.
|
 Originations Segment Overview
Quickly ramped originations volumes during the quarter,
principally in consumer direct channel:
Applications soared from $0.3 billion in Q4 2012 to
$2.2 billion in Q1 2013 in the Consumer Lending
channel ($0.5 billion in Business Lending)
$375 million of funded originations during the quarter
compared to $95 million in Q4 2012
Locked Pipeline of $1.9 billion as of March 31, 2013
HARP eligible population, marketing programs,
anticipated recapture rates and ramp in pipeline support
expectations for full year
Average margin on originated product of 4.07%
driven
by attractive HARP margins
Extension of HARP program will increase eligible
population:
~200,000 loans in serviced portfolio currently ineligible
due to delinquencies in last 12 months
~40,000
of
these
currently
ineligible
loans
have
only
been
delinquent
once
or
twice
in
the
last
12
months
8
Originations Highlights
$ in billions
(1)
Includes
mark-to-market
on
loans
held
for
sale
and
IRLC
net
of
expected
fallout.
MTM
and
FV
gains
are
generally
expected
to
convert
to
realized
gains
within
55
to
70
days.
Q1 2013 Origination Economics
($MN)
Cash - Points, Fees, Gain on Sale
$3.4
Pipeline Value
(1)
$71.4
Subtotal Cash / Near Cash Revenue
$74.8
Servicing
Asset
$1.3
Total Originations Revenue
$76.1
Note: Applications defined as services ordered/submission to operations in Consumer
Lending and Registrations in Business Lending.
$-
$1.0
$2.0
$3.0
$4.0
$5.0
$6.0
$7.0
Q1
Q2(e)
Q3(e)
Q4(e)
Funded Volume Consumer Lending
Application Volume Consumer Lending
Consumer Lending Originations Volume (UPB) |
 •
Converted one subservicing
opportunity to contract and
boarded a pilot program
•
One subservicing
opportunity withdrawn by
the client from the market at
this time
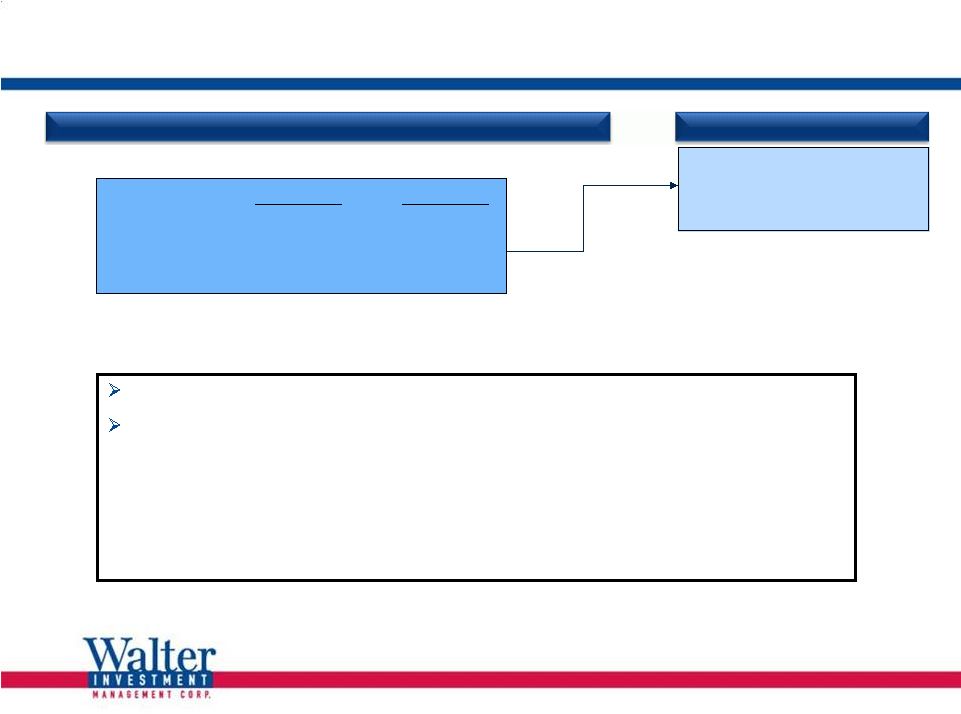
Market Overview and Pipeline
Economic conditions and outlook continue
to be favorable
Sector drivers remain positive
•
Outsource non-core
•
Reduce costs
•
Compliance
•
Capital efficiency
•
HARP extension
Asset prices remain attractive
Capital continues to flow to the sector
“Middle innings”
of aggregation phase;
sizeable $1 trillion plus opportunity
available
Strong client diversification
Short lull in activity in Q4 2012 /
Q1 2013 due to significant
transactions
Expect to build pipeline for
remainder of 2013
Exclusive pipeline of $10 billion
9
Pipeline expected to build after short lull driven by significant
transactions in Q4 2012 and Q1 2013.
Active Pipeline* of $300 BN UPB
Market Overview
Current
Active Pipeline
$10 BN
(Exclusive)
$300 BN
(Active)
*
“Pipeline” refers to opportunities or potential opportunities in the market for products
within our strategic profile that we have identified as targets to add to our servicing portfolio through either the
acquisition of MSR or sub-servicing contracts. In each case we have contacted the seller or
its representative to register our interest, or are currently engaged in discussions or negotiations directly
with the seller or its representative. The status of “pipeline opportunities” varies from
early stage contact through exclusive negotiations. There can be no guarantee that any of the opportunities in our
pipeline will result in purchases or contracts added by the Company. |
 2013
Outlook Estimated
Adjusted
EBITDA
(1) Using mid-point of 2013 range.
10
Core Earnings Estimates
(1) At mid-point of EBITDA range.
(2) Depreciation
and
amortization
including
fair
value
adjustment
to
MSRs;
excludes
step
up
depreciation
and
Core Earnings estimates are based upon previously provided estimated AEBITDA and
other amounts as shown above. See Forward Looking Statements and
Definitions section. Note:
Columns may not total due to rounding.
Highlights
AEBITDA guidance reflects only existing business
Estimated Core EPS
$ in millions
($ In millions except per share amounts)
2012
Q1 2013
2013(e)
EBITDA
242
$
140
$
688
$
(1)
Less:
Depreciation and Amortization
(2)
(20)
(28)
(250)
Interest Expense
(3)
(77)
(23)
(115)
Other
(11)
3
(11)
Pre-tax core earnings
134
$
93
$
312
$
After-tax core earnings
83
$
57
$
190
$
Diluted shares outstanding
(3)
30.4
37.6
37.6
Core EPS
2.73
$
1.50
$
5.06
$
Pipeline opportunities
Market trends remain positive; still in middle innings
of aggregation phase with opportunities for stair-step
growth
High barriers to entry; few specialty servicers of size
and scale
Recent acquisitions ramp in profitability
amortization. 2013 amount is management’s estimate.
Core business continues to be well-positioned to drive
significant growth beyond 2013
$650 –
$725
$242
Please refer to the introductory slides of this presentation, as well as additional disclosures in the
Appendix and in our March 31, 2013 Form 10-Q and other filings with the SEC, for
important information regarding Forward-Looking Statements and the use of Non-GAAP Financial Measures.
(3) Based on current capital structure and rates.
|
 Focus
on Sustainable, Profitable Growth (1)
Source: Inside Mortgage Finance.
11
Solid Financial
Fundamentals
Strong Pipeline
Differentiated
Operating Model
WAC is highly focused on delivering significant returns to shareholders
Strong Q1 2013 results
Strong margins across business lines
Significant leverage to results in 2013 and 2014 on acquired business
Regulatory, capital, operational, and compliance issues all remain catalysts for servicing
transfers
Secular shift continues, driving sustainability and growth
Trend of outsourced non-core assets continues
Robust active pipeline of $300 billion
Ramp in flow opportunities
Establishing new client relationships
Platform delivers value-added benefits to credit owners
Ancillary businesses (ARM, Insurance) deliver additional value and drive increased revenue
Addition of Reverse Mortgage and Originations businesses further diversify revenue streams
High level of compliance drives preferred partner status
Cyclical and
Secular Industry
Shift
•
•
•
•
•
•
•
•
•
•
•
•
• |
 Appendix |
 Use
of Non-GAAP Measures 13
Generally Accepted Accounting Principles ("GAAP") is the term used to refer to the standard
framework of guidelines for financial accounting. GAAP includes the standards, conventions, and
rules accountants follow in recording and summarizing transactions and in the preparation of financial statements. In addition to
reporting financial results in accordance with GAAP, the Company has provided non-GAAP financial
measures, which it believes are useful to help investors better understand its financial
performance, competitive position and prospects for the future.
Core earnings (pre-tax and after-tax), core earnings per share and Adjusted EBITDA are
financial measures that are not in accordance with GAAP. See the Definitions included in
this document for a description of how these items are reported and see the Non-GAAP Reconciliations for a reconciliation of these
measures to the most directly comparable GAAP financial measures. The
Company believes that these Non-GAAP Financial Measures can be useful to investors because they provide a means by which investors can evaluate the
Company’s underlying key drivers and operating performance of the business, exclusive of certain
adjustments and activities that investors may consider to be unrelated to the underlying
economic performance of the business for a given period.
The Company manages the business based upon the achievement of core earnings, Adjusted EBITDA and
similar targets and has designed certain management incentives based upon the achievement of
pre-tax income and Adjusted EBITDA in order to assess the underlying operational performance of the continuing
operations of the business for the year and to have a basis to compare underlying operating results to
prior and future periods.
Since core earnings (pre-tax and after-tax) and core earnings per share measure the
Company’s financial performance excluding certain depreciation and amortization costs
related to acquisitions, transaction and merger integration-related costs, share-based compensation expense, certain other non-cash
adjustments, and the net impact of the consolidated Non-Residual Trust VIEs, they may not reflect
all amounts associated with our results as determined in accordance with GAAP.
Adjusted EBITDA measures the Company’s financial performance excluding depreciation and
amortization costs, corporate and MSR facility interest expense, transaction and merger
integration-related costs, share-based compensation expense, certain other non-cash adjustments, the net impact of the consolidated
Non-Residual Trust VIEs and certain other items, including, but not limited to pro-forma
synergies, they may not reflect all amounts associated with our results as determined in
accordance with GAAP.
Core earnings (pre-tax and after-tax), core earnings per share and Adjusted EBITDA involve
differences from segment profit (loss), income (loss) before income taxes, net income (loss),
basic earnings (loss) per share and diluted earnings (loss) per share computed in accordance with GAAP. Core earnings (pre-tax and
after-tax), core earnings per share and Adjusted EBITDA should be considered as
supplementary to, and not as a substitute for, segment profit (loss), income (loss) before
income taxes, net income (loss), basic earnings (loss) per share and diluted earnings (loss) per share computed in accordance with GAAP as a
measure of the Company’s financial performance. Any
non-GAAP measures should be considered in context with the GAAP financial presentation and should not be considered in isolation or as a substitute for
GAAP earnings. Further, the non-GAAP measures presented by Walter Investment may be defined
or calculated differently from similarly titled measures of other companies.
Use
of
Core
Earnings
and
Adjusted
EBITDA
by
Management
Limitations
on
the
Use
of
Core
Earnings
and
Adjusted
EBITDA |
 Definitions
Core Earnings This disclaimer applies to every usage of Core Earnings and related
terms such as Pre Tax Core Earnings, Core Earnings After Taxes and Core
Earnings Per Share (“EPS”) in this document. Core Earnings is a
metric that is used by management to exclude certain items in an attempt to provide a better
earnings per share metric to evaluate the Company’s underlying key drivers and
operating performance of the business, exclusive of certain adjustments and
activities that investors may consider to be unrelated to the underlying economic
performance of the business for a given period. Core Earnings excludes certain
depreciation and amortization costs related to business combination transactions,
transaction and merger integration-related costs, share-based compensation
expense, certain other non-cash adjustments, and the net impact of the
consolidated Non-Residual Trust VIEs. Core Earnings includes both cash and non-cash
gains from forward mortgage origination activities. Non-cash gains are
net of non-cash charges or reserves provided. Core Earnings excludes the impact of fair
value option (“FVO”) accounting and includes cash gains for reverse
mortgage origination activities. Core Earnings may also include other adjustments, as
applicable based upon facts and circumstances, consistent with the intent of
providing investors a means of evaluating our core operating performance.
14
Adjusted EBITDA This disclaimer applies to every usage of Adjusted EBITDA and related terms such as
Pro-Forma Adjusted EBITDA and AEBITDA in this document. Adjusted EBITDA is a
key performance metric used by management in evaluating the performance of our Company and its segments. Adjusted EBITDA
is generally presented in accordance with its definition in the Company’s senior secured credit
agreement, with certain exceptions, and represents income before income taxes, depreciation and
amortization, interest expense on corporate debt, transaction and integration related costs, the net effect of the non-residual VIEs and
certain other non-cash income and expense items. Adjusted EBITDA includes both cash and
non-cash gains from forward mortgage origination activities. Adjusted EBITDA excludes
the impact of fair value option (“FVO”) accounting and includes cash gains for reverse mortgage origination activities. Pro Forma Adjusted EBITDA
includes an adjustment to reflect pro-forma synergies in 2011 and 2012 and to reflect Green Tree
as having been acquired at the beginning of the year for periods prior to the actual
acquisition date. Adjusted EBITDA may also include other adjustments, as applicable based upon facts and circumstances, consistent with the
intent of providing investors a means of evaluating our core operating performance. The definition of
Adjusted EBITDA used in this document differs from the definition in the Company’s senior
secured credit agreement principally in that (i) the credit agreements include a pro forma adjustment for the projected EBITDA of
acquisitions that were made less than twelve months ago and (ii) the senior secured credit agreement
does not include the non-cash gains from forward mortgage origination activities in
Adjusted EBITDA.
2013 Estimated Adjusted EBITDA, 2013 Estimated Core Earnings and other amounts or metrics
that relate to future earnings projections are forward-looking and subject to significant
business, economic, regulatory and competitive uncertainties, many of which are beyond the control of Walter Investment and its
management, and are based upon assumptions with respect to future decisions, which are subject to
change. Actual results will vary and those variations may be material. Nothing in
this presentation should be regarded as a representation by any person that this target will be achieved and the Company undertakes no duty
to update this target. Please refer to the introductory slides of this presentation, as well as
additional disclosures in this Appendix and in our Form 10-K and other
filings with the SEC, for important information regarding Forward Looking Statements and the use of
Non-GAAP Financial Measures. |
 Q1 2013 Segment Financial Performance
($ in millions)
Servicing
Asset
Receivables
Management
Insurance
Loans
and
Residuals
Reverse
Mortgage
Originations
Other
Eliminations
Total
Consolidated
Total revenues
$139.7
$10.2
$17.5
$36.9
$14.1
$76.1
$2.4
$(5.0)
$291.8
Total expenses
$103.3
$7.8
$10.0
$28.1
$38.8
$55.7
$42.1
$(5.0)
$280.8
Other gains
(losses)
$(0.2)
$ -
$ -
$(0.2)
$36.8
$ -
$(0.9)
$ -
$35.5
Income (loss)
before income
taxes
$36.1
$2.4
$7.6
$8.6
$12.1
$20.3
$(40.6)
$ -
$46.5
Core earnings
before income
taxes
$52.1
$4.0
$9.4
$9.3
$18.4
$21.9
$(22.4)
$ -
$92.6
Adjusted EBITDA
$64.1
$4.3
$9.4
$5.8
$19.5
$36.2
$0.8
$ -
$140.0
Note:
Columns may not total due to rounding.
15
Please refer to the introductory slides of this presentation, as well as additional disclosures in the
Appendix and in our March 31, 2013 Form 10-Q and other filings with the SEC, for important
information regarding Forward-Looking Statements and the use of Non-GAAP Financial Measures.
|
  Depreciation and Amortization
16
2013
Annual
Estimate
2013
Revised
Estimate
2013
Average
Per
Quarter
Q1 2013
Actual
2014
Estimate
Step-up
80.0
$
86.0
$
21.5
$
20.9
$
75.0
$
Origination Intangible
140.0
202.0
50.5
13.9
60.0
MSR
80.0
35.0
8.8
10.2
40.0
Fixed Asset
30.0
14.0
3.5
3.6
15.0
330.0
$
337.0
$
84.3
$
48.7
$
190.0
$
Amortization of origination
intangible expected to ramp
as originations volumes
ramp through the year.
Final classification shifted intangibles and related amortization from
MSR category to origination intangible category
Note:
Columns may not total due to rounding. |
 Reconciliation of GAAP Income Before Income
Taxes to Non-GAAP Core Earnings
($ in millions, except per share amounts)
17
For the Three Months Ended
For the Three Months Ended
For the Three Months Ended
Core Earnings
March 31, 2012
December 31, 2012
March 31, 2013
Income/(loss) before income taxes
8.3
$
(55.1)
$
46.5
$
Add back:
Step-up depreciation and amortization
10.1
10.9
12.9
Step-up amortization of sub-servicing contracts
10.1
9.5
8.1
Non-cash fair value adjustments
-
2.6
3.5
Non-cash interest expense
1.1
4.2
3.0
Share-based compensation expense
4.7
3.0
2.7
Transaction and integration costs
1.4
9.2
16.3
Net impact of Non-Residual Trusts
(3.0)
3.3
(0.5)
Losses on extinguishment of debt
-
48.6
-
Other
0.5
0.1
0.1
Pre-tax core earnings
33.2
$
36.3
$
92.6
$
After-tax core earnings
20.6
$
22.5
$
56.5
$
Shares Outstanding
29.0
34.9
37.6
Core EPS
0.71
$
0.64
$
1.50
$
Please refer to the introductory slides of this presentation, as well as additional disclosures in the
Appendix and in our March 31, 2013 Form 10-Q and other filings with the SEC, for important
information regarding Forward-Looking Statements and the use of Non-GAAP Financial Measures.
|
 Reconciliation of GAAP Income Before Income Taxes to
Non-GAAP Adjusted EBITDA
18
($ in millions)
For the Three Months Ended
For the Three Months Ended
For the Three Months Ended
Adjusted EBITDA
March 31, 2012
December 31, 2013
March 31, 2013
Income/(loss) before income taxes
8.3
$
(55.1)
$
46.5
$
Add:
Deprecation and amortization
12.0
13.4
30.4
Interest expense
21.5
21.4
26.2
EBITDA
41.8
(20.3)
103.1
Add:
Amortization and fair value adjustments of servicing rights
12.9
12.6
18.3
Transaction and integration-related costs
1.4
9.2
16.3
Non-cash share-based compensation expense
4.7
3.0
2.7
Non-cash fair value adjustment
-
2.6
3.5
Provision for loan losses
1.6
5.2
1.7
Residual Trusts cash flows
0.3
3.2
0.5
Losses on extinguishment of debt
-
48.6
-
Pro forma synergies
2.3
-
-
Sub-total
23.2
84.4
43.0
Less:
Non-cash interest income
(4.5)
(3.5)
(4.6)
Net impact of Non-Residual Trusts
(3.0)
3.3
(0.5)
Other
1.6
0.2
(1.0)
Sub-total
(5.9)
-
(6.1)
Adjusted EBITDA
59.1
$
64.1
$
140.0
$
Please refer to the introductory slides of this presentation, as well as additional disclosures in the
Appendix and in our March 31, 2013 Form 10-Q and other filings with the SEC, for important
information regarding Forward-Looking Statements and the use of Non-GAAP Financial Measures.
|
 Reconciliation of Estimated 2013 Core Earnings
to Estimated GAAP Income Before Income Taxes
19
(1)
As presented on slide 10 of the First Quarter 2013 Earnings Presentation.
(2)
We do not predict special items that might occur in the future.
The amount reflected includes only actual amounts that
occurred in the first quarter of 2013.
(3)
Fair value adjustments are by their nature subject to multiple factors that could
materially change these amounts, many of which are beyond our
control. The amount reflected includes only actual amounts that occurred in the first quarter of 2013.
($ in millions)
Estimated pre-tax core earnings
(1)
312.0
$
Less:
Step up depreciation and amortization, including step up
amortization of sub-servicing contracts
(86.0)
Share-based compensation expense
(13.0)
Transaction and integration costs
(2)
(16.3)
Non-cash fair value adjustments for reverse mortgages
(3)
(3.5)
Non-cash interest expense
(12.0)
Other
(2)
0.5
Estimated income before income taxes
181.7
$ |