Attached files
| file | filename |
|---|---|
| 8-K - FORM 8-K - SUSQUEHANNA BANCSHARES INC | d535842d8k.htm |
 Susquehanna Bancshares, Inc.
Investor Presentation
2nd Quarter 2013
Exhibit 99.1 |
 Forward-Looking Statements
During the course of this presentation, we may make projections and other
forward-looking statements regarding priorities and strategic objectives
of
Susquehanna Bancshares, Inc., as well as projected capital ratios, efficiency
ratios, net income and earnings. We encourage investors to understand
forward-looking statements to be strategic objectives rather than absolute
targets of future performance. We wish to caution you that these
forward- looking statements may differ materially from actual results
due to a number of
risks and uncertainties. For a more detailed description of the
factors that may
affect Susquehanna’s operating results, we refer you to our filings with the
Securities & Exchange Commission, including our annual report on
Form 10-K
for the year ended December 31, 2012 and Form 10-Q for the quarter ended
March 31, 2013. Susquehanna assumes no obligation to update the forward-
looking statements made during this presentation.
For more information, please visit our Web site at:
www.susquehanna.net
2 |
 Who is
Susquehanna? Who is Susquehanna?
Corporate Overview
Super-community bank headquartered in
Lititz, PA
261 banking offices concentrated in Central
PA, Western MD, and Philadelphia and
Baltimore MSAs
37
largest U.S. commercial bank by assets
and 2
largest headquartered in PA
Experienced management team with extensive
market knowledge
Franchise is a diversified mix of consumer and
business customers, products and revenue
sources
Non-bank affiliates offering products and
services in:
Wealth management
Insurance brokerage and employee benefits
Commercial finance
Vehicle leasing
Selected Data as of 3/31/2013
Assets:
$18.0 billion
Deposits:
$12.7 billion
Loans & Leases:
$13.0 billion
Assets under management
$7.9 billion
and administration:
Market Cap:
>$2.1 billion*
Average daily volume (3 months)
>1 million shares
Institutional ownership
>
70%
Dividend yield
2.80%**
NASDAQ Listed
SUSQ
* Based on closing price on May 3, 2013
**Based on 1Q12 dividend of $.08 per share
3
th
nd |
 Uniquely Positioned
Source: SNL Financial
Note: Regulatory branch and deposit data as of June 30, 2012; banks and thrifts with
deposits in counties SUSQ operates in PA/NJ/MD/WV Traditional branches only,
as defined by SNL 4
Rank
Institution
Branch Count
Total Deposits
in Market
($000)
Total Market
Share (%)
1
Wells Fargo & Co.
373
41,021,142
15.3%
2
PNC Financial Services Group Inc.
357
27,078,388
10.1%
3
Bank of America Corp.
224
25,599,340
9.5%
4
M&T Bank Corp.
292
23,873,751
8.9%
5
Toronto-Dominion Bank
164
19,136,622
7.1%
6
Royal Bank of Scotland Group Plc
177
17,058,543
6.3%
7
Susquehanna Bancshares Inc.
262
12,569,634
4.7%
8
Fulton Financial Corp.
187
9,428,543
3.5%
9
Banco Santander SA
176
8,654,240
3.2%
10
National Penn Bancshares Inc.
110
5,622,573
2.1%
11
BB&T Corp.
68
4,051,430
1.5%
12
Beneficial Mutual Bancorp Inc. (MHC)
61
3,645,268
1.4%
13
First Niagara Financial Group Inc.
63
2,684,122
1.0%
14
Metro Bancorp Inc.
33
2,106,159
0.8%
15
Citigroup Inc.
26
2,015,670
0.8%
Total
(1-15)
2,573
204,545,425
76.1%
Total
(1-248)
3,970
268,686,154
100.0%
Deposit Market Share: Counties of Operation
Top 3 market share in 12
counties
Top 5 market share in half the
MSAs where we do business
Largest locally based
community bank
Increased share in 14 out of
22 MSAs from 2011 to 2012
Significant opportunities exist
to gain market share |
 Building on Momentum
Regional structure that empowers local community bankers with
the authority, incentives and products they need to drive loan
growth, particularly in consumer lending and small business and
middle-market banking
Peer leading net interest margin to be defended by further
improving funding costs, including continued core deposit
growth, and ongoing active balance sheet management
Growing fees as a percentage of total revenues by investing in
non-bank businesses, building full client relationships and
maximizing significant untapped cross-sell potential
Committed to continuous delivery model improvement, after
streamlining expense structure and improving efficiency in 2012
Strong capital position and focus on growing returns enhances
ability to execute on organic and strategic growth opportunities
5
1.
Take share, drive
organic loan growth
2.
Defend Margin
3.
Grow fee revenue
4.
Maintain efficiency
5.
Accelerate capital
generation and returns
Opportunity
Susquehanna |
 Core
Deposit Growth Commercial and Consumer
Loan Growth
Expand Fee Income as a % of
Total Revenue
Differentiated Customer
Experience
Elevate Employee Engagement
Focus for 2013
Focus for 2013
6
Technology and mobile delivery
Retail and commercial products
enhancements
Enhance C&I talent and capacity
Increase cross-sell
Talent and leadership
development
Process review and
improvements
Objectives
Selected Initiatives |
 1st
Quarter 2013 Highlights 1st Quarter 2013 Highlights
GAAP EPS of $0.23
Increase of 64% from $0.14 in 1Q12
Steady organic loan growth
Commercial loans increased 1.7% linked quarter, 10.7% YOY
Consumer loans increased 2.0% linked quarter, 10.8% YOY
Construction loans decreased by 8.1% linked quarter, 21.6% YOY
Total loans and leases grew 0.8% linked quarter, 3.8% YOY
Continued core deposit growth
Core deposits grew 1.1% linked quarter, 5.7% YOY
Strong net interest margin
1Q 2013 net interest margin of 3.97%
Solid credit quality metrics
NPAs at 0.97% of loans, leases and foreclosed real estate
Strong coverage ratio with allowance representing 171% of nonaccrual loans
and leases
7 |
 Momentum:
Loan Growth
Total Loans 12/31/2007
Total Loans 3/31/2013
8
$8.8 Billion
$13.0 Billion
Organic Loan CAGR:
3.3%
Strong Loan Growth Momentum
Total loans and leases grew 3.8% since March 31, 2012
1Q 2013 loan and lease originations were up 35% from 1Q 2012
|
 Asset
Quality Continues to Improve 9
Net Charge-Offs / Average Loans & Leases (%)
NPAs / Loans & leases + foreclosed real estate (%)
ALLL / Nonaccrual loans & leases (%)
99
171
0.62
1.33
2.26
0.97 |
 Positioned For Further Growth
10
Pennsylvania Market
Delaware Valley Market
Maryland Market
Includes Baltimore and four of the
nation’s 45 most-affluent counties
including no. 5, Howard County.
Growth opportunities fueled by world-
leading education, health care and
research institutions, as well as major
federal agencies and contractors.
The 16 counties comprising the company’s Pennsylvania Market, the 10 counties
comprising the company’s Delaware Valley Market and the 13 counties comprising the company’s Maryland Market
are
listed
in
the
“Additional
Materials”
slides
at
the
conclusion
of
this
presentation
Foundation for growth with stable
commercial and retail banking base
providing ample deposits.
Home to distribution hubs for global
retailers, manufacturers and
distributors serving Northeast and
Mid-Atlantic markets.
Includes Philadelphia and
the state’s four most-affluent
counties.
Growth opportunities fueled by
world-leading education, health
care and research institutions. |
 Market Opportunity
11
HOME MARKET:
METRO GROWTH MARKETS:
Central PA
Philadelphia
Baltimore
2007
2012
2012
2012
Total Deposits
$55.5 B
$65.3 B
18% Growth
$128.5 B
$63.0 B
in Current Market
SUSQ Deposits
$2.2 B
$5.9 B
170% Growth
$3.0 B
$1.2 B
Rank/Market Share
#9 / 3.9%
#5 / 9.0%
#8 / 2.4%
#7 / 1.9%
Primary Competitors
PNC, M&T, Fulton
TD, RBS, PNC
M&T, PNC, BB&T
Median Household Income
$50,976
$58,051
$62,687
Estimated Household Income
19.7%
23.1%
22.8%
Growth from 2011-2016
Population
3.6 M
3.7 M
3.5% Growth
5.3 M
2.7 M
Estimated Population
3.1%
1.8%
2.3%
Growth from 2011-2016
# of Businesses with
135,105
222,902
102,402
< $10M in Sales
1
Source: FDIC Deposit Market Share Report
2
Source: SNL, ESRI. Household Income data reported for Philadelphia and
Baltimore metro markets represents Philadelphia-Camden-Wilmington and Baltimore-Towson MSAs, respectively
3
Source: SNL, ESRI
4
Source: The Nielsen Company
5
16
counties
comprising
Susquehanna’s
Pennsylvania
Market.
Please
refer
to
the
market
definitions
set
forth
in
the
“Additional
Materials”
slides
at
the
conclusion
of
this
presentation.
6
Philadelphia Metro = Bucks, Burlington, Camden, Chester, Delaware, Gloucester,
Montgomery and Philadelphia counties 7
Baltimore Metro = Anne Arundel, Baltimore, Baltimore (City), Carroll, Harford and
Howard counties 6
7
5
1
2
2
3
4 |
 Momentum:
Defending Net Interest Margin
Momentum:
Defending Net Interest Margin
12
Active Balance Sheet Management
Focus on core deposit growth
FHLB debt prepayment (4Q 2011)
Trust preferred and sub debt redemption
(3Q/4Q 2012)
Countering the Headwinds
Increase low cost core deposits
$400+ million in high rate CD’s maturing in 2013
Additional opportunities to reduce funding costs
may still exist
*
Peer company information is average of peer data per SNL Financial. Identification of peer
companies is included in the “Additional Materials” at the conclusion of this presentation. |
 Strong Core Deposit Growth
13
$8.9 Billion
$12.7 Billion
Organic Core Deposit CAGR:
7.8%
Total Deposits 12/31/2007
Total Deposits 3/31/2013
Strong Core Deposit Growth Momentum
Core deposits now account for 71% of total deposits
Core deposit growth of 5.7% since March 31, 2012
Cost of deposits decreased from 2.86% for 4Q 2007 to 0.52% for 1Q 2013
|
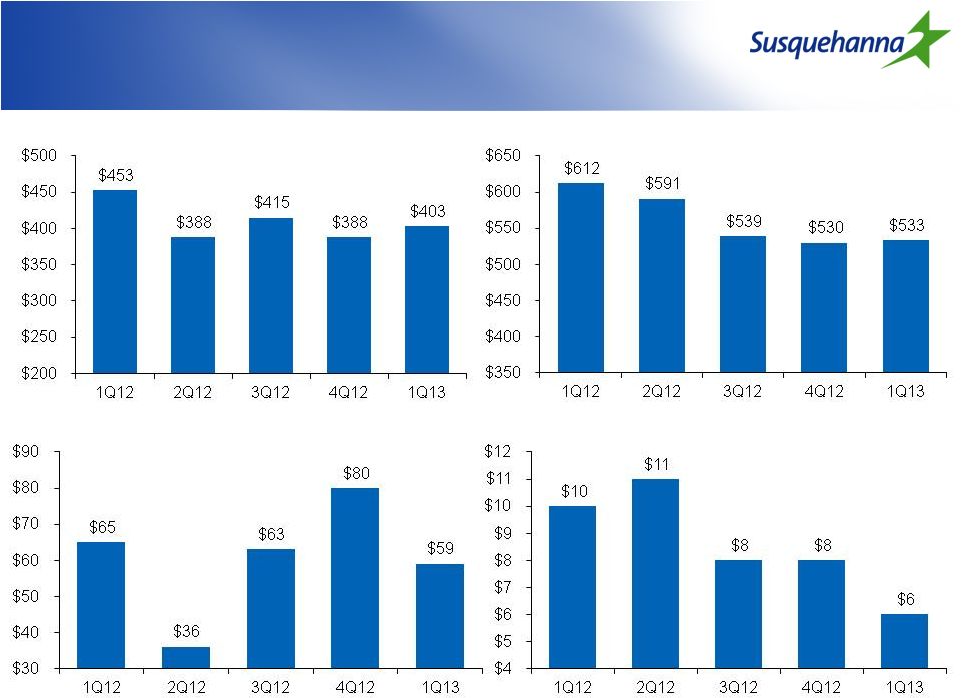
  Momentum:
Growing Fee Revenue
Momentum:
Growing Fee Revenue
14
March 31,
December 31,
March 31,
2012
2012
2013
Service charges on deposit accounts
7,674
$
9,158
$
8,672
$
Vehicle origination and servicing fees
1,924
3,746
3,354
Wealth management commisions and fees
11,602
11,882
12,390
Commisions on property and casualty insurance sales
5,058
3,749
4,542
Other comissions and fees
4,643
6,680
5,237
Income from bank-owned life insurance
1,472
1,603
1,850
Mortgage banking revenue
3,513
4,835
4,110
Fee Revenue ($000) - Quarter Ending |
 Momentum:
Efficiency Focus Benefits Core Performance
15
Successfully lowered efficiency ratio from 66.83% for 2011 to 60.37% for
2012 Achieved desired cost savings of $58 million from acquisitions and core
Susquehanna operations
Opportunity
exists
to
optimize
delivery
model,
including
planned
investments
in
technology and web/mobile banking
*Efficiency ratio excludes net realized gain on acquisition, merger related expenses and loss on
extinguishment of debt. Please refer to the calculations on the slides titled “Non-GAAP Reconciliation” at the
conclusion of this presentation.
|
 Momentum:
Capital Generation and Returns
Momentum:
Capital Generation and Returns
Capital ratios remain strong
•
Support continued organic growth
•
Position for changing regulatory landscape
•
Increase quarterly cash dividends to shareholders
•
Consider strategic M&A opportunities
16
Tangible
Common
Equity
Tier 1
Common /
RWA
Tier 1
Leverage
Tier 1
Risk-Based
Total
Risk-Based
Mar. 31, 2012
8.22%
10.20%
9.23%
11.34%
12.88%
Management
Minimum
Target
7.50%
8.00%
6.00%
9.50%
11.50%
1
The tangible common equity ratio is a non-GAAP based financial measure.
Please refer to the calculations and management’s reasons for using this measure on the slide titled
“Non-GAAP Reconciliation”
at the conclusion of this presentation.
1
Capital generation has benefited from leading ROATE and 30-35%
dividend payout ratio
Growing capital strength ensures ability to execute on capital
allocation priorities |
 |
 Building on Momentum
Regional structure that empowers local community bankers with
the authority, incentives and products they need to drive loan
growth, particularly in consumer lending and small business and
middle-market banking
Peer leading net interest margin to be defended by further
improving funding costs, including continued core deposit
growth, and ongoing active balance sheet management
Growing fees as a percentage of total revenues by investing in
non-bank businesses, building full client relationships and
maximizing significant untapped cross-sell potential
Committed to continuous delivery model improvement, after
streamlining expense structure and improving efficiency in 2012
Strong capital position and focus on growing returns enhances
ability to execute on organic and strategic growth opportunities
18
1.
Take share, drive
organic loan growth
2.
Defend Margin
3.
Grow fee revenue
4.
Maintain efficiency
5.
Accelerate capital
generation and returns
Opportunity
Susquehanna |
 Additional Materials |
 Executive Leadership Team
20 |
 Critical Mass in Attractive Markets
1
The 16 counties comprising the company’s Pennsylvania Market, the 10 counties
comprising the company’s Delaware Valley Market and the 13 counties
comprising
the
company’s
Maryland
Market
are
listed
in
the
“Additional
Materials”
slides
at
the
conclusion
of
this
presentation
2
Company data as of 3/31/13. Percentages based on internal company
commercial and retail market allocations. Excludes leases and tax free loans and brokered and inter-company deposits.
3
FDIC June 30 deposit market share data as reported by SNL Financial for the counties
comprising each of the company’s three markets. 4
U.S. Census Bureau’s American Community Survey of median household income by
county Pennsylvania Market
21
Susquehanna
Bank
Market
1
Pennsylvania
Delaware
Valley
Maryland
Branches
119
76
66
Loans as % of total
48%
23%
29%
Deposits as % of total
43%
30%
27%
Deposit market share (rank)
9.0%
(5
th
)
2.7%
(8
th
)
4.5%
(6
th
)
7.6%
(6
th
)
1.3%
(9
th
)
3.8%
(6
th
)
3.9%
(9
th
)
1.2%
(12
th
)
4.2%
(7
th
)
Foundation for growth with stable
commercial and retail banking base
providing ample deposits.
Home to distribution hubs for global retailers,
manufacturers and distributors serving
Northeast and Mid-Atlantic markets.
Includes Philadelphia and the state’s four
most-affluent counties.
4
Growth opportunities fueled by world-leading
education, health care and research institutions.
Includes Baltimore and four of the nation’s
45 most-affluent counties including no. 5,
Howard County.
4
Growth opportunities fueled by world-leading
education, health care and research institutions,
as well as major federal agencies and
contractors.
2
2
3
2012
2011
2007
Maryland Market
Delaware Valley Market |
 1st
Quarter 2013 Financial Highlights 1st Quarter 2013 Financial Highlights
(Dollars in thousands, except earning per share data)
3/31/2013
12/31/2012
3/31/2012
Balance Sheet:
Loans and Leases
12,999,703
$
12,894,741
$
12,521,669
$
Deposits
12,691,432
$
12,580,046
$
12,563,541
$
Income Statement:
Net interest income
149,206
$
155,304
$
134,123
$
Pre-tax pre-provision income *
74,121
$
75,262
$
64,762
$
Provision for loan and lease losses
12,000
$
13,000
$
19,000
$
GAAP Net Income
42,399
$
43,174
$
23,474
$
GAAP EPS
0.23
$
0.23
$
0.14
$
Quarterly Performance Highlights
22
* Core: Excludes merger-related expenses, net gain on acquisition and loss on
extinguishment of debt |
    Quarterly Loan and Lease
Originations
Quarterly Loan and Lease
Originations
Average
Balance*
($ in Millions)
Balance
Originations
Balance
Originations
Balance
Originations
Balance
Originations
Balance
Originations
Commercial
1,708
$
115
$
1,847
$
206
$
1,870
$
167
$
1,898
$
226
$
1,996
$
224
$
Real Estate - Const & Land
863
95
936
74
899
101
859
92
797
137
Real Estate - 1-4 Family Res
2,033
68
2,262
101
2,279
86
2,274
72
2,266
57
Real Estate - Commercial
3,872
191
4,350
110
4,315
121
4,276
136
4,295
206
Real Estate - HELOC
1,013
52
1,128
88
1,169
93
1,209
89
1,235
113
Tax-Free
346
53
379
22
390
55
430
4
427
3
Consumer Loans
736
96
764
116
794
110
810
104
820
114
Commercial Leases
287
76
306
79
299
81
289
85
287
78
Consumer Leases
367
43
376
65
424
86
512
167
644
138
VIE
187
-
180
-
173
-
168
-
162
-
Total
11,412
$
789
$
12,528
$
862
$
12,612
$
900
$
12,725
$
975
$
12,929
$
1,070
$
1Q13
4Q12
3Q12
2Q12
1Q12
23
*By collateral type |
 Loan
Mix & Yield Loan Mix & Yield
24
*By collateral type
$ in millions
Avg Bal QTR*
INT % QTR
Commercial
$ 1,708
5.24%
$ 1,847
5.43%
$ 1,870
5.31%
$ 1,898
5.35%
$ 1,996
5.28%
Real Estate -
Const & Land
863
5.60%
936
5.66%
899
5.64%
859
5.90%
797
6.05%
Real Estate -
1-4 Family Res
2,033
5.27%
2,262
5.26%
2,279
5.03%
2,274
4.97%
2,266
4.91%
Real Estate -
Commercial
3,872
5.46%
4,350
5.78%
4,315
5.60%
4,276
5.51%
4,295
5.43%
Real Estate -
HELOC
1,013
3.98%
1,128
3.81%
1,169
3.82%
1,209
3.74%
1,235
3.68%
Tax-Free
346
5.60%
379
5.45%
390
5.40%
430
5.47%
427
5.10%
Consumer Loans
736
5.33%
764
5.21%
794
5.02%
810
4.95%
820
4.77%
Commercial Leases
287
7.98%
306
7.72%
299
7.48%
289
7.50%
287
7.56%
Consumer Leases
367
4.73%
376
4.60%
424
4.30%
512
4.11%
644
3.88%
VIE
187
4.47%
180
4.46%
173
4.42%
168
4.39%
162
4.36%
Total Loans
$11,412
5.29%
$12,528
5.33%
$12,612
5.23%
$12,725
5.18%
$12,929
5.03%
1Q13
4Q12
3Q12
2Q12
1Q12 |
 CRE
and Construction Composition 25
At March 31, 2013
Industrial/Manufacturing, 2%
Recreational, 1%
Multi-Family, 5%
Commercial Construction,
5%
Mixed Use, 5%
Hotels -
Motels, 6%
Warehouse, 6%
Land, 7%
Residential, 9%
Other, 13%
Service, 9%
Retail, 15%
Office, 17% |
 Asset
Quality ($ in Millions)
Asset Quality
($ in Millions)
($ in million)
1Q12
2Q12
3Q12
4Q12
1Q13
NPL's Beginning of Period
156.5
$
133.5
$
127.3
$
118.4
$
97.8
$
New NonAccruals
22.3
34.5
17.3
19.0
23.1
Cure/Exits/Other
(28.8)
(16.8)
(6.2)
(21.5)
1.5
Gross Charge-Offs
(11.0)
(17.3)
(15.8)
(15.4)
(15.5)
Transfer to OREO
(5.5)
(6.6)
(4.2)
(2.7)
(3.5)
NPL's End of Period
133.5
$
127.3
$
118.4
$
97.8
$
103.4
$
26
Non Accruals
TDRs |
 Asset
Quality ($ in Millions)
Asset Quality
($ in Millions)
27
Past due 90 days or more
Past Due 30-89 days
OAEM
Substandard |
  Investment Securities
$ in millions
EOP Balance
QTR Yield
Total Investment Securities
$2,757
$2,866
$2,908
$2,730
$2,553
Duration (years)
3.6
3.6
3.6
3.6
3.6
Yield
3.09%
2.92%
2.69%
2.59%
2.64%
Unrealized Gain/(Loss)
$30.8
$40.8
$61.9
$57.1
$50.6
1Q13
4Q12
3Q12
2Q12
1Q12
28 |
   Deposit
Mix & Cost by Product Deposit Mix & Cost by Product
$ in millions
Avg Bal QTR
INT % QTR
Demand
$1,688
0.00%
1,922
$
0.00%
1,938
$
0.00%
1,945
$
0.00%
1,918
$
0.00%
Interest Bearing Demand
4,990
0.46%
5,480
0.39%
5,537
0.35%
5,803
0.33%
5,895
0.32%
Savings
930
0.14%
1,005
0.13%
1,003
0.11%
1,019
0.11%
1,049
0.11%
Certificates of Deposits
3,747
1.29%
4,065
1.13%
4,111
1.17%
3,835
1.21%
3,778
1.21%
Total Interest-Bearing Deposits
$9,667
0.75%
10,550
$
0.65%
10,651
$
0.64%
10,657
$
0.62%
10,722
$
0.62%
Core Deposits/Total
Loans(excluding VIE)/Deposits
99.0%
1Q12
67.0%
98.9%
3Q12
67.3%
98.8%
2Q12
67.4%
1Q13
70.1%
101.0%
4Q12
69.6%
99.6%
29 |
 Borrowing Mix & Cost
30
$ in millions
Avg Bal QTR
INT % QTR (excludes SWAP expense)
Short-Term Borrowings
$ 642
0.27%
$ 726 0.29%
$ 749
0.28%
$ 811 0.26%
$ 817
0.25%
FHLB Advances
985
0.21%
1,082 0.33%
1,073
0.35%
1,167 0.36%
1,155
0.33%
Long Term Debt
674
5.11%
686 4.93%
727
4.85%
561 1.19%
509
3.28%
Total Borrowings
$2,301
1.66%
$2,494 1.58%
$2,549
1.62%
$2,539 0.51%
$2,481
0.91%
Off Balance Sheet Swap Impact
675
0.74%
675 0.70%
675
0.69%
675 0.71%
927
0.73%
Total Borrowing Cost
Avg Borrowings / Avg Total
Assets
14.1%
1Q13
1.64%
13.8%
2.40%
2Q12
2.28%
14.0%
1Q12
4Q12
1.22%
14.1%
3Q12
2.31%
14.1% |
  Quarterly Fee Revenue
31
March 31,
June 30,
September 30,
December 31,
March 31,
2012
2012
2012
2012
2013
Service charges on deposit accounts
7,674
$
8,583
$
9,013
$
9,158
$
8,672
$
Vehicle origination and servicing fees
1,924
2,226
2,470
3,746
3,354
Wealth management commisions and fees
11,602
12,297
11,923
11,882
12,390
Commisions on property and casualty insurance sales
5,058
3,930
3,158
3,749
4,542
Other comissions and fees
4,643
4,800
5,387
6,680
5,237
Income from bank-owned life insurance
1,472
1,631
1,726
1,603
1,850
Mortgage banking revenue
3,513
4,343
5,113
4,835
4,110
Net realized gain (loss) on sales of securities
385
1,361
31
(103)
406
Net impairment losses recognized in earnings
(144)
-
-
(97)
(388)
Other
3,388
640
4,840
2,319
2,471
Total*
39,515
$
39,811
$
43,661
$
43,772
$
42,644
$
Noninterest Income ($000)
*Excludes Net realized gain on acquisitions |
 Earnings Drivers
($000)
1Q12
2Q12
3Q12
4Q12
1Q13
Avg. interest-earning assets
$14,065,583
$15,332,806
$15,537,037
$15,604,029
$15,642,309
Net interest margin (FTE)
3.94%
4.10%
3.92%
4.06%
3.97%
Net interest income
$134,123
$152,670
$149,142
$155,304
$149,206
Noninterest income
39,515
39,811
43,661
43,772
42,644
Total revenue
173,638
192,481
192,803
199,076
191,850
Noninterest expense
108,876*
118,157*
115,959*
123,814*
117,729
Pre-tax, pre-provision income
64,762*
74,324*
76,844*
75,262*
74,121
Provision for loan losses
19,000
16,000
16,000
13,000
12,000
Pre-tax income
$45,762*
$58,324*
$60,844*
$62,262*
$62,121
* Core: Excludes merger-related expenses, net gain on acquisition and loss on
extinguishment of debt 32
2013 Financial Targets
FTE margin
3.90%
Loan growth
5.00%
Deposit growth
6.00%
Non-interest income growth
8.00%
Non-interest expense growth
-2.00%
Tax rate
31.00%
Note:
The
growth
percentages
included
in
these
financial
targets
are
based
upon
2012
reported numbers and not core numbers. |
 Susquehanna Bank Markets
33
Pennsylvania Market:
Adams, PA
Berks, PA
Centre, PA
Cumberland, PA
Dauphin, PA
Lancaster, PA
Lebanon, PA
Lehigh, PA
Luzerne, PA
Lycoming, PA
Northampton, PA
Northumberland, PA
Schuylkill, PA
Snyder, PA
Union, PA
York, PA
Maryland Market:
Allegany, MD
Anne Arundel, MD
Baltimore, MD
Bedford, PA
Berkley, WV
Carroll, MD
Franklin, PA
Fulton, PA
Garrett, MD
Harford, MD
Howard, MD
Washington, MD
Worcester, MD
Delaware Valley Market:
Atlantic, NJ
Bucks, PA
Burlington, NJ
Camden, NJ
Chester, PA
Cumberland, NJ
Delaware, PA
Gloucester, NJ
Montgomery, PA
Philadelphia, PA
Baltimore
City,
MD |
 Peer
Companies Peer Companies
34
Associated Banc-Corp
BancorpSouth, Inc.
City National Corporation
Commerce Bancshares, Inc.
Cullen/Frost Bankers, Inc.
F.N.B. Corporation
First Horizon National Corporation
First Niagara Financial Group, Inc.
FirstMerit Corporation
Fulton Financial Corporation
Hancock Holding Company
IBERIABANK Corporation
People's United Financial, Inc.
Prosperity Bancshares, Inc.
Signature Bank
TCF Financial Corporation
UMB Financial Corporation
Valley National Bancorp
Webster Financial Corporation
Wintrust Financial Corporation |
 Non-GAAP Reconciliation
(Dollars and share data in thousands)
Non-GAAP Reconciliation
(Dollars and share data in thousands)
35
1Q13
4Q12
3Q12
2Q12
1Q12
Efficiency Ratio
Other expense
117,729
$
125,277
$
122,910
$
121,475
$
120,355
$
Less: Merger related expenses
0
(1,054)
(1,500)
(3,318)
(11,479)
Loss on extinguishment of debt
0
(409)
(5,451)
0
0
Noninterest operating expense (numerator)
117,729
$
123,814
$
115,959
$
118,157
$
108,876
$
Taxable-equivalent net interest income
153,021
$
159,332
$
152,948
$
156,416
137,837
Other income
42,644
43,772
43,661
39,811
39,515
Denominator
195,665
$
203,104
$
196,609
$
196,227
$
177,352
$
Efficiency ratio
60.17%
60.96%
58.98%
60.21%
61.39%
Tangible Common Ratio
End of period balance sheet data
Shareholders' equity
2,639,489
$
2,595,909
$
2,584,682
$
2,544,730
$
2,512,584
$
Goodwill and other intangible assets
(1)
(1,266,610)
(1,263,563)
(1,263,361)
(1,267,630)
(1,268,582)
Tangible common equity (numerator)
1,372,879
$
1,332,346
$
1,321,321
$
1,277,100
$
1,244,002
$
Assets
17,967,174
$
18,037,667
$
18,106,730
$
18,040,009
$
17,807,026
$
Goodwill and other intangible assets
(1)
(1,266,610)
(1,263,563)
(1,263,361)
(1,267,630)
(1,268,582)
Tangible assets (denominator)
16,700,564
$
16,774,104
$
16,843,369
$
16,772,379
$
16,538,444
$
Tangible common ratio
8.22%
7.94%
7.84%
7.61%
7.52%
(1)
Net of applicable deferred income taxes
The efficiency ratio is a non-GAAP based financial measure. Management
excludes merger-related expenses and certain other selected items when
calculating this ratio, which is used to measure the relationship of operating expenses to revenues.
The tangible common ratio is a non-GAAP based financial measure using non-GAAP based
amounts. The most directly comparable GAAP-based measure is the ratio of common
shareholders’ equity to total assets. In order to calculate tangible common shareholders equity and assets, our
management subtracts the intangible assets from both the common shareholders’ equity and total
assts. Tangible common equity is then divided by the tangible assets to arrive at the
ratio. Management uses the ratio to assess the strength of our capital position. |
 Non-GAAP Reconciliation
(Dollars and share data in thousands)
Non-GAAP Reconciliation
(Dollars and share data in thousands)
36
1Q13
4Q12
3Q12
2Q12
1Q12
Return on Average Tangible Equity
Income statement data
Net income
42,399
$
43,174
$
36,732
$
37,793
$
23,473
$
Amortization of intangibles, net of taxes at 35%
2,124
2,127
2,169
2,211
1,789
Net tangible income (numerator)
44,523
$
45,301
$
38,901
$
40,004
$
25,262
$
Average balance sheet data
Shareholders' equity
2,614,319
$
2,597,254
$
2,562,092
$
2,537,250
$
2,348,326
$
Goodwill and other intangible assets
(1,312,662)
(1,311,192)
(1,315,071)
(1,320,658)
(1,132,344)
Tangible common equity (denominator)
1,301,657
$
1,286,062
$
1,247,021
$
1,216,592
$
1,215,982
$
Return on equity (GAAP basis)
6.58%
6.61%
5.70%
5.99%
4.02%
Effect of goodwill and other intangibles
7.29%
7.40%
6.71%
7.24%
4.34%
Return on average tangible equity
13.87%
14.01%
12.41%
13.23%
8.36%
Return on average tangible equity is a non-GAAP based financial measure calculated using
non-GAAP based amounts. The most directly comparable GAAP-based measure is return
on average equity. We calculate return on average tangible equity by excluding the balance of
intangible assets and their related amortization expense from our calculation of return on average
equity. Management uses the return on average tangible equity in order to review our core
operating results. Management believes that this is a better measure of our performance. In
addition, this is consistent with the treatment by bank regulatory agencies, which excludes goodwill
and other intangible assets from the calculation of risk-based capital ratios.
|