Attached files
| file | filename |
|---|---|
| EX-99.1 - EX-99.1 - STONERIDGE INC | v344471_ex99-1.htm |
| 8-K - FORM 8-K - STONERIDGE INC | v344471_8k.htm |

1 Stoneridge, Inc . First Quarter 2013 Earnings Release Presentation May 9, 2013 Exhibit 99.2

Statements in this presentation that are not historical facts (including, but not limited to, 2013 net sales guidance) are forward - looking statements, which involve risks and uncertainties that could cause actual events or results to differ materially from those expressed or implied by the statements. Important factors that may cause actual results to differ materially from those in the forward - looking statements include, among other factors, the loss or bankruptcy of a major customer; the costs and timing of facility closures, business realignment or similar actions; a significant change in medium - and heavy - duty truck, automotive or agricultural and off - highway vehicle production; our ability to achieve cost reductions that offset or exceed customer - mandated selling price reductions; a significant change in general economic conditions in any of the various countries in which Stoneridge operates; labor disruptions at Stoneridge’s facilities or at any of Stoneridge’s significant customers or suppliers; the ability of suppliers to supply Stoneridge with parts and components at competitive prices on a timely basis; the amount of Stoneridge’s indebtedness and the restrictive covenants contained in the agreements governing its indebtedness, including its asset - based credit facility and senior secured notes; customer acceptance of new products; capital availability or costs, including changes in interest rates or market perceptions; the failure to achieve successful integration of any acquired company or business and the items described in “Risk Factors” and other uncertainties or risks discussed in Stoneridge’s periodic and current reports filed with the Securities and Exchange Commission. Important factors that could cause the performance of the commercial vehicle and automotive industry to differ materially from those in the forward - looking statements include factors such as (1) continued economic instability or poor economic conditions in the United States and global markets, (2) changes in economic conditions, housing prices, foreign currency exchange rates, commodity prices, including shortages of and increases or volatility in the price of oil, (3) changes in laws and regulations, (4) the state of the credit markets, (5) political stability, (6) international conflicts and (7) the occurrence of force majeure events. Forward Looking Statements

Forward Looking Statements (cont’d) Also, see Rounding Differences Disclosure below These factors should not be construed as exhaustive and should be considered with the other cautionary statements in Stoneridge’s filings with the Securities and Exchange Commission. Forward - looking statements are not guarantees of future performance; Stoneridge’s actual results of operations, financial condition and liquidity, and the development of the industry in which Stoneridge operates may differ materially from those described in or suggested by the forward - looking statements contained in this presentation. In addition, even if Stoneridge’s results of operations, financial condition and liquidity, and the development of the industry in which Stoneridge operates are consistent with the forward - looking statements contained in this presentation, those results or developments may not be indicative of results or developments in subsequent periods. This presentation contains time - sensitive information that reflects management’s best analysis only as of the date of this presentation. Any forward - looking statements in this presentation speak only as of the date of this presentation, and Stoneridge undertakes no obligation to update such statements. Comparisons of results for current and any prior periods are not intended to express any future trends or indications of future performance, unless expressed as such, and should only be viewed as historical data. Stoneridge does not undertake any obligation to publicly update or revise any forward - looking statement as a result of new information, future events or otherwise, except as otherwise required by law . Rounding Differences : There may be slight immaterial differences between figures represented in our public filings compared to what is shown in this presentation. The differences are the a result of rounding due to the representation of values in millions rather than thousands in our public filings.

Sales, Gross Profit, & Op Income – 1Q12 vs 1Q13 1Q12 1Q13 SRI Variance millions SRI Core PST Ops PST PPA SRI $ % Sales 262.3 193.3 42.4 0.0 235.7 (26.6) (10.1%) COGS 197.1 152.3 24.4 0.3 177.0 (20.1) (10.2%) Gross Profit 65.1 41.0 18.1 (0.3) 58.7 (6.4) (9.8%) GP % to Sales 24.8% 21.2% 42.6% 24.9% SGA 53.3 31.7 15.1 1.6 48.4 (4.9) (9.1%) SGA % to Sales 20.3% 16.4% 35.7% 20.5% Op Income 11.8 9.3 2.9 (1.9) 10.3 (1.6) (13.1%) OI % to Sales 4.5% 4.8% 6.9% 4.4% 42.4 24.7 17.8 16.8 1.0 193.3 152.3 41.0 31.7 9.3 0% 20% 40% 60% 80% 100% Sales COGS Gross Profit SGA Op Income PST Core

Sales by Segment – 1Q13 vs 1Q12 1Q13 1Q12 CD ELEC WIRING PST SRI CD ELEC WIRING PST SRI Pass Car / Light Truck 56.5 1.0 0.2 0.0 57.6 53.5 1.2 0.4 0.0 55.1 Med / HD Truck 5.6 42.7 41.5 0.8 90.7 6.7 40.8 56.9 0.0 104.4 Ag 4.6 0.0 33.9 0.0 38.6 4.0 0.4 37.6 0.0 41.9 PST / Other 5.1 0.8 1.3 41.6 48.8 6.2 1.1 0.0 53.7 60.9 TOTAL 71.9 44.5 76.8 42.4 235.7 70.4 43.4 94.8 53.7 262.3 Variance $ Variance % 1Q13 vs 1Q12 1Q13 vs 1Q12 CD ELEC WIRING PST SRI CD ELEC WIRING PST SRI Pass Car / Light Truck 3.0 (0.2) (0.2) 0.0 2.6 5.6% (19.1)% (52.9)% 0.0% 4.7% Med / HD Truck (1.1) 1.9 (15.3) 0.8 (13.7) (15.9)% 4.6% (26.9)% 0.0% (13.1)% Ag 0.7 (0.3) (3.7) 0.0 (3.3) 16.6% (93.5)% (9.7)% 0.0% (8.0)% PST / Other (1.1) (0.2) 1.3 (12.1) (12.1) (17.4)% (20.8)% 0.0% (22.5)% (19.8)% TOTAL 1.5 1.1 (17.9) (11.3) (26.6) 2.2% 2.5% (18.9)% (21.0)% (10.1)%

1Q12 vs 1Q13 EPS Bridge PST Impacts SRI Core TOTAL Volume (0.05) (0.12) (0.17) Mix / Direct Material 0.00 (0.03) (0.03) Copper 0.00 0.03 0.03 FX (0.02) (0.01) (0.03) Other 0.00 (0.03) (0.03) Interest 0.01 0.01 0.02 SGA Drop / Cost Reduction 0.09 0.03 0.12 PST Cost Reduct / Purchase Acctg 0.02 0.00 0.02 TOTAL 0.05 (0.12) (0.07) 0.15 0.02 0.12 0.02 (0.03) (0.03) 0.03 (0.03) (0.17) 0.22 1Q13 Actual EPS PST Cost Reduct / Purchase Acctg SGA Drop / Cost Reduction Interest Other FX Copper Mix / Direct Material Volume 1Q12 Actual EPS

15,440 16,079 20122 2013 Thousands North American Light Vehicle Production Source: IHS April 2013 3,964 3,987 3,667 3,822 3,984 4,162 3,917 4,016 0.6% (8.0)% 4.2% 4.2% 4.4% (5.9)% 2.5% Q1 2012 Q2 2012 Q3 2012 Q4 2012 Q1 2013 Q2 2013 Q3 2013 Q4 2013 Thousands Auto Qtr vs Qtr % ∆ ↑ 4.1% Guidance derived from customers EDI demand and adjusted for known production estimate changes

186,660 201,205 2012 2013 N.A. Medium Duty Truck Production Source: LMC April 2013 ( previous known as JD Power) 48,200 49,903 42,427 46,130 51,965 53,959 47,644 47,637 3.5% (15.0)% 8.7% 12.6% 3.8% (11.7)% (0.0)% Q1 2012 Q2 2012 Q3 2012 Q4 2012 Q1 2013 Q2 2013 Q3 2013 Q4 2013 NA N.A. Qtr vs Qtr % ∆ ↑ 7.8% Guidance derived from customers EDI demand and adjusted for known production estimate changes

278,929 263,123 2012 2013 N.A. Heavy Duty Truck Production Source: LMC April 2013 (previous known as JD Power) 77,779 78,298 64,946 57,906 57,304 65,805 68,507 71,507 0.7% (17.1)% (10.8)% (1.0)% 14.8% 4.1% 4.4% Q1 2012 Q2 2012 Q3 2012 Q4 2012 Q1 2013 Q2 2013 Q3 2013 Q4 2013 NA N.A. Qtr vs Qtr % ∆ ↓ 5.7% Guidance derived from customers EDI demand and adjusted for known production estimate changes
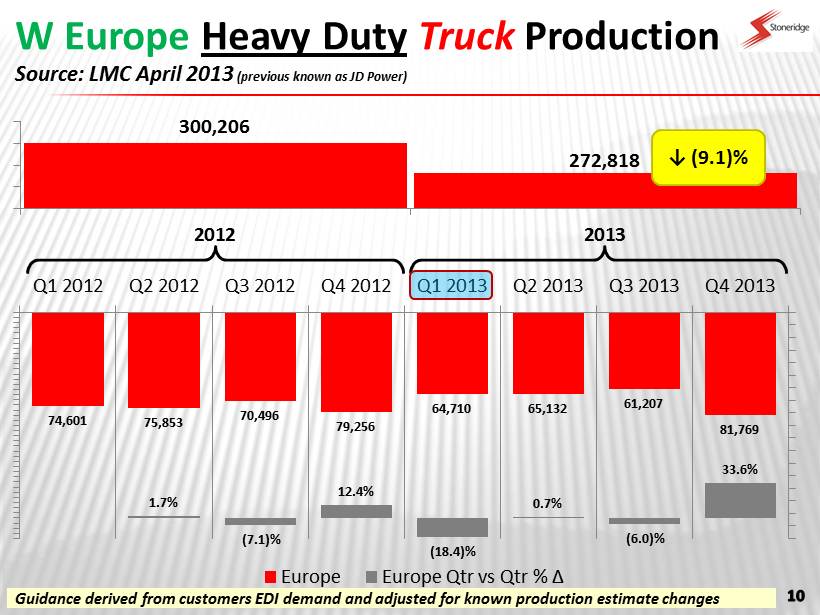
300,206 272,818 2012 2013 W Europe Heavy Duty Truck Production Source: LMC April 2013 (previous known as JD Power) 74,601 75,853 70,496 79,256 64,710 65,132 61,207 81,769 1.7% (7.1)% 12.4% (18.4)% 0.7% (6.0)% 33.6% Q1 2012 Q2 2012 Q3 2012 Q4 2012 Q1 2013 Q2 2013 Q3 2013 Q4 2013 Europe Europe Qtr vs Qtr % ∆ ↓ (9.1)% Guidance derived from customers EDI demand and adjusted for known production estimate changes

PST Purchase Price Accounting Expense [Non Cash] (millions) Q1 Q2 Q3 Q4 Full Year 2012 1Q Est. 2013 COGS / DM Inventory Write Up $1.8 $1.4 $0.0 $0.0 $3.2 $0.0 $0.0 COGS / Depreciation – Fixed Asset Write Up $0.4 $0.3 $0.3 $0.3 $1.3 $0.3 $1.0 SGA / Amortized Intangibles $1.0 $1.1 $1.3 $1.3 $4.7 $1.6 $5.0 TOTAL $3.2 $2.8 $1.6 $1.6 $9.2 $1.9 $6.0 Q1 Q2 Q3 Q4 2012 1Q 2013 E Impact on Op Margin 1.22% 1.20% 0.73% 0.72% 0.98% 0.81% 0.64% Impact on Diluted EPS $(0.06) $(0.05) $(0.03) $(0.03) $(0.17) $(0.04) $(0.11)

Improving Direct Material Costs in 2H12 1Q12 2Q12 1 st Half 3Q12 4Q12 2 nd Half FY 2012 1Q13 Core Direct Material 56.2% 56.7% 56.4% 56.0% 54.9% 55.4% 56.0% 53.9% PST Direct Material * 38.0% 37.8% 37.9% 37.0% 32.1% 34.5% 36.2% 34.9% * Excludes Purchase Accounting Expense • Commodity based material price decreases • Sales price increases (mostly Control Devices) offsetting raw material increases • Redesign of products to lower material content (Control Devices)

Wiring Plant Operations Continuous Improvements DELIVERY Past Due Premium Freight Pieces $ % FY 2012 vs FY 2011 Current w/ all customers $(4.8) (75.5)% Labor Efficiency Mar 2011 vs. Dec 2011 2012 Count % Count % Headcount (1,075) (17.1)% (587) (12.8)% Wiring Business Productivity % % Mar 2011 vs. Dec 2011 2012 Sales / Employee 29.9% 14.0% 2010 vs. 2011 2012 Sales Growth 27.8% 0.2%

Sales, Gross Profit, & Op Income – 4Q12 vs 1Q13 42.4 24.7 17.8 16.8 1.0 193.3 152.3 41.0 31.7 9.3 0% 20% 40% 60% 80% 100% Sales COGS Gross Profit SGA Op Income PST Core 4Q12 1Q13 SRI Variance millions SRI Core PST Ops PST PPA SRI $ % Sales 222.7 193.3 42.4 0.0 235.7 13.0 5.8% COGS 168.1 152.3 24.4 0.3 177.0 8.9 5.3% Gross Profit 54.6 41.0 18.1 (0.3) 58.7 4.1 7.5% GP % to Sales 24.5% 21.2% 42.6% 24.9% SGA 46.0 31.7 15.1 1.6 48.4 2.5 5.4% SGA % to Sales 20.6% 16.4% 35.7% 20.5% Op Income 8.6 9.3 2.9 (1.9) 10.3 1.6 19.0% OI % to Sales 3.9% 4.8% 6.9% 4.4%

Sales by Segment – 1Q13 vs 4Q12 1Q13 4Q12 CD ELEC WIRING PST SRI CD ELEC WIRING PST SRI Pass Car / Light Truck 56.5 1.0 0.2 0.0 57.6 49.9 0.5 0.0 0.0 50.4 Med / HD Truck 5.6 42.7 41.5 0.8 90.7 6.1 39.7 40.8 0.0 86.6 Ag 4.6 0.0 33.9 0.0 38.6 3.7 0.5 31.9 0.0 36.1 PST / Other 5.1 0.8 1.3 41.6 48.8 4.4 0.7 0.0 44.5 49.6 TOTAL 71.9 44.5 76.8 42.4 235.7 64.1 41.4 72.7 44.5 222.7 Variance $ Variance % 1Q13 vs 4Q12 1Q13 vs 4Q12 CD ELEC WIRING PST SRI CD ELEC WIRING PST SRI Pass Car / Light Truck 6.6 0.5 0.2 0.0 7.3 13.2% 100.0% 0.0% 0.0% 14.5% Med / HD Truck (0.5) 3.0 0.7 0.8 4.0 (8.2)% 7.6% 1.7% 0.0% 4.6% Ag 0.9 (0.5) 2.0 0.0 2.4 24.3% (100.0)% 6.3% 0.0% 6.6% PST / Other 0.7 0.1 1.3 (2.9) (0.8) 15.9% 14.3% 0.0% (6.5)% (1.6)% TOTAL 7.7 3.1 4.2 (2.1) 12.9 12.0% 7.5% 5.8% (4.7)% 5.8%

4 Q12 vs 1Q13 EPS Bridge PST Impacts SRI Core TOTAL Volume (0.03) 0.11 0.08 Mix / Direct Material 0.00 (0.02) (0.02) Copper 0.00 0.02 0.02 FX 0.00 0.02 0.02 Other 0.00 0.03 0.03 Interest 0.00 0.00 0.00 SGA Drop / Cost Reduction 0.00 (0.07) (0.07) PST Cost Reduct / Purchase Acctg (0.01) 0.00 (0.01) TOTAL (0.04) 0.09 0.05 0.15 (0.01) (0.07) 0.00 0.03 0.02 0.02 (0.02) 0.08 0.10 1Q13 Actual EPS PST Cost Reduct / Purchase Acctg SGA Drop / Cost Reduction Interest Other FX Copper Mix / Direct Material Volume 4Q12 Actual EPS
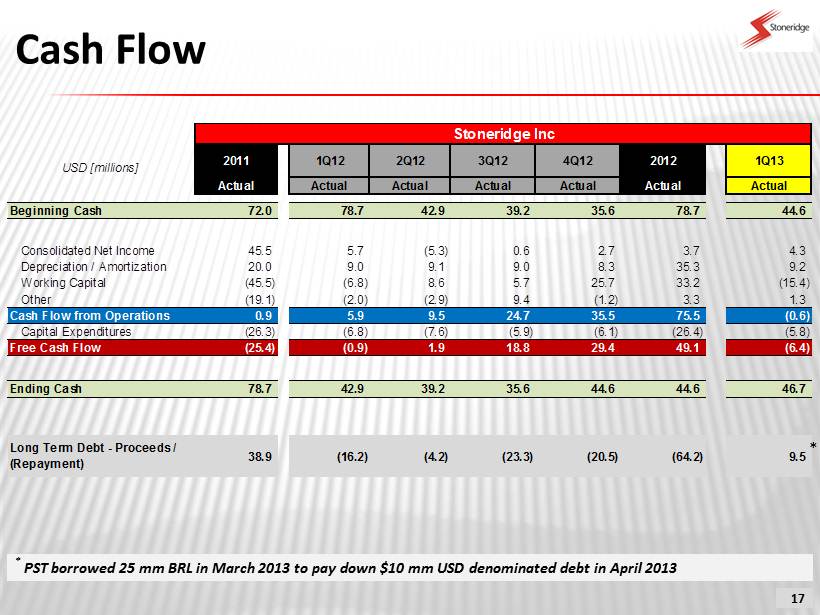
Stoneridge Inc USD [millions] 2011 1Q12 2Q12 3Q12 4Q12 2012 1Q13 Actual Actual Actual Actual Actual Actual Actual Beginning Cash 72.0 78.7 42.9 39.2 35.6 78.7 44.6 Consolidated Net Income 45.5 5.7 (5.3) 0.6 2.7 3.7 4.3 Depreciation / Amortization 20.0 9.0 9.1 9.0 8.3 35.3 9.2 Working Capital (45.5) (6.8) 8.6 5.7 25.7 33.2 (15.4) Other (19.1) (2.0) (2.9) 9.4 (1.2) 3.3 1.3 Cash Flow from Operations 0.9 5.9 9.5 24.7 35.5 75.5 (0.6) Capital Expenditures (26.3) (6.8) (7.6) (5.9) (6.1) (26.4) (5.8) Free Cash Flow (25.4) (0.9) 1.9 18.8 29.4 49.1 (6.4) Ending Cash 78.7 42.9 39.2 35.6 44.6 44.6 46.7 Long Term Debt - Proceeds / (Repayment) 38.9 (16.2) (4.2) (23.3) (20.5) (64.2) 9.5 Cash Flow 17 * PST borrowed 25 mm BRL in March 2013 to pay down $10 mm USD denominated debt in April 2013 *
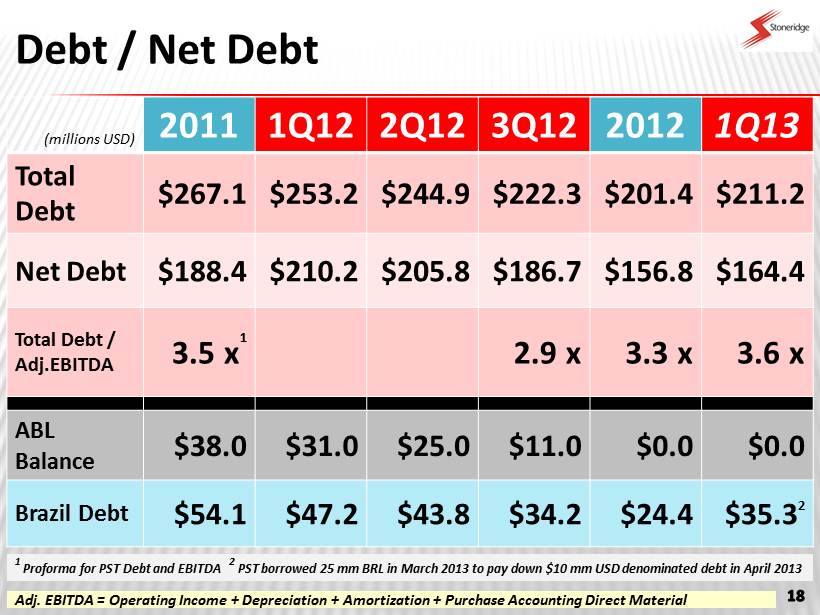
Debt / Net Debt (millions USD) 2011 1Q12 2Q12 3Q12 2012 1Q13 Total Debt $267.1 $253.2 $244.9 $222.3 $201.4 $211.2 Net Debt $188.4 $210.2 $205.8 $186.7 $156.8 $164.4 Total Debt / Adj.EBITDA 3.5 x 1 2.9 x 3.3 x 3.6 x ABL Balance $38.0 $31.0 $25.0 $11.0 $0.0 $0.0 Brazil Debt $54.1 $47.2 $43.8 $34.2 $24.4 $35.3 2 Adj. EBITDA = Operating Income + Depreciation + Amortization + Purchase Accounting Direct Material 1 Proforma for PST Debt and EBITDA 2 PST borrowed 25 mm BRL in March 2013 to pay down $10 mm USD denominated debt in April 2013

2013 Guidance Sales [millions] Operating Margin EPS Gross Margin Core $765 - $785 21.5% - 23.0% 4.5% – 5.5% PST (2013 F/X Rate 2.05) $174 – $184 44.0% - 47.0% 4.5% - 5.5% * SRI $939 - $974 25.5% - 27.0% 4.5% - 5.5% * $0.75 - $0.95 8.4% - 9.2% EBITDA ** * Includes Purchase Accounting Expenses of $6.0 million Reconciliation of Operating Margin to Adjusted EBITDA Margin: Operating Margin Depreciation Amortization EBITDA ** Margin 4.5% - 5.5% 3.3% - 3.1% 0.6% 8.4% - 9.2%
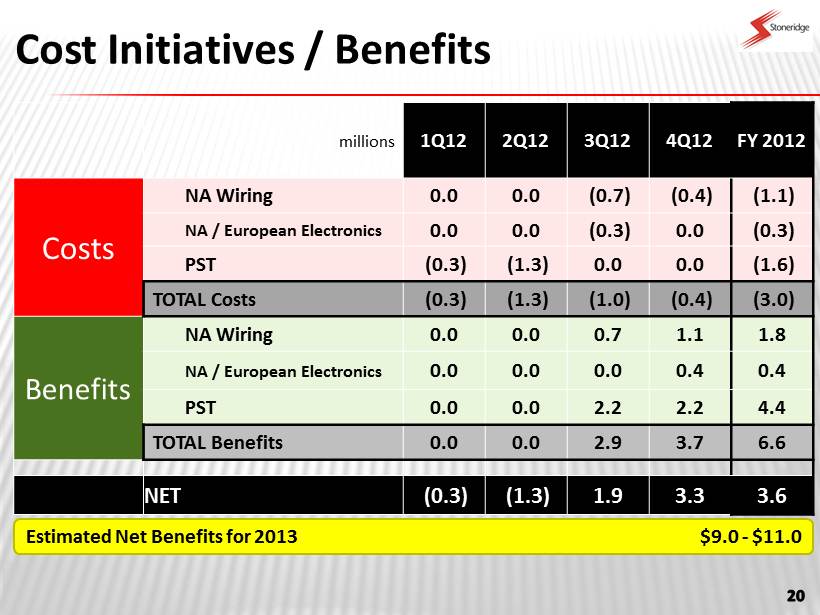
Cost Initiatives / Benefits millions 1Q12 2Q12 3Q12 4Q12 FY 2012 Costs NA Wiring 0.0 0.0 (0.7) (0.4) (1.1) NA / European Electronics 0.0 0.0 (0.3) 0.0 (0.3) PST (0.3) (1.3) 0.0 0.0 (1.6) TOTAL Costs (0.3) (1.3) (1.0) (0.4) (3.0) Benefits NA Wiring 0.0 0.0 0.7 1.1 1.8 NA / European Electronics 0.0 0.0 0.0 0.4 0.4 PST 0.0 0.0 2.2 2.2 4.4 TOTAL Benefits 0.0 0.0 2.9 3.7 6.6 NET (0.3) (1.3) 1.9 3.3 3.6 Estimated Net Benefits for 2013 $9.0 - $11. 0