Attached files
| file | filename |
|---|---|
| 8-K - 8-K - DISH Network CORP | a13-11946_18k.htm |
| EX-99.1 - EX-99.1 - DISH Network CORP | a13-11946_1ex99d1.htm |
Exhibit 99.2
|
|
QUARTERLY INVESTOR SUMMARY 1Q13 - May 9, 2013 |
|
|
2 DISH QUARTERLY INVESTOR SUMMARY–1Q13 DISH NETWORK REPORTS FIRST QUARTER 2013 FINANCIAL RESULTS ENGLEWOOD, Colo., May 9, 2013 – DISH Network Corporation (NASDAQ: DISH) today reported revenue totaling $3.56 billion for the quarter ending March 31, 2013, compared to $3.58 billion for the corresponding period in 2012. The decline was driven by reductions in our Blockbuster segment. During these same periods, subscriber-related revenue for our DISH segment increased from $3.22 billion to $3.35 billion, or 4.0 percent. Net income attributable to DISH Network totaled $216 million for the quarter ending March 31, 2013, compared to $360 million from the year-ago quarter. The decrease in year-over-year net income was primarily due to higher subscriber-related expenses driven by increased programming and subscriber acquisition costs. Additionally, results from the first quarter 2012 were favorably impacted by a non-cash gain of $99 million related to the conversion of certain DBSD North America notes. “We have been pleased with the market’s response to our Hopper® with Sling® roll out, despite headwinds from our price increase in two years,” said Joseph P. Clayton, DISH president and CEO. “Broadband sales are encouraging, especially given that almost all of our dishNET™ customers have bundled with our Pay-TV service.” DISH added about 654,000 gross new Pay- TV subscribers compared to approximately 673,000 gross new Pay-TV subscribers in the prior year’s first quarter. Net subscribers grew by approximately 36,000 in the first quarter. The company closed the first quarter with 14.092 million Pay-TV subscribers compared to 14.071 million Pay-TV subscribers at the end of first quarter 2012. Pay-TV ARPU for the first quarter totaled $78.54, an improvement over the first quarter 2012 Pay-TV ARPU of $76.24. Pay-TV subscriber churn rate was 1.47 percent versus 1.35 percent for first quarter 2012. DISH also added about 66,000 net broadband subscribers in the first quarter, compared to the addition of approximately 6,000 broadband subscribers in the year-ago period. Detailed financial data and other information are available in DISH Network’s Form 10-Q for the quarter ended March 31, 2013, filed today with the Securities and Exchange Commission. “DISH is on the right path... Growing high-value customers and increasing subscriber-related revenue as well as making the strategic investments for our long-term growth.” - Joe Clayton, CEO About DISH DISH Network Corporation (NASDAQ: DISH), through its subsidiary DISH Network L.L.C., provides approximately 14.092 million satellite TV customers, as of March 31, 2013, with the highest quality programming and technology with the most choices at the best value, including HD Free for Life®. Subscribers enjoy the largest high-definition lineup with more than 200 national HD channels, the most international channels, and award-winning HD and DVR technology. DISH Network Corporation’s subsidiary, Blockbuster L.L.C., delivers family entertainment to millions of customers around the world. DISH Network Corporation is a Fortune 200 company. Visit www. dish.com. TABLE OF CONTENTS Pay-TV Metrics3 Broadband Metrics5 Selected Financial Results6 Condensed Consolidated Balance Sheets9 Condensed Consolidated Statements of Operations10 Condensed Consolidated Statements of Cash Flows11 Cautionary Statement Concerning Forward-Looking Statements12 DISH 1Q13 Financial Results Conference Call – Noon ET Today U.S. or Canada 800-616-6729 Internationally 763-488-9145 Conference ID: 55771347 |
|
|
3 DISH QUARTERLY INVESTOR SUMMARY–1Q13 PAY--TV METRICS 1) Net Additions a. DISH added approximately 36,000 net Pay--TV subscribers during 1Q13, compared to the addition of approximately 104,000 net Pay--TV subscribers during the sme period in 2012. The decrease versus the same period in 2012 primarily resulted from an increase n our Pay--TV churn rate and lower gross new Pay--TV subscriber activations. b. 104 (10) (19) 14 36 1Q12 2Q12 3Q12 4Q12 1Q13 Pay-TV Net Additions In Thousands PAY-TV METRICS Pay-TV Net Additions DISH added approximately 36,000 net Pay-TV subscribers during 1Q13, compared to the addition of approximately 104,000 net Pay-TV subscribers during the same period in 2012. The decrease versus the same period in 2012 primarily resulted from an increase in our Pay-TV churn rate and lower gross new Pay-TV subscriber activations. 2) Gross Activations a. In 1Q13, DISH added approximately 654,000 gross new Pay--TV subscribers compared to the addition of approximately 673,000 gross new Pay--TV subscribers during the same period in 2012, a decrease of 2.8%. Our gross new Pay--TV subscriber activations continue to be negatively impacted by increased competitive pressures, including aggressive marketing and discounted promotional offers. In addition, our gross new Pay--TV subscriber activations continue to be adversely affected by sustined economic weakness and uncertainty. b. 673 665 739 662 654 1Q12 2Q12 3Q12 4Q12 1Q13 Pay-TV Gross Activations In Thousands Pay-TV Gross Activations In 1Q13, DISH added approximately 654,000 gross new Pay- TV subscribers compared to the addition of approximately 673,000 gross new Pay-TV subscribers during the same period in 2012, a decrease of 2.8%. Our gross new Pay-TV subscriber activations continue to be negatively impacted by increased competitive pressures, including aggressive marketing and discounted promotional offers. In addition, our gross new Pay- TV subscriber activations continue to be adversely affected by sustained economic weakness and uncertainty. 3) Churn a. Our Pay--TV churn rate for 1Q13 was 1.47% compared to 1.35% for the same period in 2012. Our Pay--TV churn rate was negatively impacted in part because we had a programing package price increase in 1Q13 and did not during the same period in 2012. Our Pay--TV churn rate is also impacted by, among other things, the credit quality of previously acquired subscribers, our ability to consistently provide outstanding customer service, the aggressiveness of competitor subscriber acquisition efforts, and our ability to control piracy and other forms of fraud. b. 1.35% 1.60% 1.80% 1.54% 1.47% 1Q12 2Q12 3Q12 4Q12 1Q13 Pay-TV Churn Rate In Percentage Pay-TV Churn Our Pay-TV churn rate for 1Q13 was 1.47% compared to 1.35% for the same period in 2012. Our Pay-TV churn rate was negatively impacted in part because we had a programming package price increase in 1Q13 and did not during the same period in 2012. Our Pay-TV churn rate is also impacted by, among other things, the credit quality of previously acquired subscribers, our ability to consistently provide outstanding customer service, the aggressiveness of competitor subscriber acquisition efforts, and our ability to control piracy and other forms of fraud. |
|
|
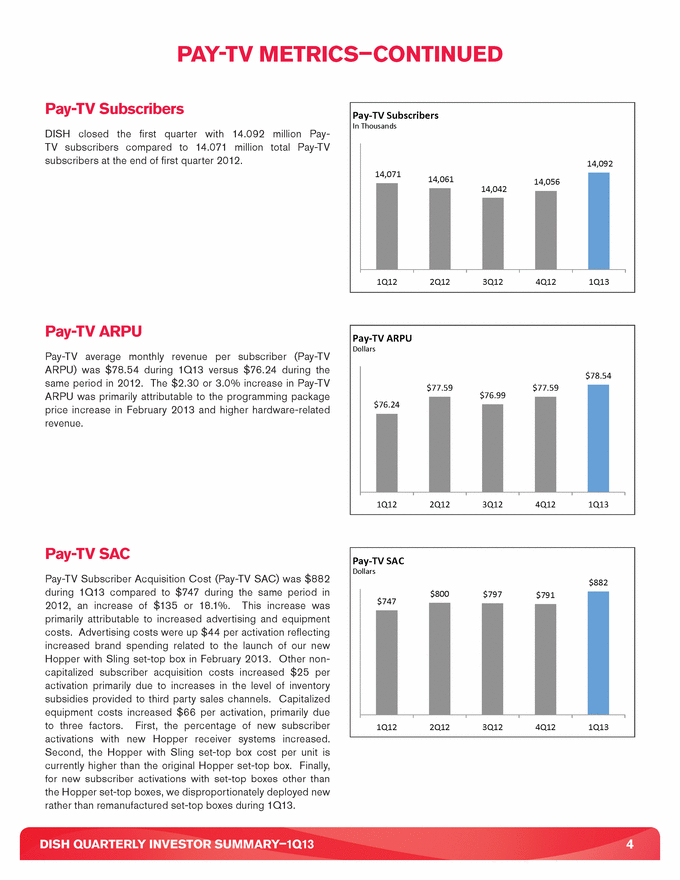
4 DISH QUARTERLY INVESTOR SUMMARY–1Q13 PAY-TV METRICS–CONTINUED 4) Pay--TV Subscribers a. DISH closed the first quarter with 14.092 million pay--TV subscribers compared to 14.071 million total subscribers at the end of first quarter 2012. b. 14,071 14,061 14,042 14,056 14,092 1Q12 2Q12 3Q12 412 1Q13 Pay-TV Subscribers In Thousands Pay-TV Subscribers DISH closed the first quarter with 14.092 million Pay- TV subscribers compared to 14.071 million total Pay-TV subscribers at the end of first quarter 2012. 1) Pay--TV ARPU a. Pay--TV average monthly revenue per subscriber (ARPU) was $78.54 during 1Q13 versus $76.24 during the same period in 2012. The $2.30 or 3.0% increase in Pay--TV ARPU was primarily attributable to the programming package price icrease in February 2013 and higher hardware related revenue. $76.24 $77.59 $76.99 $77.59 $78.54 1Q12 2Q12 3Q12 4Q12 1Q13 Pay-TV ARPU Dollars Pay-TV ARPU Pay-TV average monthly revenue per subscriber (Pay-TV ARPU) was $78.54 during 1Q13 versus $76.24 during the same period in 2012. The $2.30 or 3.0% increase in Pay-TV ARPU was primarily attributable to the programming package price increase in February 2013 and higher hardware-related revenue. 1) Pay TV SAC a. Pay--TV Subscriber Acquisition Cost (SAC) was $882 during 1Q13 compared to $747 during the same period in 2012, an increase of $135 or 18.1%. This increase was primarily attributable to increased advertising and equipment costs. Advertising costs were up $44 per activation reflecting increased brand spending related to the launch of our new Hopper with Sling set--top box in February 2013. Other non--capitalized subscriber acquisition costs increased $25 per activation primarily due to increases in the level of inventory subsidies provide to third party sales channels. Capitalized equipment costs increased $66 per activation, primarily due to three factors. First, the percentage of new subscriber activations with new Hopper receiver systems increased. Second, the Hopper with Sling set--top box cost per unit is currently higher than the orginal Hopper set--top box. Finally, for new subscriber activations with set--top boxes other than the Hopper set--top boxs, we disproportionately deployed new rather than remanufactured set--top boxes during the 113. $747 $800 $797 $791 $882 1Q12 2Q12 3Q12 4Q12 1Q13 Pay-TV SAC Dollars Pay-TV SAC Pay-TV Subscriber Acquisition Cost (Pay-TV SAC) was $882 during 1Q13 compared to $747 during the same period in 2012, an increase of $135 or 18.1%. This increase was primarily attributable to increased advertising and equipment costs. Advertising costs were up $44 per activation reflecting increased brand spending related to the launch of our new Hopper with Sling set-top box in February 2013. Other non- capitalized subscriber acquisition costs increased $25 per activation primarily due to increases in the level of inventory subsidies provided to third party sales channels. Capitalized equipment costs increased $66 per activation, primarily due to three factors. First, the percentage of new subscriber activations with new Hopper receiver systems increased. Second, the Hopper with Sling set-top box cost per unit is currently higher than the original Hopper set-top box. Finally, for new subscriber activations with set-top boxes other than the Hopper set-top boxes, we disproportionately deployed new rather than remanufactured set-top boxes during 1Q13. |
|
|
5 DISH QUARTERLY INVESTOR SUMMARY–1Q13 BROADBAND METRICS 13) Broadband Net Additions a. DISH added approximately 66,000 net Broadband subscribers during 1Q13 compared to the additon of approximately 6,000 net Broadband subscribers during the same period in 2012. This increase versus the same period in 2012 primarily resulted from higher gross new Broadband subscriber activations driven by increased advertising related to the dishNET™ branded broadband services. 6 11 17 44 66 1Q12 2Q12 3Q12 4Q12 1Q13 Broadbnd Net Additions In Thousands BROADBAND METRICS Broadband Net Additions DISH added approximately 66,000 net Broadband subscribers during 1Q13 compared to the addition of approximately 6,000 net Broadband subscribers during the same period in 2012. This increase versus the same period in 2012 primarily resulted from higher gross new Broadband subscriber activations driven by increased advertising related to the dishNET branded broadband services. 14) Broadband Gross Activations a. During 1Q13, DISH added approximately 83,000 gross new Broadband subscribers compared to approximately 4,000 gross new Broadband subscribers during the same period in 2012. b. 14 21 29 57 83 1Q12 2Q12 3Q12 4Q12 1Q13 Broadand Gross Activations In Thousands Broadband Gross Activations During 1Q13, DISH added approximately 83,000 gross new Broadband subscribers compared to approximately 14,000 gross new Broadband subscribers during the same period in 2012. 1) Broadband Subscribers a. DISH closed the first quarter with 249 thousand Broadband subscribers compared to 111 thusand total Broadband subscribers at the end of first quarter 2012. b. 111 122 139 183 249 1Q12 2Q12 3Q12 4Q12 1Q13 Broadban Subscribers In Thousands Broadband Subscribers DISH closed the first quarter with 249,000 Broadband subscribers compared to 111,000 total Broadband subscribers at the end of first quarter 2012. |
|
|
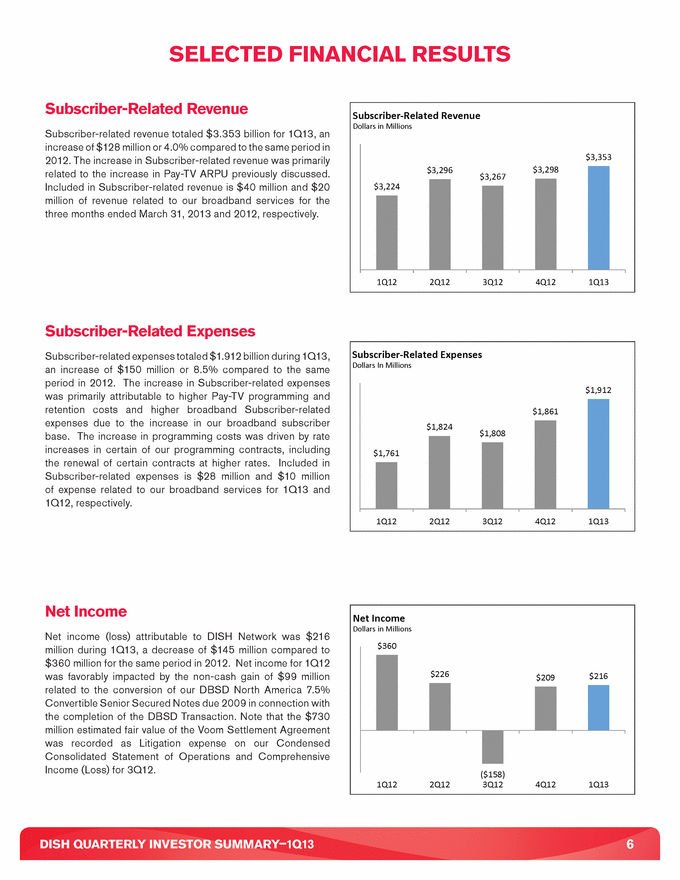
6 DISH QUARTERLY INVESTOR SUMMARY–1Q13 SELECTED FINANCIAL RESULTS 2) Subscriber Related Revenue a. Subscriber--related revenue totaled $3.353 billion for 1Q13, an increase of $128 million or 4.0% compared to the same period in 2012. Included in Subscriber--related revenue is $40 million and $20 million of revenue related to our broadband services for the three months ended Mach 31, 2013 and 2012, respectively. $3,224 $3,296 $3,267 $3,298 $3,353 1Q12 2Q12 3Q12 4Q12 1Q13 Subscriber-Related Revenue Dollars in Millions SELECTED FINANCIAL RESULTS Subscriber-Related Revenue Subscriber-related revenue totaled $3.353 billion for 1Q13, an increase of $128 million or 4.0% compared to the same period in 2012. The increase in Subscriber-related revenue was primarily related to the increase in Pay-TV ARPU previously discussed. Included in Subscriber-related revenue is $40 million and $20 million of revenue related to our broadband services for the three months ended March 31, 2013 and 2012, respectively. 3) Subscriber Related Expenses a. Subscriber--related expenses totaled $1.912 billion during 1Q13, an increase of $150 million or 8.5% compared to the same period in 2012. The increase in Subscriber--related expenses was primarily attributable to higher pay--V programming and retention costs and higher broadband subscriber--related expenses due to the increase in our broadband subscriber base. The increase in programming costs was driven by rate increases in certain of our programming contracts, including the renewal of certain contracts at higher rates. Included in Subscriber--related expenses is $28 million and $10 million of expense related to our broadband services for 1Q13 and 1Q12, respectively. Subscriber--related expenses represented 57.0% and 54.6% of Subscriber--related revenue during the three months ended March 31, 2013 and 2012, respectively. b. $1,761 $1,824 $1,808 $1,861 $1,912 1Q12 2Q12 3Q12 4Q12 1Q13 Subscriber-Related Expenses Dollars In Millions Subscriber-Related Expenses Subscriber-related expenses totaled $1.912 billion during 1Q13, an increase of $150 million or 8.5% compared to the same period in 2012. The increase in Subscriber-related expenses was primarily attributable to higher Pay-TV programming and retention costs and higher broadband Subscriber-related expenses due to the increase in our broadband subscriber base. The increase in programming costs was driven by rate increases in certain of our programming contracts, including the renewal of certain contracts at higher rates. Included in Subscriber-related expenses is $28 million and $10 million of expense related to our broadband services for 1Q13 and 1Q12, respectively. 1) Net Income a. Net income (loss) attributable to DISH Network was $216 million during 1Q13, a decrease of $145 million compared to $360 million for the same period in 2012. Note that the $730 million estimated fair value of the Voom Settlement Agreement was recorded as Litigaion expense on our Condensed Consolidated Statement of Operations and Comprehensive Income Loss) for 3Q12. b. $360 $226 ($158) $209 $216 1Q12 2Q12 3Q12 4Q12 1Q13 Net Income Dollars in Millions Net Income Net income (loss) attributable to DISH Network was $216 million during 1Q13, a decrease of $145 million compared to $360 million for the same period in 2012. Net income for 1Q12 was favorably impacted by the non-cash gain of $99 million related to the conversion of our DBSD North America 7.5% Convertible Senior Secured Notes due 2009 in connection with the completion of the DBSD Transaction. Note that the $730 million estimated fair value of the Voom Settlement Agreement was recorded as Litigation expense on our Condensed Consolidated Statement of Operations and Comprehensive Income (Loss) for 3Q12. |
|
|
7 DISH QUARTERLY INVESTOR SUMMARY–1Q13 2) EBITDA a. Earnings before interest, taxes, depreciation and amortization (EBITDA) was $701 million during 1Q13, a decrease of $190 million or 21.3% compared to the same period in 2012. EBITDA for 1Q12 was favorably impacted by the non--cash gain of $99 million related to the conversion of our DBSD North America 7.5% Convertible Senior Secured Notes due 2009 in connection with the completion of the DSD Transaction. Note that the $730 million estimated fair value of the Voom Settlement Agreement was recorded as Litigaion expense on our Condensed Consolidated Statement of Operations and Comprehensive Income Loss) for 3Q12. b. $892 $760 $37 $675 $701 1Q12 2Q12 3Q12 4Q12 1Q13 EBITDA Dollars in Millions SELECTED FINANCIAL RESULTS–CONTINUED EBITDA EBITDA was $701 million during 1Q13, a decrease of $190 million or 21.3% compared to the same period in 2012. EBITDA for 1Q12 was favorably impacted by the non-cash gain of $99 million related to the conversion of our DBSD North America 7.5% Convertible Senior Secured Notes due 2009 in connection with the completion of the DBSD Transaction. Note that the $730 million estimated fair value of the Voom Settlement Agreement was recorded as Litigation expense on our Condensed Consolidated Statement of Operations and Comprehensive Income (Loss) for 3Q12. Non-GAAP Reconciliation– EBITDA to Net Income 3) Non--GAAP Reconciliation – EBITDA to Net Income EBITDA is not a measure determined in accordance with accountin principles generally accepted in the United States (“GAAP”) and should not be considered a substitute for operating income, net income or any other measure determined in accordance with GAAP. EBITDA is used as a measurement of operating efficiency and overall financial perfomance and we believe it to be a helpful measure for those evaluating companies in he pay--TV industry. Conceptually, EBITDA measures the amount of income generated each period that could be used to ervice debt, pay taxes and fund capital expenditures. EBITDA should not be considered in isolation or as a substitute for measures of performance prepared in accordance with GAAP. 3/31/2012 6/30/2012 9/30/2012 12/31/2012 3/31/2013 EBITDA 891,575$ 760,159$ 37,073$ 675,315$ 701,242$ Interest expense, net (130,924) (89,097) (109,514) (107,822) (123,892) Income tax (provision) benefit, net (191,643) (146,211) 149,383 (118,558) (127,425) Depreciation and amortization (208,698) (299,119) (235,403) (239,829) (234,327) Net income (loss) attributable to DISH Network 360,310 $ 225,732 $ (158,461) $ 209,106 $ 215,598 $ Quarter To Date (In thousands) Earnings before interest, taxes, depreciation and amortization (“EBITDA”) is not a measure determined in accordance with accounting principles generally accepted in the United States (“GAAP”) and should not be considered a substitute for operating income, net income or any other measure determined in accordance with GAAP. EBITDA is used as a measurement of operating efficiency and overall financial performance and we believe it to be a helpful measure for those evaluating companies in the Pay-TV industry. Conceptually, EBITDA measures the amount of income generated each period that could be used to service debt, pay taxes and fund capital expenditures. EBITDA should not be considered in isolation or as a substitute for measures of performance prepared in accordance with GAAP. |
|
|
8 DISH QUARTERLY INVESTOR SUMMARY–1Q13 4) Free Cash Flow (FCF) a. During 1Q13 and 1Q12, free cash flow was significantly impacted by changes in operating assets and liabilitie and in Purchases of property and equipment as shown in the Net cash flows from operating activities and Net cash flows from investing activities sections, respectively, of our Condensed Consolidated Statements of Cash Flows included herein. Note that 4Q12 includes the negative impact of $676 million of payments for the Voom Settlement Agreement. a. $690 $238 $424 ($298) $375 1Q12 2Q12 3Q12 4Q12 1Q13 Free Cash Flow Dollars in Millions SELECTED FINANCIAL RESULTS–CONTINUED Free Cash Flow (“FCF”) During 1Q13 and 1Q12, free cash flow was significantly impacted by changes in operating assets and liabilities and in Purchases of property and equipment as shown in the Net cash flows from operating activities and Net cash flows from investing activities sections, respectively, of our Condensed Consolidated Statements of Cash Flows included herein. Note that 4Q12 includes the negative impact of $676 million of payments for the Voom Settlement Agreement. Non-GAAP Reconciliation– FCF to Cash From Operations 12) Non--GAAP Reconciliation – FCF to Net Cash From Operating Activities FCF is defined as Net cash flows from operating activities less Purchases of property and equipment, as shown on our Condensed Consolidated Statements of Cash Flows. We believe free cash flow is an important liquidity metric because it measures, during a given period, the amount of cash generated that is available to repay debt obligations, make investments, fund acquisitions and for certain other activities. Free cash flow is not a measure determined in accordance with GAAP and should not be considered a substitute for Operating income, Net income, Net cash flows from operating activities or any other measure determined in accordance with GAAP. Since free cash flow includes investments in operating assets, we believe this non--GAAP liquidity measure is useful in addition to the most direcly comparable GAAP measure Net cash flows from operating activities 3/31/2012 6/30/2012 9/30/2012 12/31/2012 3/31/2013 Free cash flow 689,622 $ 238,257 $ 424,238 $ (297,808) $ 374,935 $ Add back: Purchases of property and equipment 168,928 251, 257 261, 740 275, 641 311,527 Net cash flows from operating activities858,550$ 489,514$ 685,978$ (22,167)$ 686,462$ Quarter To Date (In thousands) FCF is defined as Net cash flows from operating activities less Purchases of property and equipment, as shown on our Condensed Consolidated Statements of Cash Flows. We believe free cash flow is an important liquidity metric because it measures, during a given period, the amount of cash generated that is available to repay debt obligations, make investments, fund acquisitions and for certain other activities. Free cash flow is not a measure determined in accordance with GAAP and should not be considered a substitute for Operating income, Net income, Net cash flows from operating activities or any other measure determined in accordance with GAAP. Since free cash flow includes investments in operating assets, we believe this non-GAAP liquidity measure is useful in addition to the most directly comparable GAAP measure Net cash flows from operating activities. |
|
|
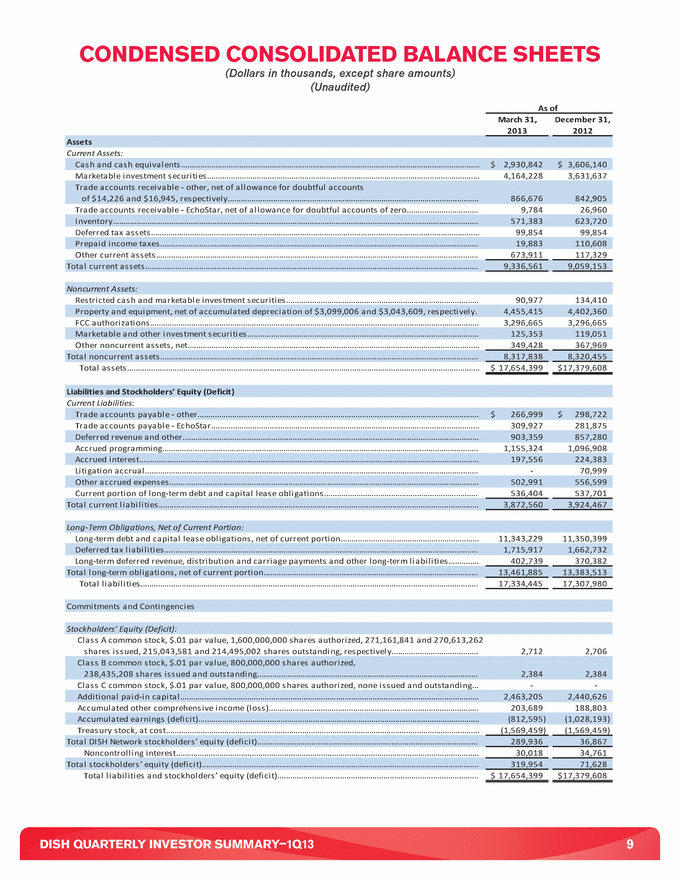
9 DISH QUARTERLY INVESTOR SUMMARY–1Q13 CONDENSED CONSOLIDATED BALANCE SHEETS CONDENSED CONSOLIDATED BALANCE SHEETS (Dollars in thousands, except share amounts) (Unaudited) March 31,December 31, 2013 2012 Assets Current Assets: Cash and cash equivalents 2,930,842 $ 3,606,140 $ Marketable investment securities 4,164,228 3,631,637 Trade accounts receivable - other, net of allowance for doubtful accounts of $14,226 and $16,945, respectively 866,676 842,905 Trade accounts receivable - EchoStar, net of allowance for doubtful accounts of zero 9,784 26,960 Inventory 571,383 623,720 Deferred tax assets 99,854 99,854 Prepaid income taxes 19,883 110,608 Other curret assets 673,911 117,329 Total current assets 9,336,561 9,059,153 Noncurrent Assets: Restricted cash and marketable investment securities 90,977 134,410 Property an equipment, net of accumulated depreciation of $3,099,006 and $3,043,609, respectively. 4,455,415 4,402,360 FCC authorizations 3,296,665 3,296,665 Marketable and other investment scurities 125,353 119,051 Other noncurrent assets, net 349,428 367,969 Total noncurrent assets 8,317,838 8,320,455 Total assets 17,654,399$ 17,379,608$ Liabilities and Stockholders’ Equity (Deficit) Current Liabilities: Trade accounts payable - other 266,999$ 298,722$ Trade accounts payable - EchoStar 309,927 281,875 Deferred revenue and other 903,359 857,280 Accrued programming 1,155,324 1,096,908 Accrued interest 197,556 224,383 Litigation accrual - 70,999 Other accrued expenses 502,991 556,599 Current portion of long -term debt and capital lease obligations 536,404 537,701 Total current liabilities 3,872,560 3,924,467 Long - Term Obligations, Net of Current Portion: Long - term debt and capital lease obligations, net of current portion 11,343,229 11,350,399 Deferred tax liabilities 1,715,917 1,662,732 Long - term deferred revenue, distribution and carriage payments and other long - term liabilities 402,739 370,382 Total long - term obligations, net of current portion 13,461,885 13,383,513 Total liabilities 17,334,445 17,307,980 Commitments and Contingencies Stockholders’ Equity (Deficit): Class A common stock, $.01 par value, 1,600,000,000 shares authorized, 271,161,841 and 270,613,262 shares issued, 215,043,581 and 214,495,002 shares outstanding, respectively 2,712 2,706 Class B common stock, $.01 par value, 800,000,000 shares authorized, 238,435,208 shares issued and outstanding 2,384 2,384 Class C common stock, $.01 par value, 800,000,000 shares authorized, none issued and outstanding - - Additional paid - in capital2,463,205 2,440,626 Accumulated other comprehensive income (loss) 203,689 188,803 Accumulated eanings (deficit) (812,595) (1,028,193) Treasury stock, at cost (1,569,459) (1,569,459) Total DISH Network stockholders’ equity (deficit) 289,936 36,867 Noncontrolling interest 30,018 34,761 Total stockholders’ equity (deficit) 319,954 71,628 Total liabilities and stockholders’ equity (deficit)17,654,399$ 17,379,608$ As of (Dollars in thousands, except share amounts) (Unaudited) |
|
|
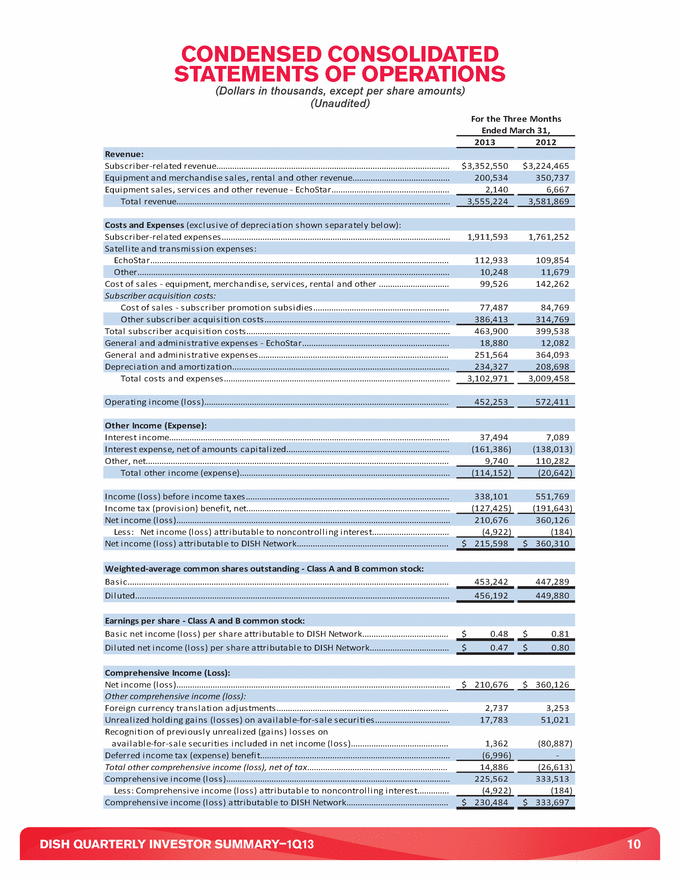
10 DISH QUARTERLY INVESTOR SUMMARY–1Q13 CONDENSED CONSOLIDATED STATEMENTS OF OPERATIONS (Dollars in thousands, except per share amounts) (Unaudited) 2013 2012 Revenue: Subscriber-related revenue $3,352,550 $3,224,465 Equipment and merchandise sales, rental and other revenue 200,534 350,737 Equipment sales, services and other revenue - EchoStar 2,140 6,667 Total revenue 3,555,224 3,581,869 Costs and Expenses (exclusive of depreciation shown separately below): Subscriber-related expenses 1,911,593 1,761,252 Satellite and transmission expenses: EchoStar 112,933 109,854 Other 10,248 11,679 Cost of sales - equipment, merchandise, services, rental and other 99,526 142,262 Subscriber acquisition costs: Cost of sales - subscriber promotion subsidies 77,487 84,769 Other subscrber acquisition costs 386,413 314,769 Total subscriber acquisition costs 463,900 399,538 General and administrative expenses - EchoStar 18,880 12,082 General and administrative expense 251,564 364,093 Depreciation and amortization 234,327 208,698 Total costs and expenses 3,102,971 3,009,458 Operating income (loss) 452,253 572,411 Other Income (Expense): Interest income 37,494 7,089 Interest expense, net of amounts capitalized (161,386) (138,013) Other, net 9,740 110,282 Total other icome (expense) (114,152) (20,642) Income (loss) before income taxes 338,101 551,769 Income tax (provision) benefit, net (127,425) (191,643) Net income (loss) 210,676 360,126 Less: Net income (loss) attributable to noncontrolling interest (4,922) (184) Net income (loss) attributable to DISH Network 215,598 $ 360,310 $ Weighted-average common shares outstanding - Class A and B common stock: Basic 453,242 447,289 Diluted 456,192 449,880 Earnings per share - Class A and B commn stock: Basic net income (loss) per share attributable to DISH Network 0.48 $ 0.81 $ Diluted net income (loss) per share attributable to DISH Network 0.47 $ 0.80 $ Comprehensive Income (Loss): Net income (loss) 210,676 $ 360,126 $ Other comprehensive income (loss): Foreign currency translation adjustments 2,737 3,253 Unrealized holding gain (losses) on available-for-sale securities 17,783 51,021 Recognition of previously unrealizd (gains) losses on available-for-sale securities included in net income (loss) 1,362 (80,887) Deferred income tax (expense) benefit (6,996) - Total other compreensive income (loss), net of tax14,886 (26,613) Comprehensive income (loss) 225,562 333,513 Less: Comprehensive income (loss) attributable to noncontrolling interest (4,922) (184) Comprehensive income (loss) attributable to DISH Network 230,484 $ 333,697 $ For the Three MonthsEnded March 31, |
|
|
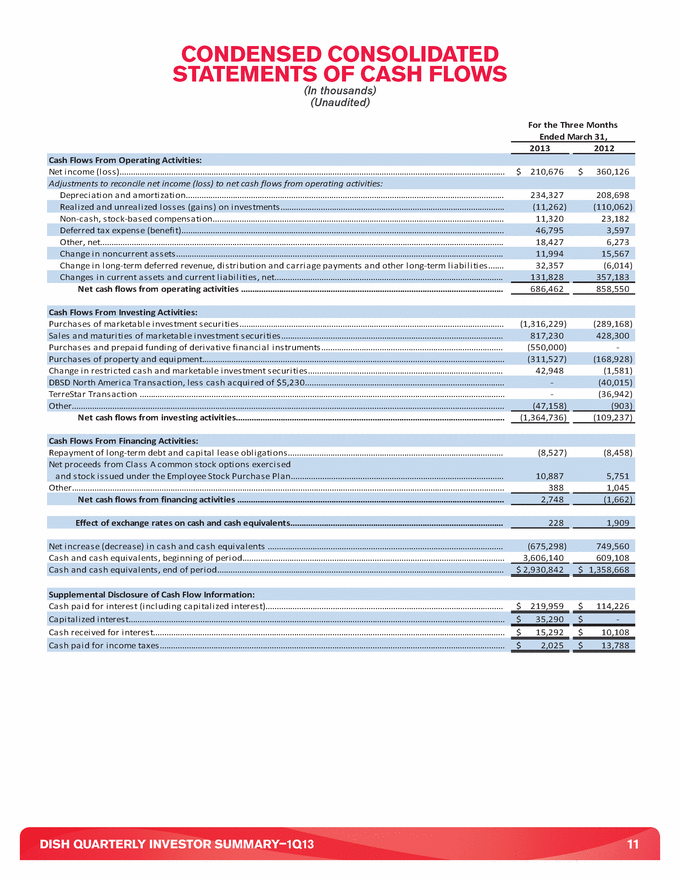
11 DISH QUARTERLY INVESTOR SUMMARY–1Q13 CONDENSED CONSOLIDATED STATEMENTS OF CASH FLOWS CONDENSED CONSOLIDATED STATEMENTS OF CASH FLOWS (In thousands) (Unaudited) 20132012Cash Flows From Operating Activities: Net income (loss)$210,676 $360,126 Adjustments to reconcile net income (loss) to net cash flows from operating activities: Depreciation and amortization234,327 208,698 Realized and unrealized losses (gains) on investments(11,262) (110,062) Non-cash, stock-based compensation11,320 23,182 Deferred tax expense (benefit)46,795 3,597 Other, net18,427 6,273 Change in noncurrent assets11,994 15,567 Change in long-term deferred revenue, distribution and carriage payments and other long-term liabilities32,357 (6,014) Changes in current assets and current liabilities, net131,828 357,183 Net cash flows from operating activities 686,462 858,550 Cash Flows From Investing Activities: Purchases of marketable investment securities(1,316,229) (289,168) Sales and maturities of marketable investment securities817,230 428,300 Purchases and prepaid funding of derivative financial instruments(550,000) - Purchases of property and equipment(311,527) (168,928) Change in restricted cash and marketable investment securities42,948 (1,581) DBSD North America Transaction, less cash acquired of $5,230- (40,015) TerreStar Transaction - (36,942) Other(47,158) (903) Net cash flows from investing activities(1,364,736) (109,237) Cash Flows From Financing Activities: Repayment of long-term debt and capital lease obligations(8,527) (8,458) Net proceeds from Class A common stock options exercised and stock issued under the Employee Stock Purchase Plan10,887 5,751 Other388 1,045 Net cash flows from financing activities 2,748 (1,662) Effect of exchange rates on cash and cash equivalents228 1,909 Net ncrease (decrease) in cash and cash equivalents (675,298) 749,560 Cash and cash equivalents, beginning of period3,606,140 609,108 Cash and cash equivalents, end of period $2,930,842 $1,358,668 Supplemental Disclosure of Cash Flow Information: Cash paid for interest (including capitalized interest)$219,959 $114,226 Capitalized interest $35,290 -$ Cash received for interest$15,292 $10,108 Cash paid for income taxes $2,025 $13,788 For the Three Months Ended March 31, (In thousands) (Unaudited) |
|
|
DISH QUARTERLY INVESTOR SUMMARY–1Q13 CAUTIONARY STATEMENT CONCERNING FORWARD-LOOKING STATEMENTS Certain statements contained herein may constitute “forward- looking statements” within the meaning of the Private Securities Litigation Reform Act of 1995. Such forward-looking statements involve known and unknown risks, uncertainties and other factors that may cause the actual results, performance or achievements of DISH Network Corporation to be materially different from any future results, performance or achievements expressed or implied by such forward-looking statements. More information about such risks, uncertainties and other factors is set forth in DISH Network Corporation’s Disclosure Regarding Forward-Looking Statements included in its recent filings with the Securities and Exchange Commission, including its annual report on Form 10-K for the year ended December 31, 2012 and its quarterly report on Form 10-Q for the three months ended March 31, 2013. The forward-looking statements speak only as of the date made, and DISH Network Corporation expressly disclaims any obligation to update these forward- looking statements. |

