Attached files
| file | filename |
|---|---|
| 8-K - 8-K - BERKSHIRE HILLS BANCORP INC | a13-12073_18k.htm |
| EX-99.2 - EX-99.2 - BERKSHIRE HILLS BANCORP INC | a13-12073_1ex99d2.htm |
Exhibit 99.1
|
|
Annual Shareholder Meeting May 9, 2013 |
|
|
Forward Looking Statements. This document contains certain forward-looking statements as defined in the Private Securities Litigation Reform Act of 1995. These statements include statements about anticipated financial results. Forward- looking statements can be identified by the fact that they do not relate strictly to historical or current facts. They often include words like "believe," "expect," "anticipate," "estimate," and "intend" or future or conditional verbs such as "will," "would," "should," "could" or "may.“ There are several factors that could cause actual results to differ significantly from expectations described in the forward-looking statements. For a discussion of such factors, please see Berkshire’s most recent reports on Forms 10-K and 10-Q filed with the Securities and Exchange Commission and available on the SEC's website at www.sec.gov. Berkshire does not undertake any obligation to update forward-looking statements made in this document. NON-GAAP FINANCIAL MEASURES. This presentation references non-GAAP financial measures incorporating tangible equity and related measures, and core earnings excluding merger and other non-recurring costs. These measures are commonly used by investors in evaluating business combinations and financial condition. GAAP earnings are lower than core earnings primarily due to non-recurring merger and systems conversion related expenses. Reconciliations are in earnings releases at www.berkshirebank.com. |
|
|
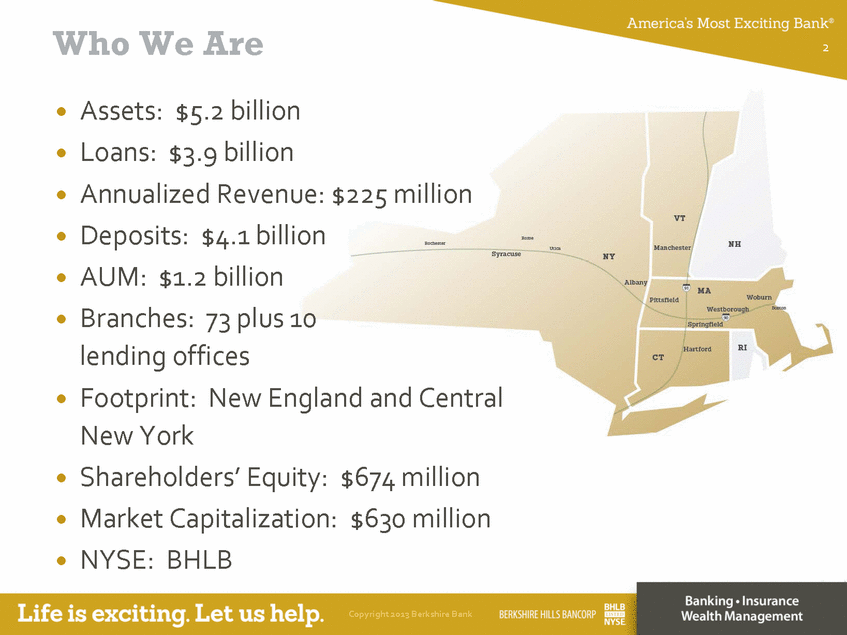
Who We Are . Assets: $5.2 billion . Loans: $3.9 billion . Annualized Revenue: $225 million . Deposits: $4.1 billion . AUM: $1.2 billion . Branches: 73 plus 10 lending offices . Footprint: New England and Central New York . Shareholders’ Equity: $674 million . Market Capitalization: $630 million . NYSE: BHLB |
|
|
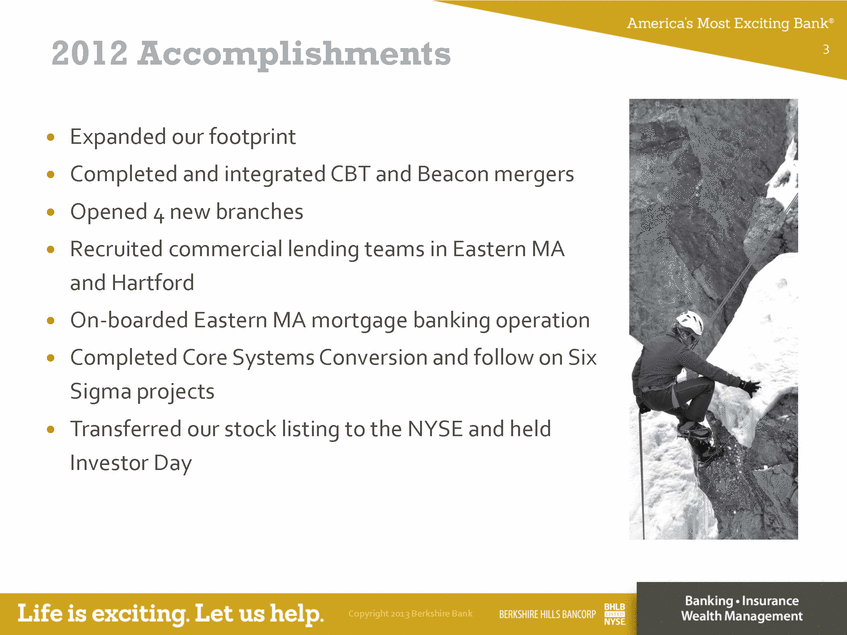
2012 Accomplishments . Expanded our footprint . Completed and integrated CBT and Beacon mergers . Opened 4 new branches . Recruited commercial lending teams in Eastern MA and Hartford . On-boarded Eastern MA mortgage banking operation . Completed Core Systems Conversion and follow on Six Sigma projects . Transferred our stock listing to the NYSE and held Investor Day |
|
|
2012 Financial Highlights . Core EPS - $1.98 . 29% increase in core earnings per share . 35% net interest income growth . 52% fee income growth . 29% total commercial loan growth Note: GAAP EPS - $1.49, net of merger and conversion related items. |
|
|
Driving Profitability . Grew revenues at 2x’s the rate of expenses Revenue Growth: 39% Efficiency Ratio: 59% . Strong balance sheet growth Asset Growth: 33% Organic Deposit and Loan Growth: 5% . Significant improvements in ROA Core Return on Assets(Q4): 1.02% . Core Return on Equity reaches 8.2% (Q4) Note: GAAP ROA 0.73% and GAAP ROE 5.7%. |
|
|
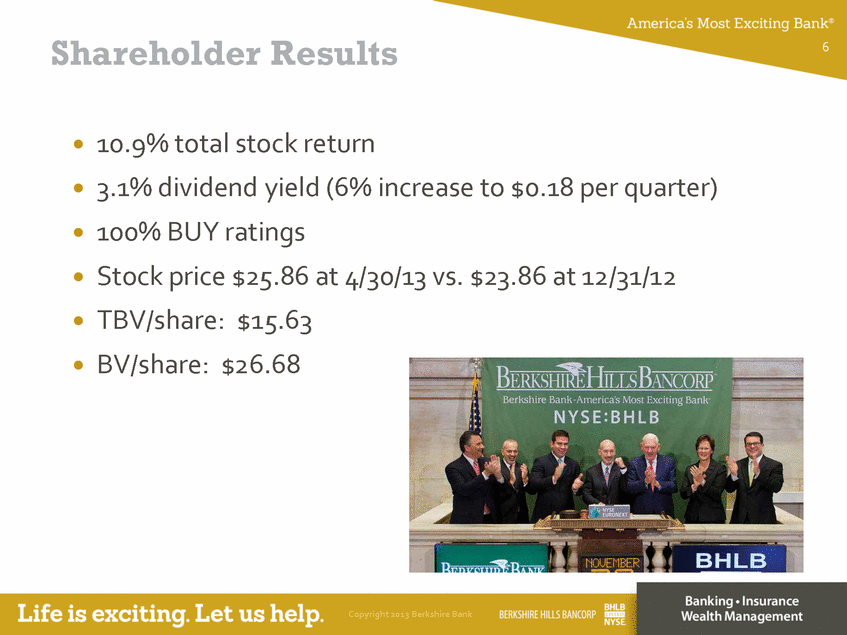
Shareholder Results . 10.9% total stock return . 3.1% dividend yield (6% increase to $0.18 per quarter) . 100% BUY ratings . Stock price $25.86 at 4/30/13 vs. $23.86 at 12/31/12 . TBV/share: $15.63 . BV/share: $26.68 |
|
|
Our Financial Goals and Objectives Return on assets > 1.10% Return on equity > 10% Return on tangible equity >15% Efficiency ratio < 55% Positive Operating Leverage Loan growth Expense management Process improvement Competitive dividend Drive Profitability |
|
|
Why Invest In Us . Strong financial condition . Diversified income drivers . Established footprint in attractive markets . Experienced leadership team . AMEB culture . Well positioned for growth . Increasing shareholder returns |
|
|
Q&A |

