Attached files
| file | filename |
|---|---|
| 8-K - 8-K - OLD SECOND BANCORP INC | a13-11842_18k.htm |
Exhibit 99.1
|
|
Founded in 1871 NASDAQ: OSBC Old Second Bancorp May 8, 2013 Bill Skoglund Chairman 630-906-5483 James Eccher COO 630-966-2425 Doug Cheatham CFO 630-906-5484 Joe Marchese CCO 630-801-2219 1 |
|
|
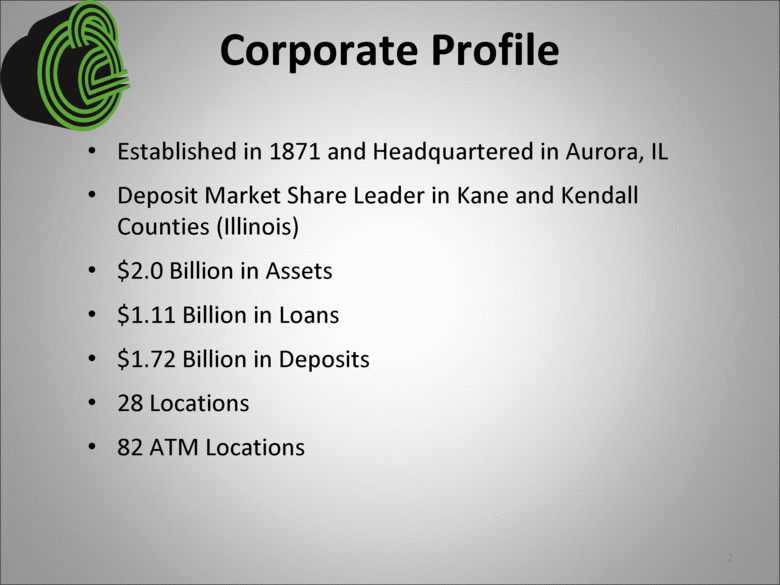
Corporate Profile Established in 1871 and Headquartered in Aurora, IL Deposit Market Share Leader in Kane and Kendall Counties (Illinois) $2.0 Billion in Assets $1.11 Billion in Loans $1.72 Billion in Deposits 28 Locations 82 ATM Locations 2 |
|
|
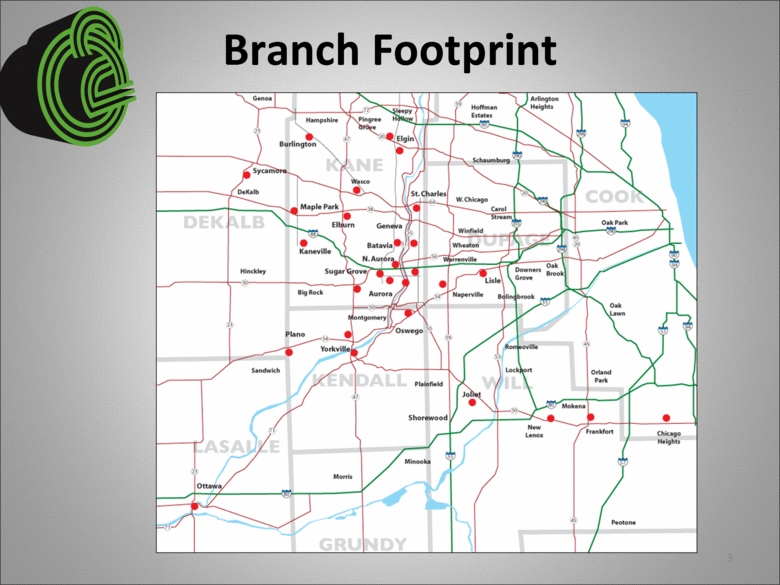
Branch Footprint 3 |
|
|
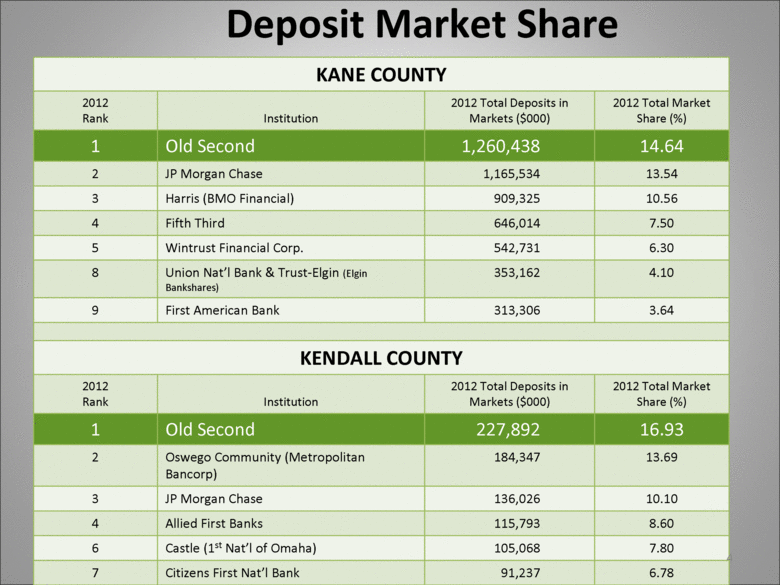
Deposit Market Share KANE COUNTY 2012 Rank Institution 2012 Total Deposits in Markets ($000) 2012 Total Market Share (%) 1 Old Second 1,260,438 14.64 2 JP Morgan Chase 1,165,534 13.54 3 Harris (BMO Financial) 909,325 10.56 4 Fifth Third 646,014 7.50 5 Wintrust Financial Corp. 542,731 6.30 8 Union Nat’l Bank & Trust-Elgin (Elgin Bankshares) 353,162 4.10 9 First American Bank 313,306 3.64 KENDALL COUNTY 2012 Rank Institution 2012 Total Deposits in Markets ($000) 2012 Total Market Share (%) 1 Old Second 227,892 16.93 2 Oswego Community (Metropolitan Bancorp) 184,347 13.69 3 JP Morgan Chase 136,026 10.10 4 Allied First Banks 115,793 8.60 6 Castle (1st Nat’l of Omaha) 105,068 7.80 7 Citizens First Nat’l Bank 91,237 6.78 4 |
|
|
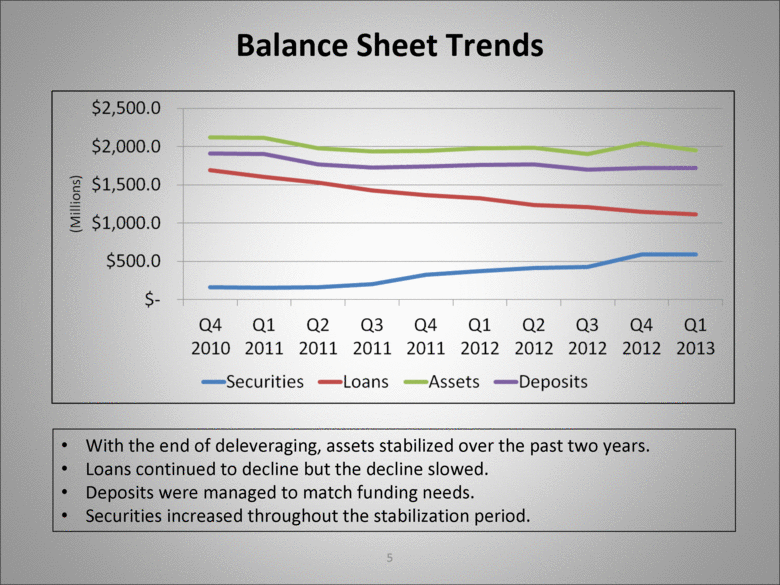
5 With the end of deleveraging, assets stabilized over the past two years. Loans continued to decline but the decline slowed. Deposits were managed to match funding needs. Securities increased throughout the stabilization period. Balance Sheet Trends |
|
|
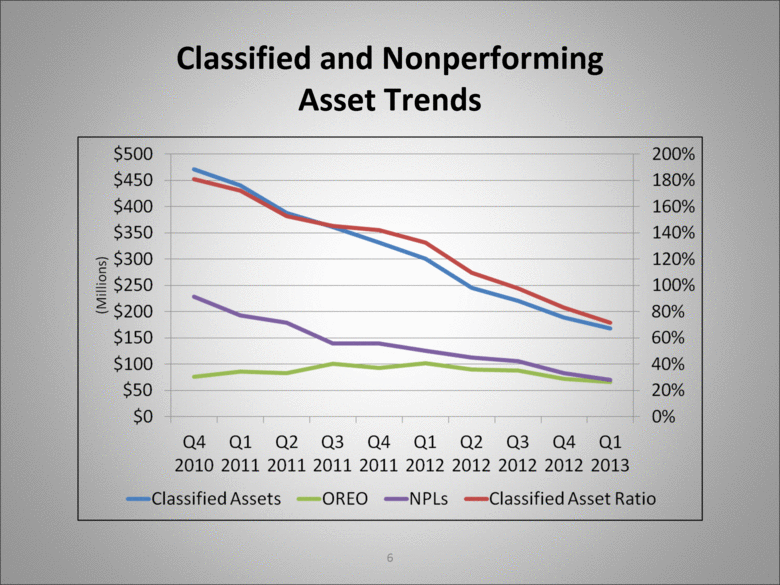
6 Classified and Nonperforming Asset Trends |
|
|
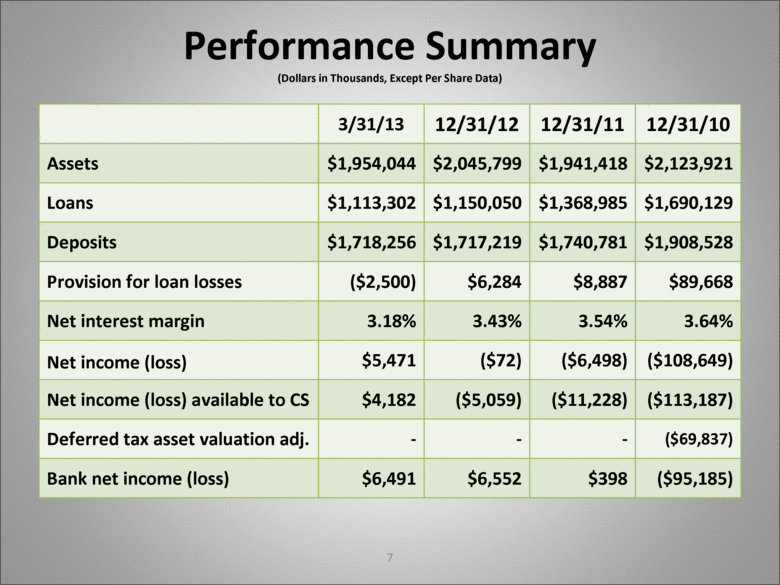
7 Performance Summary (Dollars in Thousands, Except Per Share Data) 3/31/13 12/31/12 12/31/11 12/31/10 Assets $1,954,044 $2,045,799 $1,941,418 $2,123,921 Loans $1,113,302 $1,150,050 $1,368,985 $1,690,129 Deposits $1,718,256 $1,717,219 $1,740,781 $1,908,528 Provision for loan losses ($2,500) $6,284 $8,887 $89,668 Net interest margin 3.18% 3.43% 3.54% 3.64% Net income (loss) $5,471 ($72) ($6,498) ($108,649) Net income (loss) available to CS $4,182 ($5,059) ($11,228) ($113,187) Deferred tax asset valuation adj. - - - ($69,837) Bank net income (loss) $6,491 $6,552 $398 ($95,185) |
|
|
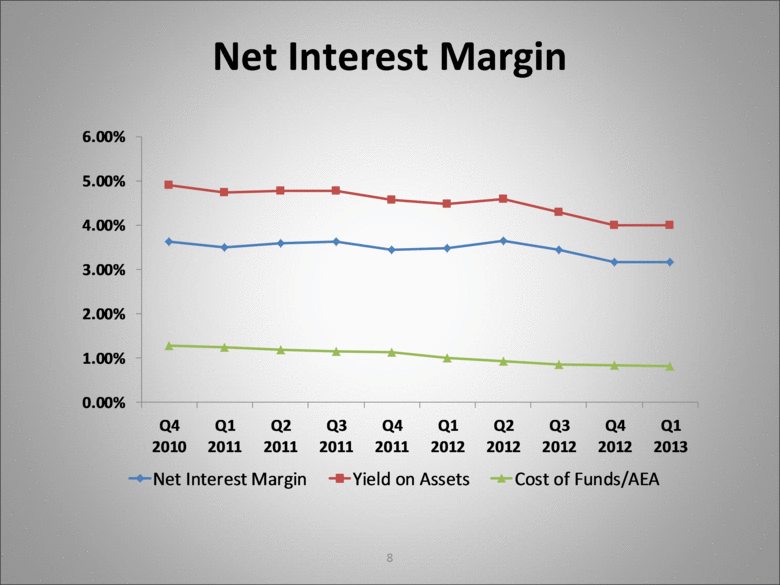
8 Net Interest Margin 0.00% 1.00% 2.00% 3.00% 4.00% 5.00% 6.00% Q4 2010 Q1 2011 Q2 2011 Q3 2011 Q4 2011 Q1 2012 Q2 2012 Q3 2012 Q4 2012 Q1 2013 Net Interest Margin Yield on Assets Cost of Funds/AEA |
|
|
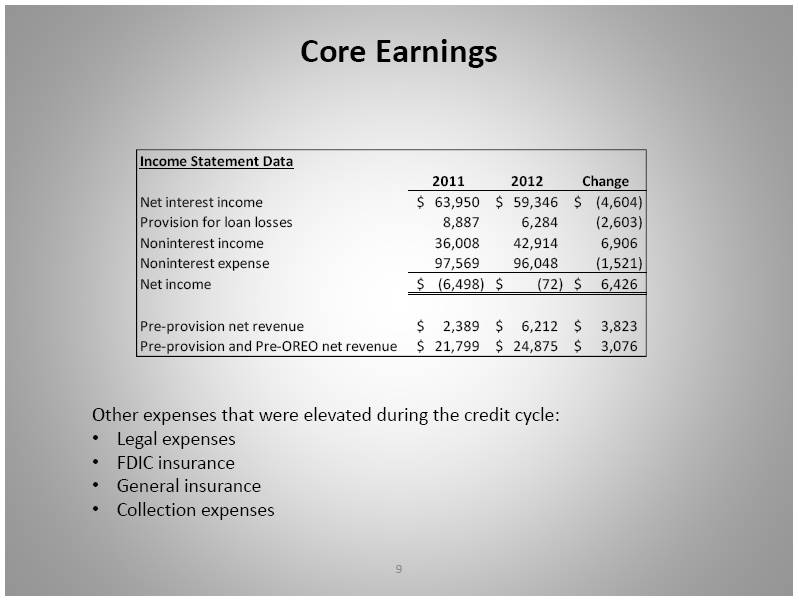
9 Core Earnings Other expenses that were elevated during the credit cycle: Legal expenses FDIC insurance General insurance Collection expenses Income Statement Data 2011 2012 Change Net interest income 63,950 $ 59,346 $ (4,604) $ Provision for loan losses 8,887 6,284 (2,603) Noninterest income 36,008 42,914 6,906 Noninterest expense 97,569 96,048 (1,521) Net income (6,498) $ (72) $ 6,426 $ Pre-provision net revenue 2,389 $ 6,212 $ 3,823 $ Pre-provision and Pre-OREO net revenue 21,799 $ 24,875 $ 3,076 $ |
|
|
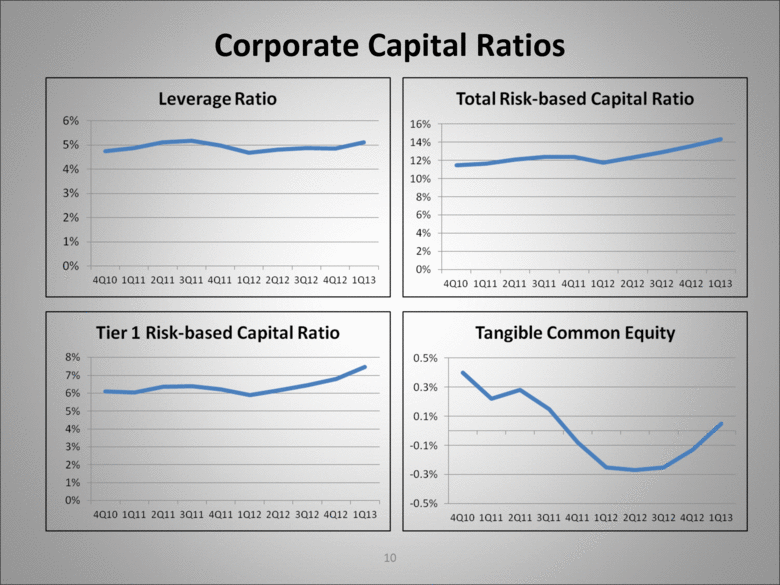
10 Corporate Capital Ratios |
|
|
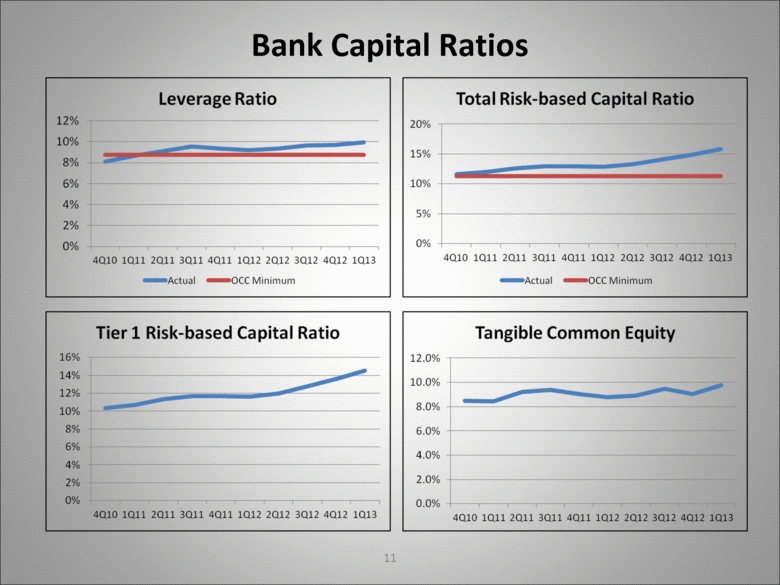
11 Bank Capital Ratios |
|
|
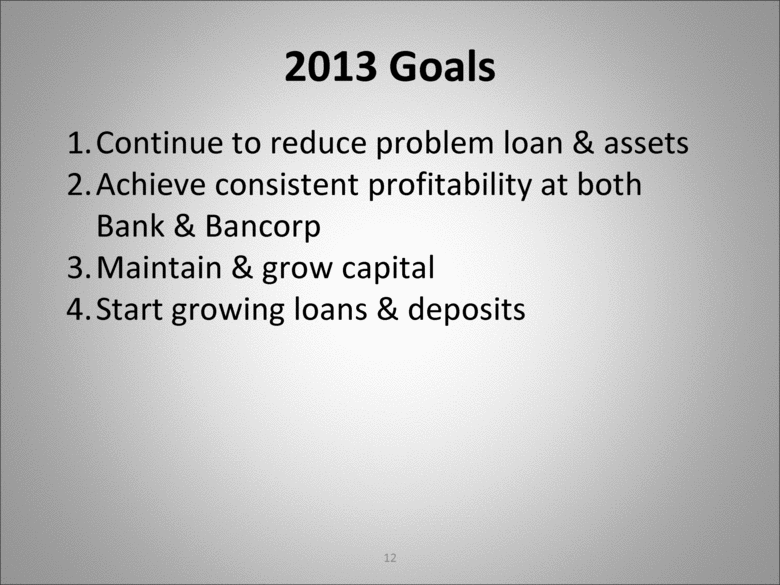
12 2013 Goals 1. Continue to reduce problem loan & assets 2. Achieve consistent profitability at both Bank & Bancorp 3. Maintain & grow capital 4. Start growing loans & deposits |
|
|
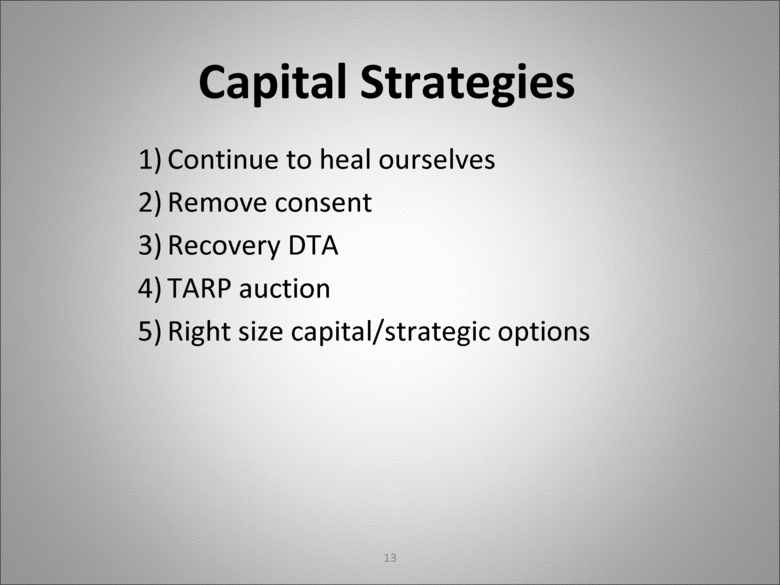
13 Capital Strategies 1. Continue to heal ourselves 2. Remove consent 3. Recovery DTA 4. TARP auction 5. Right size capital/strategic options |
|
|
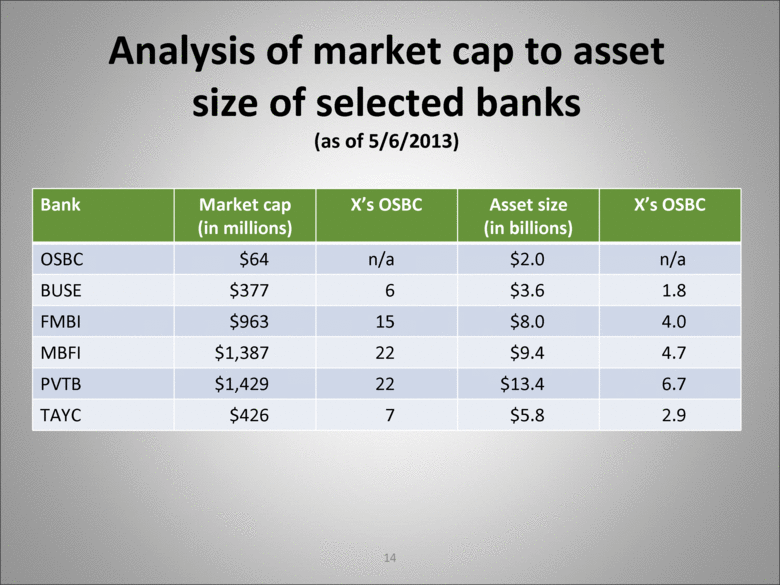
14 Analysis of market cap to asset size of selected banks (as of 5/6/2013) Bank Market cap (in millions) X’s OSBC Asset size (in billions) X’s OSBC OSBC $64 n/a $2.0 n/a BUSE $377 6 $3.6 1.8 FMBI $963 15 $8.0 4.0 MBFI $1,387 22 $9.4 4.7 PVTB $1,429 22 $13.4 6.7 TAYC $426 7 $5.8 2.9 |

