Attached files
| file | filename |
|---|---|
| 8-K - FORM 8-K - FIRST COMMUNITY BANKSHARES INC /VA/ | v344185_8k.htm |

May 2013 www.fcbinc.com

Forward - Looking Disclosures This presentation may include forward - looking statements. These forward - looking statements are based on current expectations that involve risks, uncertainties and assumptions. Should one or more of these risks or uncertainties materialize or should underlying assumptions prove incorrect, actual results may differ materially. These risks include: changes in business or other market conditions; the timely development, production and acceptance of new products and services; the challenge of managing asset/liability levels; the management of credit risk and interest rate risk; the difficulty of keeping expense growth at modest levels while increasing revenues; and other risks detailed from time to time in the Company’s Securities and Exchange Commission reports, including but not limited to the Annual Report on Form 10 - K for the most recent year ended. Pursuant to the Private Securities Litigation Reform Act of 1995, the Company does not undertake to update forward - looking statements contained within this presentation. 2

First Community Bancshares 3

Overview □ A $2.7 billion VA, WV, NC, SC, and TN branch franchise □ $906 million Wealth Management Division - $445 million Trust Operation - $461 million RIA □ Five - state franchise with solid market share in legacy markets □ True retail franchise generating low - cost core deposits - First quarter 2013 average cost of funds of 0.80% □ Growth oriented - Two transactions completed in second quarter 2012 - 23.5% asset growth over Q1 2012 4

First Quarter Highlights • Net interest margin was 4.15% • Strong efficiency of 59% • Q1 2013 GAAP earnings up 20% over last year • Core EPS up 3% quarter - over • Core ROA of 1.05% and ROE of 8.23% • TBV increased to $11.83 a a Tangible book value per common share is defined as stockholders' equity less goodwill and other intangibles divided by as - converted common shares outstanding. 5

Investment Highlights □ 138 years of success….. since 1874 □ Consolidator □ Attractive growth markets and stable legacy markets □ Superior Efficiency □ Strong asset quality □ Strong non - margin, fee - based revenue diversification – nearly 28% of revenues from non - spread sources 6
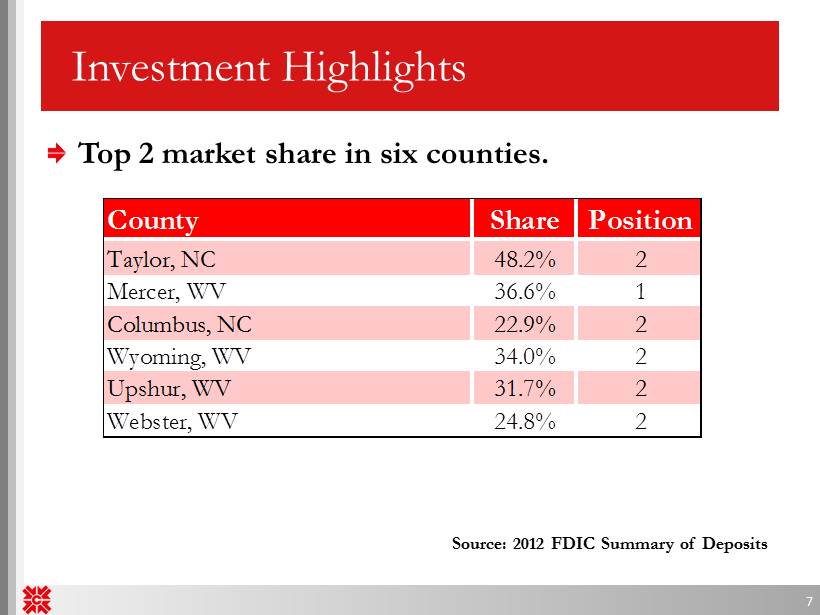
Investment Highlights 7 Source: 2012 FDIC Summary of Deposits County Share Position Taylor, NC 48.2% 2 Mercer, WV 36.6% 1 Columbus, NC 22.9% 2 Wyoming, WV 34.0% 2 Upshur, WV 31.7% 2 Webster, WV 24.8% 2 Top 2 market share in six counties.

Investment Highlights Stable, Low - Cost funding Strong Net Interest Margin No TARP or capital raise overhang Good legacy loan portfolio performance – Highly granular – Virtually no A&D exposure – Well diversified – Total Delinquency of 2.83% – NPA’s/Total Assets of 1.43% 8
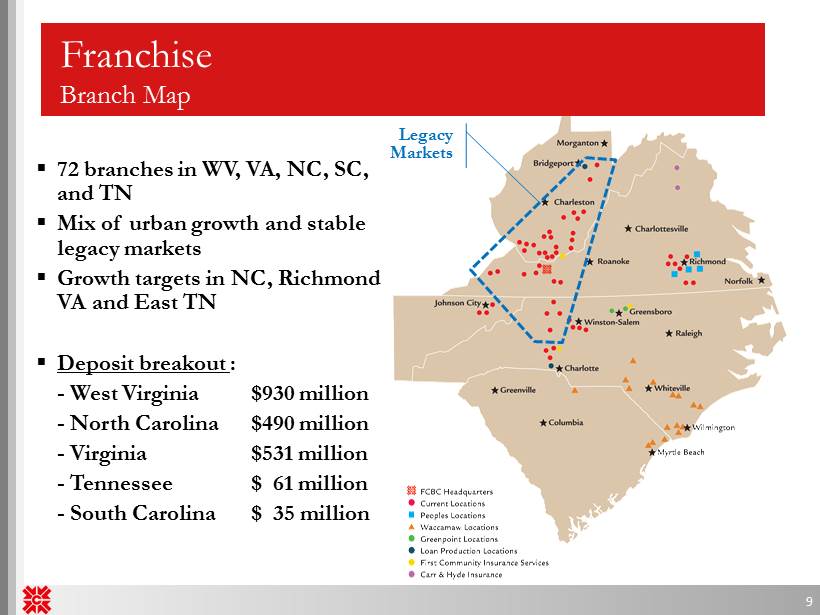
▪ 72 branches in WV, VA, NC, SC, and TN ▪ Mix of urban growth and stable legacy markets ▪ Growth targets in NC, Richmond VA and East TN ▪ Deposit breakout : - West Virginia $930 million - North Carolina $490 million - Virginia $531 million - Tennessee $ 61 million - South Carolina $ 35 million Franchise Branch Map Legacy Markets 9
Strategic Priorities Substantial growth opportunity – Targeted strategic bank acquisitions • Fill in primary markets • Attractive price levels – FDIC - assisted transactions • Potentially large deals • Primary and secondary markets Continue diversification of revenues – Build wealth management – Acquire small insurance agencies and producers 10

Peoples Bank of Virginia Transaction Rationale □ In market acquisition consistent with FCBC’s Merger & Acquisition strategy □ Creates 10 th largest Virginia - based bank by deposits in the Richmond market □ Strong cultural fit 11 Strategic Rationale Financially Attractive Low Risk Profile □ Exceeds Merger & Acquisition performance targets □ Immediately accretive to EPS □ Minimal tangible book value dilution with earnback period of 3 – 4 years □ Significant expense synergies □ Post - closing consolidated capital and liquidity ratios remain strong □ Comprehensive due diligence completed including rigorous review of loan and OREO portfolios □ Conservative credit mark

Peoples Bank of Virginia Pro Forma Branch Map 12 Peoples Market VA- based Rank Institution Branches Deposits ($mm) Market Share (%) 1 Union First Market Bkshs Corp. 44 1,516 4.98 2 Franklin Financial Corp. 8 667 2.19 3 Village Bank & Trust Finl Corp 15 508 1.67 4 First Capital Bancorp Inc. 7 419 1.38 5 C&F Financial Corp. 11 409 1.34 6 Bk of Southside Virginia Corp. 9 356 1.17 7 Eastern Virginia Bankshares 11 342 1.12 8 Central Virginia Bankshares 8 339 1.11 9 Community Bankers Trust Corp 9 331 1.09 10 Pro Forma 9 328 1.08 12 Peoples Bank of Virginia 4 251 0.83 18 First Community Bancshares Inc 5 77 0.25 Richmond Market Deposit Market Share (1) (1) Deposit market share data as of June 30, 2011; Virginia headquartered banks only Source: SNL Financial □ Advances objective of entry into previously identified targeted growth market of Richmond, VA □ Richmond’s superior market demographics complements FCBC’s current footprint ─ Projected population growth: 5.42% ─ Projected household income growth: 14.25%

Peoples Bank of Virginia Financial Impact of the Transaction 13 Transaction Assumptions Financial Impact □ EPS accretive in the first full year of combined operations □ Limited tangible book value dilution at closing □ Ability to leverage insurance business line and other product offerings increasing non - interest income □ Gross credit mark on total loans and OREO of $17.5 million or 9.4% ─ Reviewed 59% of total loans, 64% of non - performing loans, and 70% of land and ADC loans □ Estimated one - time merger expenses of approximately $3.5 million (pre - tax) □ Cost savings of approximately 40% □ Closed May 31, 2012

Peoples Bank of Virginia Summary 14 □ Transaction drives EPS growth and shareholder value for both FCBC and Peoples shareholders □ Manageable transaction size and strong pro forma capital ratios allow for future opportunities □ M&A pipeline and organic growth opportunities in targeted growth markets remain attractive □ Low - risk structure □ Comprehensive due diligence □ Strong cultural fit □ Additional product capabilities with a strong sales opportunity for business and retail products □ Materially enhances retail network in targeted west Henrico and Chesterfield Counties

Waccamaw Bank Summary 15 □ Acquired 16 branches in FDIC - assisted deal • Added 12 branches to existing North Carolina franchise and expands presence into South Carolina with 4 branches □ Purchased approximately $500 million in total assets, including $338 million in loans • Most loan and REO covered by loss - share agreements at 80% • Loan and REO credit mark of approximately $69.5 million • Tangible book dilution of 5% - recover in approximately 2 years □ Assumed approximately $428 million in deposits • No deposit premium

County WB Branches WB Deposits in Market ($000) Market Rank Deposit Market Share (%) Total Deposits in Market ($000) Horry, SC 3 43,649 18 0.8 5,432,128 Bladen, NC 1 27,305 4 11.7 233,729 New Hanover, NC 1 22,658 17 0.6 3,859,990 Lancaster, SC 1 18,694 5 4.1 458,956 • Establishes top 3 market share positions in Columbus & Brunswick Counties 16 Source: SNL Financial; Deposit data as of June 30, 2011 Columbus County Brunswick County Deposits Market Branch in Market Share Rank Institution (ST) Count ($mm) (%) 1 BB&T Corp. (NC) 8 293 39.9 2 First Community Bancshares Inc (VA) 3 262 35.7 3 PNC Financial Services Group (PA) 1 114 15.5 4 First Bancorp (NC) 2 30 4.0 5 First Citizens BancShares Inc. (NC) 1 28 3.8 6 Woodforest Financial Group (TX) 1 0 0.1 Totals (1-6) 16 727 98.9 Deposits Market Branch in Market Share Rank Institution (ST) Count ($mm) (%) 1 BB&T Corp. (NC) 12 771 48.7 2 Security Savings Bank SSB (NC) 7 236 14.9 3 First Community Bancshares Inc (VA) 7 117 7.4 4 First Citizens BancShares Inc. (NC) 4 113 7.1 5 First Financial Holdings Inc. (SC) 3 88 5.5 6 Bank of America Corp. (NC) 2 78 4.9 7 First Bancorp (NC) 4 74 4.7 8 PNC Financial Services Group (PA) 2 53 3.4 9 Wells Fargo & Co. (CA) 1 23 1.5 10 ECB Bancorp Inc. (NC) 2 17 1.1 Totals (1-10) 44 1,570 99.1 Totals (1-12) 47 1,584 100.0 Additional Counties of Operation Waccamaw Bank Deposit Market Share

17 Consistent with our acquisition strategy – Extends footprint to a target growth market – Significantly accretive to core earnings per share – Deploys excess capital – No raise necessary – Minimal tangible book value dilution – Earnback dilution in approximately 2 years – Strong IRR in excess of 15% – Low - risk transaction due to FDIC loss coverage – Financially attractive even under stress case modeling scenarios Waccamaw Bank Strategically and Financially Compelling

1 Q 2013 Update Pre - Tax, Pre - Credit and Core Earnings Increasing Three Months Ended March 31, December 31, September 30, June 30, March 31, 2013 2012 2012 2012 2012 Pre-Tax, Pre-Credit Core Earnings 12,048$ 14,469$ 16,106$ 11,393$ 10,708$ Core Net Income 6,981 8,776 9,415 6,210 6,071 Core EPS (diluted) 0.33$ 0.41$ 0.44$ 0.31$ 0.32$ Core ROA 1.05% 1.28% 1.35% 1.06% 1.12% Core Common ROE 8.23% 10.30% 11.39% 8.19% 8.37% 18

Summary of 1Q 2013 Earnings Three Months Ended March 31, 2013 2012 Change Net Interest Income 23,362$ 17,977$ 30.0% Provision for Loan Losses 1,142 922 23.9% Net Interest Income (after provision) 22,220 17,055 30.3% Securities gains 117 51 129.4% Other Income 7,744 7,940 -2.5% Total Noninterest Income 7,861 7,991 -1.6% Salaries and employee benefits 10,110 8,222 23.0% Other Noninterest Expense 9,434 7,971 18.4% Total Noninterest Expense 19,544 16,193 20.7% Tax Expense 3,396 2,852 19.1% Net Income 7,141 6,001 19.0% Dividends on Preferred Stock 258 283 -8.8% Net Income Available to Common Shareholders 6,883 5,718 20.4% EPS (diluted) 0.33$ 0.31$ 6.5% Dividends Declared 0.12$ 0.10$ 20.0% 19

Balance Sheet Summary March 31, December 31, September 30, June 30, 2013 2012 2012 2012 Cash & Securities 705,364$ 680,021$ 683,206$ 684,067$ Total Loans 1,692,086 1,731,685 1,768,056 1,807,326 Allowance for Loan Losses 24,850 25,770 25,835 26,171 Total Loans (net) 1,667,236 1,705,915 1,742,221 1,781,155 Other 347,691 342,931 344,223 345,099 Total Assets 2,720,291$ 2,728,867$ 2,769,650$ 2,810,321$ Noninterest Bearing Deposits 355,918$ 343,352$ 335,100$ 340,895$ Interest Bearing Deposits 1,691,579 1,686,823 1,728,860 1,764,312 Total Deposits 2,047,497 2,030,175 2,063,960 2,105,207 Borrowings 287,383 313,553 324,339 340,938 Other 26,740 28,816 29,538 22,465 Equity 358,671 356,323 351,813 341,711 Total Liabilities & Equity 2,720,291$ 2,728,867$ 2,769,650$ 2,810,321$ ▪ Levering capital through the latest acquisitions 20
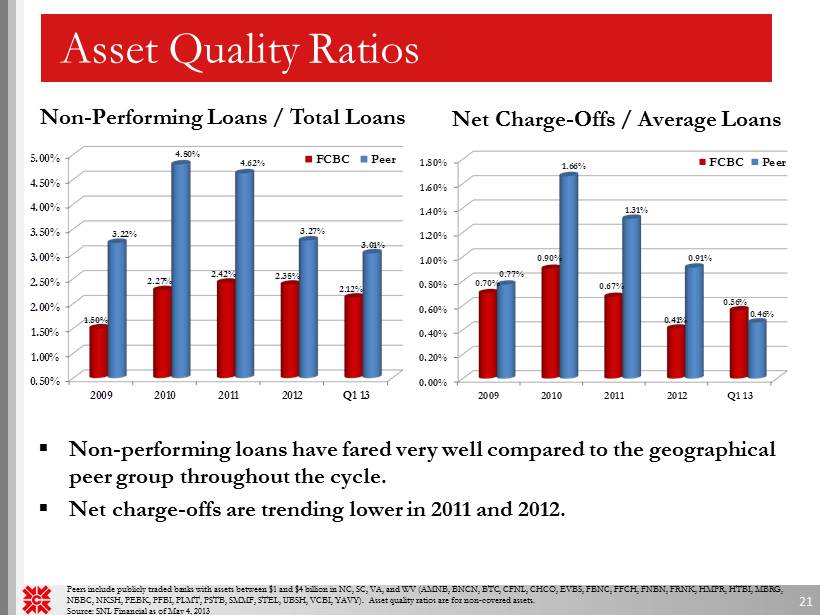
0.00% 0.20% 0.40% 0.60% 0.80% 1.00% 1.20% 1.40% 1.60% 1.80% 2009 2010 2011 2012 Q1 13 0.70% 0.90% 0.67% 0.41% 0.56% 0.77% 1.66% 1.31% 0.91% 0.46% FCBC Peer 0.50% 1.00% 1.50% 2.00% 2.50% 3.00% 3.50% 4.00% 4.50% 5.00% 2009 2010 2011 2012 Q1 13 1.50% 2.27% 2.42% 2.38% 2.12% 3.22% 4.80% 4.62% 3.27% 3.01% FCBC Peer Asset Quality Ratios Non - Performing Loans / Total Loans Peers include publicly traded banks with assets between $1 and $4 billion in NC, SC, VA , and WV (AMNB, BNCN , BTC, CFNL , CHCO, EVBS , FBNC, FFCH, FNBN, FRNK, HMPR , HTBI, MBRG, NBBC , NKSH, PEBK , PFBI , PLMT, PSTB, SMMF , STEL , UBSH, VCBI, YAVY ). Asset quality ratios are for non - covered assets. Source: SNL Financial as of May 4, 2013 Net Charge - Offs / Average Loans 21 ▪ Non - performing loans have fared very well compared to the geographical peer group throughout the cycle. ▪ Net charge - offs are trending lower in 2011 and 2012.

Asset Quality Ratios Reserves / Non - Performing Loans Reserves / Total Loans Peers include publicly traded banks with assets between $1 and $4 billion in NC, SC, VA, and WV (AMNB, BNCN, BTC, CFNL, CHCO, EVBS , FBNC, FFCH, FNBN, FRNK, HMPR, HTBI, MBRG, NBBC, NKSH, PEBK, PFBI, PLMT, PSTB , SMMF, STEL, UBSH, VCBI, YAVY). Asset quality ratios are for non - covered assets. Source: SNL Financial as of May 4, 2013 - 20 40 60 80 100 120 2009 2010 2011 2012 Q1 13 115 84 77 72 59 65 50 49 53 58 FCBC Peer 22 1.00% 1.20% 1.40% 1.60% 1.80% 2.00% 2.20% 2009 2010 2011 2012 Q1 13 1.73% 1.90% 1.87% 1.49% 1.47% 1.73% 2.14% 2.07% 1.90% 1.87% FCBC Peer ▪ Throughout the cycle, FCBC has kept a strong non - performing coverage ratio ▪ In addition to high performance compared to peer in non - performers, the reserve has remained steady and only a small amount of release.

Nonperforming Asset Detail March 31, December 31, September 30, June 30, 2013 2012 2012 2012 Non-Covered Nonaccrual loans 30,076$ 23,931$ 26,514$ 27,947$ Accruing loans past due 90 days or more - - - - Unseasoned troubled debt restructurings 10,272 6,038 6,742 6,995 Nonperforming loans 40,348 29,969 33,256 34,942 Other real estate owned 4,439 5,749 5,957 4,938 Total Non-covered Nonperforming Assets 44,787$ 35,718$ 39,213$ 39,880$ Covered Nonaccrual loans 4,567$ 4,323$ 2,849$ -$ Accruing loans past due 90 days or more - - - - Nonperforming loans 4,567 4,323 2,849 - Other real estate owned 6,911 3,255 3,553 5,325 Total Covered Nonperforming Assets 11,478$ 7,578$ 6,402$ 5,325$ 23

50% 55% 60% 65% 70% 2009 2010 2011 2012 Q1 13 59.40% 59.10% 59.56% 55.96% 59.55% 63.49% 64.88% 66.65% 66.59% 67.59% FCBC Peer Financial Performance Highlights Efficiency Peers include publicly traded banks with assets between $1 and $4 billion in NC, SC, VA, and WV (AMNB, BNCN, BTC, CFNL, CHCO, EVBS , FBNC, FFCH, FNBN, FRNK, HMPR, HTBI, MBRG, NBBC, NKSH, PEBK, PFBI, PLMT, PSTB , SMMF, STEL, UBSH, VCBI, YAVY). Source : SNL Financial as of May 4, 2013 24 ▪ Consistently outperform peer ▪ Trending lower in 2012

0.50% 0.75% 1.00% 1.25% 1.50% 1.75% 2.00% 2.25% 2009 2010 2011 2012 Q1 13 1.97% 1.50% 1.17% 0.91% 0.80% 2.01% 1.50% 1.13% 0.81% 0.65% FCBC Peer Financial Performance Highlights Cost of Funds and Net Interest Margin Peers include publicly traded banks with assets between $1 and $4 billion in NC, SC, VA, and WV (AMNB, BNCN, BTC, CFNL, CHCO, EVBS , FBNC, FFCH, FNBN, FRNK, HMPR, HTBI, MBRG, NBBC, NKSH, PEBK, PFBI, PLMT, PSTB, SMMF , STEL, UBSH, VCBI, YAVY). Source: SNL Financial as of May 4, 2013 25 ▪ Highly retail - oriented deposit base in legacy markets makes for low cost of funds ▪ Strong net interest margin has provided a stable earnings base throughout the cycle 3.25% 3.50% 3.75% 4.00% 4.25% 2009 2010 2011 2012 Q1 13 3.74% 3.90% 3.87% 4.23% 4.15% 3.48% 3.63% 3.81% 3.79% 3.73% FCBC Peer Cost of Funds Net Interest Margin

Attractive Valuations 26 ▪ Using a comparable peer group of high - performing banks based in the Virginias, FCBC is an attractively priced name ▪ Peer group consists of $1 - $10 billion banks in W.Va. and Virginia with TCE >= 7% and NPA’s < 3% ▪ FCBC shows comparable returns and asset quality measures versus the group, but trades at a significant discount to peer tangible book and forward EPS pricing. Comparable peer group consists of AMNB, CFNL , CHCO , NKSH, STEL , TOWN, UBSI and WSBC. Pricing as of May 4, 2013. Source SNL. LTM LTM Price/ Price/ Leverage TCE/ Core Core LTM LTM NPA's/ Reserves/ Price/ 2013 Est 2014 Est Ratio TA ROAA ROAE NIM Efficiency Assets Loans TBV EPS EPS High Performing Group 10.65 9.30 1.19 9.78 3.80 53.35 1.65 1.31 1.55 13.09 13.39 FCBC 10.36 9.60 1.21 9.19 4.27 55.75 1.43 1.47 1.27 11.18 10.98
▪ A $2.72 billion VA, WV, NC, SC and TN branch franchise – Robust market share in legacy markets and attractive expansion into growth markets ▪ Positioned as regional consolidator – Continued growth via strategic and opportunistic FDIC - assisted deals ▪ True retail franchise generating low cost core deposits ▪ Exceptional loan quality – Low NPL’s / Loans of 2.12% at March 31, 2013 – NPA’s to total assets of 1.43% at March 31, 2013 Why buy FCBC? 27
▪ Strong pre - tax, pre - provision core income ▪ Net interest margin of 4.15% for 1Q 2013 ▪ Non - margin , fee - based revenue diversification ▪ Strong dividend yield of nearly 3% ▪ Positioned to emerge as one of the strongest players in the region and build one of the best franchises in the Mid - Atlantic ▪ Attractive valuation on forward earnings potential Why buy FCBC? 28

Contact Information First Community Bancshares, Inc. NASDAQ: FCBC One Community Place Bluefield, VA 24605 For More Information Contact: David D. Brown Chief Financial Officer First Community Bancshares, Inc. (276) 326 - 9000 29