Attached files
| file | filename |
|---|---|
| 8-K - BROOKLINE BANCORP, INC. 8-K - BROOKLINE BANCORP INC | a50627641.htm |
Exhibit 99.1
Brookline Bancorp, Inc. 2013 Annual Meeting of Stockholders BUILDING ON WHO WE ARE.
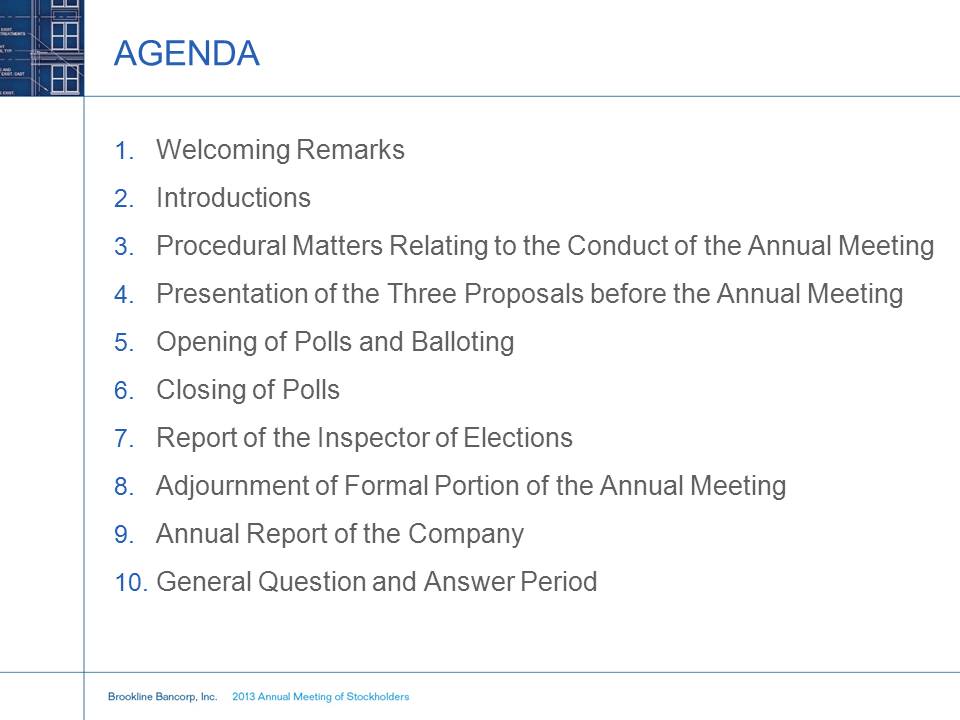 AGENDA 1.Welcoming
Remarks 2.Introductions 3.Procedural Matters Relating to the Conduct of
the Annual Meeting 4.Presentation of the Three Proposals before the
Annual Meeting 5.Opening of Polls and Balloting 6.Closing of Polls
7.Report of the Inspector of Elections 8.Adjournment of Formal Portion
of the Annual Meeting 9.Annual Report of the Company 10.General Question
and Answer Period
AGENDA 1.Welcoming
Remarks 2.Introductions 3.Procedural Matters Relating to the Conduct of
the Annual Meeting 4.Presentation of the Three Proposals before the
Annual Meeting 5.Opening of Polls and Balloting 6.Closing of Polls
7.Report of the Inspector of Elections 8.Adjournment of Formal Portion
of the Annual Meeting 9.Annual Report of the Company 10.General Question
and Answer Period

Brookline Bancorp, Inc. 2013 Annual Meeting of Stockholders BUILDING ON WHO WE ARE.
 FORWARD-LOOKING
STATEMENTS Certain statements in this presentation that are not
historical facts may constitute forward-looking statements within the
meaning of Section 27A of the Securities Act of 1933, as amended, and
Section 21E of the Securities Exchange Act of 1934, as amended, and are
intended to be covered by the safe harbor provisions of the Private
Securities Litigation Reform Act of 1995. Forward-looking statements
involve risks and uncertainties. These statements include, among others,
statements regarding our strategy, evaluations of future interest rate
trends and liquidity, expectations as to growth in assets, deposits and
results of operations, success of acquisitions, future operations,
market position, financial position, and prospects, plans and objectives
of management. You should not place undue reliance on the Company’s
forward-looking statements. You should exercise caution in interpreting
and relying on forward-looking statements because they are subject to
significant risks, uncertainties and other factors which are, in some
cases, beyond the Company’s control. Forward-looking statements are
based on the current assumptions and beliefs of management and are only
expectations of future results. The Company’s actual results could
differ materially from those projected in the forward-looking statements
as a result of, among other factors, changes in interest rates;
competitive pressures from other financial institutions; the effects of
continued weakness in general economic conditions on a national basis or
in the local markets in which the Company operates, including changes
that adversely affect borrowers’ ability to service and repay our loans;
changes in the value of securities in the Company’s investment
portfolio, changes in loan default and charge-off rates, the adequacy of
loan loss reserves, decreases in deposit levels necessitating increased
borrowing to fund loans and investments; changes in government
regulation, as well as the other risks and uncertainties detailed in the
Company’s Annual Report on Form 10-K, as updated by the Company’s
Quarterly Reports on Form 10-Q and other filings submitted to the
Securities and Exchange Commission. Forward looking statements speak
only as of the date on which they are made. The Company does not
undertake any obligation to update any forward-looking statement to
reflect circumstances or events that occur after the date the
forward-looking statements are made.
FORWARD-LOOKING
STATEMENTS Certain statements in this presentation that are not
historical facts may constitute forward-looking statements within the
meaning of Section 27A of the Securities Act of 1933, as amended, and
Section 21E of the Securities Exchange Act of 1934, as amended, and are
intended to be covered by the safe harbor provisions of the Private
Securities Litigation Reform Act of 1995. Forward-looking statements
involve risks and uncertainties. These statements include, among others,
statements regarding our strategy, evaluations of future interest rate
trends and liquidity, expectations as to growth in assets, deposits and
results of operations, success of acquisitions, future operations,
market position, financial position, and prospects, plans and objectives
of management. You should not place undue reliance on the Company’s
forward-looking statements. You should exercise caution in interpreting
and relying on forward-looking statements because they are subject to
significant risks, uncertainties and other factors which are, in some
cases, beyond the Company’s control. Forward-looking statements are
based on the current assumptions and beliefs of management and are only
expectations of future results. The Company’s actual results could
differ materially from those projected in the forward-looking statements
as a result of, among other factors, changes in interest rates;
competitive pressures from other financial institutions; the effects of
continued weakness in general economic conditions on a national basis or
in the local markets in which the Company operates, including changes
that adversely affect borrowers’ ability to service and repay our loans;
changes in the value of securities in the Company’s investment
portfolio, changes in loan default and charge-off rates, the adequacy of
loan loss reserves, decreases in deposit levels necessitating increased
borrowing to fund loans and investments; changes in government
regulation, as well as the other risks and uncertainties detailed in the
Company’s Annual Report on Form 10-K, as updated by the Company’s
Quarterly Reports on Form 10-Q and other filings submitted to the
Securities and Exchange Commission. Forward looking statements speak
only as of the date on which they are made. The Company does not
undertake any obligation to update any forward-looking statement to
reflect circumstances or events that occur after the date the
forward-looking statements are made.
 BASIS OF
PRESENTATION GAAP The Company's consolidated financial statements have
been prepared in conformity with generally accepted accounting
principles (“GAAP”) as set forth by the FASB in its Accounting Standards
Codification and through the rules and interpretive releases of the SEC
under the authority of federal securities laws. Non-GAAP Financial
Measures The Company uses certain non-GAAP financial measures, such as
net earnings from operations, operating earnings per share, operating
ROE, operating ROA, the allowance for loan and lease losses as a
percentage of originated loans and leases, tangible stockholders’
equity, tangible book value per common share and tangible stockholders’
equity to tangible assets. These non-GAAP financial measures provide
information for investors to effectively analyze financial trends of
ongoing business activities, and to enhance comparability with peers
across the financial services sector. A detailed reconciliation table of
the Company's GAAP to the non-GAAP measures is included in the Company’s
April 24, 2013 press release.
BASIS OF
PRESENTATION GAAP The Company's consolidated financial statements have
been prepared in conformity with generally accepted accounting
principles (“GAAP”) as set forth by the FASB in its Accounting Standards
Codification and through the rules and interpretive releases of the SEC
under the authority of federal securities laws. Non-GAAP Financial
Measures The Company uses certain non-GAAP financial measures, such as
net earnings from operations, operating earnings per share, operating
ROE, operating ROA, the allowance for loan and lease losses as a
percentage of originated loans and leases, tangible stockholders’
equity, tangible book value per common share and tangible stockholders’
equity to tangible assets. These non-GAAP financial measures provide
information for investors to effectively analyze financial trends of
ongoing business activities, and to enhance comparability with peers
across the financial services sector. A detailed reconciliation table of
the Company's GAAP to the non-GAAP measures is included in the Company’s
April 24, 2013 press release.
 OVERVIEW •Strong
growth •Acquisition integrations on target •Fortress balance sheet
•Exceptional asset quality •Ongoing enhancement of funding base •Strong
core earnings •Continued capital strength
OVERVIEW •Strong
growth •Acquisition integrations on target •Fortress balance sheet
•Exceptional asset quality •Ongoing enhancement of funding base •Strong
core earnings •Continued capital strength
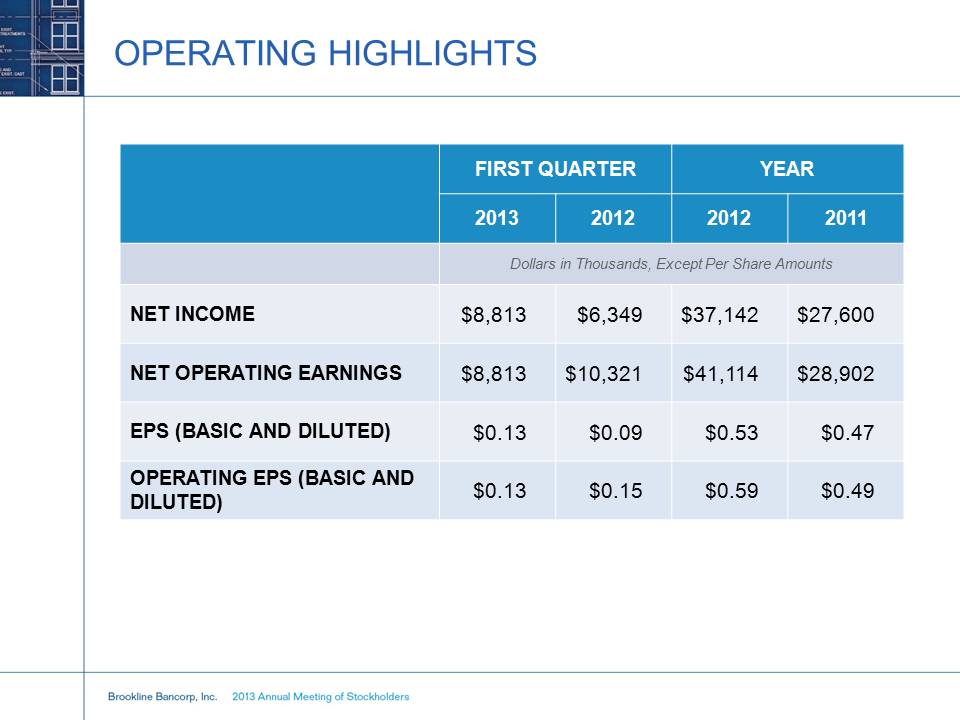 OPERATING HIGHLIGHTS
FIRST QUARTER YEAR 2013 2012 2012 2011 Dollars in Thousands, Except Per
Share Amounts NET INCOME $8,813 $6,349 $37,142 $27,600 NET OPERATING
EARNINGS $8,813 $10,321 $41,114 $28,902 EPS (BASIC AND DILUTED) $0.13
$0.09 $0.53 $0.47 OPERATING EPS (BASIC AND DILUTED) $0.13 $0.15 $0.59
$0.49
OPERATING HIGHLIGHTS
FIRST QUARTER YEAR 2013 2012 2012 2011 Dollars in Thousands, Except Per
Share Amounts NET INCOME $8,813 $6,349 $37,142 $27,600 NET OPERATING
EARNINGS $8,813 $10,321 $41,114 $28,902 EPS (BASIC AND DILUTED) $0.13
$0.09 $0.53 $0.47 OPERATING EPS (BASIC AND DILUTED) $0.13 $0.15 $0.59
$0.49
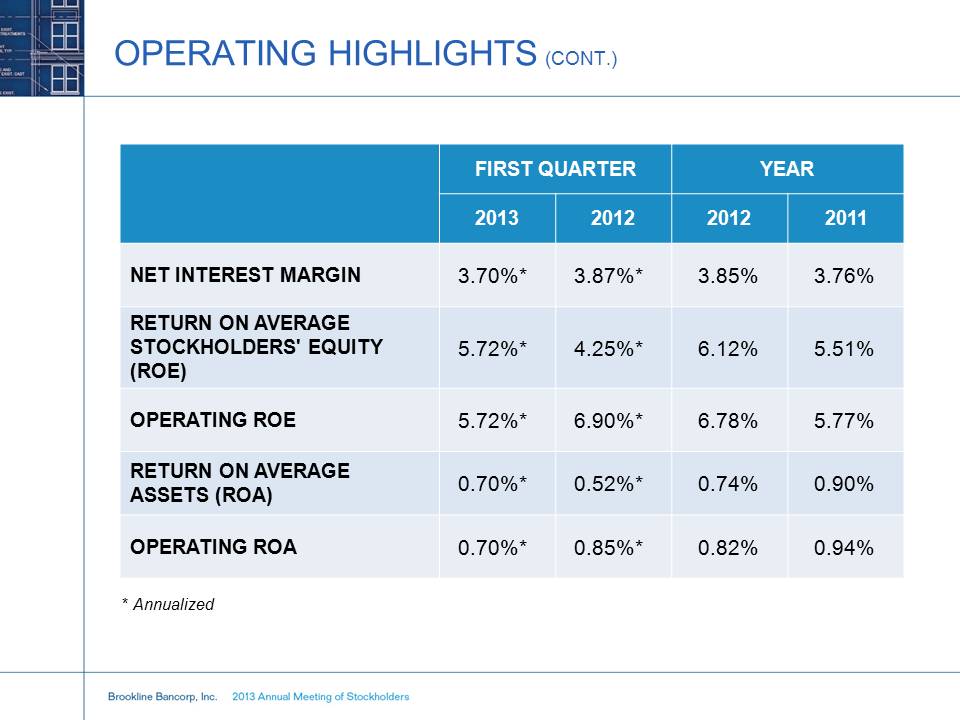 OPERATING HIGHLIGHTS
(CONT.) FIRST QUARTER YEAR 2013 2012 2012 2011 NET INTEREST MARGIN
3.70%* 3.87%* 3.85% 3.76% RETURN ON AVERAGE STOCKHOLDERS' EQUITY (ROE)
5.72%* 4.25%* 6.12% 5.51% OPERATING ROE 5.72%* 6.90%* 6.78% 5.77% RETURN
ON AVERAGE ASSETS (ROA) 0.70%* 0.52%* 0.74% 0.90% OPERATING ROA 0.70%*
0.85%* 0.82% 0.94% * Annualized
OPERATING HIGHLIGHTS
(CONT.) FIRST QUARTER YEAR 2013 2012 2012 2011 NET INTEREST MARGIN
3.70%* 3.87%* 3.85% 3.76% RETURN ON AVERAGE STOCKHOLDERS' EQUITY (ROE)
5.72%* 4.25%* 6.12% 5.51% OPERATING ROE 5.72%* 6.90%* 6.78% 5.77% RETURN
ON AVERAGE ASSETS (ROA) 0.70%* 0.52%* 0.74% 0.90% OPERATING ROA 0.70%*
0.85%* 0.82% 0.94% * Annualized
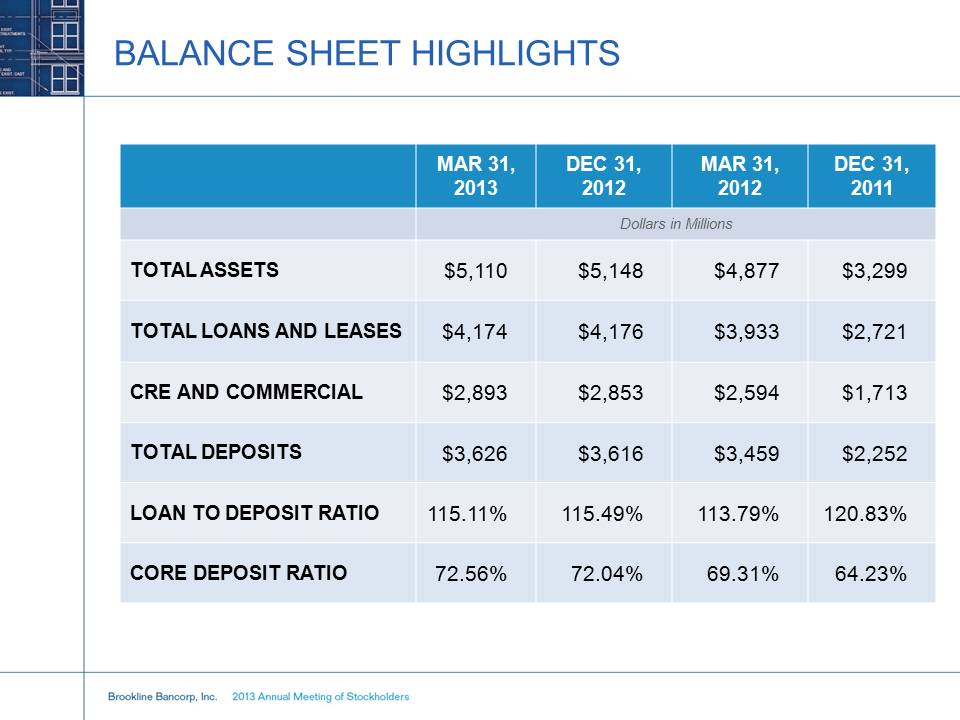 BALANCE SHEET
HIGHLIGHTS MAR 31, 2013 DEC 31, 2012 MAR 31, 2012 DEC 31, 2011 Dollars
in Millions TOTAL ASSETS $5,110 $5,148 $4,877 $3,299 TOTAL LOANS AND
LEASES $4,174 $4,176 $3,933 $2,721 CRE AND COMMERCIAL $2,893 $2,853
$2,594 $1,713 TOTAL DEPOSITS $3,626 $3,616 $3,459 $2,252 LOAN TO DEPOSIT
RATIO 115.11% 115.49% 113.79% 120.83% CORE DEPOSIT RATIO 72.56% 72.04%
69.31% 64.23%
BALANCE SHEET
HIGHLIGHTS MAR 31, 2013 DEC 31, 2012 MAR 31, 2012 DEC 31, 2011 Dollars
in Millions TOTAL ASSETS $5,110 $5,148 $4,877 $3,299 TOTAL LOANS AND
LEASES $4,174 $4,176 $3,933 $2,721 CRE AND COMMERCIAL $2,893 $2,853
$2,594 $1,713 TOTAL DEPOSITS $3,626 $3,616 $3,459 $2,252 LOAN TO DEPOSIT
RATIO 115.11% 115.49% 113.79% 120.83% CORE DEPOSIT RATIO 72.56% 72.04%
69.31% 64.23%
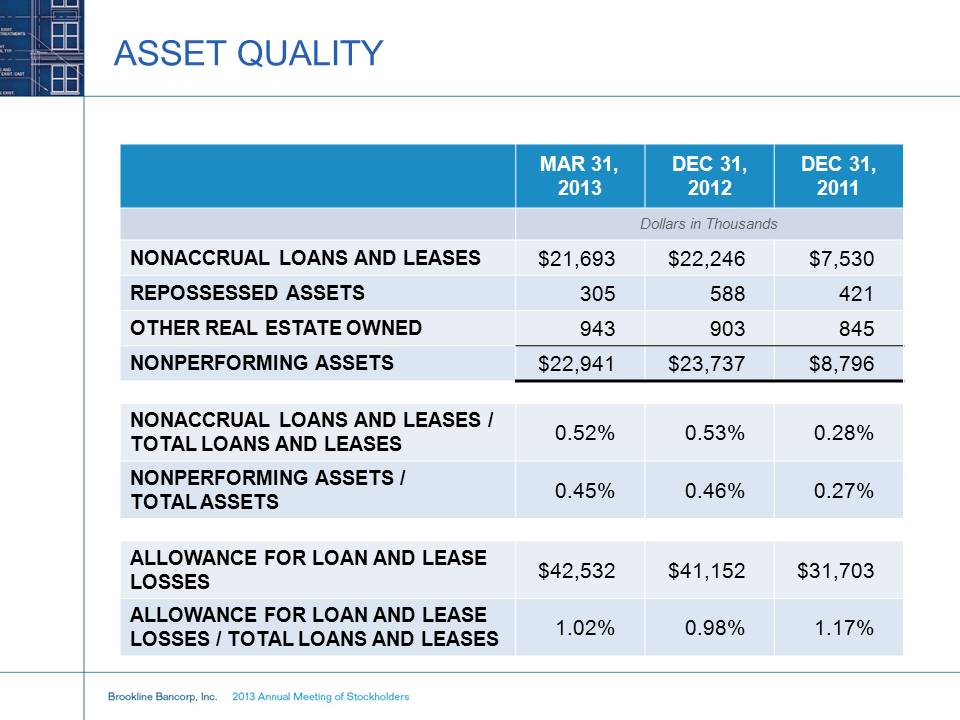 ASSET QUALITY MAR
31, 2013 DEC 31, 2012 DEC 31, 2011 Dollars in Thousands NONACCRUAL LOANS
AND LEASES $21,693 $22,246 $7,530 REPOSSESSED ASSETS 305 588 421 OTHER
REAL ESTATE OWNED 943 903 845 NONPERFORMING ASSETS $22,941 $23,737
$8,796 NONACCRUAL LOANS AND LEASES / TOTAL LOANS AND LEASES 0.52% 0.53%
0.28% NONPERFORMING ASSETS / TOTAL ASSETS 0.45% 0.46% 0.27% ALLOWANCE
FOR LOAN AND LEASE LOSSES $42,532 $41,152 $31,703 ALLOWANCE FOR LOAN AND
LEASE LOSSES / TOTAL LOANS AND LEASES 1.02% 0.98% 1.17%
ASSET QUALITY MAR
31, 2013 DEC 31, 2012 DEC 31, 2011 Dollars in Thousands NONACCRUAL LOANS
AND LEASES $21,693 $22,246 $7,530 REPOSSESSED ASSETS 305 588 421 OTHER
REAL ESTATE OWNED 943 903 845 NONPERFORMING ASSETS $22,941 $23,737
$8,796 NONACCRUAL LOANS AND LEASES / TOTAL LOANS AND LEASES 0.52% 0.53%
0.28% NONPERFORMING ASSETS / TOTAL ASSETS 0.45% 0.46% 0.27% ALLOWANCE
FOR LOAN AND LEASE LOSSES $42,532 $41,152 $31,703 ALLOWANCE FOR LOAN AND
LEASE LOSSES / TOTAL LOANS AND LEASES 1.02% 0.98% 1.17%
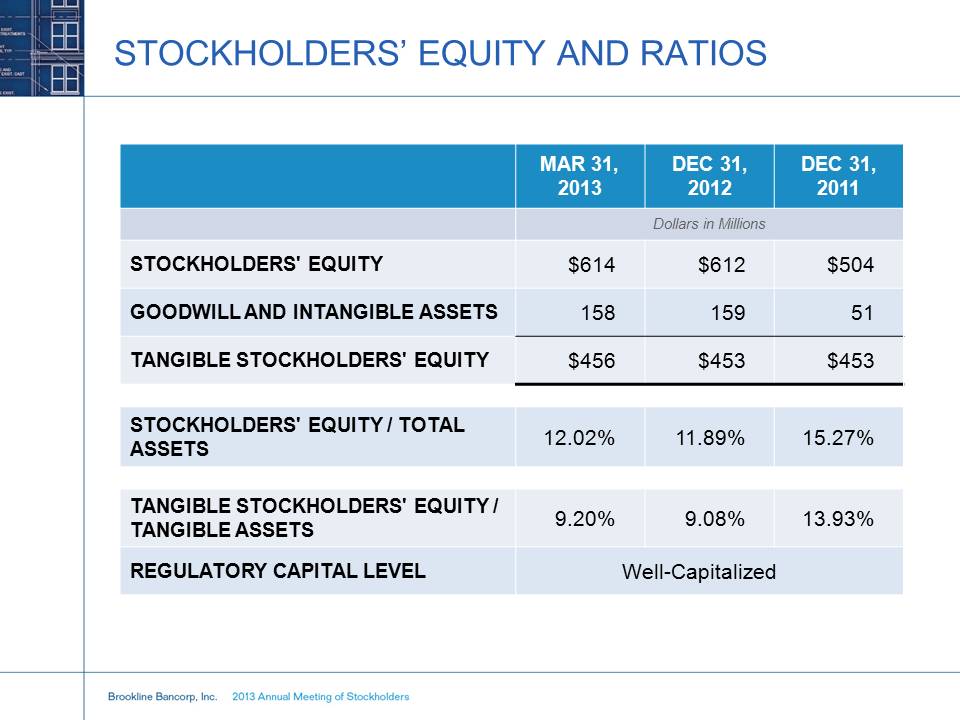 STOCKHOLDERS’ EQUITY
AND RATIOS MAR 31, 2013 DEC 31, 2012 DEC 31, 2011 Dollars in Millions
STOCKHOLDERS' EQUITY $614 $612 $504 GOODWILL AND INTANGIBLE ASSETS 158
159 51 TANGIBLE STOCKHOLDERS' EQUITY $456 $453 $453 STOCKHOLDERS' EQUITY
/ TOTAL ASSETS 12.02% 11.89% 15.27% TANGIBLE STOCKHOLDERS' EQUITY /
TANGIBLE ASSETS 9.20% 9.08% 13.93% REGULATORY CAPITAL LEVEL
Well-Capitalized
STOCKHOLDERS’ EQUITY
AND RATIOS MAR 31, 2013 DEC 31, 2012 DEC 31, 2011 Dollars in Millions
STOCKHOLDERS' EQUITY $614 $612 $504 GOODWILL AND INTANGIBLE ASSETS 158
159 51 TANGIBLE STOCKHOLDERS' EQUITY $456 $453 $453 STOCKHOLDERS' EQUITY
/ TOTAL ASSETS 12.02% 11.89% 15.27% TANGIBLE STOCKHOLDERS' EQUITY /
TANGIBLE ASSETS 9.20% 9.08% 13.93% REGULATORY CAPITAL LEVEL
Well-Capitalized

Brookline Bancorp, Inc. 2013 Annual Meeting of Stockholders BUILDING ON WHO WE ARE.