Attached files
| file | filename |
|---|---|
| 8-K - CURRENT REPORT - SCIENTIFIC GAMES CORP | v344172_8k.htm |
| EX-99.1 - PRESS RELEASE - SCIENTIFIC GAMES CORP | v344172_ex99-1.htm |
Exhibit 99.2

Scientific Games First Quarter 2013 Earnings Presentation
Safe Harbor Statement 2 Throughout this presentation the Company makes “forward - looking statements” within the meaning of the U.S. Private Securities Litigation Reform Act of 1995. Forward - looking statements describe future expectations, plans, results or strategies and can often be ident ified by the use of terminology such as “may,” “will,” “estimate,” “intend,” “continue,” “believe,” “expect,” “anticipate,” “should,” “cou ld, ” “potential,” “opportunity,” or similar terminology. These statements are based upon management’s current expectations, assumptions and es tim ates and are not guarantees of future results or performance. Actual results may differ materially from those contemplated in these s tat ements due to a variety of risks and uncertainties and other factors, including, among other things: competition; material adverse changes in economic and industry conditions; technological change; retention and renewal of existing contracts and entry into new or revised contract s; availability and adequacy of cash flows to satisfy obligations and indebtedness or future needs; protection of intellectual property; secu rit y and integrity of software and systems; laws and government regulation, including those relating to gaming licenses, permits and operations; in ability to identify, complete and integrate future acquisitions; inability to benefit from, and risks associated with, strategic equity inv estments and relationships; failure of our Northstar Illinois joint venture to meet the net income targets or otherwise to realize the anticipated benefits under its private management agreement with the Illinois Lottery; failure of our Northstar New Jersey joint venture to enter into an agreement to provide marketing and sales services to the New Jersey Lottery (including as a result of the pending protest) or to meet the net income targets or other requirements under any such agreement or otherwise to realize the anticipated benefits under any such ag reement; the seasonality of our business; inability to obtain the approvals required to complete the merger with WMS Industries Inc. ( “WM S”); failure to complete the merger with WMS or, if completed, failure to achieve the intended benefits of such merger or disruption of ou r c urrent plans and operations; inability to identify and capitalize on trends and changes in the lottery and gaming industries, including th e p otential expansion of regulated gaming via the internet; inability to enhance and develop successful gaming concepts; dependence on su ppl iers and manufacturers; liability for product defects; fluctuations in foreign currency exchange rates and other factors associated wi th international operations; influence of certain stockholders; dependence on key personnel; failure to perform under our contracts; resolutio n o f pending or future litigation; labor matters and stock price volatility. Additional information regarding risks and uncertainties and oth er factors that could cause actual results to differ materially from those contemplated in forward - looking statements is included from time to time in the Company’s filings with the Securities and Exchange Commission, including under the heading “Risk Factors” in the Company’s pe rio dic reports. Forward - looking statements speak only as of the date they are made and, except for the Company’s ongoing obligations un der the U.S. federal securities laws, the Company undertakes no obligation to publicly update any forward - looking statements whether as a result of new information, future events or otherwise. The date of this presentation is as of May 7, 2013, and the information provided herein is presented through the dates indicated on the applicable slides. Forward - looking statements speak only as of the date they are made and, except for Scientific Games’ ongoing obligations under the U.S. federal securities laws, Scientific Games undertakes no obligation to publicly update any forward - looking stateme nts whether as a result of new information, future events or otherwise. Note Regarding Presentation of Non - GAAP Financial Measures: This presentation and the related discussion include certain financial measures that were not prepared in accordance with gen era lly accepted accounting principles in the United States (GAAP). Additional information regarding these non - GAAP financial measures, includin g reconciliations to the most directly comparable GAAP financial measures, can be found in Scientific Games’ press release dated May 7, 2013. This press release is available on Scientific Games’ website at www.scientificgames.com in the “Investor Information – Press Rel eases ”. Scientific Games sold its installed base of gaming terminals in its pub business on March 25, 2013. The results of this sale are presented as discontinued operations in the Company’s financial statements for all periods presented. All financial results referenced in thi s presentation are for continuing operations only, unless otherwise noted.
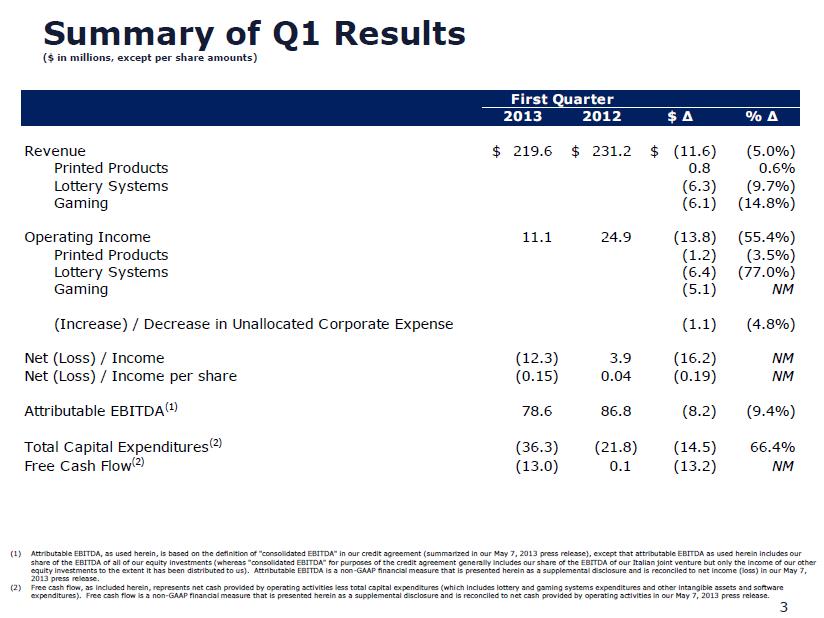
3 (1) Attributable EBITDA, as used herein, is based on the definition of "consolidated EBITDA" in our credit agreement (summarized in our May 7, 2013 press release), except that attributable EBITDA as used herein includes our share of the EBITDA of all of our equity investments (whereas "consolidated EBITDA" for purposes of the credit agreement gene ral ly includes our share of the EBITDA of our Italian joint venture but only the income of our other equity investments to the extent it has been distributed to us). Attributable EBITDA is a non - GAAP financial measure that is pr esented herein as a supplemental disclosure and is reconciled to net income (loss) in our May 7, 2013 press release. (2) Free cash flow, as included herein, represents net cash provided by operating activities less total capital expenditures (whi ch includes lottery and gaming systems expenditures and other intangible assets and software expenditures). Free cash flow is a non - GAAP financial measure that is presented herein as a supplemental disclosure and is reco nciled to net cash provided by operating activities in our May 7, 2013 press release . Summary of Q1 Results ($ in millions, except per share amounts) 2013 2012 $ Δ % Δ Revenue 219.6$ 231.2$ (11.6)$ (5.0%) Printed Products 126.3 125.5 0.8 0.6% Lottery Systems 58.2 64.5 (6.3) (9.7%) Gaming 35.1 41.2 (6.1) (14.8%) Operating Income 11.1 24.9 (13.8) (55.4%) Printed Products 33.9 35.1 (1.2) (3.5%) Lottery Systems 1.9 8.3 (6.4) (77.0%) Gaming (1.5) 3.7 (5.1) NM (Increase) / Decrease in Unallocated Corporate Expense (23.2) (22.1) (1.1) (4.8%) Net (Loss) / Income (12.3) 3.9 (16.2) NM Net (Loss) / Income per share (0.15) 0.04 (0.19) NM Attributable EBITDA (1) 78.6 86.8 (8.2) (9.4%) Total Capital Expenditures (2) (36.3) (21.8) (14.5) 66.4% Free Cash Flow (2) (13.0) 0.1 (13.2) NM First Quarter
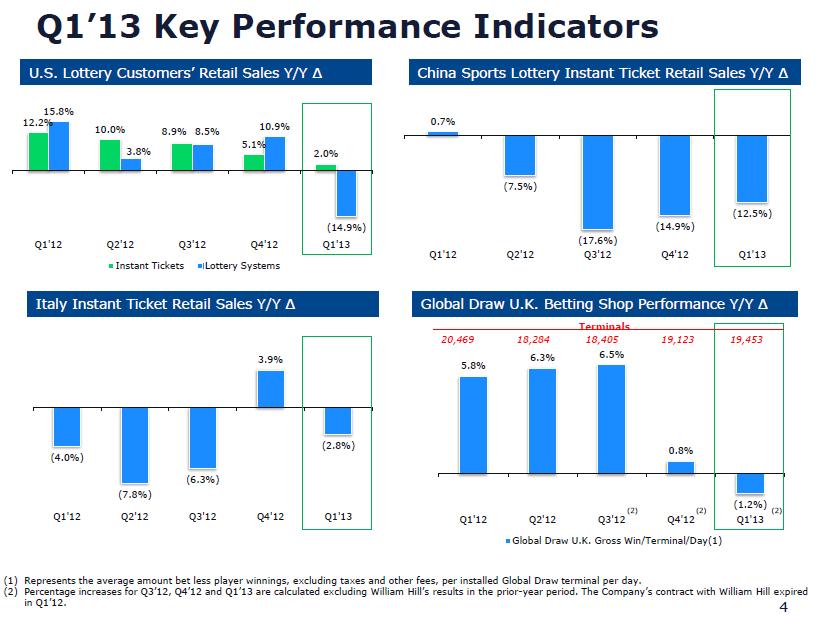
5.8% 6.3% 6.5% 0.8% (1.2%) Q1'12 Q2'12 Q3'12 Q4'12 Q1'13 Global Draw U.K. Gross Win/Terminal/Day(1) (4.0%) (7.8%) (6.3%) 3.9% (2.8%) Q1'12 Q2'12 Q3'12 Q4'12 Q1'13 0.7% (7.5%) (17.6%) (14.9%) (12.5%) Q1'12 Q2'12 Q3'12 Q4'12 Q1'13 Q1’13 Key Performance Indicators U.S. Lottery Customers’ Retail Sales Y/Y Δ China Sports Lottery Instant Ticket Retail Sales Y/Y Δ Italy Instant Ticket Retail Sales Y/Y Δ Global Draw U.K. Betting Shop Performance Y/Y Δ 20,469 Terminals 18,284 18,405 (1) Represents the average amount bet less player winnings, excluding taxes and other fees, per installed Global Draw terminal pe r d ay. (2) Percentage increases for Q3’12, Q4’12 and Q1’13 are calculated excluding William Hill’s results in the prior - year period. The Company’s contract with William Hill expired in Q1’12. 19,123 (2) 4 (2) 12.2% 10.0% 8.9% 5.1% 2.0% 15.8% 3.8% 8.5% 10.9% (14.9%) Q1'12 Q2'12 Q3'12 Q4'12 Q1'13 Instant Tickets Lottery Systems (2) 19,453
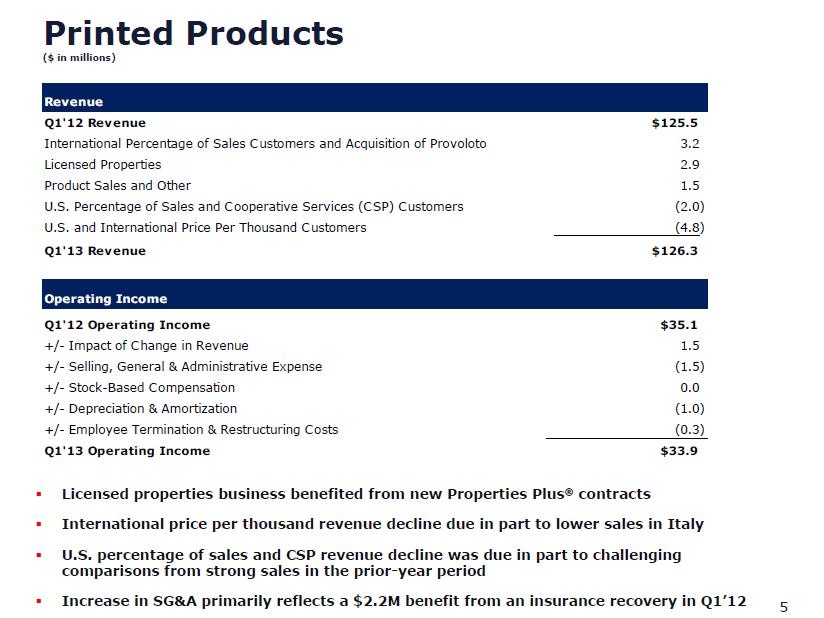
Printed Products ($ in millions) 5 ▪ Licensed properties business benefited from new Properties Plus ® contracts ▪ International price per thousand revenue decline due in part to lower sales in Italy ▪ U.S. percentage of sales and CSP revenue decline was due in part to challenging comparisons from strong sales in the prior - year period ▪ Increase in SG&A primarily reflects a $2.2M benefit from an insurance recovery in Q1’12 Revenue Q1'12 Revenue $125.5 International Percentage of Sales Customers and Acquisition of Provoloto 3.2 Licensed Properties 2.9 Product Sales and Other 1.5 U.S. Percentage of Sales and Cooperative Services (CSP) Customers (2.0) U.S. and International Price Per Thousand Customers (4.8) Q1'13 Revenue $126.3 Operating Income Q1'12 Operating Income $35.1 +/- Impact of Change in Revenue 1.5 +/- Selling, General & Administrative Expense (1.5) +/- Stock-Based Compensation 0.0 +/- Depreciation & Amortization (1.0) +/- Employee Termination & Restructuring Costs (0.3) Q1'13 Operating Income $33.9
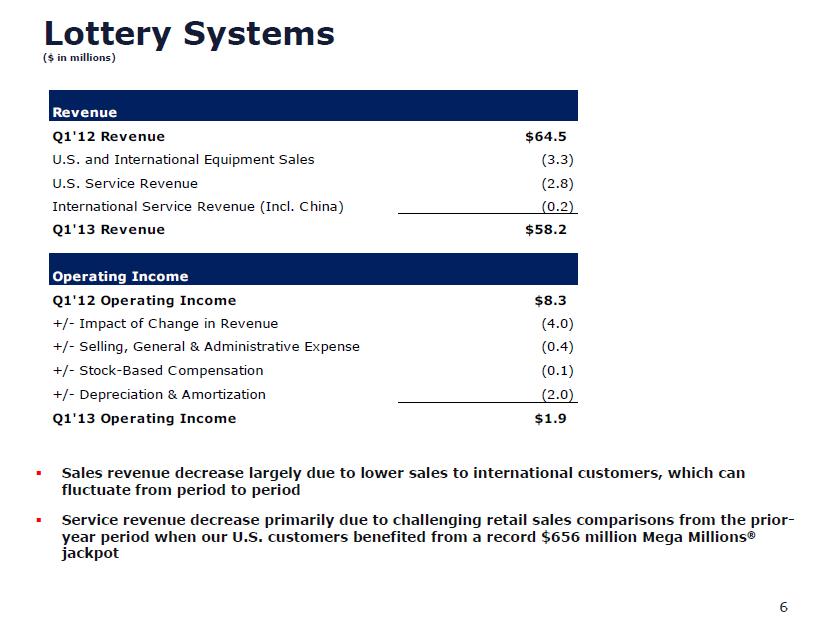
Lottery Systems ($ in millions) 6 ▪ Sales revenue decrease largely due to lower sales to international customers, which can fluctuate from period to period ▪ Service revenue decrease primarily due to challenging retail sales comparisons from the prior - year period when our U.S. customers benefited from a record $656 million Mega Millions ® jackpot Revenue Q1'12 Revenue $64.5 U.S. and International Equipment Sales (3.3) U.S. Service Revenue (2.8) International Service Revenue (Incl. China) (0.2) Q1'13 Revenue $58.2 Operating Income Q1'12 Operating Income $8.3 +/- Impact of Change in Revenue (4.0) +/- Selling, General & Administrative Expense (0.4) +/- Stock-Based Compensation (0.1) +/- Depreciation & Amortization (2.0) Q1'13 Operating Income $1.9
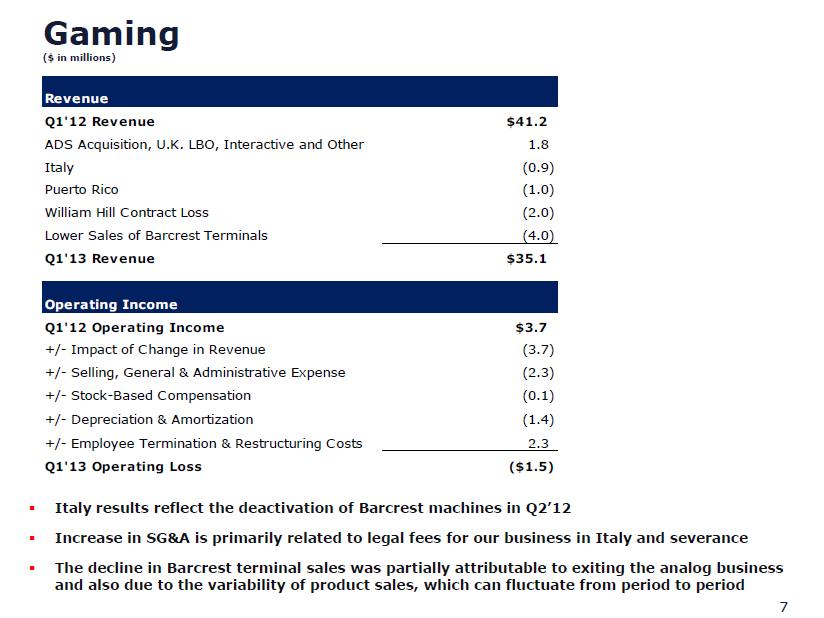
Gaming ($ in millions) 7 ▪ Italy results reflect the deactivation of Barcrest machines in Q2’12 ▪ Increase in SG&A is primarily related to legal fees for our business in Italy and severance ▪ The decline in Barcrest terminal sales was partially attributable to exiting the analog business and also due to the variability of product sales, which can fluctuate from period to period Revenue Q1'12 Revenue $41.2 ADS Acquisition, U.K. LBO, Interactive and Other 1.8 Italy (0.9) Puerto Rico (1.0) William Hill Contract Loss (2.0) Lower Sales of Barcrest Terminals (4.0) Q1'13 Revenue $35.1 Operating Income Q1'12 Operating Income $3.7 +/- Impact of Change in Revenue (3.7) +/- Selling, General & Administrative Expense (2.3) +/- Stock-Based Compensation (0.1) +/- Depreciation & Amortization (1.4) +/- Employee Termination & Restructuring Costs 2.3 Q1'13 Operating Loss ($1.5)
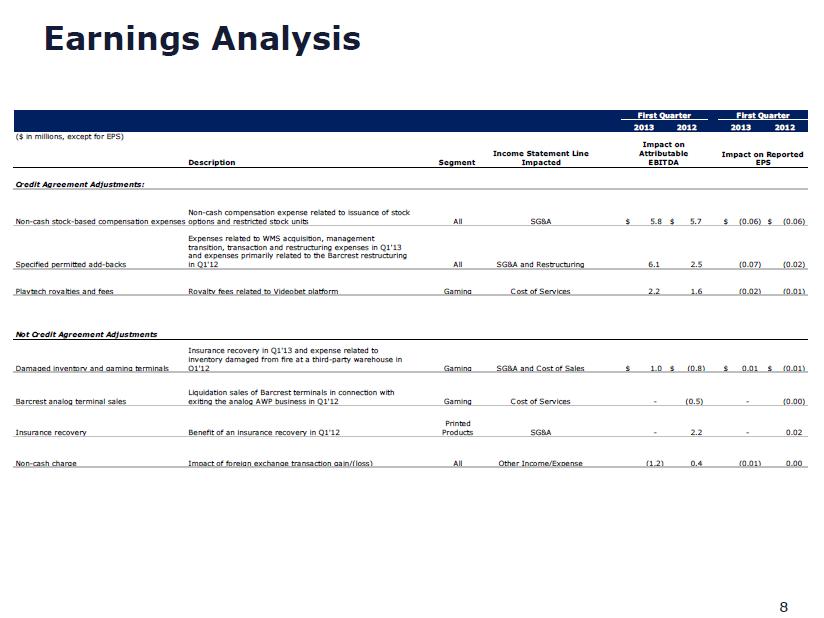
Earnings Analysis 8 First Quarter First Quarter 2013 2012 ($ in millions, except for EPS) Description Segment Income Statement Line Impacted Impact on Attributable EBITDA Credit Agreement Adjustments: Non-cash stock-based compensation expenses Non-cash compensation expense related to issuance of stock options and restricted stock units All SG&A $ 5.8 $ 5.7 (0.06)$ (0.06)$ Specified permitted add-backs Expenses related to WMS acquisition, management transition, transaction and restructuring expenses in Q1'13 and expenses primarily related to the Barcrest restructuring in Q1'12 All SG&A and Restructuring 6.1 2.5 (0.07) (0.02) Playtech royalties and fees Royalty fees related to Videobet platform Gaming Cost of Services 2.2 1.6 (0.02) (0.01) Not Credit Agreement Adjustments Damaged inventory and gaming terminals Insurance recovery in Q1'13 and expense related to inventory damaged from fire at a third-party warehouse in Q1'12 Gaming SG&A and Cost of Sales $ 1.0 $ (0.8) 0.01$ (0.01)$ Barcrest analog terminal sales Liquidation sales of Barcrest terminals in connection with exiting the analog AWP business in Q1'12 Gaming Cost of Services - (0.5) - (0.00) Insurance recovery Benefit of an insurance recovery in Q1'12 Printed Products SG&A - 2.2 - 0.02 Non-cash charge Impact of foreign exchange transaction gain/(loss) All Other Income/Expense (1.2) 0.4 (0.01) 0.00 Impact on Reported EPS 2013 2012