Attached files
| file | filename |
|---|---|
| 8-K - 8-K - PACWEST BANCORP | a13-11605_18k.htm |
Exhibit 99.1
|
|
D.A. DAVIDSON & CO. FINANCIAL SERVICES CONFERENCE Seattle, Washington May 8, 2013 |

|
|
FORWARD-LOOKING STATEMENTS This presentation contains certain forward-looking information about PacWest Bancorp that is intended to be covered by the safe harbor for “forward-looking statements” provided by the Private Securities Litigation Reform Act of 1995. All references herein to PacWest are intended to refer to PacWest and its predecessor First Community Bancorp. All statements other than statements of historical fact are forward-looking statements. Such statements involve inherent risks and uncertainties, many of which are difficult to predict and are generally beyond the control of the Company. We caution readers that a number of important factors could cause actual results to differ materially from those expressed in, implied or projected by, such forward-looking statements. Risks and uncertainties include, but are not limited to: planned acquisitions and related cost savings cannot be realized or realized within the expected time frame; lower than expected revenues; credit quality deterioration which could cause an increase in the allowance for credit losses and a reduction in net earnings; increased competitive pressure among depository institutions; the Company’s ability to complete announced acquisitions, to successfully integrate acquired entities, or to achieve expected synergies and operating efficiencies within expected time-frames or at all; the integration of acquired businesses costs more, takes longer or is less successful than expected; the possibility that personnel changes will not proceed as planned; the cost of additional capital is more than expected; a change in the interest rate environment reduces net interest margins; asset/liability repricing risks and liquidity risks; pending legal matters may take longer or cost more to resolve or may be resolved adversely to the Company; general economic conditions, either nationally or in the market areas in which the Company does or anticipates doing business, are less favorable than expected; environmental conditions, including natural disasters, may disrupt our business, impede our operations, negatively impact the values of collateral securing the Company’s loans or impair the ability of our borrowers to support their debt obligations; the economic and regulatory effects of the continuing war on terrorism and other events of war, including the conflicts in the Middle East; legislative or regulatory requirements or changes adversely affecting the Company’s business; changes in the securities markets; regulatory approvals for any acquisitions cannot be obtained on the terms expected or on the anticipated schedule; and, other risks that are described in PacWest’s (including its predecessor’s) public filings with the U.S. Securities and Exchange Commission (the “SEC”). If any of these risks or uncertainties materializes or if any of the assumptions underlying such forward-looking statements proves to be incorrect, PacWest’s results could differ materially from those expressed in, implied or projected by such forward-looking statements. PacWest assumes no obligation to update such forward-looking statements. For a more complete discussion of risks and uncertainties, investors and security holders are urged to read the Company’s annual report on Form 10-K, quarterly reports on Form 10-Q and other reports filed by PacWest with the SEC. The documents filed by PacWest with the SEC may be obtained at PacWest Bancorp’s website at www.pacwestbancorp.com or at the SEC’s website at www.sec.gov. These documents may also be obtained free of charge from PacWest by directing a request to: PacWest Bancorp c/o Pacific Western Bank, 275 North Brea Boulevard, Brea, CA 92821. Attention: Investor Relations. Telephone 714-671-6800. May 8, 2013 Page 2 And Where to Find Additional Information |

|
|
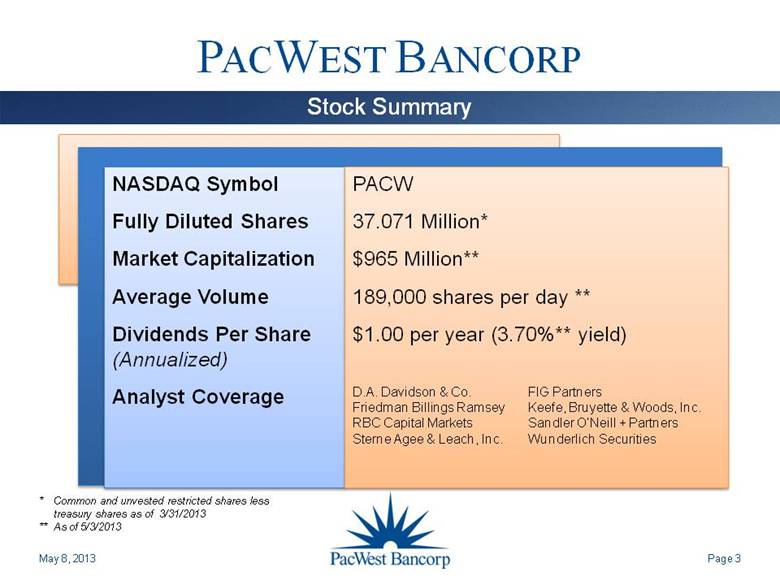
PACWEST BANCORP NASDAQ Symbol Fully Diluted Shares Market Capitalization Average Volume Dividends Per Share (Annualized) Analyst Coverage PACW 37.071 Million* $965 Million** 189,000 shares per day ** $1.00 per year (3.70%** yield) D.A. Davidson & Co. FIG Partners Friedman Billings Ramsey Keefe, Bruyette & Woods, Inc. RBC Capital Markets Sandler O’Neill + Partners Sterne Agee & Leach, Inc. Wunderlich Securities May 8, 2013 Page 3 Stock Summary * Common and unvested restricted shares less treasury shares as of 3/31/2013 ** As of 5/3/2013 |
|
|
PACWEST BANCORP Overview 5 1Q13 Highlights 7 Acquisition Activity 9 Credit 16 Net Interest Margin and Investment Yield 30 Expense Control 34 Performance Charts 35 Strong Franchise Value 37 Non-GAAP Measurements 41 May 8, 2013 Page 4 Presentation Index |

|
|
OVERVIEW $5.3 Billion in Assets at March 31, 2013 67 Full-Service Offices: 64 in Southern California and 3 in the Bay Area May 8, 2013 Page 5 Commercial Banking Focus in Southern California Source: Company Filings * See “Non-GAAP Measurements” slide. Strong Capital Levels* Proven Operating Model Generates Earnings For the First Quarter of 2013 NIM 5.40% Loan Yield 7.07% Deposit Cost 0.23% Adjusted Efficiency Ratio 61.7%* Adjusted Earnings Before Income Taxes $27.3 Million* Strong Credit Quality at March 31, 2013 Non-Covered NPA Ratio 2.60% Credit Loss Allowance to Net Non-Covered Loans and Leases 2.43% Credit Loss Allowance to Non-Covered Nonaccruals 172% Low Risk Profile Experienced Acquirer 25 Bank and Finance Company Acquisitions, Including 3 FDIC-Assisted Deals as of 3/31/13 Equity ($ millions) Equity/Assets Per Share Company - Tangible* $496.6 9.54% $13.40 Company - GAAP $589.8 11.13% $15.91 Bank - Tangible* $557.0 10.74% n/a Bank - GAAP $650.3 12.32% n/a |

|
|
OVERVIEW Manage for Profitability, Not Growth Strategic Focus on Low-Cost Deposits Strong Expense Management Focus on Credit Quality Results Include: Strong Net Interest Margin Controlled Operating Expenses Sustained Profitability May 8, 2013 Page 6 Operating Principles |

|
|
HIGHLIGHTS Patient approach to loan growth - Strong pipeline Asset financing loan growth: $49.2 million Strong on-balance sheet liquidity May 8, 2013 Page 7 1st Quarter 2013 Credit loss reserve coverage ratios on non-covered loans are strong ACL to loans: 2.43% ACL to nonaccruals: 172% Metrics ROA: 1.02% ROE: 9.29% ROTE: 11.05% NIM at 5.40% Net earnings of $13.5 million, or $0.37 per share Adjusted earnings before income taxes at $27.3 million * Tangible capital at $496.6 million, or $13.40 per share * DDAs to total deposits: 43% Core deposits to total deposits: 83% * See “Non-GAAP Measurements” slide. |

|
|
HIGHLIGHTS May 8, 2013 Page 8 Solid Earnings Track Record * See “Non-GAAP Measurements” slide. |

|
|
ACQUISITION ACTIVITY Similar Strategic Focus Asset generation capability Market Expansion In-Market Consolidation Key Drivers of Accretion: Cost Savings Customer Retention Margin Improvement May 8, 2013 Page 9 Acquisition Strategy |

|
|
ACQUISITION ACTIVITY On November 6, 2012, PacWest Bancorp announced it entered into an agreement to acquire First California Financial Group, Inc. (FCAL) The acquisition provides an attractive in-market consolidation opportunity of meaningful size to drive significant consolidated earnings accretion The combined company will be the 8th largest publicly-owned bank or bank holding company headquartered in California Both banks possess complementary business banking models with strong core deposit bases The resulting banking franchise will possess the capital resources, scale, management team and financial strength necessary to thrive in the current competitive environment May 8, 2013 Page 10 The FCAL Transaction |

|
|
Compelling Strategic Rationale Attractive in-market consolidation opportunity strengthens our competitive position as one of the premier Southern California community banks Complementary business banking model with similar strong core deposit base Significantly enhances franchise value through improved profitability and scale in key geographic markets ACQUISITION ACTIVITY May 8, 2013 Page 11 FCAL Transaction Highlights (1) Based on FCAL’s annualized YTD 9/30/12 non-interest expense less amortization of intangibles assets Financially Attractive Significant operating synergies due to considerable branch network overlap Estimated cost savings of $31.5 million(1) 9 branches (7 FCAL; 2 PACW) to be merged First full-year estimated earnings accretion: 12% Estimated IRR: >18% TBV dilution of 10% (at 9/30/12) with goodwill earn-back of ~3.5 years Execution Experience Mitigates Risk Track record of 25 successfully completed acquisitions and integrations since 2000 Due diligence complete Similar organizational structures and familiar operating markets Strong pro forma capital ratios |

|
|
SBLF Repayment Credit Adjustment Projected Cost Savings Merger-Related Costs Due Diligence Required Approval Anticipated Closing Board Representation Repay in full at closing, subject to regulatory approval $60 million (3.7% of net loans and 33.7% of FDIC indemnification asset) $31.5 million(3) of FCAL’s core non-interest expense ~$16 million (tax-effected) Complete, including extensive loan review Customary regulatory and shareholder approvals by both companies Q2 2013 with systems conversions 6/14/2013 Two FCAL independent directors to be determined Consideration Per Share Price: $8.00 per share Transaction Value: $228.4 million in the aggregate(1) Consideration Mix: 100% PacWest (“PACW”) Common Stock Exchange Ratio: Based volume weighted-average PACW share price determined over a measurement period(2) Collar: For purposes of exchange ratio, PACW share price floats within a collar between $20 and $27 and will be fixed at end of collar if PACW price is outside collar; if PACW price is ≥ $27, exchange ratio is 0.2963; if PACW price is ≤ $20, exchange ratio is 0.4000. ACQUISITION ACTIVITY Page 12 FCAL Transaction and Assumption Overview (1) Excludes 1.1 million FCAL shares owned by PACW; includes cash-out of “in-the-money” FCAL options.(2) 20-day VWAP of PacWest common stock on Nasdaq for 20 consecutive trading days ending second trading day prior to last of regulatory approvals 3) Based on FCAL’s annualized YTD 9/30/12 non-interest expense less amortization of intangible assets May 8, 2013 |

|
|
Prudent Pricing PACW-FCAL Recent Transactions(1) Price / Book Value: 1.11x 1.51x Price / Tangible Book Value: 1.70x 1.76x Core Deposit Premium: 7.2% 11.1% ACQUISITION ACTIVITY May 8, 2013 Page 13 FCAL Transaction Financial Rationale (1) Reflects median for non-assisted whole bank transactions announced since 12/31/11 through October 2012 for targets with assets between $1.0 billion and $10.0 billion and <4.0% NPAs to Assets Compelling Returns First full-year estimated EPS accretion: 12% Estimated IRR: >18% TBV dilution at 9/30/12: 10% Estimated earn-back of goodwill: ~3.5 years Source: SNL Financial based on GAAP/Regulatory Data |

|
|
Significant Potential Cost Savings ACQUISITION ACTIVITY May 8, 2013 Page 14 FCAL Transaction Financial Rationale (2) Based on FCAL’s annualized YTD 9/30/12 non-interest expense less amortization of intangibles assets (3) Cumulative quarterly net charge offs as a % of average non-covered loans since 1/1/08 plus estimated mark on non-covered loans in proposed transaction Mitigated Credit Risk 3.7% net mark on loans and 33.7% mark on FDIC indemnification assets ($60 million combined mark) Estimated 5.7% mark on gross non-covered loans implies 9.3% credit cycle losses since 12/31/07(3) $31.5 million(2) estimated cost savings 9 branches (7 FCAL; 2 PACW) to be merged Value creation from implied value of cost savings - $227 million - exceeds estimated premium paid Source: SNL Financial based on GAAP/Regulatory Data |

|
|
Central Coast Market (San Luis Obispo & Santa Barbara Counties) ACQUISITION ACTIVITY May 8, 2013 Page 15 The FCAL Transactions Strengthens Our Market Presence Southern California Market (Los Angeles, Ventura, Riverside, San Bernardino, Orange & San Diego Counties) PacWest First California Source: SNL Financial based on FDIC Deposit Data |

|
|
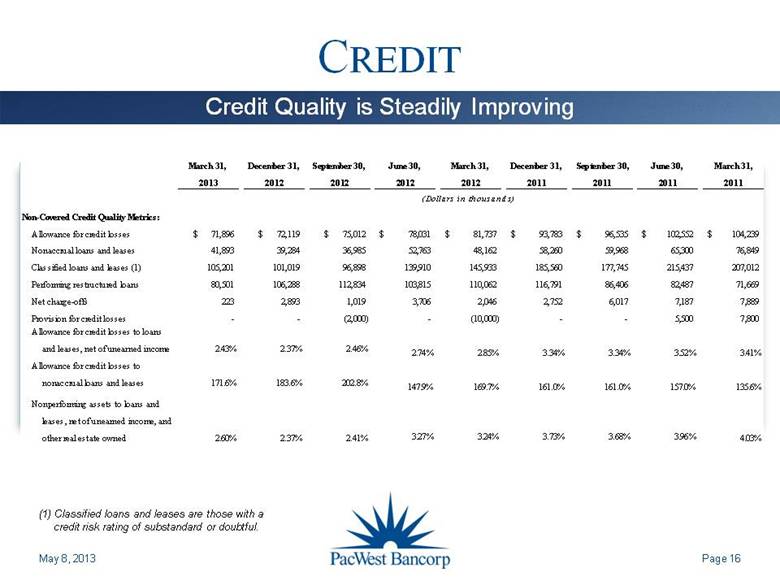
CREDIT May 8, 2013 Page 16 Credit Quality is Steadily Improving (1) Classified loans and leases are those with a credit risk rating of substandard or doubtful. March 31, December 31, September 30, June 30, March 31, December 31, September 30, June 30, March 31, 2013 2012 2012 2012 2012 2011 2011 2011 2011 (Dollars in thousands) Non-Covered Credit Quality Metrics: Allowance for credit losses 71,896 $ 72,119 $ 75,012 $ 78,031 $ 81,737 $ 93,783 $ 96,535 $ 102,552 $ 104,239 $ Nonaccrual loans and leases 41,893 39,284 36,985 52,763 48,162 58,260 59,968 65,300 76,849 Classified loans and leases (1) 105,201 101,019 96,898 139,910 145,933 185,560 177,745 215,437 207,012 Performing restructured loans 80,501 106,288 112,834 103,815 110,062 116,791 86,406 82,487 71,669 Net charge-offs 223 2,893 1,019 3,706 2,046 2,752 6,017 7,187 7,889 Provision for credit losses - - (2,000) - (10,000) - - 5,500 7,800 Allowance for credit losses to loans and leases, net of unearned income 2.43% 2.37% 2.46% 2.74% 2.85% 3.34% 3.34% 3.52% 3.41% Allowance for credit losses to nonaccrual loans and leases 171.6% 183.6% 202.8% 147.9% 169.7% 161.0% 161.0% 157.0% 135.6% Nonperforming assets to loans and leases, net of unearned income, and other real estate owned 2.60% 2.37% 2.41% 3.27% 3.24% 3.73% 3.68% 3.96% 4.03% |
|
|
CREDIT May 8, 2013 Page 17 Strong Credit Coverage Ratios Non-covered loans and leases only ACL to Net Loans |

|
|
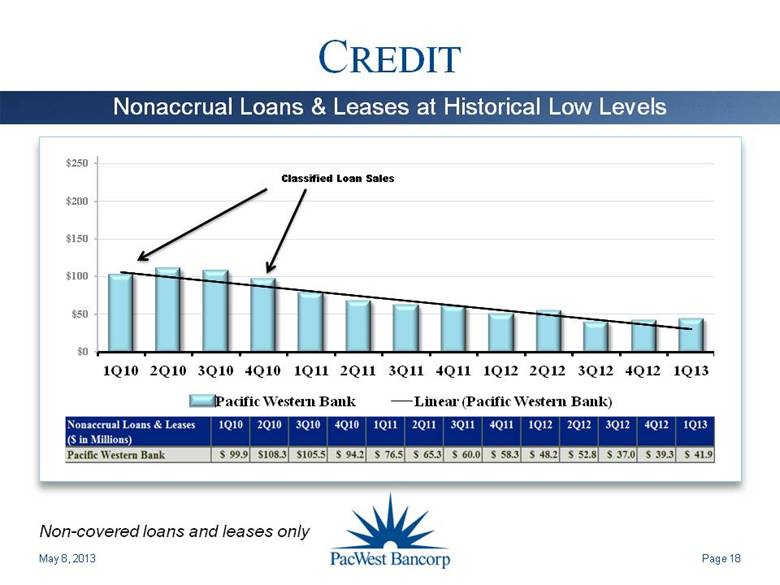
CREDIT May 8, 2013 Page 18 Nonaccrual Loans & Leases at Historical Low Levels Non-covered loans and leases only Classified Loan Sales |
|
|
CREDIT May 8, 2013 Page 19 New Nonaccruals at Historically Low Levels Non-covered loans and leases only |

|
|
CREDIT May 8, 2013 Page 20 Classified Loans & Leases at Historically Low Levels Non-covered loans and leases only Classified Loan Sales |

|
|
CREDIT May 8, 2013 Page 21 Nonperforming Assets at Historically Low Levels Non-covered only Classified Loan Sales |

|
|
CREDIT May 8, 2013 Page 22 Largest Non-Covered Nonaccrual Loans Nonaccrual Amount March 31, 2013 Description (In thousands) 6,823 $ Two loans, each secured by a hotel in San Diego County, California. The borrower is paying according to the restructured terms of each loan. (1) 3,472 Two loans, one of which is secured by an office building in Clark County, Nevada, and the other is secured by an office building in Maricopa County, Arizona. (1) 2,692 This loan is secured by an office building in San Diego County, California. (2) 2,358 This loan is secured by a strip retail center in Riverside County, California. (1) 1,877 This loan is secured by a strip retail center in Clark County, Nevada. (1) 1,425 This loan is secured by two industrial buildings in San Diego County, California. (1) 1,298 This loan is secured by an industrial building in San Bernardino County, California (2). 1,250 This loan is unsecured and has a specific reserve for 100% of the balance. (1) 1,173 Two loans, one of which is secured by an apartment building in San Diego County, California, and the other is secured by an office building in San Diego County, California. (1) 1,147 This loan is secured by three industrial buildings in Riverside County, California. (1) 23,515 $ Total (1) On nonaccrual status at December 31, 2012. (2) New nonaccrual in first quarter of 2013. |

|
|
CREDIT May 8, 2013 Page 23 Non-Covered Loan Charge-Off History Source: Company Filings |

|
|
CREDIT May 8, 2013 Page 24 Net Credit Costs - Components Three Months Ended March 31, December 31, September 30, June 30, March 31, December 31, September 30, June 30, March 31, 2013 2012 2012 2012 2012 2011 2011 2011 2011 (In thousands) Provision (negative provision) for credit losses on non-covered loans and leases - $ - $ (2,000) $ - $ (10,000) $ - $ - $ 5,500 $ 7,800 $ Non-covered OREO expense, net 313 316 1,883 130 1,821 1,714 2,293 2,300 703 Total non-covered net credit costs 313 316 (117) 130 (8,179) 1,714 2,293 7,800 8,503 $ Provision (negative provision) for credit losses on covered loans 3,137 (4,333) (141) (271) 3,926 4,122 348 5,890 2,910 Covered OREO expense (income), net (813) (461) 4,290 2,130 822 226 4,813 1,205 (2,578) 2,324 (4,794) 4,149 1,859 4,748 4,348 5,161 7,095 332 Less: FDIC loss sharing (income) expense, net, excluding FDIC share of OTTI loss 3,137 6,022 367 994 3,579 (2,667) (963) (5,316) 1,170 Total covered net credit costs 5,461 1,228 4,516 2,853 8,327 1,681 4,198 1,779 1,502 Total net credit costs 5,774 $ 1,544 $ 4,399 $ 2,983 $ 148 $ 3,395 $ 6,491 $ 9,579 $ 10,005 $ |

|
|
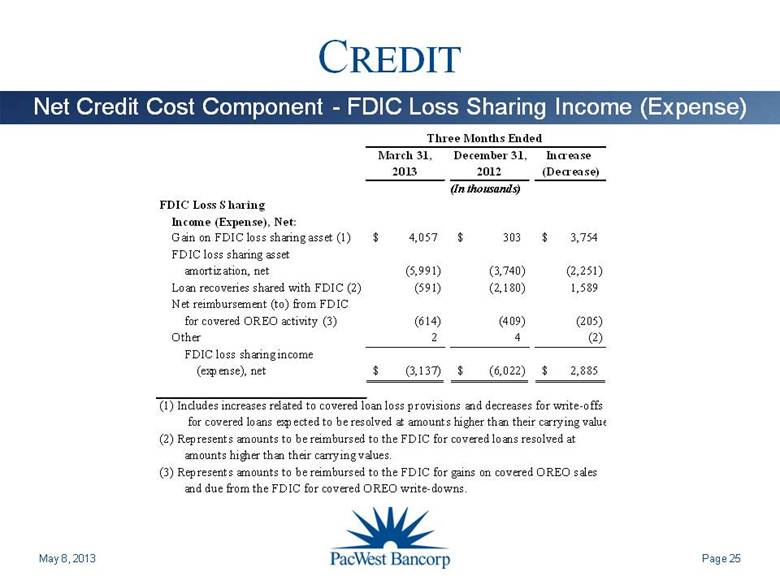
CREDIT May 8, 2013 Page 25 Net Credit Cost Component - FDIC Loss Sharing Income (Expense) Three Months Ended March 31, December 31, Increase 2013 2012 (Decrease) (In thousands) FDIC Loss Sharing Income (Expense), Net: Gain on FDIC loss sharing asset (1) 4,057 $ 303 $ 3,754 $ FDIC loss sharing asset amortization, net (5,991) (3,740) (2,251) Loan recoveries shared with FDIC (2) (591) (2,180) 1,589 Net reimbursement (to) from FDIC for covered OREO activity (3) (614) (409) (205) Other 2 4 (2) FDIC loss sharing income (expense), net (3,137) $ (6,022) $ 2,885 $ (1) Includes increases related to covered loan loss provisions and decreases for write-offs for covered loans expected to be resolved at amounts higher than their carrying value. (2) Represents amounts to be reimbursed to the FDIC for covered loans resolved at amounts higher than their carrying values. (3) Represents amounts to be reimbursed to the FDIC for gains on covered OREO sales and due from the FDIC for covered OREO write-downs. |
|
|
CREDIT May 8, 2013 Page 26 Loan Portfolio Concentrations Excludes leases in process of $4.1 million. March 31, 2013 Total Loans Non-Covered Loans and Leases and Leases Covered Loans % of % of % of Amount Total Amount Total Amount Total (Dollars in thousands) Real estate mortgage: Hospitality 173,676 $ 5% 172,472 $ 6% 1,204 $ - SBA 504 55,403 2% 55,403 2% - - Other 2,097,837 59% 1,568,609 53% 529,228 95% Total real estate mortgage 2,326,916 66% 1,796,484 61% 530,432 95% Real estate construction: Residential 46,122 1% 43,073 1% 3,049 1% Commercial 92,934 3% 83,634 3% 9,300 2% Total real estate construction 139,056 4% 126,707 4% 12,349 3% Total real estate loans 2,465,972 70% 1,923,191 65% 542,781 98% Commercial: Collateralized 444,207 13% 432,652 14% 11,555 2% Unsecured 78,964 2% 78,428 3% 536 - Asset-based 258,264 7% 258,264 8% - - SBA 7(a) 25,075 1% 25,075 1% - - Total commercial 806,510 23% 794,419 26% 12,091 2% Leases (1) 204,766 6% 204,766 7% - - Consumer 19,221 1% 18,677 1% 544 - Foreign 17,268 - 17,268 1% - - Total gross loans and leases 3,513,737 $ 100% 2,958,321 100% 555,416 100% Less: Unearned income (1,424) - Discount - (43,050) Allowance for loan and lease losses (65,216) (29,303) Total net loans and leases 2,891,681 $ 483,063 $ |

|
|
CREDIT May 8, 2013 Page 27 Non-Covered Real Estate Mortgage Exposure March 31, 2013 December 31, 2012 % of % of Loan Category Amount Total Amount Total (Dollars in thousands) Commercial real estate mortgage: Industrial/warehouse $ 286,911 16.0% $ 315,096 16.4% Retail 228,665 12.7% 271,412 14.2% Office buildings 290,399 16.2% 304,096 15.9% Owner-occupied 179,827 10.0% 195,170 10.2% Hotel 172,472 9.6% 181,144 9.4% Healthcare 108,693 6.1% 102,816 5.4% Mixed use 50,243 2.8% 51,294 2.7% Gas station 28,558 1.6% 29,632 1.5% Self storage 32,662 1.8% 29,688 1.5% Restaurant 16,480 0.9% 16,755 0.9% Land acquisition/development 21,851 1.2% 21,922 1.1% Unimproved land 11,778 0.7% 13,173 0.7% Other 165,809 9.2% 172,273 9.0% Total commercial real estate mortgage 1,594,348 88.8% 1,704,471 88.9% Residential real estate mortgage: Multi-family 100,666 5.6% 103,742 5.4% Single family owner-occupied 40,014 2.2% 46,125 2.4% Single family nonowner-occupied 11,896 0.6% 12,789 0.7% HELOCs 49,560 2.8% 50,543 2.6% Total residential real estate mortgage 202,136 11.2% 213,199 11.1% Total gross non-covered real estate mortgage loans $ 1,796,484 100.0% $ 1,917,670 100.0% |

|
|
CREDIT May 8, 2013 Page 28 Covered Real Estate Loan Exposure March 31, 2013 December 31, 2012 % of % of Loan Category Amount Total Amount Total (Dollars in thousands) Commercial real estate mortgage: Industrial/warehouse $ 25,861 4.9% $ 26,205 4.7% Retail 93,201 17.6% 96,659 17.4% Office buildings 46,859 8.8% 53,674 9.7% Owner-occupied 17,232 3.3% 17,301 3.1% Hotel 1,204 0.2% 2,888 0.5% Healthcare 8,039 1.5% 8,568 1.5% Mixed use 2,907 0.5% 2,919 0.5% Gas station 5,121 1.0% 5,131 0.9% Self storage 49,895 9.4% 48,937 8.8% Restaurant 1,640 0.3% 1,686 0.3% Unimproved land 469 0.1% 493 0.1% Other 14,542 2.7% 14,141 2.6% Total commercial real estate mortgage 266,970 50.3% 278,602 50.1% Residential real estate mortgage: Multi-family 158,997 30.0% 169,601 30.6% Single family owner-occupied 76,636 14.4% 78,960 14.2% Single family nonowner-occupied 20,068 3.8% 20,309 3.7% Mixed use 2,460 0.5% 2,474 0.4% HELOCs 5,301 1.0% 5,275 1.0% Total residential real estate mortgage 263,462 49.7% 276,619 49.9% Total gross covered real estate mortgage loans $ 530,432 100.0% $ 555,221 100.0% |

|
|
CREDIT May 8, 2013 Page 29 Other Real Estate Owned March 31, 2013 December 31, 2012 Non-Covered Covered Non-Covered Covered Property Type OREO OREO OREO OREO (In thousands) Commercial real estate 791 $ 7,292 $ 1,684 $ 11,635 $ Construction and land development 31,670 6,475 31,888 6,708 Multi-family - 3,301 - 4,239 Single family residences 3,500 243 - 260 Total OREO 35,961 $ 17,311 $ 33,572 $ 22,842 $ |

|
|
NET INTEREST MARGIN May 8, 2013 Page 30 Strong Net Interest Margin Versus Peers Source: Company Filings and SNL Data Source Peers: NYSE, AMEX, NASDAQ Banks with $5B to $10B in assets as of 3/31/2013 6.67% 6.34% 5.30% 4.79% 5.02% 5.26% 5.52% 5.40% 3.77% 3.62% 3.71% 3.63% 3.88% 3.86% 3.77% 3.64% 2006 2007 2008 2009 2010 2011 2012 1Q13 PACW Peers |

|
|
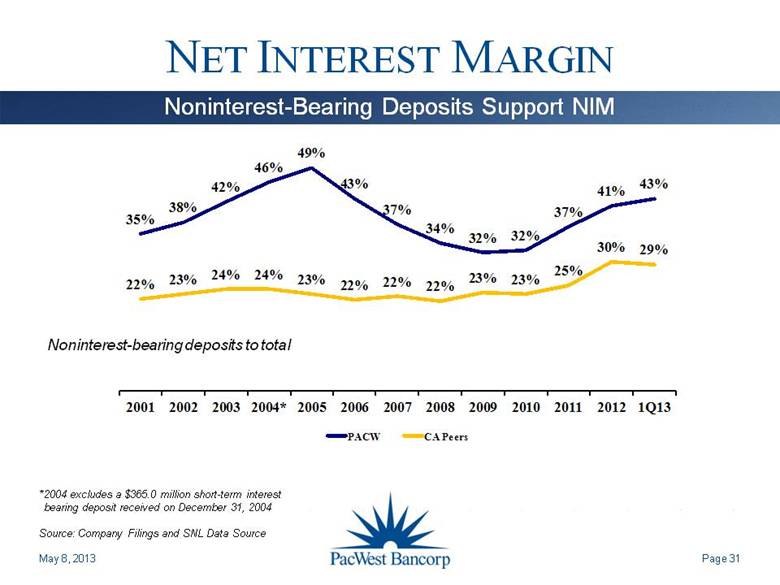
NET INTEREST MARGIN May 8, 2013 Page 31 Noninterest-Bearing Deposits Support NIM * 2004 excludes a $365.0 million short-term interest bearing deposit received on December 31, 2004 Source: Company Filings and SNL Data Source Noninterest-bearing deposits to total 35% 38% 42% 46% 49% 43% 37% 34% 32% 32% 37% 41% 43% 22% 23% 24% 24% 23% 22% 22% 22% 23% 23% 25% 30% 29% 2001 2002 2003 2004* 2005 2006 2007 2008 2009 2010 2011 2012 1Q13 PACW CA Peers |
|
|
NET INTEREST MARGIN May 8, 2013 Page 32 Volatile Items Impact the NIM Three Months Ended March 31, December 31, Items Impacting NIM Volatility 2013 2012 Increase (Decrease) in NIM Accelerated accretion of acquisition discounts resulting from covered loan payoffs 0.04% 0.13% Nonaccrual loan interest 0.01% 0.01% Unearned income on the early repayment of leases 0.08% 0.03% Celtic loan portfolio premium amortization (0.01)% (0.01)% Total 0.12% 0.16% Reported NIM 5.40% 5.49% |

|
|
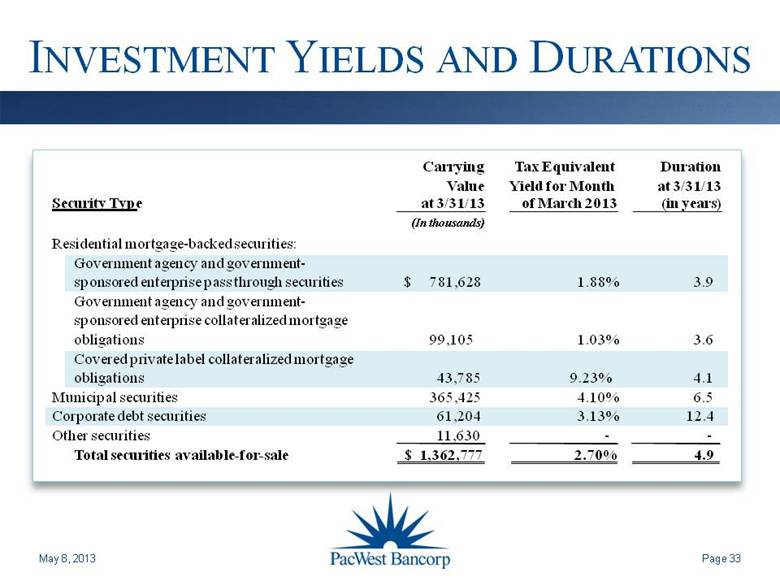
INVESTMENT YIELDS AND DURATIONS May 8, 2013 Page 33 781,628 $ 99,105 43,785 365,425 61,204 11,630 1,362,777 $ Carrying Value at 3/31/13 (In thousands) 1.88% 1.03% 9.23% 4.10% 3.13% - 2.70% Tax Equivalent Yield for Month of March 2013 3.9 3.6 4.1 6.5 12.4 - 4.9 Duration at 3/31/13 (in years) Security Type Residential mortgage-backed securities: Government agency and government-sponsored enterprise pass through securities Government agency and government-sponsored enterprise collateralized mortgage obligations Municipal securities Corporate debt securities Other securities Total securities available-for-sale |
|
|
Efficiency Ratios Average Branch Size ($-M) EXPENSE CONTROL May 8, 2013 Page 34 Focus and Execution Drive Efficiency * The 2008 efficiency ratio excludes the goodwill write-off. When the goodwill write-off is included in non-interest expense, the efficiency ratio is 371.7%. ** Adjusted efficiency ratio – see Non-GAAP Measurements slide Source: Company Filings and SNL Data Source Efficiency Ratios Average Branch Size ($ - M) 66% 55% 57% 50% 47% 48% 59% 56% 65% 61% 58% 62% 2002 2003 2004 2005 2006 2007 2008* 2009 2010 2011 2012** 1Q13** |

|
|
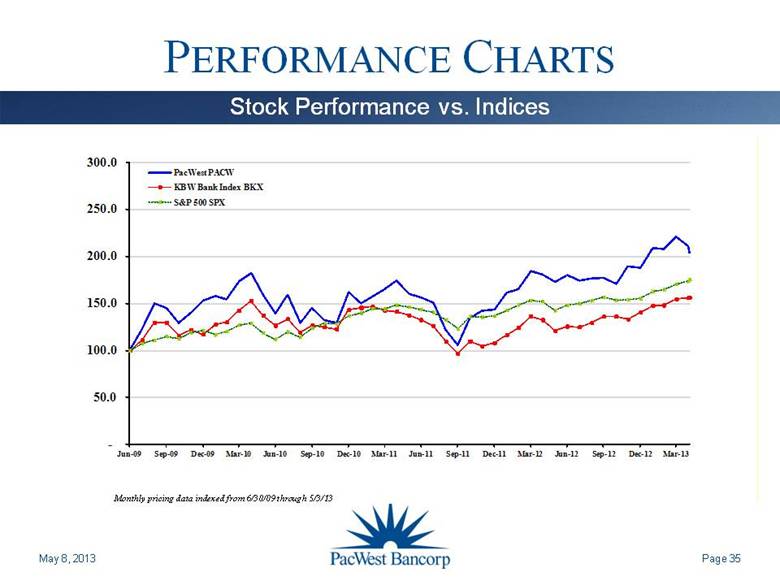
PERFORMANCE CHARTS May 8, 2013 Page 35 Stock Performance vs. Indices Monthly pricing data indexed from 6/30/09 through 5/3/13 - 50.0 100.0 150.0 200.0 250.0 300.0 Jun - 09 Sep - 09 Dec - 09 Mar - 10 Jun - 10 Sep - 10 Dec - 10 Mar - 11 Jun - 11 Sep - 11 Dec - 11 Mar - 12 Jun - 12 Sep - 12 Dec - 12 Mar - 13 PacWest PACW KBW Bank Index BKX S&P 500 SPX |
|
|
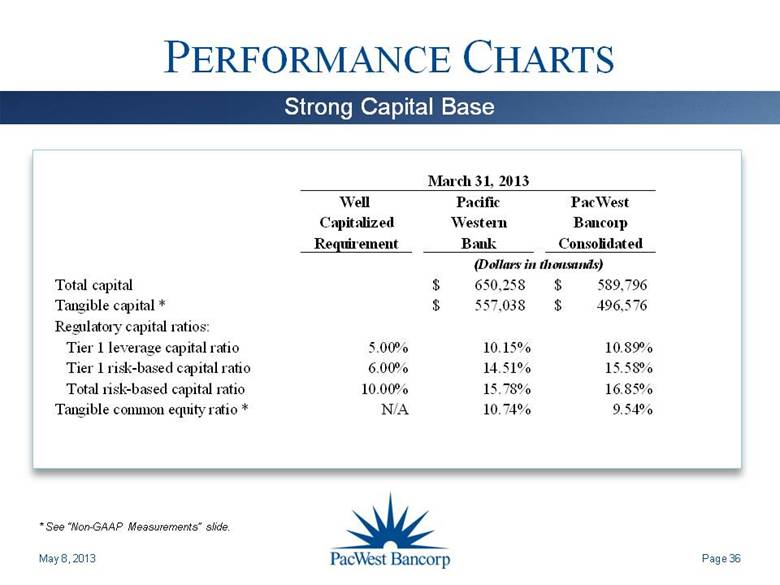
PERFORMANCE CHARTS May 8, 2013 Page 36 Strong Capital Base * See “Non-GAAP Measurements” slide. March 31, 2013 Well Pacific PacWest Capitalized Western Bancorp Requirement Bank Consolidated (Dollars in thousands) Total capital 650,258 $ 589,796 $ Tangible capital * 557,038 $ 496,576 $ Regulatory capital ratios: Tier 1 leverage capital ratio 5.00% 10.15% 10.89% Tier 1 risk-based capital ratio 6.00% 14.51% 15.58% Total risk-based capital ratio 10.00% 15.78% 16.85% Tangible common equity ratio * N/A 10.74% 9.54% |
|
|
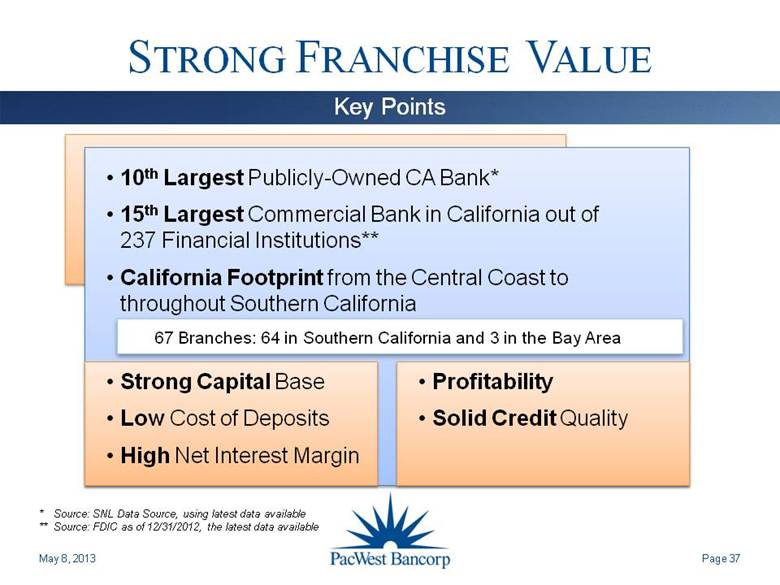
STRONG FRANCHISE VALUE 10th Largest Publicly-Owned CA Bank* 15th Largest Commercial Bank in California out of 237 Financial Institutions** California Footprint from the Central Coast to throughout Southern California 67 Branches: 64 in Southern California and 3 in the Bay Area May 8, 2013 Page 37 Key Points * Source: SNL Data Source, using latest data available ** Source: FDIC as of 12/31/2012, the latest data available Strong Capital Base Low Cost of Deposits High Net Interest Margin Profitability Solid Credit Quality |
|
|
STRONG FRANCHISE VALUE May 8, 2013 Page 38 Attractive Southern California Footprint |

|
|
STRONG FRANCHISE VALUE May 8, 2013 Page 39 California Public Banks & Thrifts – 3/31/2013 Source: SNL Continued on next slide Company Name Ticker Assets 1 Wells Fargo & Company WFC $1,436,634,000 2 First Republic Bank FRC 35,082,904 3 City National Corporation CYN 27,433,754 4 East West Bancorp, Inc. EWBC 23,101,955 5 SVB Financial Group SIVB 22,796,000 6 Cathay General Bancorp CATY 10,520,715 7 CapitalSource Inc. CSE 8,482,677 8 CVB Financial Corp. CVBF 6,265,767 9 BBCN Bancorp, Inc. BBCN 5,838,635 10 PacWest Bancorp PACW $5,299,905 11 Farmers & Merchants Bank of Long Beach FMBL 5,071,408 12 Westamerica Bancorporation WABC 4,887,844 13 Mechanics Bank MCHB 3,182,474 14 Community Bank CYHT 3,074,949 15 Hanmi Financial Corporation HAFC 2,792,423 16 Wilshire Bancorp, Inc. WIBC 2,756,420 17 TriCo Bancshares TCBK 2,612,433 18 Farmers & Merchants Bancorp FMCB 1,974,686 19 First California Financial Group, Inc. FCAL 1,887,843 20 Exchange Bank EXSR 1,692,472 21 Preferred Bank PFBC 1,587,730 22 Bank of Marin Bancorp BMRC 1,427,022 23 Pacific Premier Bancorp, Inc. PPBI 1,406,655 24 Sierra Bancorp BSRR 1,386,362 25 Heritage Commerce Corp HTBK 1,383,564 26 Bridge Capital Holdings BBNK 1,347,141 27 American Business Bank AMBZ 1,308,111 28 CU Bancorp CUNB 1,264,976 29 Heritage Oaks Bancorp HEOP 1,064,684 30 Pacific Mercantile Bancorp PMBC 1,053,941 |

|
|
STRONG FRANCHISE VALUE May 8, 2013 Page 40 California Public Banks & Thrifts, continued – 3/31/2013 Source: SNL Company Ticker Assets 31 Bank of Commerce Holdings BOCH 978,515 32 North Valley Bancorp NOVB 910,734 33 FNB Bancorp FNBG 897,478 34 Central Valley Community Bancorp CVCY 886,369 35 First Northern Community Bancorp FNRN 852,600 36 Private Bank of California PBCA 712,410 37 1st Enterprise Bank FENB 701,784 38 Oak Valley Bancorp OVLY 648,418 39 United Security Bancshares UBFO 636,548 40 Sunwest Bank SWBC 627,173 41 Pacific City Financial Corporation PFCF 610,840 42 Saehan Bancorp SAEB 602,520 43 California Republic Bancorp CRPB 591,053 44 American River Bankshares AMRB 587,261 45 RBB Bancorp RBBO 576,484 46 Premier Valley Bank PVLY 549,377 47 Community West Bancshares CWBC 533,123 48 Commonwealth Business Bank CWBB 500,992 49 1st Century Bancshares, Inc. FCTY 499,173 50 Security California Bancorp SCAF 495,543 51 Plumas Bancorp PLBC 477,981 52 Manhattan Bancorp MNHN 465,387 53 Greater Sacramento Bancorp GSCB 464,268 54 Summit State Bank SSBI 438,266 55 Plaza Bank PLZB 438,028 56 Mission Community Bancorp MISN 435,207 57 Avidbank Holdings, Inc AVBH 417,242 58 Presidio Bank PDOB 383,241 59 NCAL Bancorp NCAL 378,180 60 Santa Cruz County Bank SCZC 366,909 |

|
|
NON-GAAP MEASUREMENTS The Company uses certain non-GAAP financial measures to provide meaningful supplemental information regarding the Company’s operational performance and to enhance investors’ overall understanding of such financial performance. These non-GAAP financial measures are presented for supplemental informational purposes only for understanding the Company’s operating results and should not be considered a substitute for financial information presented in accordance with GAAP. These non-GAAP financial measures presented by the Company may be different from non-GAAP financial measures used by other companies. The table on the following slide presents a reconciliation of the non-GAAP financial measurements to the GAAP financial measurements and certain key performance ratios. May 8, 2013 Page 41 Overview |

|
|
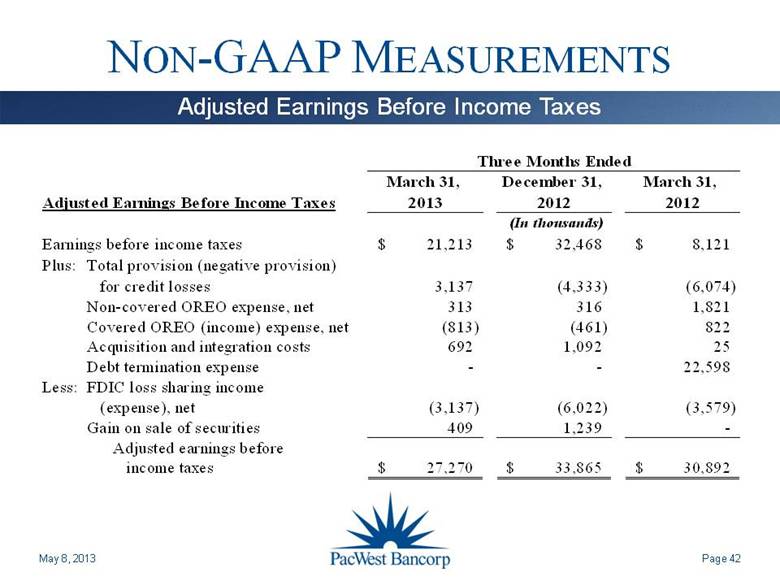
NON-GAAP MEASUREMENTS May 8, 2013 Page 42 Adjusted Earnings Before Income Taxes March 31, December 31, March 31, Adjusted Earnings Before Income Taxes 2013 2012 2012 (In thousands) Earnings before income taxes 21,213 $ 32,468 $ 8,121 $ Plus: Total provision (negative provision) for credit losses 3,137 (4,333) (6,074) Non-covered OREO expense, net 313 316 1,821 Covered OREO (income) expense, net (813) (461) 822 Acquisition and integration costs 692 1,092 25 Debt termination expense - - 22,598 Less: FDIC loss sharing income (expense), net (3,137) (6,022) (3,579) Gain on sale of securities 409 1,239 - Adjusted earnings before income taxes 27,270 $ 33,865 $ 30,892 $ Three Months Ended |
|
|
NON-GAAP MEASUREMENTS May 8, 2013 Page 43 Tangible Equity Calculated as tangible common equity divided by tangible assets. Calculated as tangible common equity divided by shares outstanding. March 31, December 31, March 31, Return on Average Tangible Equity 2013 2012 2012 (Dollars in thousands) PacWest Bancorp Consolidated: Net earnings 13,494 $ 19,892 $ 5,264 $ Average stockholders' equity 589,207 $ 585,525 $ 552,786 $ Less: Average intangible assets 93,786 94,604 73,983 Average tangible common equity 495,421 $ 490,921 $ 478,803 $ Annualized return on average equity 9.29% 13.51% 3.83% Annualized return on average tangible equity 11.05% 16.12% 4.42% Three Months Ended March 31, December 31, Tangible Common Equity 2013 2012 (Dollars in thousands) PacWest Bancorp Consolidated: Stockholders' equity $ 589,796 $ 589,121 Less: Intangible assets 93,220 94,589 Tangible common equity $ 496,576 $ 494,532 Total assets $ 5,299,905 $ 5,463,658 Less: Intangible assets 93,220 94,589 Tangible assets $ 5,206,685 $ 5,369,069 Equity to assets ratio 11.13% 10.78% Tangible common equity ratio (1) 9.54% 9.21% Book value per share $ 15.91 $ 15.74 Tangible book value per share (2) $ 13.40 $ 13.22 Shares outstanding 37,071,357 37,420,909 Pacific Western Bank: Stockholders' equity $ 650,258 $ 649,656 Less: Intangible assets 93,220 94,589 Tangible common equity $ 557,038 $ 555,067 Total assets $ 5,278,470 $ 5,443,484 Less: Intangible assets 93,220 94,589 Tangible assets $ 5,185,250 $ 5,348,895 Equity to assets ratio 12.32% 11.93% Tangible common equity ratio (1) 10.74% 10.38% (1) (2) |

|
|
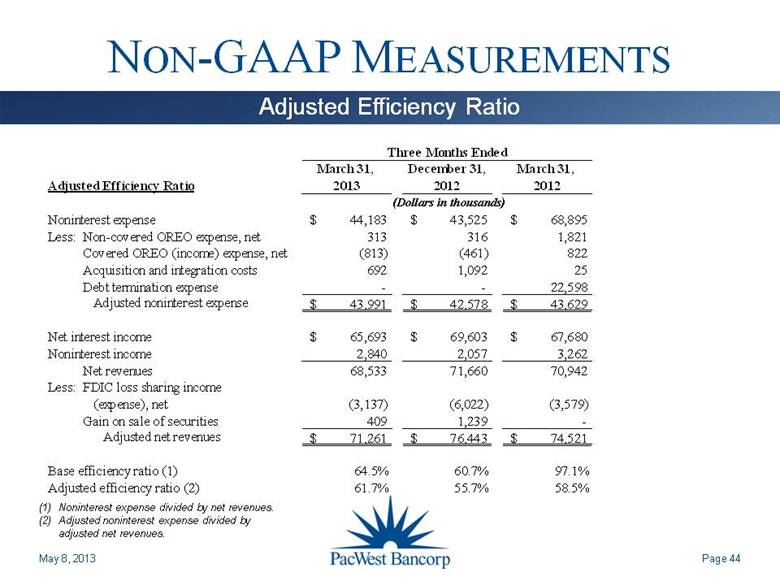
NON-GAAP MEASUREMENTS May 8, 2013 Page 44 Adjusted Efficiency Ratio Noninterest expense divided by net revenues. Adjusted noninterest expense divided by adjusted net revenues. March 31, December 31, March 31, Adjusted Efficiency Ratio 2013 2012 2012 (Dollars in thousands) Noninterest expense $ 44,183 $ 43,525 $ 68,895 Less: Non-covered OREO expense, net 313 316 1,821 Covered OREO (income) expense, net (813) (461) 822 Acquisition and integration costs 692 1,092 25 Debt termination expense - - 22,598 Adjusted noninterest expense $ 43,991 $ 42,578 $ 43,629 Net interest income $ 65,693 $ 69,603 $ 67,680 Noninterest income 2,840 2,057 3,262 Net revenues 68,533 71,660 70,942 Less: FDIC loss sharing income (expense), net (3,137) (6,022) (3,579) Gain on sale of securities 409 1,239 - Adjusted net revenues $ 71,261 $ 76,443 $ 74,521 Base efficiency ratio (1) 64.5% 60.7% 97.1% Adjusted efficiency ratio (2) 61.7% 55.7% 58.5% Three Months Ended (1) (2) |
|
|
10250 Constellation Boulevard, Suite 1640 Los Angeles, California 90067 Matt Wagner, CEO Vic Santoro, CFO (310) 728-1020 (310) 728-1021 |
