Attached files
| file | filename |
|---|---|
| 8-K - FORM 8-K - FMC CORP | fmc050720138k.htm |

FMC Corporation May Investor Conferences Paul Graves Executive Vice President and Chief Financial Officer May, 2013

Safe Harbor Statement Safe Harbor Statement • These slides and the accompanying presentation contain “forward-looking statements” that represent management’s best judgment as of the date hereof based on information currently available. Actual results of the Company may differ materially from those contained in the forward-looking statements. • Additional information concerning factors that may cause results to differ materially from those in the forward-looking statements is contained in the Company’s periodic reports filed under the Securities Exchange Act of 1934, as amended. • The Company undertakes no obligation to update or revise these forward-looking statements to reflect new events or uncertainties. Non-GAAP Financial Terms • These slides contain certain “non-GAAP financial terms” which are defined on our website at www.fmc.com. In addition, we have also provided on our website at www.fmc.com reconciliations of non-GAAP terms to the closest GAAP term. Amounts in this presentation focus on Adjusted Earnings for all EBIT and EPS references. 2

FMC: Sustained Profitable Growth • Proven record of superior financial performance − 2012 revenue $3.7 billion and $738 million in EBIT • Business portfolio well positioned, with high margins and return on invested capital − Three strong core platforms − Low reliance on GDP cycles • Strong financial position: liquid balance sheet and substantial free cash flow • Track record of creating significant shareholder value 3 - 1.0 2.0 3.0 4.0 2009 2010 2011 2012 - 0.2 0.4 0.6 0.8 1.0 2009 2010 2011 2012 $2.08 $2.47 $2.99 $3.48 $4.00 $- $1.00 $2.00 $3.00 $4.00 $5.00 2009 2010 2011 2012 2013* - 0.5 1.0 1.5 2.0 2.5 3.0 0% 10% 20% 30% 2009 2010 2011 2012 ROIC Invested Capital Sales ($B) EBIT ($B) Adj. EPS ($/Diluted S/O) 12% CAGR 16% CAGR 2012 22.9% 19% CAGR *2013F EPS is based on midpoint of guidance range provided on May 1, 2013

Our Vision For FMC In 2015 4 P R E M I U M T S R P E R F O R M A N C E Strong cash generation with disciplined cash deployment Significantly greater earnings stability Sustained mid-teens or higher return on invested capital Sales of $5B+ and EBIT of $1.2B+

Realignment: Sharpening Our Focus • Vision 2015 set out long-term profitable growth goals − Generate premium returns − Invest in growth − Manage portfolio • Realignment of businesses − Simplifies portfolio − Creates focus on the core platforms where FMC has a sustainable competitive advantage • Exploring divestiture of Peroxygens − Profitable, strong business − Not linked to FMC’s long-term strategy 5

2012 FY Results* ($ millions) • Soda Ash • Lithium • Food • Pharmaceuticals • Nutraceuticals • Herbicides, Insecticides, Fungicides, Seed Treatment, Biologicals FMC Corporation • Peroxygens • Environmental Solutions *Unaudited financials under new reporting structure 6
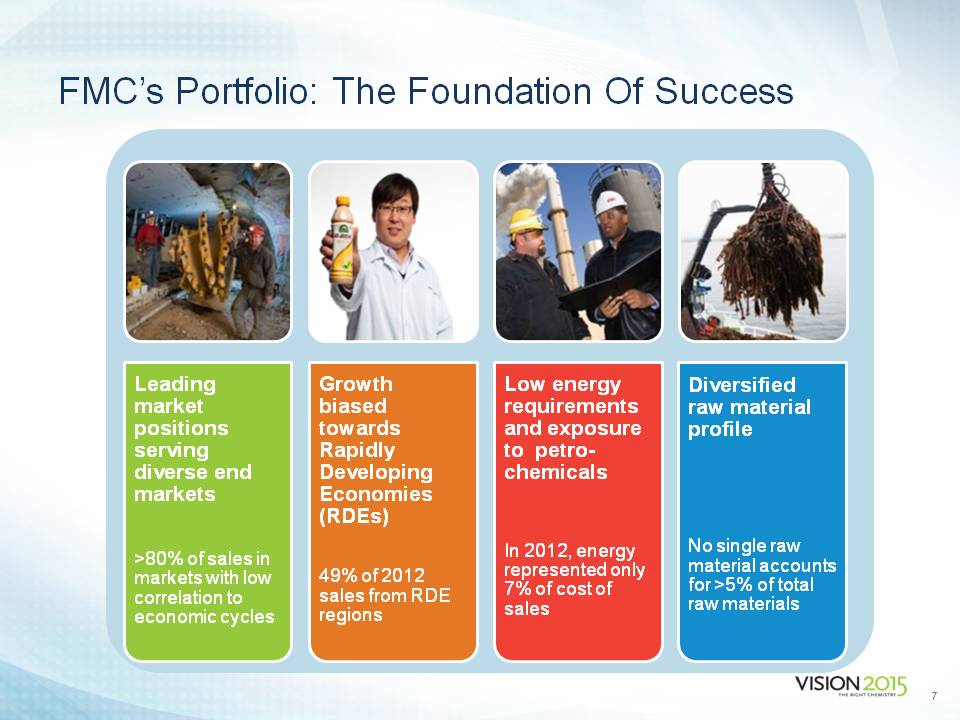
FMC’s Portfolio: The Foundation Of Success 7 7
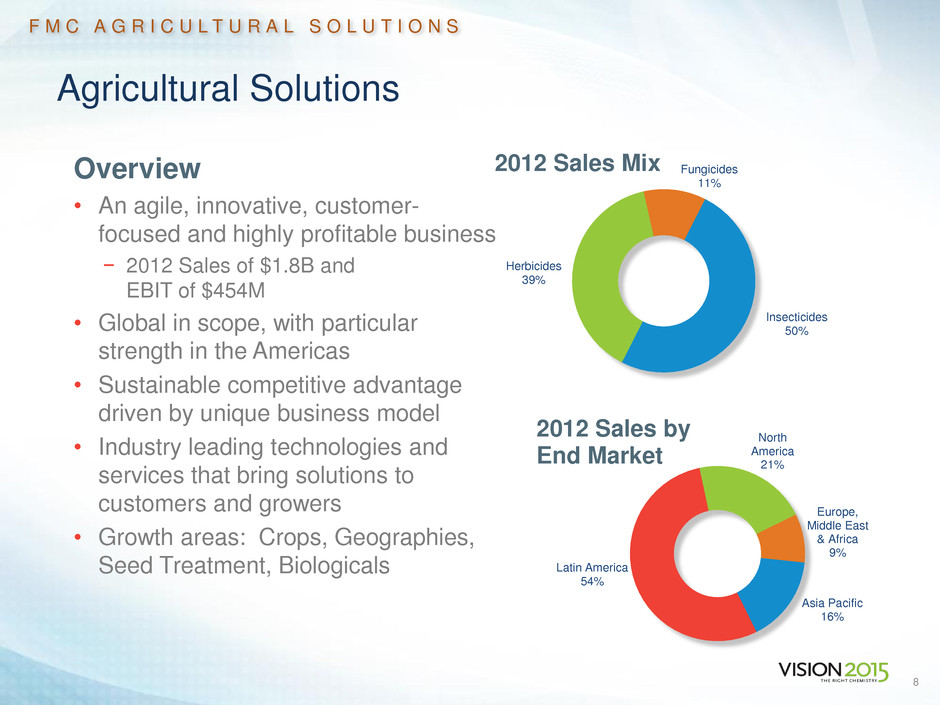
Agricultural Solutions Overview • An agile, innovative, customer- focused and highly profitable business − 2012 Sales of $1.8B and EBIT of $454M • Global in scope, with particular strength in the Americas • Sustainable competitive advantage driven by unique business model • Industry leading technologies and services that bring solutions to customers and growers • Growth areas: Crops, Geographies, Seed Treatment, Biologicals 8 F M C A G R I C U L T U R A L S O L U T I O N S Herbicides 39% Fungicides 11% Insecticides 50% 2012 Sales Mix North America 21% Europe, Middle East & Africa 9% Asia Pacific 16% Latin America 54% 2012 Sales by End Market

Key Elements of Our Unique Business Model 9 F M C A G R I C U L T U R A L S O L U T I O N S Low-cost, variable manufacturing network Active ingredient innovation driven by aggregating technologies Disciplined focus on niche crops and technically- advantaged products for row crops Decentralized R&D, with core competence in formulation, regulatory, and field trials Enabled by an agile, highly empowered, local organization Sustained Premium Margins and Growth

Delivering High Margins (1) 2012 Reported Adjusted Operating Margin (2) Data for DOW Ag. Sciences is EBITDA margin 10 0% 5% 10% 15% 20% 25% 10 Crop Protection Chemicals 2012 EBIT Margin F M C A G R I C U L T U R A L S O L U T I O N S (1) (2)
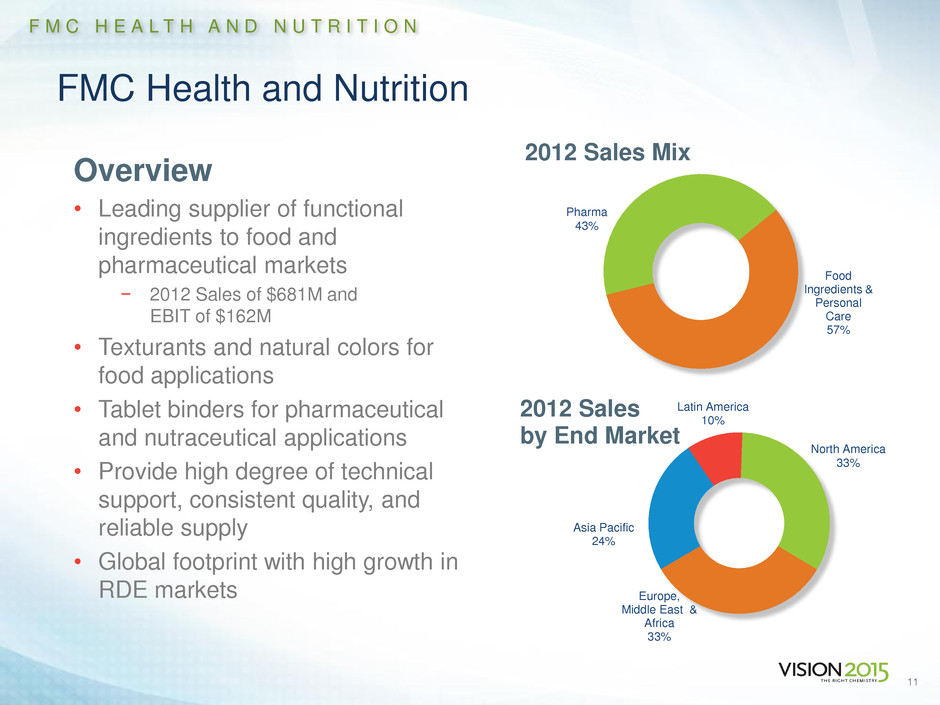
FMC Health and Nutrition Overview • Leading supplier of functional ingredients to food and pharmaceutical markets − 2012 Sales of $681M and EBIT of $162M • Texturants and natural colors for food applications • Tablet binders for pharmaceutical and nutraceutical applications • Provide high degree of technical support, consistent quality, and reliable supply • Global footprint with high growth in RDE markets 11 F M C H E A L T H A N D N U T R I T I O N Pharma 43% Food Ingredients & Personal Care 57% 2012 Sales Mix North America 33% Europe, Middle East & Africa 33% Asia Pacific 24% Latin America 10% 2012 Sales by End Market

FMC Health And Nutrition Product Line Common End Markets and Characteristics • Regulated or Semi-Regulated • Sizeable ($ billions) market segments with attractive growth rates − Food − Pharmaceuticals − Nutraceuticals − Personal Care • Branded products • High quality requirements, consistent standards • Processed Food • Pharma Rx, Gx and OTC • Multi-nationals, major regional players 12 Personal and Oral Care Food Texture and Structure Pet / Animal Nutrition Pharmaceuticals Nutraceuticals Natural Colors and Flavors F M C H E A L T H A N D N U T R I T I O N • Carrageenan • Alginate • Hyluronic Acid • Colloidal MCC • MCC • Alginates • Carrageenan • Pectin • Alginate • Carrageenan • Avicel MCC • Algicaps • Novamatrix • Aquacoat • Phytone and BioColor Natural Color Product lines • Protosea • Fucoidan • MaQBerry • Nutraesterol • Nutricol HN
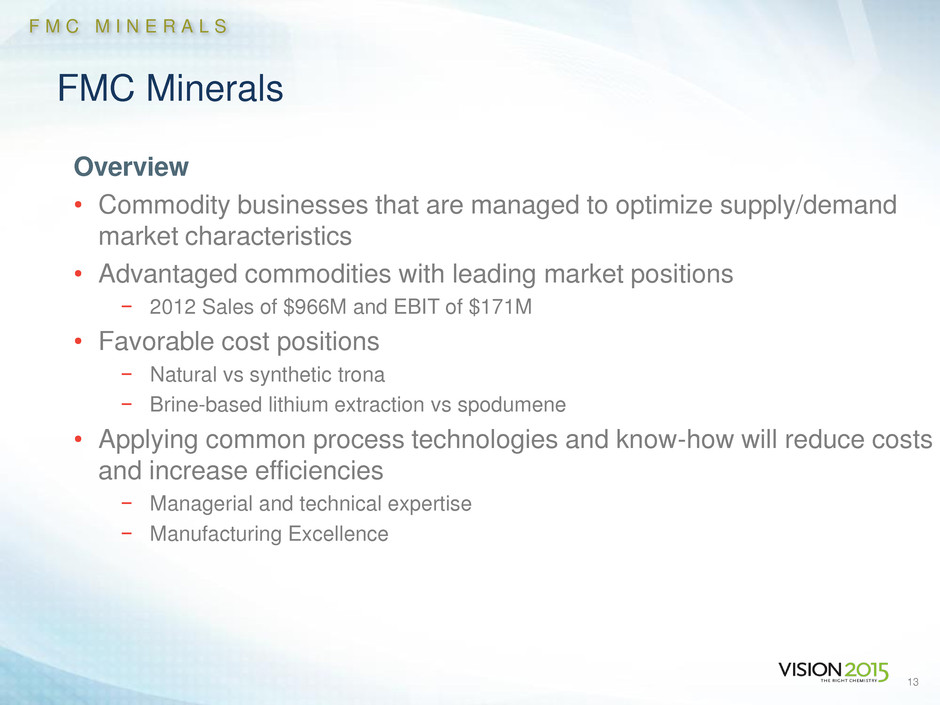
FMC Minerals Overview • Commodity businesses that are managed to optimize supply/demand market characteristics • Advantaged commodities with leading market positions − 2012 Sales of $966M and EBIT of $171M • Favorable cost positions − Natural vs synthetic trona − Brine-based lithium extraction vs spodumene • Applying common process technologies and know-how will reduce costs and increase efficiencies − Managerial and technical expertise − Manufacturing Excellence 13 F M C M I N E R A L S

Alkali Chemicals At A Glance Business Overview • Alkali Chemical Division produces natural soda ash used by manufacturers in glass, chemical processing and detergent industries • Operations include − Westvaco plant (Green River, WY) − World’s largest trona mine − World’s largest soda ash plant − FMC’s largest manufacturing operation • Granger plant (Granger, WY) − Strategic asset restarted in 2011 as solution-fed operation − Additional 700,000 ton expansion potential 14 Soda Ash Sodium Sesquicarbonate Sodium Bicarbonate Caustic Soda Milled Trona F M C M I N E R A L S Chemicals 30% Glass Containers 24% Flat Glass 18% Other 15% Detergents 8% Other Glass 5% 2012 Sales by End Market 2012 Sales Mix

Lithium At A Glance 15 Business Overview • #2 producer in world on a revenue basis • Market leader in key segments − #1 supplier of lithium hydroxide, lithium chloride, specialty lithium salts − A leader in downstream lithium metal products and organo-lithium compounds • Integrated operational footprint − 5 production sites worldwide − Only mine-to-metal producer in the world − R&D presence in the US, India, and China • Industry innovator − Unique brine process technology − Expertise in cathode development Others 73% FMC 27% 2012 Market Share Synthesis (Pharma) 18% Energy 29% Industrial 27% Polymer 26% 2012 Sales by End Market F M C M I N E R A L S

FMC Peroxygens Business Overview • Leading supplier of hydrogen peroxide, persulfates, peracetic acid, silicates • Strategic end market focus with attractive growth prospects − Oil & Gas − Environmental − Food Safety − Electronics − Industrial • Global operations located close to customers Current Status • Exploring divestiture • Process starting underway later this month • Resolution expected by end of year 16 F M C P E R O X Y G E N S

Delivering Robust EPS Growth 17 $2.08 $2.47 $2.99 $4.00 $- $1.00 $2.00 $3.00 $4.00 $5.00 $6.00 $7.00 2009A 2010A 2011A 2012A 2013* 2014 2015 $5.75 – $6.25 Adjusted EPS Trend $3.48 Expecting 2013 FY EPS $3.93 - $4.07 2012 – 2015F CAGR 18 – 22% 2009 – 2012 CAGR 19% *Based on midpoint of May 1, 2013 outlook statement
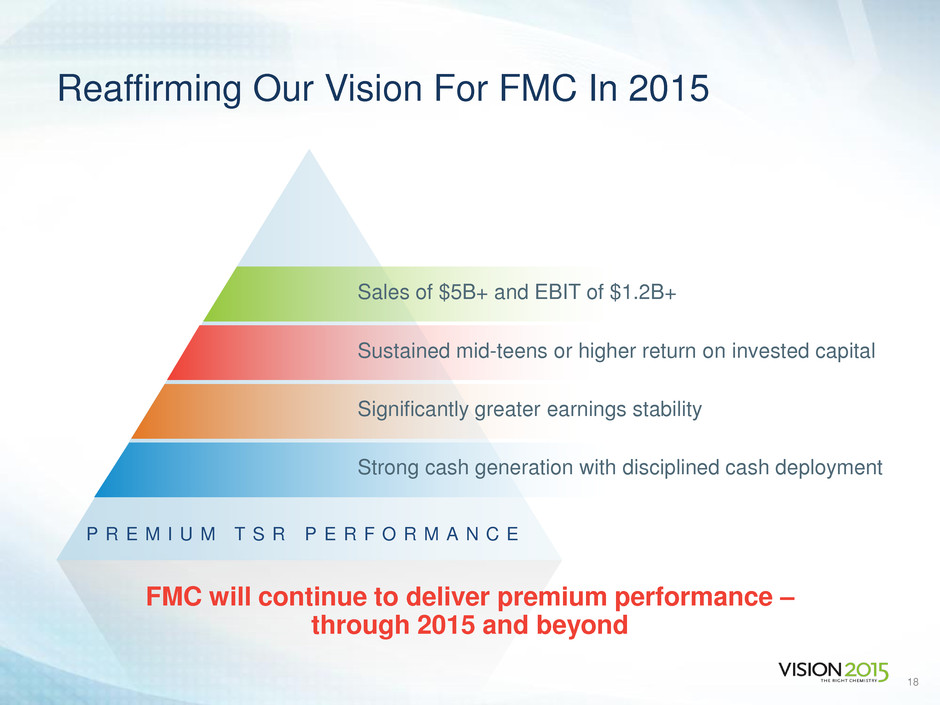
Reaffirming Our Vision For FMC In 2015 18 P R E M I U M T S R P E R F O R M A N C E Strong cash generation with disciplined cash deployment Significantly greater earnings stability Sustained mid-teens or higher return on invested capital Sales of $5B+ and EBIT of $1.2B+ FMC will continue to deliver premium performance – through 2015 and beyond

Glossary of Financial Terms & Reconciliations of GAAP to Non-GAAP 19

• These slides contain certain “non-GAAP financial terms” which are defined below. In addition, we have provided reconciliations of non- GAAP terms to the closest GAAP term in the appendix of this presentation • Adjusted Operating Profit (Adjusted earnings from continuing operations, before interest and income taxes) is the sum of Income (loss) from continuing operations before income taxes less Net income attributable to non-controlling interests, plus the sum of Corporate special (charges) income and Interest expense, net. Beginning in 2013, this amount will be reported before the reduction of non-controlling interests.(Also referred to as EBIT (Earnings Before Interest and Taxes)) • EBIT Margin is the quotient of EBIT (defined above) divided by Revenue Non-GAAP Financial Terms 20
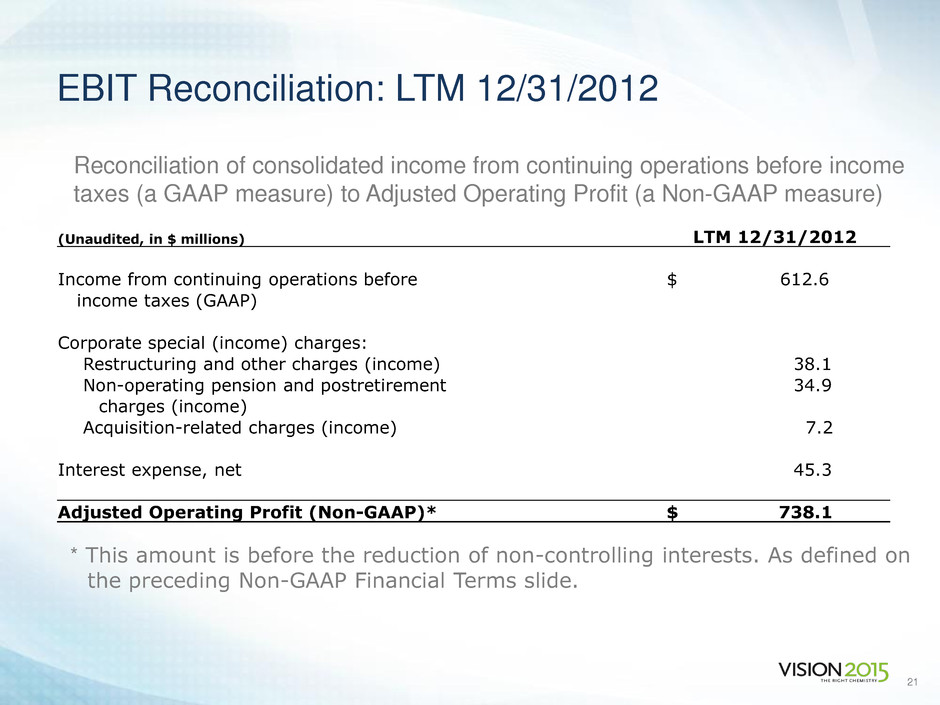
Reconciliation of consolidated income from continuing operations before income taxes (a GAAP measure) to Adjusted Operating Profit (a Non-GAAP measure) EBIT Reconciliation: LTM 12/31/2012 (Unaudited, in $ millions) LTM 12/31/2012 Income from continuing operations before $ 612.6 income taxes (GAAP) Corporate special (income) charges: Restructuring and other charges (income) 38.1 Non-operating pension and postretirement 34.9 charges (income) Acquisition-related charges (income) 7.2 Interest expense, net 45.3 Adjusted Operating Profit (Non-GAAP)* $ 738.1 * This amount is before the reduction of non-controlling interests. As defined on the preceding Non-GAAP Financial Terms slide. 21
