Attached files
| file | filename |
|---|---|
| EX-23.1 - EX-23.1 - CYAN INC | d439911dex231.htm |
Table of Contents
As filed with the Securities and Exchange Commission on May 6, 2013
Registration No. 333-187732
UNITED STATES
SECURITIES AND EXCHANGE COMMISSION
Washington, D.C. 20549
Amendment No. 3
to
FORM S-1
REGISTRATION STATEMENT
UNDER
THE SECURITIES ACT OF 1933
CYAN, INC.
(Exact name of registrant as specified in its charter)
| Delaware | 7373 | 20-5862569 | ||
| (State or other jurisdiction of incorporation or organization) | (Primary Standard Industrial Classification Code Number) | (I.R.S. Employer Identification Number) |
1383 N. McDowell Blvd., Suite 300
Petaluma, California 94954
(707) 735-2300
(Address, including zip code, and telephone number, including area code, of registrant’s principal executive offices)
Mark A. Floyd
Chief Executive Officer
1383 N. McDowell Blvd., Suite 300
Petaluma, California 94954
(707) 735-2300
(Name, address, including zip code, and telephone number, including area code, of agent for service)
Copies to:
| David J. Segre Robert G. Day Michael E. Coke Wilson Sonsini Goodrich & Rosati Professional Corporation 650 Page Mill Road Palo Alto, California 94304 (650) 493-9300 |
Kenneth M. Siegel Vice President and General Counsel Cyan, Inc. 1383 N. McDowell Blvd., Suite 300 Petaluma, California 94954 (707) 735-2300 |
Eric C. Jensen Andrew S. Williamson Cooley LLP 101 California Street, 5th Floor San Francisco, California 94111 (415) 693-2000 |
Approximate date of commencement of proposed sale to the public: As soon as practicable after this registration statement becomes effective.
If any of the securities being registered on this Form are to be offered on a delayed or continuous basis pursuant to Rule 415 under the Securities Act of 1933 check the following box: ¨
If this Form is filed to register additional securities for an offering pursuant to Rule 462(b) under the Securities Act, please check the following box and list the Securities Act registration statement number of the earlier effective registration statement for the same offering. ¨
If this Form is a post effective amendment filed pursuant to Rule 462(c) under the Securities Act, check the following box and list the Securities Act registration statement number of the earlier effective registration statement for the same offering. ¨
If this Form is a post effective amendment filed pursuant to Rule 462(d) under the Securities Act, check the following box and list the Securities Act registration statement number of the earlier effective registration statement for the same offering. ¨
| Large accelerated filer | ¨ | Accelerated filer | ¨ | |||
| Non-accelerated filer | x (do not check if a smaller reporting company) | Smaller reporting company | ¨ | |||
CALCULATION OF REGISTRATION FEE
|
|
||||||||||||||||
| Title of Each Class of Securities to be Registered |
Amount to be Registered(1) |
Proposed Maximum Offering Price Per Share |
Proposed Maximum Aggregate Offering Price(2) |
Amount of Registration Fee(3) |
||||||||||||
| Common Stock, par value $0.0001 per share |
9,200,000 | $ | 12.00 | $ | 110,400,000 | $ | 15,059 | |||||||||
|
|
||||||||||||||||
| (1) | Estimated pursuant to Rule 457(a) under the Securities Act of 1933, as amended. Includes an additional 1,200,000 shares that the underwriters have the option to purchase to cover over-allotments, if any. |
| (2) | Estimated solely for the purpose of calculating the registration fee. |
| (3) | Previously paid. |
The registrant hereby amends this registration statement on such date or dates as may be necessary to delay its effective date until the registrant shall file a further amendment which specifically states that this registration statement shall thereafter become effective in accordance with Section 8(a) of the Securities Act of 1933 or until the registration statement shall become effective on such date as the Securities and Exchange Commission, acting pursuant to said Section 8(a), may determine.
Table of Contents
The information in this preliminary prospectus is not complete and may be changed. We may not sell these securities until the registration statement filed with the Securities and Exchange Commission is effective. This preliminary prospectus is not an offer to sell these securities and it is not soliciting offers to buy these securities in any state where the offer or sale is not permitted.
PROSPECTUS (Subject to Completion)
Dated May 6, 2013
8,000,000 Shares

Common Stock
This is an initial public offering of shares of common stock of Cyan, Inc.
Prior to this offering, there has been no public market for the common stock. It is currently estimated that the initial public offering price per share will be between $10.00 and $12.00. Our common stock has been approved for listing on the New York Stock Exchange under the symbol “CYNI.”
We are an “emerging growth company” as defined under the federal securities laws and are subject to reduced public company reporting requirements.
Investing in our common stock involves risks. See the section titled “Risk Factors” on page 11 to read about factors you should consider before buying shares of our common stock.
Neither the Securities and Exchange Commission nor any other regulatory body has approved or disapproved of these securities or passed upon the accuracy or adequacy of this prospectus. Any representation to the contrary is a criminal offense.
| Per Share | Total | |||||||
| Initial public offering price |
$ | $ | ||||||
| Underwriting discount(1) |
$ | $ | ||||||
| Proceeds, before expenses, to Cyan |
$ | $ | ||||||
| (1) | See “Underwriting.” |
We have granted the underwriters an option to purchase up to an additional 1,200,000 shares from us at the initial public offering price, less the underwriting discount.
The underwriters expect to deliver the shares against payment in New York, New York on , 2013.
| Goldman, Sachs & Co. | J.P. Morgan | |
| Jefferies | ||
| Pacific Crest Securities | ||
Prospectus dated , 2013
Table of Contents

Table of Contents
| Page | ||||
| 1 | ||||
| 11 | ||||
| 36 | ||||
| 38 | ||||
| 39 | ||||
| 39 | ||||
| 40 | ||||
| 42 | ||||
| 44 | ||||
| Management’s Discussion and Analysis of Financial Condition and Results of Operations |
46 | |||
| 78 | ||||
| 99 | ||||
| 108 | ||||
| 118 | ||||
| 121 | ||||
| 124 | ||||
| 130 | ||||
| Material U.S. Federal Income Tax Consequences to Non-U.S. Holders |
134 | |||
| 138 | ||||
| 144 | ||||
| 144 | ||||
| 144 | ||||
| F-1 | ||||
Through and including , 2013 (the 25th day after the date of this prospectus), all dealers effecting transactions in these securities, whether or not participating in this offering, may be required to deliver a prospectus. This is in addition to a dealer’s obligation to deliver a prospectus when acting as an underwriter and with respect to an unsold allotment or subscription.
Neither we nor the underwriters have authorized anyone to provide you with information or to make any representations other than those contained in this prospectus or in any free writing prospectuses we have prepared. We take no responsibility for, and provide no assurance as to the reliability of, any other information that others may give you. This prospectus is an offer to sell only the shares offered hereby, but only under circumstances and in jurisdictions where it is lawful to do so. The information contained in this prospectus is current only as of its date.
For investors outside the United States: Neither we nor any of the underwriters have done anything that would permit this offering or possession or distribution of this prospectus in any jurisdiction where action for that purpose is required, other than in the United States. You are required to inform yourselves about, and to observe any restrictions relating to, this offering and the distribution of this prospectus.
i
Table of Contents
This summary highlights information contained elsewhere in this prospectus and does not contain all of the information that you should consider in making your investment decision. Before investing in our common stock, you should carefully read this entire prospectus, including the information set forth under the sections titled “Risk Factors” and “Management’s Discussion and Analysis of Financial Condition and Results of Operations” and our consolidated financial statements and related notes that are included elsewhere in this prospectus. Unless the context otherwise requires, we use the terms “Cyan,” “company,” “we,” “us” and “our” in this prospectus to refer to Cyan, Inc. and, where appropriate, our consolidated subsidiaries.
Company Overview
We have pioneered innovative, carrier-grade networking solutions that transform disparate and inefficient legacy networks into open, high-performance networks. Our solutions include high-capacity, multi-layer switching and transport platforms, as well as a carrier-grade software-defined networking platform and applications. Our solutions enable network operators to virtualize their networks, accelerate service delivery and increase scalability and performance, while reducing costs. We have designed our solutions to provide a variety of existing and emerging premium applications, including business Ethernet, wireless and broadband support services and cloud connectivity. By deploying our solutions, network operators can transform legacy networks into open, multi-vendor, carrier-grade software-defined networks, or SDNs. Our solutions not only reduce network operators’ ongoing capital and operating expenses, but also enable their networks to more flexibly support rapidly changing service requirements and new business models.
New applications and communications trends are driving tremendous growth in bandwidth demand, resulting in increased service requirements as well as dramatic shifts in overall network traffic patterns. At the same time, competition from traditional vendors as well as new market entrants is limiting service providers’ ability to sustain and grow revenue. As a result, service providers must upgrade their networks to handle the exponential scaling challenges driven by these trends as well as to profitably deliver the growing breadth of premium services demanded by their subscribers. Other network operators are also facing these scalability requirements while seeking to deliver new applications that improve the productivity and efficiency of their businesses. We designed our solutions to enable network operators to address these challenges while scaling their networks and services efficiently.
Fundamental to our solution is our software-defined networking approach that enables an array of Cyan as well as third-party applications to manage and control underlying network infrastructure. In December 2012, we released our Blue Planet platform, a carrier-grade software-defined networking solution purpose-built to address network operator requirements. Blue Planet is the latest implementation of our network virtualization and management software that we first introduced in 2009 to work in combination with our high-capacity, multi-layer switching and transport platforms. Blue Planet is designed to simplify the development, deployment and orchestration of scalable communications and business applications over high-performance networks. Blue Planet enables our customers to make more efficient use of existing network assets, cost-effectively expand network capacity and significantly accelerate the delivery of premium, revenue-generating services to their customers. By deploying Blue Planet, our customers can also provide their end-customers with network-as-a-service, or NaaS, allowing for real-time tailoring and customization of their network architecture and services to meet their end-customers’ specific needs.
1
Table of Contents
We also offer high-capacity, multi-layer switching and transport platforms, known as our Cyan Z-Series, that have been designed to support the multiple concurrent technologies used in regional and metro networks including both Ethernet-based services as well as optical services. Our Z-Series platforms have been designed to transport traffic over the most efficient network layer, utilizing both electrical and optical domains, to enable network operators to maximize network capacity at the lowest cost per bit. To date, sales of our Z-Series platforms have accounted for substantially all of our revenue. Standalone sales of Blue Planet have accounted for an immaterial amount of our revenue to date and are expected to increase only modestly as a portion of our revenue in the near term. However, we expect that the portion of our revenue derived from standalone sales of Blue Planet will increase over the longer term.
Our customers range from service providers to high-performance data center and large, private network operators. Our solutions have been deployed primarily across North America as well as in Asia and Europe by over 130 customers, including our top ten customers by revenue in 2012, DukeNet Communications, LLC, Great Plains Communications Inc., Intelleq Communications LLC, Lynx Network Group, Inc., TDS Telecommunications Corporation, US Carrier Telecom, LLC, US Signal Company, LLC, Vision Net, Inc., Windstream Corporation and Zayo Group, LLC.
Our revenue increased from $23.5 million in the year ended December 31, 2010 to $40.4 million in the year ended December 31, 2011, and to $95.9 million in the year ended December 31, 2012, and from $14.2 million in the three months ended March 31, 2012 to $26.3 million in the three months ended March 31, 2013. Our net losses were $16.3 million, $15.9 million and $16.6 million in the years ended December 31, 2010, 2011 and 2012, respectively, and $3.9 million and $9.4 million in the three months ended March 31, 2012 and 2013, respectively.
Industry Background
Network operators, which include service providers as well as others with similar network requirements, are facing immense pressure on their existing networks and business models. Despite growing demand for bandwidth and expanded service offerings, service provider revenue has remained relatively flat, mainly due to competitive pressures. Accordingly, service providers are increasingly challenged to provide their services in a cost-effective manner, and to deliver new services that drive additional revenue streams. In addition, the service provider business model is changing from one of deploying fixed bandwidth to one of dynamically provisioning services. However, due to the proprietary and inflexible nature of existing networks and infrastructure, dynamically provisioning services and managing these networks and infrastructure have become cost-prohibitive. This is especially true in regional and metro networks, which typically utilize legacy network architectures that have been built over decades. Network operators have also historically used a variety of technologies to deliver reliable service at scale, which has added to the complex and disparate nature of these legacy regional and metro networks.
Today’s networks require dramatic transformation to meet the service demands driven by significant technology shifts, including the proliferation of mobile devices, the rapid adoption of bandwidth-intensive applications and the growth in cloud computing. Additionally, network operators are now seeking to offer new premium services such as business Ethernet, cloud connectivity, wireless and broadband backhaul, which use wireless and broadband communications systems, respectively, to transmit data across the network from an end-user to a large proprietary network or the Internet, wholesale transport, and private networks with guaranteed service levels as opposed to traditional best-efforts service delivery models. As a result, network operators are being forced to upgrade their networks to profitably deliver these premium services as well as to handle the increased demands of their end-customers, which include higher throughput and utilization, better performance and increased provisioning speed.
2
Table of Contents
To address these pressures, network operators have increasingly looked to deploy Ethernet-based technologies. Ethernet now supports high-bandwidth, carrier-grade environments with enhanced granularity at a significantly lower price per bit than traditional technologies. As a result, network operators are expected to shift more of their capital budgets towards purchasing Ethernet-based solutions.
We believe that legacy approaches to designing regional and metro networks are inadequate to effectively handle next-generation service demands. These legacy approaches, which include adding dedicated networks, deploying router-based products and modifying existing operations support systems, suffer from multiple challenges, including limitations on scalability, performance, flexibility and the ability to provision new services efficiently and cost-effectively. As a result, we believe that network operators require a new approach to drive network transformation.
As part of this new approach to network transformation, network operators are seeking an open architecture that is conducive to deploying multi-vendor, best-of-breed networks and to supporting future innovations while enhancing network efficiency and performance. Moreover, to remain competitive, network operators need to evolve their networks to support higher-bandwidth requirements, introduce new revenue-generating, premium services, and manage network traffic at the optimal layer in a low-latency, cost-optimized way using either the optical or Ethernet layers. To achieve this network transformation, we believe that network operators require new approaches to both their software and infrastructure.
We believe that network operators would be able to achieve this network architecture transformation with spending typically earmarked for products and markets including: Ethernet services edge routing, which routes traffic on the edge of the network without accessing routers at the network’s core; access aggregation, which aggregates traffic on the edge of the network; metro WDM, or wave-division multiplexing, which allows a single optical fiber to carry multiple optical signals on separate wavelengths; multi-service provisioning platforms, which interconnects with legacy optical equipment and Ethernet local area networks; and packet-optical equipment, which enables the transport of packets on optical network infrastructure. According to ACG Research, markets for these products were forecasted to collectively represent approximately $15.7 billion in worldwide revenue in 2012. We believe that our solutions address a substantial portion of these aggregated markets. In addition, our solutions also address a portion of the operational support systems, or OSS, market, which is not included in the ACG Research forecast above.
Our Solution
Our solutions include high-capacity, multi-layer switching and transport platforms, as well as a carrier-grade software-defined networking platform and applications.
In December 2012, we introduced our Blue Planet platform, which is purpose-built to address network operator requirements and enables the deployment of software applications to manage and control underlying network infrastructure. We also offer high-capacity, multi-layer switching and transport platforms, known as our Cyan Z-Series, designed to support the multiple concurrent technologies used in regional and metro networks, including both Ethernet-based services as well as optical services.
Customers may choose to deploy Blue Planet either on a standalone basis or integrated with our Z-Series platforms. By deploying our solutions, network operators can realize the following benefits:
| Ÿ | Deliver Virtual Networks. Our solutions enable our customers to activate, control and modify network services through our centralized, software control plane, thereby permitting them to present a custom network to each enterprise customer and rapidly offer services. Additionally, |
3
Table of Contents
| our approach embraces a multi-vendor environment by integrating with third-party network devices and centralizing the visualization and management of disparate network elements. |
| Ÿ | Enhance Flexibility and Support Open Architectures. Our multi-layer solutions give network operators the flexibility to support a changing service mix and the ability to evolve their networks to a packet-based approach at their own pace. |
| Ÿ | Increase Capacity and Scalability. Our solutions are designed to scale in a distributed and highly available manner, increasing network capacity and optimizing cost per bit by tailoring traffic transport to the appropriate network layer, leveraging both electrical and optical domains. Additionally, our Z-Series platforms support high-capacity networks by facilitating backplane and switch fabric interconnect rates in excess of 100G per card slot, enabling an easy migration to future 40G and 100G Ethernet services. |
| Ÿ | Accelerate Time to Value. Our Blue Planet platform includes advanced network and service planning applications, enabling network operators to design multi-layer networks quickly and cost-effectively utilizing our advanced three-dimensional visualization tools. Additionally, our carrier-grade SDN approach enables network operators to access network peripherals and functions remotely, thereby allowing them to rapidly extend the delivery of new services throughout their networks. |
| Ÿ | Enhance Performance and Intelligence. Our Blue Planet platform includes real-time and historical analytics to track network performance and assist in capacity planning. Network operators and their end-customers can use Blue Planet extensively to troubleshoot network performance issues, monitor and report on network service level agreements, or SLAs, and make better business planning decisions. |
| Ÿ | Offer a Broad Range of Premium Applications. Our solutions enable network operators to derive additional sources of revenue through the delivery of differentiated Ethernet services that enhance their end-customers’ experiences. Moreover, Blue Planet allows network operators to either develop their own custom applications, utilize our applications or seamlessly integrate third-party applications. |
| Ÿ | Scale Networks Cost Effectively. Our solutions enable network operators to reduce capital and operating expenses by minimizing the need for disparate legacy networks and related software. The modular design of our solutions further reduces costs by enabling our customers to add services and functionality on a pay-as-you-grow basis as well as by limiting field technician dispatches. Additionally, our multi-layer approach to networks enhances long-term capital efficiency and reduces operating expenses by enabling our customers to migrate to packet-based networks over time. |
Our Strategy
Our goal is to establish our position as a leading provider of open, carrier-grade networking solutions. The key elements of our strategy include:
| Ÿ | Extend Our Technology Leadership in High-Performance, Carrier-Grade Networking. We intend to leverage our technology leadership position by continuing to define the market requirements for carrier-grade SDNs and invest in sales and marketing resources to raise awareness of the full benefits of virtualizing high-performance networks. |
| Ÿ | Develop Innovative Products and Technology. We plan to continue to introduce new software and hardware products that enable our customers to more efficiently offer new services and increase their profitability. |
4
Table of Contents
| Ÿ | Expand Our Service Provider Customer Base. We intend to target new service provider customers by continuing to invest in our sales force, field operations and support functions as well as by deepening our engagement with our current channel partners and establishing relationships with new channel partners. |
| Ÿ | Sell Additional Solutions to Existing Customers. Our solutions are well suited for a pay-as-you-grow approach. We intend to continue investing in our existing customer relationships to drive the adoption of additional products as our customers scale and evolve their network services over time. |
| Ÿ | Extend Our Presence in New Geographies. We are growing our channel partner network to further support our growth and international expansion, and we plan to leverage our relationships with existing customers in Asia, Europe and South America to enhance our brand recognition. |
| Ÿ | Expand in Emerging Customer Verticals. We plan to target emerging customer verticals with use cases well suited to the benefits of our solutions, including large data center networks, governments, cable multiple systems operators, or MSOs, as well as enterprises that build and operate large, private networks. |
Risks Affecting Us
Our business is subject to numerous risks and uncertainties, including those highlighted in the section titled “Risk Factors” immediately following this prospectus summary. These risks include, but are not limited to, the following:
| Ÿ | we have a limited operating history, which makes it difficult to evaluate our current business and future prospects; |
| Ÿ | our business depends on the capital spending patterns and financial capabilities of our service provider customers, and any decrease or delay in their capital spending may adversely affect us; |
| Ÿ | our largest customer, Windstream Corporation, has publicly indicated its intention to reduce its overall capital expenditures in 2013, and, as a result, our operating results may be harmed if we are unable to expand our sales to other existing or new customers; |
| Ÿ | we currently generate the majority of our revenue from the sale of our Z-Series platforms, and a decrease in purchases of these platforms may adversely affect us; |
| Ÿ | if the software-defined networking market does not develop as we anticipate or if Blue Planet or other new solutions we develop face challenges for market acceptance, demand for our solutions may not grow, and our future results could be adversely affected; |
| Ÿ | we operate in highly competitive markets, and competitive pressures from existing vendors and new entrants may adversely affect us; |
| Ÿ | our business and operations have experienced rapid growth in recent periods, and if we are unable to effectively manage this growth and expansion, or if our business does not continue to grow as we expect, including with respect to our recruitment of qualified personnel, our business and operating results may suffer; and |
| Ÿ | our revenue, gross margin and other operating results may fluctuate significantly and be unpredictable, which makes our future operating results difficult to predict. |
5
Table of Contents
Corporate Information
We were incorporated in Delaware on October 25, 2006 under the name Cyan Optics, Inc. and we changed our name to Cyan, Inc. on November 9, 2011. Our principal executive offices are located at 1383 N. McDowell Blvd., Suite 300, Petaluma, California 94954, and our telephone number is (707) 735-2300. Our website is www.cyaninc.com. Information contained on, or that can be accessed through, our website is not incorporated by reference into this prospectus, and you should not consider information on our website to be part of this prospectus.
Cyan, the Cyan logo, “Blue Planet,” “Z-Series,” “CyNOC,” “Cyan PRO,” “CySupport,” “CyService,” and other trademarks or service marks of Cyan appearing in this prospectus are the property of Cyan. Trade names, trademarks and service marks of other companies appearing in this prospectus are the property of their respective holders.
We are an emerging growth company as defined in the Jumpstart Our Business Startups Act of 2012, or the JOBS Act. We will remain an emerging growth company until the earlier of the last day of the fiscal year following the fifth anniversary of the completion of this offering, the last day of the fiscal year in which we have total annual gross revenue of at least $1.0 billion, the date on which we are deemed to be a large accelerated filer (this means the market value of our common stock that is held by non-affiliates exceeds $700 million as of the end of the second quarter of that fiscal year), or the date on which we have issued more than $1.0 billion in non-convertible debt securities during the prior three-year period.
6
Table of Contents
| Common stock offered by us |
8,000,000 shares | |
| Common stock to be outstanding after this offering |
44,531,318 shares | |
| Option to purchase additional shares |
We have granted the underwriters an option, exercisable for 30 days after the date of this prospectus, to purchase up to an additional 1,200,000 shares from us. | |
| Use of proceeds |
We intend to use the net proceeds from this offering for working capital and other general corporate purposes and potential acquisitions. See the section titled “Use of Proceeds.” | |
| Concentration of ownership |
Upon completion of this offering, the executive officers, directors and 5% stockholders of our company and their affiliates will beneficially own, in the aggregate, approximately 64.6% of our outstanding capital stock. | |
| Proposed NYSE trading symbol |
“CYNI” | |
The number of shares of common stock that will be outstanding after this offering is based on 36,531,318 shares of common stock (including redeemable convertible preferred stock on an as-converted basis) outstanding as of March 31, 2013, and excludes:
| Ÿ | 11,184,817 shares of common stock issuable upon the exercise of options to purchase common stock that were outstanding as of March 31, 2013, with a weighted-average exercise price of $3.18 per share; |
| Ÿ | 1,009,597 shares of common stock issuable upon the exercise of warrants outstanding as of March 31, 2013, with a weighted-average exercise price of $2.34 per share (of which warrants to purchase 894,596 shares of redeemable convertible preferred stock will either be exercised or terminated immediately prior to the completion of this offering); |
| Ÿ | 4,811,203 additional shares of common stock, subject to increase on an annual basis, reserved for future issuance under our 2013 Equity Incentive Plan, which will become effective in connection with the completion of this offering, consisting of: |
| Ÿ | 3,600,000 shares of common stock reserved for future grant or issuance under our 2013 Equity Incentive Plan, which will become effective in connection with the completion of this offering; and |
| Ÿ | 1,211,203 shares of common stock reserved for future issuance under our 2006 Stock Plan, which shares will be added to the shares of common stock to be reserved under our 2013 Equity Incentive Plan upon its effectiveness. |
Except as otherwise indicated, all information in this prospectus reflects and assumes the following:
| Ÿ | the conversion of all outstanding shares of our redeemable convertible preferred stock into an aggregate of 33,897,005 shares of common stock immediately prior to the completion of this offering; |
7
Table of Contents
| Ÿ | the filing of our amended and restated certificate of incorporation in Delaware and the adoption of our amended and restated bylaws, each of which will occur in connection with the completion of this offering; |
| Ÿ | no exercise of outstanding options or outstanding warrants; and |
| Ÿ | no exercise by the underwriters of their option to purchase up to an additional 1,200,000 shares of common stock from us in this offering. |
8
Table of Contents
SUMMARY CONSOLIDATED FINANCIAL DATA
The following tables summarize our consolidated financial data. You should read this summary consolidated financial data together with the sections titled “Selected Consolidated Financial Data” and “Management’s Discussion and Analysis of Financial Condition and Results of Operations” and our consolidated financial statements and related notes that are included elsewhere in this prospectus.
The consolidated statements of operations data for the years ended December 31, 2010, 2011 and 2012 are derived from our audited consolidated financial statements that are included elsewhere in this prospectus. The consolidated statements of operations data for the three months ended March 31, 2012 and 2013 and the consolidated balance sheet data as of March 31, 2013 are derived from our unaudited interim consolidated financial statements that are included elsewhere in this prospectus. The unaudited interim consolidated financial statements were prepared on a basis consistent with our audited consolidated financial statements and include, in our opinion, all adjustments, consisting only of normal recurring adjustments, that we consider necessary for a fair presentation of the financial information set forth in those statements. Our historical results are not necessarily indicative of the results that may be expected in the future, and our interim results are not necessarily indicative of the results to be expected for the full year or any other period.
| Year Ended December 31, | Three Months Ended March 31, |
|||||||||||||||||||
| 2010 | 2011 | 2012 | 2012 | 2013 | ||||||||||||||||
| (in thousands, except per share data) | ||||||||||||||||||||
| Consolidated Statements of Operations Data: |
||||||||||||||||||||
| Revenue |
$ | 23,484 | $ | 40,421 | $ | 95,872 | $ | 14,187 | $ | 26,319 | ||||||||||
| Cost of revenue |
18,263 | 27,074 | 57,315 | 8,467 | 15,402 | |||||||||||||||
|
|
|
|
|
|
|
|
|
|
|
|||||||||||
| Gross profit |
5,221 | 13,347 | 38,557 | 5,720 | 10,917 | |||||||||||||||
| Operating expenses: |
||||||||||||||||||||
| Research and development |
10,430 | 12,986 | 18,447 | 3,552 | 7,239 | |||||||||||||||
| Sales and marketing |
7,919 | 12,825 | 25,243 | 4,774 | 8,017 | |||||||||||||||
| General and administrative |
2,380 | 3,310 | 6,055 | 910 | 2,863 | |||||||||||||||
|
|
|
|
|
|
|
|
|
|
|
|||||||||||
| Total operating expenses |
20,729 | 29,121 | 49,745 | 9,236 | 18,119 | |||||||||||||||
| Loss from operations |
(15,508 | ) | (15,774 | ) | (11,188 | ) | (3,516 | ) | (7,202 | ) | ||||||||||
| Interest expense |
(429 | ) | (419 | ) | (33 | ) | (20 | ) | (126 | ) | ||||||||||
| Other income (expense), net |
(406 | ) | 322 | (5,340 | ) | (356 | ) | (2,001 | ) | |||||||||||
|
|
|
|
|
|
|
|
|
|
|
|||||||||||
| Total other income (expense), net |
(835 | ) | (97 | ) | (5,373 | ) | (376 | ) | (2,127 | ) | ||||||||||
|
|
|
|
|
|
|
|
|
|
|
|||||||||||
| Loss before provision for income taxes |
(16,343 | ) | (15,871 | ) | (16,561 | ) | (3,892 | ) | (9,329 | ) | ||||||||||
| Provision for income taxes |
1 | 14 | 40 | 8 | 21 | |||||||||||||||
|
|
|
|
|
|
|
|
|
|
|
|||||||||||
| Net loss |
$ | (16,344 | ) | $ | (15,885 | ) | $ | (16,601 | ) | $ | (3,900 | ) | $ | (9,350 | ) | |||||
|
|
|
|
|
|
|
|
|
|
|
|||||||||||
| Basic and diluted net loss per share(1) |
$ | (7.54 | ) | $ | (6.63 | ) | $ | (6.60 | ) | $ | (1.60 | ) | $ | (3.61 | ) | |||||
|
|
|
|
|
|
|
|
|
|
|
|||||||||||
| Weighted-average number of shares used in computing basic and diluted net loss per share(1) |
2,167 | 2,396 | 2,515 | 2,441 | 2,593 | |||||||||||||||
|
|
|
|
|
|
|
|
|
|
|
|||||||||||
| Pro forma basic and diluted net loss per share(1) |
$ | (0.31 | ) | $ | (0.20 | ) | ||||||||||||||
|
|
|
|
|
|||||||||||||||||
| Weighted-average number of shares used in computing pro forma basic and diluted net loss per share(1) |
36,412 | 36,490 | ||||||||||||||||||
|
|
|
|
|
|||||||||||||||||
| (1) | See Note 9 to our audited consolidated financial statements for an explanation of the calculations of our basic and diluted net loss per share of common stock and pro forma net loss per share of common stock. |
9
Table of Contents
| As of March 31, 2013 | ||||||||||||
| Actual | Pro Forma(1) | Pro Forma As Adjusted(2) |
||||||||||
| (in thousands) | ||||||||||||
| Consolidated Balance Sheet Data: |
||||||||||||
| Cash and cash equivalents |
$ |
14,007 |
|
$ | 14,007 | $ | 93,932 | |||||
| Working capital |
3,560 | 11,812 | 92,227 | |||||||||
| Property and equipment, net |
7,480 | 7,480 | 7,480 | |||||||||
| Total assets |
63,069 | 63,069 | 140,852 | |||||||||
| Total debt |
12,563 | 12,563 | 12,563 | |||||||||
| Total deferred revenue |
17,512 | 17,512 | 17,512 | |||||||||
| Preferred stock warrant liability |
8,252 | — | — | |||||||||
| Redeemable convertible preferred stock |
98,133 | — | — | |||||||||
| Total stockholders’ equity (deficit) |
(91,293 | ) | 15,092 | 93,365 | ||||||||
| (1) | The pro forma column reflects (i) the automatic conversion of all outstanding shares of our redeemable convertible preferred stock into 33,897,005 shares of our common stock immediately prior to the closing of this offering and (ii) the reclassification of the preferred stock warrant liability to additional paid-in capital. |
| (2) | The pro forma as adjusted column gives effect to the pro forma adjustments set forth in footnote 1 above and the sale by us of 8,000,000 shares of our common stock offered by this prospectus at an assumed initial public offering price of $11.00 per share, which is the midpoint of the estimated offering price range set forth on the cover page of this prospectus, after deducting estimated underwriting discounts and commissions and estimated offering expenses of approximately $3.6 million (of which approximately $1.7 million of offering costs have already been paid by us and approximately $0.5 million of offering costs were included in accounts payable and accrued liabilities as of March 31, 2013). |
The pro forma as adjusted information presented in the consolidated balance sheet data is illustrative only and will change based on the actual initial public offering price and other terms of this offering determined at pricing. Each $1.00 increase or decrease in the assumed initial public offering price of $11.00 per share, which is the midpoint of the estimated offering price range set forth on the cover page of this prospectus, would increase or decrease, as applicable, each of cash and cash equivalents, working capital, total assets and total stockholders’ equity on a pro forma as adjusted basis by approximately $7.4 million, assuming that the number of shares offered by us, as set forth on the cover page of this prospectus, remains the same and after deducting estimated underwriting discounts and commissions and estimated offering expenses.
10
Table of Contents
Investing in our common stock involves a high degree of risk. You should carefully consider the risks and uncertainties described below, together with all of the other information in this prospectus, before making a decision to invest in our common stock. If any of the risks actually occurs, our business, financial condition, operating results and prospects could be materially and adversely affected. In that event, the trading price of our common stock could decline, and you could lose part or all of your investment.
Risks Related to Our Business
We have a limited operating history, which makes it difficult to evaluate our current business and future prospects and may increase the risk of your investment.
We were incorporated in 2006, and began selling our solutions and generating revenue in 2009. Our limited operating history makes financial forecasting and evaluation of our business difficult. Moreover, we compete in markets characterized by rapid technological change, changing customer needs, evolving industry standards and frequent introductions of new products and services. We have experienced rapid growth since our inception, and we continue to increase the breadth and scope of our solutions and, correspondingly, the breadth and scope of our operations. For example, in December 2012, we released for general availability our Blue Planet carrier-grade software-defined networking platform. We have limited historical data and have had a relatively limited time period in which to implement and evaluate our business strategies as compared to companies with longer operating histories. As a result, it is difficult to forecast our future revenue growth, if any, and to plan our operating expenses appropriately, which in turn makes it difficult to predict our future operating results. In the course of our development efforts, we may experience design, manufacturing, marketing and other difficulties that could delay or prevent the development, introduction or marketing of new solutions, services and enhancements. If we are not successful, we could experience lower sales, which would harm our business, operating results and financial condition.
Our business depends on the capital spending patterns and financial capabilities of our service provider customers, and any decrease or delay in their capital spending may adversely affect our business and operating results.
Our revenue to date has been derived primarily from our service provider customers. Demand for our solutions depends on the amount and timing of capital spending by these customers as they construct, expand and upgrade their networks. The global economic downturn and uncertainty has contributed to a slowdown in spending in many industries, including by telecommunications service providers. In response to any future challenging economic conditions and decreased availability of capital, spending for network infrastructure projects could be further delayed or cancelled. In addition, capital spending is cyclical in our industry and sporadic among individual service providers, and can change on short notice. As a result, we may not have visibility into changes in spending behavior until near the end of a given quarter. Further, infrastructure improvements may be further delayed or prevented by a variety of factors, including cost, regulatory obstacles, consolidation in the industry, lack of consumer demand and alternative technologies for service delivery. Any reductions in capital expenditures by service providers could adversely affect our operating results and future growth.
We have experienced in the past, and expect to continue to experience, seasonal fluctuations in our revenue as a result of our customers’ spending patterns. We generally expect an increase in business activity as we approach December, as some of our customers accelerate spending to use remaining capital budget dollars. Similarly, we generally expect a decrease in business activity in our first quarter, as some of our customers finalize their spending budgets and project initiatives become
11
Table of Contents
clarified. In addition, from time to time, customers may place large orders that may significantly affect sequential trends. Furthermore, we may experience lower gross margin in a particular period as a result of large initial deployments by our customers since these deployments typically include a significant proportion of lower margin Z-Series chassis. As a consequence of this seasonality and the effect of large customer purchases, our quarterly revenue and operating results may fluctuate from quarter to quarter and are difficult to estimate.
We currently generate the majority of our revenue from a concentrated base of customers, including Windstream Corporation. Since Windstream has publicly indicated its intent to reduce its overall capital expenditures in 2013, unless we can substantially expand our sales to other existing or new customers, we will not be able to grow our revenue.
Windstream Corporation, or Windstream, accounted for approximately 37%, 45% and 47% of our revenue for the years ended December 31, 2011 and 2012, and for the three months ended March 31, 2013, respectively. Windstream has publicly indicated its intention to reduce its overall capital expenditures in 2013. Accordingly, we expect our sales to Windstream to decline in future periods. Nonetheless, we anticipate that a large portion of our revenue will continue to depend on sales to Windstream. In addition, given the episodic nature of capital expenditures associated with network deployments, we may derive a substantial amount of our revenue from a limited number of customers in future periods. As a result, unless we can substantially expand our sales to other existing or new customers, we will not be able to grow our revenue.
As a consequence of our customer concentration and the frequently concentrated nature of our customers’ purchases, our quarterly revenue and operating results may fluctuate from quarter to quarter and are difficult to predict. Sales of our solutions to our customers, including Windstream, are made pursuant to purchase orders, and not pursuant to long-term, committed-volume purchase contracts. As a result, we cannot assure you that we will be able to sustain or increase sales to any current or future customer from period to period, or that we will be able to offset the discontinuation of concentrated purchases by these customers with purchases by new or existing customers. The loss of, or a significant delay or reduction in purchases by, any of our significant customers could adversely affect our business and operating results.
We currently generate the majority of our revenue from the sale of our Z-Series platforms and therefore a decrease in purchases of these platforms would adversely affect our revenue and our operating results.
Historically, our Z-Series platforms have accounted for substantially all of our revenue, and we expect to continue to derive a significant portion of our revenue from sales of these platforms in the near term. As a result, our future growth and financial performance will depend heavily on our ability to continue to sell existing, and to develop and sell enhanced, versions of our Z-Series platforms, both to existing and new customers. If current market demand for these products diminishes, or we fail to deliver product enhancements, new releases or new products that customers want, overall demand for our solutions and related services would decrease, and our operating results would be harmed.
If the software-defined networking market does not develop as we anticipate, and if we are unable to increase market awareness of our company and our solutions within that market, demand for our solutions may not grow, and our future results would be adversely affected.
Fundamental to our solution is our software-defined networking approach that enables an array of third-party applications to manage and control underlying network infrastructure. As a result, our success will depend to a significant extent on potential customers recognizing the benefits of our solutions over legacy systems and products, and the willingness of service providers, high-performance data centers and other network operators to increase their use of software-defined
12
Table of Contents
networking solutions in their networks. The market for SDNs is at an early stage with a small installed base and limited market adoption, and it is difficult to predict important trends, including the potential growth, if any, of this market.
If the market for software-defined networking solutions does not evolve in the way we anticipate or if customers do not recognize the benefits of our solutions, we likely would not be able to increase sales of our hardware and software solutions. In such event, our revenue would not grow, or would decline, and our operating results would be harmed. To date, some network operators have been reluctant to switch to SDNs because they have invested substantial resources to maintain and integrate legacy solutions into their networks. These network operators may continue allocating their network budgets to the maintenance and upgrading of their legacy systems and products and therefore not adopt our SDN solutions in addition to or as a replacement for these legacy systems and products.
Even if the market for SDN solutions develops as we anticipate, market awareness of our SDN solutions will be essential to our continued growth. We cannot assure you that network operators will accept the value proposition that we believe our solutions provide. If we are not successful in creating market awareness of our company and our full suite of SDN solutions, our business, financial condition and operating results would be adversely affected.
We recently launched a new software-defined networking platform, Blue Planet, and if this or other new solutions we develop face challenges for market acceptance, our revenue and operating results would be adversely affected.
We released Blue Planet in December 2012. Currently, our Blue Planet offering has an unproven revenue model and accounts for an immaterial amount of our revenue. If network operators do not perceive the benefits of Blue Planet, the market for Blue Planet may not develop or may develop more slowly than we expect, either of which would adversely affect our revenue growth prospects. The widespread acceptance of Blue Planet will require not only the recognition and adoption of software-defined networking as a whole over legacy systems and products, but also the deployment of Blue Planet as a standard solution for our current and potential customers to manage their SDNs. We also face the risk of having a limited time to market in order to establish Blue Planet over any alternative solutions or technologies that network operators utilize for SDNs and other network management. In addition, we have limited experience in pricing Blue Planet separately from our Z-Series platforms, which could result in underpricing that adversely affects our expected financial performance, or overpricing that inhibits our customers’ acceptance of Blue Planet. Even if the initial development and commercial introduction of Blue Planet is successful, we cannot assure you that it will achieve widespread market acceptance or that any market acceptance will be sustainable over the longer term. If Blue Planet does not gain market acceptance at a sufficient rate of growth, our business and operating results would be adversely affected.
We operate in highly competitive markets, and competitive pressures from existing and new companies may adversely affect our business, operating results and market share.
The markets in which we operate are highly competitive and characterized by rapidly changing customer needs and evolving industry standards. We expect competition to intensify in the future as existing competitors and new market entrants introduce new products or enhance existing products. Our business will be adversely affected if we are unable to compete effectively to meet the demand for existing products as well as innovate to bring new products and solutions to market.
We compete either directly or indirectly with large networking and optical companies, such as Alcatel-Lucent SA, Ciena Corporation, Cisco Systems, Inc., Fujitsu Limited, Huawei Technologies Co. Limited and Juniper Networks, Inc., and specialized technology providers that offer solutions that
13
Table of Contents
address a portion of the issues that we address. In addition, we seek to replace legacy network control tools and processes that network operators have either already purchased or internally developed, and potential customers may be reluctant to adopt a solution that replaces or changes existing systems and processes in which they have made significant investments. In the future, in selling Blue Planet we may also compete with companies that are focused on providing virtualization software solutions for other end-markets as they may try to adapt their solutions to meet the needs of network operators or compete with networking companies that develop or acquire SDN solutions. Some of our competitors have made, or may make, acquisitions of businesses that may allow them to offer solutions that are more directly competitive and comprehensive than those they currently offer.
We expect competition and competitive pressure, from both new and existing competitors, to increase in the future. Additionally, many of our competitors have greater name recognition, longer operating histories, well-established relationships with customers or channel partners in our markets and substantially greater financial, technical, personnel and other resources than we have. Our competitors may be able to anticipate, influence or adapt more quickly to new or emerging technologies and changes in customer requirements, devote greater resources to the promotion and sale of their products and services, initiate or withstand substantial price competition, take advantage of acquisitions or other opportunities more readily and develop and expand their product and service offerings more quickly than we can. In addition, competitors with substantially larger installed customer bases may leverage their relationships and incorporate functionality into their existing products in a manner that may discourage customers from purchasing our solutions. These larger competitors may also have more diversified businesses that allow them to better withstand significant reductions in capital spending by customers. Moreover, potential customers may also prefer to purchase from their existing providers rather than a new provider, regardless of product performance or features, because our solutions may require additional investment of time and funds to install the solutions and to train operations personnel. In addition, some of our competitors may offer substantial discounts or rebates to win new or retain existing customers, or may bundle different products and services together in a package to their customers where they include products and services that directly compete with our solutions at very low prices or even for free. If we are unable to win customers, or if we are forced to reduce prices in order to secure customers, our business and operating results may be adversely affected.
Our business and operations have experienced rapid growth in recent periods, and if we are unable to effectively manage this growth and expansion, or if our business does not continue to grow as we expect, including with respect to our recruitment of qualified personnel, our operating results may suffer.
We have experienced rapid growth and have significantly expanded our operations since inception, which has placed a strain on our management, administrative, operational and financial infrastructure. Our success will depend in part upon our ability to manage our growth effectively.
We believe that our future success will depend in large part upon our ability to identify, attract and retain highly qualified and skilled personnel, particularly engineers and sales personnel. Our employee headcount has increased from 39 as of December 31, 2008 to 254 as of March 31, 2013, and we currently plan to substantially increase our headcount across all functions during the remainder of 2013. To do so, we seek to identify and attract the highly skilled personnel we believe are essential to our success. Competition for skilled personnel is intense, particularly for those specializing in network and software engineering and sales, and those located in the San Francisco Bay Area. In addition, our headquarters location in Petaluma, in the northern part of the San Francisco Bay Area, may make it more difficult to attract qualified personnel that live in other parts of the Bay Area. We must continue to expand our sales force, including hiring additional sales managers, to grow our customer base and increase our sales. However, we cannot be certain that we will be successful in attracting qualified personnel, or that newly hired personnel will function effectively, both individually and as a group. In
14
Table of Contents
addition, newly hired sales personnel do not typically become productive for a significant period following their initial hiring, resulting in increased near-term costs relative to their respective sales contributions.
Our ability to manage our operations and growth will further require us to refine our operational, financial and management controls, human resource policies, and reporting systems and procedures. If we fail to efficiently expand our sales force, engineering, operations, IT or financial systems, or otherwise manage our growth, our costs and expenses may increase more than we plan and we may lose the ability to close customer opportunities, enhance our existing products and services, satisfy customer requirements, respond to competitive pressures or otherwise execute our business plan. These additional investments will increase our operating costs, which will make it more difficult for us to offset any future revenue shortfalls in the short term by reducing expenses. Moreover, if we fail to scale our operations successfully, our business and operating results could be adversely affected.
We have a history of losses, and we may not be able to generate sufficient revenue to achieve or maintain profitability.
Since our inception, we have incurred net losses in each quarterly and annual period, and as of March 31, 2013, we had an accumulated deficit of $95.9 million. Although our revenue has grown rapidly in recent periods, our revenue growth is likely to slow and our revenue may decline in future periods as a result of a number of factors, including uncertain demand for our solutions, increasing competition or our failure to capitalize on potential growth opportunities. Accordingly, you should not rely on our revenue growth in any prior quarterly or annual period as an indicator of our future performance. In addition, we anticipate that our operating expenses will increase substantially for the foreseeable future as we continue to expend substantial financial resources on sales and marketing, including domestic and international expansion efforts, product and feature development, technology infrastructure, additional headcount and general administration. These efforts may prove more expensive than we currently anticipate, and we may not succeed in increasing our revenue sufficiently, or at all, to offset these higher expenses. To the extent that funds from this offering, combined with existing cash, cash equivalents and operating cash flows, are insufficient to fund our future activities and requirements, we may need to raise additional funds through public or private equity or debt financing. If we issue equity securities in order to raise additional funds, substantial dilution to existing stockholders may occur. If we raise cash through the issuance of additional indebtedness, we may be subject to additional contractual restrictions on our business. Additionally, we cannot assure you that we will be able to raise additional funds on favorable terms, or at all. If we are unable to maintain adequate revenue growth, improve our gross margin or manage our expenses, we may continue to incur significant losses in the future and may not be able to achieve or maintain profitability.
Our revenue, gross margin and other operating results may fluctuate significantly and be unpredictable, which makes our future operating results difficult to predict and could cause the trading price of our common stock to decline.
Our operating results may fluctuate from period to period due to a variety of factors, many of which are outside of our control, which makes it difficult for us to predict our future operating results. For example, the timing and size of sales of our Z-Series platforms and other solutions have been highly variable and difficult to predict, leading to uncertainty and limiting our ability to accurately forecast revenue, and resulting in significant fluctuations in revenue from period to period. This variability has been compounded by our customer concentration and the frequently concentrated nature of our customers’ purchases, which are made pursuant to purchase orders and not pursuant to long-term committed-volume purchase contracts. In addition to, or as elaborated in, other risks listed in this “Risk Factors” section, factors that may affect our operating results include:
| Ÿ | fluctuations in demand for our solutions, and the timing of orders from our customers and channel partners; |
15
Table of Contents
| Ÿ | the capital spending patterns of network operators and any decrease or delay in capital spending by network operators due to economic, regulatory or other reasons; |
| Ÿ | the inherent complexity, seasonality, length and associated unpredictability of our sales cycles for our solutions; |
| Ÿ | changing market conditions, particularly any significant changes in the competitive dynamics of our markets, including new entrants, network operator consolidation and any related discounting of products or services; |
| Ÿ | our ability to expand our international operations; |
| Ÿ | our ability to control costs such as the costs of the components for our Z-Series platforms; |
| Ÿ | the ability of our contract manufacturer and component suppliers to timely meet our manufacturing and supply needs at acceptable prices, or at all; |
| Ÿ | the timing and execution of product transitions, new product introductions or product upgrades by us or our competitors; |
| Ÿ | our ability to timely and effectively develop, introduce and gain market acceptance for new solutions, products, technologies and services, such as Blue Planet, and anticipate future market demands that meet our customers’ requirements; |
| Ÿ | our ability to successfully expand the Z-Series, Blue Planet and professional service solutions we sell to existing customers; |
| Ÿ | the interoperability of our solutions with service providers’ networks, and technical challenges in network operators’ overall networks, unrelated to our solutions, which could delay adoption and installation of our solutions; |
| Ÿ | decisions by potential customers to purchase alternative products and services from other providers and their willingness to deploy our solutions; |
| Ÿ | any decision by us to increase or decrease operating expenses in response to changes in the marketplace or perceived marketplace opportunities; |
| Ÿ | our ability to derive benefits from our investments in sales, marketing, engineering or other activities; |
| Ÿ | our ability to build and manage our channel partner and distribution networks, and the effectiveness of any changes we make to our distribution model; and |
| Ÿ | general economic conditions, both domestically and abroad. |
Any one of the factors above or the cumulative effect of the factors above may result in significant fluctuations in our operating results from period to period. This variability and unpredictability could result in our failure to meet our internal operating plan or the expectations of securities analysts or investors for any period. If we fail to meet such expectations for these or any other reasons, the market price of our common stock could fall substantially and we could face costly lawsuits, including securities class action litigation.
We operate in a rapidly evolving market and if we are unable to develop and introduce new solutions or make enhancements to existing solutions that successfully respond to emerging technological trends and achieve market acceptance, our revenue and growth prospects would likely be adversely affected.
Our market is characterized by rapidly changing technology, changing customer needs, evolving industry standards and frequent introductions of new products and services. Our future success will
16
Table of Contents
depend significantly on our ability to effectively anticipate and timely adapt to such changes, and to develop and offer, on a timely and cost-effective basis, hardware and software solutions with features that meet changing customer demands, technology trends and industry standards. Our solutions have been developed to rely upon open standards for integration and functionality with legacy networks and third-party vendor network equipment and applications, and we cannot assure you that these standards will continue to receive market acceptance. Additionally, such open standard design could make it easier for competitors to more quickly and inexpensively develop and offer their own products and services based on the same technology. If our competitors introduce new products and services that compete with ours, we may be required to reposition our solutions or introduce new solutions in response to such competitive pressure. If we fail to develop new products or product enhancements, or our customers or potential customers do not perceive our solutions to have compelling advantages, our business, revenue and growth prospects would be adversely affected.
We intend to continue making significant investments in further developing our Blue Planet and Z-Series platforms and enhancing the functionality of our existing solutions. Developing our solutions is expensive, complex and involves uncertainties. We intend to continue to dedicate a significant amount of resources to our research and development efforts to maintain our competitive position. However, we may not have sufficient resources to successfully manage these hardware and software development cycles, and these investments may take several years to generate positive returns, if ever.
The future growth of our business depends, in significant part, on increasing our international sales, and even if we are successful in expanding internationally, our business will be susceptible to risks associated with international operations.
We currently generate substantially all of our sales from customers in the United States, and have only recently begun marketing, selling and supporting our solutions internationally, primarily through channel partners. We have limited experience managing the sales, support and administrative aspects of a worldwide operation. The future growth of our business depends, in significant part, on increasing our international sales. We may not be successful in our efforts to expand our international operations, including as a result of not being able to increase or maintain international market demand for our solutions, and entry into additional international markets will require significant management attention and financial resources. Our failure to successfully grow internationally could limit the future growth of our business and, consequently, affect our business, operating results and financial condition.
In the course of expanding our international operations and operating overseas, we will be subject to a variety of risks, directly and indirectly through our channel partners, including:
| Ÿ | international trade costs and restrictions, including trade laws, tariffs, export quotas, custom duties or other trade restrictions, affecting our sales; |
| Ÿ | treatment of revenue from international sources and changes to tax codes, including being subject to foreign tax laws and responsibility for paying withholding income or other taxes in foreign jurisdictions; |
| Ÿ | compliance with multiple, conflicting and changing governmental laws and regulations, including employment, tax, privacy, data protection, communications and Internet laws and regulations, and the risks and costs of non-compliance; |
| Ÿ | compliance with U.S. laws and regulations applicable to foreign operations, including the Foreign Corrupt Practices Act, import and export control laws, tariffs, trade barriers, economic sanctions and other regulatory limitations on our ability to sell our solutions in certain foreign markets, and the risks and costs of non-compliance; |
17
Table of Contents
| Ÿ | challenges inherent in efficiently managing an increased number of employees over large geographic distances, including the need to implement appropriate systems, policies, compensation and benefits and compliance programs; |
| Ÿ | difficulties in and costs of staffing foreign operations; |
| Ÿ | difficulties in enforcing contracts, longer accounts receivable payment cycles and the potential corresponding adverse impact on our days sales outstanding; |
| Ÿ | the imperative to upgrade our solutions to meet more stringent performance criteria or adapt our solutions to meet the standards of one or more other countries; |
| Ÿ | the risk of change in political or economic conditions for foreign countries, and the potential for political unrest, acts of terrorism, hostilities or war; |
| Ÿ | localization of products and services, including translation into foreign languages and associated expenses; |
| Ÿ | differing laws and business practices, which may favor local competitors; |
| Ÿ | foreign currency fluctuations and controls; and |
| Ÿ | limited or unfavorable intellectual property protection in foreign jurisdictions. |
Each of these risks could have an adverse effect on our overall business, operating results and financial condition.
We engage channel partners to promote, sell, install and support our solutions internationally, and we intend to rapidly expand our international channel partner network. Any failure to effectively develop and manage this distribution channel could adversely affect our business, operating results and market share.
We engage channel partners who provide sales and support services for our solutions, and we are relying on the rapid expansion of our channel partner network to pursue our international expansion efforts. If we do not properly train our channel partners to sell, install and service our solutions, or if a new channel partner is not able to execute on our sales strategy, our business, financial condition and operating results may suffer. The loss of a key channel partner or the failure of a channel partner to provide adequate customer service could have a negative effect on customer satisfaction and could cause harm to our business. Our use of channel partners and other third-party support partners, and the associated risks, are likely to increase as we seek to expand our international sales. Generally, our channel partners do not have long-term contractual commitments or exclusivity to us. We also compete with other network systems providers for our channel partners’ business as many of our channel partners market competing products. If a channel partner promotes a competitor’s products to the detriment of our solutions or otherwise fails to market our solutions effectively, we would lose market share.
Our sales cycles can be long and unpredictable, and our sales efforts require considerable investment of time and expense. As a result, our sales and revenue are difficult to predict and may vary substantially from period to period, which may cause our operating results to fluctuate significantly.
Our sales process entails planning discussions with prospective customers, analyzing their existing networks and identifying how these potential customers can leverage our solutions within their networks. The sales cycle for a new customer deployment, from the time of prospect qualification to the completion of the first sale, may span multiple quarters. We spend substantial time, effort and money in our sales efforts without any assurance that our efforts will produce any sales of our
18
Table of Contents
solutions. If we invest substantial resources pursuing unsuccessful sales opportunities, our business, operating results and financial condition would be harmed. In addition, purchases by network operators of our solutions are subject to budget constraints, multiple approvals and unplanned administrative, processing and other delays. If sales expected from a specific customer for a particular quarter are not realized in that quarter, or at all, we may not achieve our revenue expectations.
We do not have long-term, committed-volume purchase contracts with our customers for our Z-Series platforms, and therefore have no guarantee of future revenue from any customer, which may cause our operating results to be adversely affected.
Sales of our Z-Series platforms are made pursuant to purchase orders, and we have not entered into long-term, committed-volume purchase contracts with our customers, including our largest customer, Windstream. As a result, any of our customers may cease to purchase our hardware solutions at any time. In addition, our customers may attempt to renegotiate their terms of purchase, including price and quantity, or may delay or cancel already submitted purchase orders. If any of our customers stop purchasing our hardware solutions for any reason, or purchase fewer solutions, our operating results and financial condition would be harmed.
We currently rely upon a single contract manufacturer to manufacture our hardware solutions, and if we encounter problems with the contract manufacturer, our operations could be disrupted, which would adversely affect our business, operating results, financial condition and customer relationships.
We contract with Flextronics International, Ltd., or Flextronics, as the sole manufacturer of all of our Z-Series platforms. Our reliance on Flextronics makes us vulnerable to possible capacity constraints and reduced control over delivery schedules, manufacturing yields and costs. We have limited direct control over the quality and control systems of Flextronics, and therefore may not be able to ensure levels of quality suitable for our customers. The revenue that Flextronics generates from our orders represents a very small percentage of its revenue. As a result, fulfilling our orders may not be considered a priority by Flextronics. If Flextronics were unable or unwilling to continue manufacturing our Z-Series platforms in required volumes and at high quality levels, or if Flextronics significantly increased our costs to have them manufacture our products, we would have to identify, qualify and select an acceptable alternative contract manufacturer. Such alternatives may not be available to us when needed, may take a significant amount of time to contract with and establish manufacturing or supply relationships, and may not be in a position to timely satisfy our production requirements at commercially reasonable prices and quality. Any significant interruption in manufacturing would require us to reduce the amount of Z-Series platforms available to our customers, which in turn would reduce our revenue and adversely affect our business, operating results, financial condition and customer relationships.
If we fail to accurately forecast our manufacturing requirements or manage our inventory with our contract manufacturer, we could incur additional costs, lose revenue and harm our business, operating results, financial condition and customer relationships.
The suppliers of the components used in our Z-Series platforms deliver the components directly to our contract manufacturer, Flextronics, but we bear the inventory risk under our arrangements with Flextronics. As of December 31, 2011 and 2012 and March 31, 2013, we had commitments to Flextronics totaling $5.6 million, $6.6 million and $6.4 million, respectively. Lead times for the materials and components that we order through Flextronics vary significantly and depend on numerous factors, including the specific supplier, contract terms and market demand for a component at a given time. The lead times for certain key materials and components could be lengthy depending on overall market demand, requiring us or Flextronics to order materials and components several months in advance of their use in manufacturing our products. If we overestimate our production requirements, Flextronics
19
Table of Contents
may purchase excess components and build excess inventory. If Flextronics purchases excess components or builds excess products, we could be required to pay for these excess components or products and recognize related inventory write-down costs. We also are required to reimburse Flextronics if our inventory is rendered obsolete for any reason. If we experience inventory write-downs associated with excess or obsolete inventory in any significant amount, this would have an adverse effect on our financial condition and operating results. Conversely, if we underestimate our product requirements, our contract manufacturer may maintain inadequate component inventory and be unable to manufacture our Z-Series platforms in sufficient quantities to timely meet customer demand. Any shortfall in available products could result in delays or cancellation of orders by our customers, which could have an adverse effect on our business, operating results, financial condition and customer relationships.
Certain component parts used in the manufacture of our products are sourced from single or limited source suppliers. If we are unable to source these components on a timely basis, we will not be able to meet our customers’ product delivery requirements, which could adversely affect our business, operating results, financial condition and customer relationships.
We depend on certain sole-source and limited source suppliers for key components that Flextronics, our contract manufacturer, uses in the manufacture of our Z-Series platforms. Any of the sole-source and limited source suppliers upon whom we rely could stop producing our components, cease operations or be acquired by, or enter into exclusive arrangements with, our competitors. In particular, our reliance on Broadcom Corporation for certain key semiconductors used in our hardware solutions makes us vulnerable to shortages or pricing pressure on these important components. Neither we nor Flextronics generally has long-term supply agreements with component suppliers, and our purchase volumes currently may be considered too low for us to be a priority customer by many of such suppliers. As such, we cannot be guaranteed a continuous source of, or favorable pricing for, components from any of these suppliers. Furthermore, patent infringement lawsuits between semiconductor companies could have an adverse effect on our ability to acquire components that are sole sourced and integrated into our family of Z-Series platforms, leading to production delays and additional engineering costs, potentially harming our business and customer relationships. Any such interruption or delay may force us to seek similar components or products from alternative sources, which may not be available on commercially reasonable terms, or at all. Switching suppliers may require that we redesign our Z-Series platforms to accommodate new components, and to re-qualify these solutions, which would be costly and time-consuming. Any interruption in the supply of sole-source or limited source components for our solutions would adversely affect our ability to meet scheduled product deliveries to our customers and could result in lost revenue or higher expenses, any of which would harm our business, operating results, financial condition and customer relationships.
Our future success depends in part on revenue from subscriptions for Blue Planet and our other services, and because we recognize revenue from subscriptions over the term of the relevant service period, downturns or upturns in sales will not likely be reflected in full in our operating results for the period in which such downturns or upturns occur.
Sales of new or renewal subscription, support and maintenance contracts, especially with respect to subscriptions for Blue Planet, may decline and fluctuate as a result of a number of factors, including our customers’ level of satisfaction with our solutions, the prices of our solutions, the prices of products and services offered by our competitors and reductions in our customers’ spending levels. If our sales of new or renewal subscription, support and maintenance contracts decline, our revenue and revenue growth will decline and our business will suffer. In addition, we recognize subscription and service contract revenue ratably over the term of the relevant contractual period, typically one year. As a result, much of the subscription and service revenue that we report each quarter is the recognition of deferred revenue from subscription and service contracts entered into during previous quarters. Accordingly,
20
Table of Contents
any decline in new or renewed subscription or service contracts in any one quarter will not be fully reflected in revenue in that quarter but will negatively affect our revenue in future quarters. In addition, our subscription model for Blue Planet also makes it difficult for us to rapidly increase our subscription revenue through additional sales in any period, as subscription revenue must be recognized over the term of the contract.
Our solutions are highly complex and may contain undetected hardware errors or software bugs, which could harm our reputation and increase our warranty obligations and service costs.
Our solutions are highly technical and, when deployed, are critical to the operation of our customers’ networks. Our solutions have from time to time contained and may in the future contain undetected errors, bugs, defects or security vulnerabilities. Some errors in our solutions may only be discovered after a solution has been deployed and used by customers, and may in some cases only be detected under certain circumstances or after extended use. Any errors, bugs, defects or security vulnerabilities discovered in our solutions after commercial release could result in loss of our revenue or delay in revenue recognition, loss of customer goodwill and customer relationships, harm to our reputation and increased service costs, any of which would adversely affect our business, operating results and financial condition. Quality or performance problems related to our Z-Series platforms that are covered under warranty could require us to repair or replace defective products at no additional cost to the customer. For example, we have recently experienced higher than expected failure rates with certain Z-Series line cards used by a number of our customers that were manufactured between 2010 and the spring of 2012, and have identified a line card power supply as the source of the failures. We are working with the power supply manufacturer to determine the root cause of the component failure and the expected mean time before failure for these components as well as to determine what configurations or environmental factors may be contributing to the risk of early failure in the field. We expect to undertake a proactive warranty repair and replacement program for line cards we ultimately determine to be at risk of early failure. While we have not yet fully quantified the costs of this warranty repair and replacement program, we currently believe that the costs will not be material and that our warranty reserve is sufficient to cover these costs. Should we determine, however, that a systemic defect exists, we may incur additional warranty-related expenses which could adversely affect our gross margins and operating results. If we experience quality or performance problems in the future related to our Z-Series platforms that are covered under warranty, we could be required to repair or replace defective products, which could have a material adverse effect on our reputation and results of operations. In addition, any errors discovered in Blue Planet could cause customers and potential customers to abandon or never adopt Blue Planet, which could adversely affect our ability to grow our business. Moreover, we could face claims for product liability, tort or breach of contract from our customers, or be required to indemnify our customers for damages and third-party claims for a variety of reasons. Any increased costs, liabilities and diversion of resources associated with a warranty or other claim related to errors or alleged errors in our solutions could adversely affect our business, operating results and financial condition.
Our solutions must interoperate with existing legacy and competitor software applications and hardware products found in our customers’ networks. If our solutions do not interoperate properly, future sales of our solutions could be negatively affected, which would harm our business.
Our solutions must interoperate with our customers’ existing and planned networks, which often have varied and complex specifications, utilize multiple protocol standards, software applications and products from multiple vendors and may contain multiple generations of products that have been added over time. Our solutions must communicate, manage and analyze networks and the traffic across these networks, often across differing legacy protocols and technologies. As a result, we must
21
Table of Contents
continually ensure that our products interoperate properly with these existing and planned networks and network components, including legacy networks that operate on technology originally designed several decades ago. To meet these interoperability requirements, we continuously engage in development efforts that require substantial resources. If we fail to maintain compatibility with other software or equipment included in our customers’ existing and planned networks, we may incur significant warranty, support and repair costs, cause significant customer relations problems and divert the attention of our engineering personnel from our product development efforts, and our business and operating results would be adversely affected. In addition, if our competitors, whose software or equipment incorporate these protocols and technologies, fail to make available to us on an ongoing basis the interfaces and other information we require to maintain the interoperability of our solutions with their software and equipment, our business and operating results would be adversely affected.
If we fail to comply with evolving network industry technical requirements and standards, sales of our existing and future solutions would be adversely affected, which could adversely affect our operating results and growth prospects.
The markets for our solutions are characterized by a significant number of standards, both domestic and international, which are evolving as new network technologies are deployed. Our solutions must comply with these standards in order to be widely marketable. In some cases, we may be required to obtain certifications or authorizations before our solutions can be introduced, marketed or sold in new markets or to new customers. In addition, our ability to expand our international operations and create international market demand for our solutions may be constrained by regulations or standards adopted by other countries that may require us to redesign our existing solutions or develop new products suitable for sale in those countries. We cannot assure you that we will be able to design our solutions to comply with evolving standards and regulations. The cost of complying with evolving standards and regulations, or our failure to obtain timely domestic or foreign regulatory approvals or certifications, may prevent us from selling our solutions where such standards or regulations apply, which could adversely affect our operating results and growth prospects.
Our ability to sell our solutions is highly dependent on the quality of our support and service offerings, and our failure to offer high quality support and services would have an adverse effect on our business, reputation and operating results.
Once our solutions are deployed within our customers’ networks, our customers depend on our support organization to quickly resolve any issues relating to those products. A high level of support is critical for the successful marketing and sale of our solutions. If we do not effectively assist our customers in deploying our solutions, succeed in helping them quickly resolve post-deployment issues or provide effective ongoing support, it could adversely affect our ability to sell our solutions to existing customers and harm our reputation with potential new customers, which would have an adverse effect on our business, reputation and operating results.
Weakened global economic conditions may harm our industry, business, operating results and financial condition.
Our overall performance depends in large part on global economic conditions, which may remain challenging for the foreseeable future. Global financial developments seemingly unrelated to us or the network industry may harm our business by negatively affecting the demand for networking equipment. The United States, Europe and other key international economies have been adversely affected in the recent past, and continue to face economic uncertainty. These conditions affect the rate of spending on network services, could adversely affect our customers’ ability or willingness to purchase our solutions and could delay prospective customers’ purchasing decisions. In addition, a prolonged economic
22
Table of Contents
downturn could affect the viability of our current business strategy. All of these factors could reduce our revenue and harm our business, operating results and financial condition.
Changes in government-sponsored programs, especially decreases in government funding, could affect the timing and buying patterns of certain of our customers, which would cause reduced sales of our solutions and fluctuations in our operating results.
Over the past several years, some of our customers were Independent Operating Companies, or IOCs, and other telecommunications network providers that benefited from federal and state subsidies. Approximately 6.9%, 12.3%, 9.3% and 10.0% of our revenue for the years ended December 31, 2010, 2011 and 2012, and the three months ended March 31, 2013, respectively, was attributable to sales of our solutions to IOCs and other service providers that used government-supported loan programs or grants to fund purchases from us, such as those originating from the Rural Utility Service, or RUS, program administered by the U.S. Department of Agriculture, and broadband stimulus programs under the American Recovery and Reinvestment Act of 2009. For example, award grants under the broadband stimulus programs were issued between November 2009 and September 2010, with all funds that were awarded expected to be expended by September 2013. We expect that changes to or elimination of these programs are likely, especially given the current U.S. federal government fiscal issues, and that these support or stimulus funds will not be available to IOCs in whole or in part, which could reduce the ability of IOCs to access capital and reduce our revenue opportunities for selling our solutions to these IOCs. To the extent that any of our customers have received grants or loans under these RUS and stimulus programs, but no longer have access to such assistance, they may substantially reduce or curtail future purchases of our solutions.
Our business substantially depends on the continued growth in demand for Internet and other network services, and lack of growth or contraction of demand for these services could have an adverse effect on our business, operating results and financial condition.
Our future growth depends in large part on the continued growth in the demand for Internet and other telecommunications and network services, and in particular the demand for services that require greater bandwidth, such as the proliferation of mobile devices, rapid adoption of bandwidth-intensive applications and the growth of cloud computing. Our future growth also depends on the deployment of our solutions by customers who provide those services. To the extent that the growth in the demand for these network services slows or an economic slowdown or economic uncertainty and related reduction in capital spending adversely affects spending on Internet, mobile and other network infrastructure, we could experience substantial harm to our business, operating results and financial condition. Even if the demand for Internet and other network services does experience the forecasted growth, our business may not grow at similar rates, or at all. Our growth is subject to many factors, including our success in implementing our business strategy that, in turn, depends on growth in network services, all of which are subject to many risks and uncertainties. Accordingly, the forecasts of growth of Internet and other network services included in this prospectus should not be taken as indicative of our future growth.
Third parties may assert that we are infringing upon their intellectual property rights, which could harm our business, operating results, financial condition and growth prospects.
There is considerable patent and other intellectual property development activity, and litigation related to intellectual property rights, in the technology industry in general and the networking industry in particular. From time to time, our competitors, other third-party developers of technology or non-practicing entities, commonly referred to as “patent trolls,” may claim that we are infringing upon their intellectual property rights. Regardless of the merit of any such claim, responding to such claims can be time consuming, divert management’s attention and resources and may cause us to incur significant expenses. We cannot assure you that we would be successful in defending against any
23
Table of Contents
such claims. In addition, patent applications in the United States and most other countries are confidential for a period of time before being published, so we cannot be certain that we were the first to conceive inventions covered by our patents or patent applications. Moreover, we cannot be certain that we are not infringing third parties’ patent or other intellectual property rights. An adverse outcome with respect to any intellectual property claim could invalidate our proprietary rights and/or force us to, among other things, do one or more of the following:
| Ÿ | obtain from a third party claiming infringement a license to sell or use the relevant technology, which may not be available on reasonable terms, or at all; |
| Ÿ | stop manufacturing, selling, or using our solutions that embody the asserted intellectual property and refund to customers all or a portion of the fees related to the purchase or license of such solutions; |
| Ÿ | pay substantial monetary damages; |
| Ÿ | indemnify our customers and/or commercial partners against third-party claims for intellectual property infringement pursuant to indemnification obligations under our contracts, generally without limit; or |
| Ÿ | expend significant resources to redesign our solutions that use the infringing technology and to develop or acquire non-infringing technology. |
Additionally, if we offer employment to personnel employed or formerly employed by competitors, we may become subject to claims of unfair hiring practices and/or breaches of confidentiality related to the intellectual property of such competitors, and incur substantial costs in defending ourselves against these claims, regardless of their merits. Any of these actions could adversely affect our business, operating results, financial condition and growth prospects.
If we are unable to successfully manage our use of “open source” software, our ability to sell our products and services could be harmed, which could result in competitive disadvantages, and subject us to possible litigation.
We incorporate open source software code in our proprietary software that is part of both our Z-Series and Blue Planet platforms. Use of open source software can lead to greater risks than the use of proprietary or third-party commercial software since open source licensors generally do not provide warranties or controls with respect to origin, functionality or other features of the software. Some open source software licenses require users who distribute open source software as part of their products to publicly disclose all or part of the source code in their software and make any derivative works of the open source code generally available in source code form for limited fees or at no cost. Although we monitor our use of open source software, open source license terms may be ambiguous, and many of the risks associated with the use of open source software cannot be eliminated. If we were found to have inappropriately used open source software in our solutions, we may be required to release our proprietary source code, re-engineer our software, discontinue the sale of certain solutions in the event re-engineering cannot be accomplished on a timely basis, or take other remedial action. Furthermore, if we fail to comply with applicable open source licenses, we may be subject to costly claims of intellectual property infringement or demands for the public release of proprietary source code. Any of the foregoing could harm our business and put us at a competitive disadvantage.
If we are unable to protect our intellectual property rights, our competitive position, ability to protect our proprietary technology and our brand could be harmed or we could be required to incur significant expense to enforce our rights.
Our success depends to a significant degree on our ability to protect our core technology and intellectual property. We rely on a combination of intellectual property rights, including trade secret
24
Table of Contents
laws, copyrights, patents and trademarks, as well as customary contractual provisions. To date we have only three issued U.S. patents, and do not have any patents issued outside the United States. We have not, to date, emphasized any patent program for our know-how, and the patents that we have filed or are pending may not cover important aspects of our technology, and may not be enforceable. We also license software from third parties for integration into our products, including open source software and other commercially available software. We generally control access to and use of our proprietary software and other confidential information through the use of internal and external controls, including contractual protections with employees, contractors, customers and partners, and our software is protected by U.S. and international copyright laws. We also incorporate certain generally available software programs into Blue Planet and our other software solutions pursuant to license agreements with third parties. These agreements may be breached, and we may not have adequate remedies for any such breach. In addition, our trade secrets may otherwise become known or be independently developed by competitors.
The steps we have taken to protect our intellectual property rights may not be adequate. Third parties may infringe or misappropriate our intellectual property rights. We may initiate claims against third parties that we believe are infringing our intellectual property rights if we are unable to resolve matters satisfactorily through negotiation. If we fail to protect our intellectual property rights adequately, our competitors could offer similar products, potentially harming our business. Our intellectual property rights may be challenged by others or invalidated through administrative process or litigation. Any litigation, whether or not it is resolved in our favor, could result in significant expense to us and divert the efforts of our technical and management personnel. Effective trademark, copyright, trade secret and patent protection may not be available to us in every country in which we provide our solutions. The laws of some foreign countries are not as protective of intellectual property rights as those in the United States, and mechanisms for enforcement of intellectual property rights in these jurisdictions may be inadequate. We may be required to spend significant resources to monitor and protect our intellectual property rights, and such monitoring may be insufficient to detect all misappropriation or infringement of our rights. We may initiate claims or litigation against third parties for infringement of our intellectual property rights or to establish the validity of such rights.
If we lose key members of our management or engineering teams or are unable retain executives and employees that we need to support our operations and growth, our business and operating results may be harmed.
Our success depends, in large part, on the continued contributions of our key management, engineering, sales personnel and other employees, many of whom are highly skilled and would be difficult to replace. None of our senior management or key technical or sales personnel is bound by a written employment contract to remain with us for a specified period. Moreover, any of our employees may terminate their employment at any time. Many of our key employees have become, or will soon become, vested in a substantial amount of their shares of common stock or stock options. Employees may be more likely to leave us if the shares they own, or the shares underlying their stock options, have vested. In addition, we do not maintain key man life insurance covering our key personnel. The loss of the services of any of our key personnel may harm our business and operating results.
Our failure to comply with laws and regulations, including regulations affecting the import or export of products and anti-bribery laws, could harm our business.
Our business is subject to regulation by various federal, state, local and foreign governmental agencies, including agencies responsible for monitoring and enforcing employment and labor laws, workplace safety, product safety, environmental laws, consumer protection laws, anti-bribery laws, import/export controls, federal securities laws, and tax laws and regulations. In certain jurisdictions, these regulatory requirements may be more stringent than those in the United States. Noncompliance
25
Table of Contents
with applicable regulations or requirements could subject us to investigations, sanctions, product recalls, enforcement actions, disgorgement of profits, fines, damages, civil and criminal penalties or injunctions. If any governmental sanctions are imposed, or if we do not prevail in any possible civil or criminal litigation, our business, operating results, and financial condition could be adversely affected. In addition, responding to any action will likely result in a significant diversion of management’s attention and resources and an increase in professional fees. Enforcement actions and sanctions could harm our business, reputation, operating results and financial condition. Any change in laws, regulations or related legislation, shift in approach to the enforcement or scope of existing regulations, or change in the countries, persons or technologies targeted by such regulations, could negatively affect our ability to sell our solutions and could adversely affect our business, operating results and financial condition.
Our planned international expansion creates additional regulatory challenges. Future international shipments of our solutions may require export licenses or export license exceptions. In addition, the import laws of other countries may limit our ability to distribute our solutions, or our customers’ ability to buy and use our solutions, in those countries. Changes in our solutions or changes in export and import regulations may create delays in the introduction of our solutions in international markets, prevent our customers with international operations from deploying our solutions or, in some cases, prevent the export or import of our solutions to certain countries altogether. We expect that our planned expanding global operations will require us to import and export to and from several countries, resulting in additional compliance obligations.
In particular, the U.S. Foreign Corrupt Practices Act, or the FCPA, the United Kingdom Bribery Act 2010, or the Bribery Act, and similar anti-bribery laws in other jurisdictions generally prohibit companies and their intermediaries from making improper payments to government officials for the purpose of obtaining or retaining business. Under these laws, companies are required to maintain records that accurately and fairly represent their transactions and have an adequate system of internal accounting controls. We are expanding to operate in areas of the world, including in conjunction with our channel partners, that may experience corruption by government officials to some degree and, in certain circumstances, compliance with anti-bribery laws may conflict with local customs and practices. In addition, network operators in various foreign countries may have influence with government officials and many are owned in whole or in part by foreign governments or instrumentalities. We cannot assure you that our employees, channel partners or other agents will not engage in prohibited conduct and render us responsible under the FCPA, the Bribery Act or any similar anti-bribery laws in another jurisdiction. If we are found to be in violation of the FCPA, the Bribery Act or other anti-bribery laws, either due to our nascent compliance system or the acts or omission of our employees, channel partners or other agents, we could suffer criminal or civil penalties or other sanctions, which could have an adverse effect on our business.
Changes in telecommunications and Internet laws, regulations, rules and tariffs could impede the growth in network activity or otherwise harm our customers, which could have a negative effect on our business and operating results.
Increased regulation of telecommunications and Internet network activity or access in the United States or any country in which we do business, particularly those that have the effect of impeding, or lessening the rate of growth in, network activity, could decrease demand for our solutions. New or increased access charges for telecommunications service providers and tariffs on certain communications services could negatively affect our customers’ businesses. Further, many of our customers are subject to FCC rate regulation of interstate telecommunications services, and are recipients of federal universal service fund payments, which are intended to subsidize telecommunications services in areas that are expensive to serve. In addition, many of our customers are subject to state regulation of intrastate telecommunications services, including rates for such
26
Table of Contents
services, and may also receive funding from state universal service funds. Changes in rate regulations or universal service funding rules, either at the federal or state level, could adversely affect such customers’ revenue and capital spending plans. Any adoption of new laws, regulations, rules or tariffs, or changes to existing laws, regulations, rules or tariffs, that negatively affects network activity or growth or otherwise adversely affects the business of our customers could harm our business and operating results.
Industry consolidation may lead to increased competition or a decreased customer base, which could harm our business and operating results.
Consolidation in the network equipment industry has been common. Some of our competitors have made acquisitions or entered into partnerships or other strategic relationships to offer a more comprehensive solution than they had offered individually. We expect this trend to continue as companies attempt to strengthen or maintain their market positions in an evolving industry are acquired for a variety of strategic reasons or are unable to continue operations. Consolidation in our industry may result in stronger competitors that may create more compelling product offerings, be able to offer greater pricing flexibility, and be better able to compete as sole-source vendors for customers. This would make it more difficult for us to compete effectively, including on the basis of price, sales and marketing programs and breadth of technology or product offerings. In addition, companies with which we have strategic partnerships may acquire or form alliances with our competitors, thereby reducing their business with us. Furthermore, continued industry consolidation may adversely affect customers’ perceptions of the viability of smaller and even medium-sized technology companies such as us and, consequently, customers’ willingness to purchase from such companies.
In addition, consolidation of network operators may lead to a reduction in the number of potential customers, with the effect that the loss of any major customer could have a greater effect on operating results than in a customer marketplace composed of more numerous participants. Consolidation among our customers may also cause delays or reductions in their capital expenditure plans and increased competitive pricing pressures as the number of available customers declines and their relative purchasing power increases in relation to suppliers. Consolidation in the number of potential customers could lead to more variability in our operating results and could have an adverse effect on our business.
We may expand through acquisitions of, or investments in, other companies, business or technologies which may divert our management’s attention and result in additional dilution to our stockholders, and we may be unable to integrate acquired businesses and technologies successfully or achieve the expected benefits of such acquisitions or investments.
While we have not consummated any acquisitions to date, we may evaluate and consider potential strategic transactions, including acquisitions of, or investments in, complementary businesses, technologies, services, products and other assets in the future. We also may enter into relationships with other businesses to expand our product and service offerings, which could involve preferred or exclusive licenses, additional channels of distribution, discount pricing, investments in other companies or strategic or joint venture partnership agreements. Acquisitions may disrupt our business, divert our resources and require significant management attention that would otherwise be available for development of our existing business. The anticipated benefits of any acquisition, investment or business relationship may not be realized, or we may be exposed to risks or liabilities that were unknown at the time of the acquisition or that are different from those that faced our business prior to the acquisition. Negotiating and consummating these transactions can be time-consuming, difficult and expensive, and our ability to close these transactions may often be subject to approvals that are beyond our control. Consequently, these transactions, even if undertaken and announced, may not close. For one or more of those transactions, we may:
| Ÿ | use cash that we may need in the future to operate our business; |
27
Table of Contents
| Ÿ | incur debt on terms unfavorable to us or that we are unable to repay; |
| Ÿ | issue additional equity securities that would dilute our stockholders; |
| Ÿ | increase our working capital requirements; |
| Ÿ | incur substantial liabilities or large charges, such as impairment of goodwill or intangible assets, at the time of the transaction or for some period long after the transaction; |
| Ÿ | encounter difficulties retaining key employees of the acquired company or integrating diverse solutions or business cultures; |
| Ÿ | acquire companies with inadequate financial or operational reporting or control environments; and |
| Ÿ | become subject to adverse tax consequences, substantial depreciation or deferred compensation charges. |
We may not be able to address these risks successfully, or at all, without incurring significant costs, delays or other operating problems that could disrupt our business and have an adverse effect on our operating results and financial condition.
Unanticipated changes in effective tax rates or adverse outcomes resulting from examination of our income or other tax returns could adversely affect our operating results and financial condition.
We are subject to income taxes in the United States and various foreign jurisdictions, and our domestic and international tax liabilities will be subject to the allocation of expenses in differing jurisdictions. Our future effective tax rates could be subject to volatility or adversely affected by a number of factors, including:
| Ÿ | changes in the valuation of our deferred tax assets and liabilities; |
| Ÿ | expected timing and amount of the release of tax valuation allowances; |
| Ÿ | expiration of, or detrimental changes in, research and development tax credit laws; |
| Ÿ | expiration or non-utilization of net operating losses; |
| Ÿ | tax effects of stock-based compensation; |
| Ÿ | costs related to intercompany restructurings; |
| Ÿ | changes in tax laws, regulations, accounting principles or interpretations thereof; or |
| Ÿ | future earnings being lower than anticipated in countries where we have lower statutory tax rates and higher than anticipated earnings in countries where we have higher statutory tax rates. |
In addition, we may be subject to audits of our income and sales taxes by the Internal Revenue Service and other foreign and state tax authorities. Outcomes from these audits could have an adverse effect on our operating results and financial condition.
We may not be able to utilize a significant portion of our net operating loss or research and development tax credit carryforwards, which could adversely affect our operating results and financial condition.
As of December 31, 2012, we had $73.7 million of federal and $74.0 million of state net operating loss carryforwards and $2.4 million of federal and $3.4 million of California research tax credit carryforwards available to reduce future taxable income. These net operating loss carryforwards begin
28
Table of Contents
to expire in 2026 for U.S. federal income tax and 2016 for state income tax purposes, and the research tax credit carryforwards begin to expire in 2027 for federal purposes, but do not expire for California purposes. U.S. federal and state income tax laws limit the amount of these carryforwards we can utilize in any given year upon a greater than 50% cumulative shift of stock ownership over a three-year period, including shifts due to the issuance of additional shares of our common stock, or securities convertible into our common stock. To date, we have not undertaken an analysis of whether any limitation would apply at this time. We may experience subsequent shifts in our stock ownership and, accordingly, there is a risk that our ability to use our existing carryforwards in the future could be limited and that existing carryforwards would be unavailable to offset future income tax liabilities, which could adversely affect our operating results and financial condition.
As a result of becoming a public company, we will be obligated to develop and maintain proper and effective internal control over financial reporting. We have not completed, and may not complete, our analysis of our internal control over financial reporting in a timely manner, or these internal controls may not be determined to be effective, which may adversely affect investor confidence in our company and, as a result, the value of our common stock.
Pursuant to Section 404 of the Sarbanes-Oxley Act, at the time we file our second annual report with the SEC, we will be required to furnish a report by management on, among other things, the effectiveness of our internal control over financial reporting. This assessment will need to include disclosure of any material weaknesses identified by our management in our internal control over financial reporting. We are in the very early stages of the costly process of compiling the system and processing documentation necessary to perform the evaluation needed to comply with Section 404. We may not be able to complete our evaluation, testing and any required remediation in a timely fashion. During the evaluation and testing process, if we identify one or more material weaknesses in our internal control over financial reporting, we will be unable to assert that our internal controls are effective. If we are unable to certify that our internal controls are effective, we could lose investor confidence in the accuracy and completeness of our financial reports, which would cause the price of our common stock to decline, and we may be subject to investigation or sanctions by the SEC. We will be required to disclose changes made in our internal control and procedures on a quarterly basis. However, our independent registered public accounting firm will not be required to report on the effectiveness of our internal control over financial reporting pursuant to Section 404 until the later of the year following our first annual report required to be filed with the SEC, or the date we are no longer an “emerging growth company” as defined in the JOBS Act, if we take advantage of the exemptions contained in the JOBS Act. At such time, our independent registered public accounting firm may issue a report that is adverse in the event it is not satisfied with the level at which our controls are documented, designed or operating. In addition, any remediation efforts we undertake may not be successful or enable us to avoid a material weakness in the future.
Our business is subject to the risks of earthquakes, fire, floods and other natural catastrophic events, and to interruption by manmade problems such as network security breaches, computer viruses or terrorism.
Our corporate headquarters, the manufacturing facilities of some of our suppliers, as well as our contract manufacturer’s current manufacturing facility for our Z-Series platforms, are all located in the San Francisco Bay Area, a region known for seismic activity. A significant natural disaster, such as an earthquake, a fire or a flood, occurring near our headquarters, or near the facilities of our suppliers or contract manufacturer, could have an adverse effect on our business, operating results and financial condition. Despite our implementation of network security measures, our networks and outside data center, by which we provide our Blue Planet platform, also may be vulnerable to computer viruses, break-ins and similar disruptions from unauthorized tampering with our products. In addition, natural disasters, acts of terrorism or war could cause disruptions in our or our customers’ businesses, our
29
Table of Contents
suppliers’ and contract manufacturers’ operations or the economy as a whole. We also rely on information technology systems to communicate among our workforce and with third parties. Any disruption to our communications, whether caused by a natural disaster or by manmade problems, such as power disruptions, could adversely affect our business. To the extent that any such disruptions result in delays or cancellations of customer orders or impede our suppliers’ and contract manufacturer’s ability to timely deliver our solutions and components, the deployment of our solutions and our business, operating results and financial condition would be adversely affected.
Risks Relating to This Offering and Owning Our Common Stock
An active trading market for our common stock may never develop or be sustained, which may make it difficult for you to sell your shares at an attractive price, or at all.
Prior to this offering, there has been no public market for our common stock. We cannot predict the extent to which investor interest in us will lead to the development of an active trading market in our common stock or how liquid that market might become. An active public market for our common stock may not develop or be sustained after the offering. If an active public market for our common stock does not develop or is not sustained, it may be difficult for you to sell your shares of common stock at a price that is attractive to you, or at all. The market price for shares of our common stock may decline below the initial public offering price, and you may not be able to resell your shares of common stock at or above the initial public offering price. If the stock market in general experiences a loss of investor confidence, the trading price of our common stock could decline for reasons unrelated to our business, operating results or financial condition.
Our share price may be volatile, and you may be unable to sell your shares at or above the offering price.
Technology stocks, including those of companies in the network industry, have historically experienced high levels of volatility. The trading price of our common stock is likely to be highly volatile and could be subject to wide fluctuations in response to various factors, some of which are beyond our control and may not be related to our operating performance. This volatility may be enhanced by the relatively limited number of shares of our common stock trading publicly following the offering. These fluctuations could cause you to lose all or part of your investment in our common stock. Factors that may cause the market price of our common stock to fluctuate include:
| Ÿ | price and volume fluctuations in the overall stock market from time to time; |
| Ÿ | significant volatility in the market price and trading volume of technology companies in general, and of companies in the network industry in particular; |
| Ÿ | actual or anticipated changes in our operating results or fluctuations in our operating results; |
| Ÿ | actual or anticipated changes in the expectations of investors or securities analysts, and whether our operating results meet these expectations; |
| Ÿ | new product or service introductions and market demand for these and our existing solutions; |
| Ÿ | failure to meet investor expectations as a result of the timing of large customer orders; |
| Ÿ | actual or anticipated developments in our competitors’ businesses or the competitive landscape generally; |
| Ÿ | litigation involving us, our industry or both; |
| Ÿ | regulatory developments in the United States, foreign countries or both; |
| Ÿ | general economic conditions and trends; |
| Ÿ | major catastrophic events; |
30
Table of Contents
| Ÿ | sales of large blocks of our stock; or |
| Ÿ | departures of key personnel. |
In addition, if either the market for technology stocks or the stock market in general experiences a loss of investor confidence, the trading price of our common stock could decline for reasons unrelated to our business, operating results or financial condition. The trading price of our common stock might also decline in reaction to events that affect other companies in the network industry even if these events do not directly affect us.
In the past, following periods of volatility in the market price of a company’s securities, securities class action litigation has often been brought against that company. If our stock price is volatile, we may become the target of securities litigation. Securities litigation could result in substantial costs and divert our management’s attention and resources from our business, and this could have an adverse effect on our business, operating results and financial condition.
Sales of outstanding shares of our common stock into the market in the future could cause the market price of our common stock to drop significantly.
If our existing stockholders sell, or indicate an intent to sell, substantial amounts of our common stock in the public market after the contractual lock-up and other legal restrictions on resale lapse, the trading price of our common stock could decline. After this offering, approximately 44,531,318 shares of common stock will be outstanding. Of these shares, the shares of our common stock to be sold in this offering pursuant to this prospectus will be freely tradable, unless such shares are held by “affiliates,” as that term is defined in Rule 144 of the Securities Act of 1933, as amended, or the Securities Act.
Our directors, officers and holders of substantially all of our common stock and securities convertible into our common stock are subject to a 180-day contractual lock-up that prevents them from selling their shares prior to the expiration of this lock-up period. Goldman, Sachs & Co. and J.P. Morgan Securities LLC may, in their sole discretion, permit shares subject to this lock-up to be released from this restriction and sold prior to its expiration. After the expiration (or prior release, if applicable) of the 180-day restricted period, these shares may be sold in the public market in the United States, subject to prior registration in the United States, if required, or reliance upon an exemption from U.S. registration, including, in the case of shares held by affiliates or control persons, compliance with the volume restrictions of Rule 144.
| Number of Shares and % of Total |
Date Available for Sale Into Public Markets | |
| 8,000,000 or 18.0% |
Immediately after this offering | |
| 36,531,318 or 82.0% |
From time to time after the date 180 days after the date of this prospectus due to contractual obligations and lock-up agreements, upon expiration of their respective holding periods under Rule 144. However, the underwriters can waive the provisions of these lock-up agreements and allow these stockholders to sell their shares at any time, provided their respective holding periods under Rule 144 have expired. | |
See the section titled “Shares Eligible for Future Sale—Lock-Up Agreements” for additional information.
In addition, as of March 31, 2013, upon the consummation of this offering, options to purchase 4,811,203 shares of our common stock will be reserved for future issuance under our 2013 Equity
31
Table of Contents
Incentive Plan. If these additional shares are sold, or if it is perceived that they will be sold, in the public market, the trading price of our common stock could decline, potentially significantly. See the section titled “Shares Eligible for Future Sale” for additional information.
If you purchase shares of our common stock in this offering, you will experience substantial and immediate dilution.
If you purchase shares of our common stock in this offering, you will experience substantial and immediate dilution of $8.90 per share, based on an assumed initial public offering price of $11.00 per share, which is the midpoint of the price range set forth on the cover page of this prospectus, because the price that you pay will be substantially greater than the net tangible book value per share of the common stock that you acquire. This dilution is due in large part to the fact that our founders and earlier investors paid substantially less than the initial public offering price when they purchased their shares of our capital stock. In addition, investors who purchase shares in this offering will contribute approximately 47.0% of the total amount of equity capital raised by us through the date of this offering, but will only own approximately 18.0% of our outstanding shares. We have also issued options to acquire our common stock at prices significantly below the initial public offering price. To the extent outstanding options are ultimately exercised, there will be further dilution to investors in this offering.
If securities analysts do not publish research or reports about our business, or if they downgrade our stock, the price of our stock could decline.
The trading market for our common stock could be influenced by any research and reports that securities or industry analysts publish about us or our business. We do not currently have, and may never obtain, research coverage by securities and industry analysts. If no securities or industry analysts commence coverage of our company, the trading price for our stock would be negatively affected. In the event securities or industry analysts cover our company and one or more of these analysts downgrade our stock or publish unfavorable research about our business, our stock price could decline. If one or more of these analysts cease coverage of our company or fail to publish reports on us regularly, demand for our stock could decrease, which could cause our stock price and trading volume to decline.
The concentration of ownership among our existing directors, executive officers and principal stockholders will provide them, collectively, with substantial control over us after this offering, which could limit your ability to influence the outcome of key transactions, including a change of control.
Our directors, executive officers and each of our stockholders who own greater than 5% of our outstanding common stock and their affiliates, in the aggregate, will beneficially own approximately 64.6% of the outstanding shares of our common stock after this offering, based on the number of shares outstanding as of March 31, 2013. As a result, these stockholders, if acting together, will be able to influence or control matters requiring approval by our stockholders, including the election of directors and the approval of mergers, acquisitions or other extraordinary transactions. They may also have interests that differ from yours and may vote in a way with which you disagree and which may be adverse to your interests. This concentration of ownership may have the effect of delaying, preventing or deterring a change of control of our company, could deprive our stockholders of an opportunity to receive a premium for their common stock as part of a sale of our company and might ultimately affect the market price of our common stock.
32
Table of Contents
We have broad discretion in the use of the net proceeds that we receive in this offering.
The principal purposes of this offering are to increase our financial flexibility, improve our visibility in the marketplace, create a public market for our common stock and facilitate our future access to the public equity markets. We have not yet determined the specific allocation of the net proceeds that we receive in this offering, but we expect to use the net proceeds that we will receive from this offering for working capital and other general corporate purposes, including the expansion of our sales organization, overseas expansion, primarily through channel partners and further development and expansion of our solutions. We may also use a portion of the net proceeds that we receive to acquire or invest in complementary businesses, products, services, technologies or other assets. Our management will have broad discretion over the specific use of the net proceeds that we receive in this offering and might not be able to obtain a significant return, if any, on investment of these net proceeds. Investors in this offering will need to rely upon the judgment of our management with respect to the use of proceeds.
The requirements of being a public company will subject us to increased costs and may strain our resources.
As a public company, we will be subject to the reporting requirements of the Securities Exchange Act of 1934, as amended, or the Exchange Act, the Sarbanes-Oxley Act, the Dodd-Frank Act, the listing requirements of the New York Stock Exchange and other applicable securities rules and regulations. Compliance with these rules and regulations will increase our legal, accounting and financial compliance costs, make some activities more difficult, time-consuming or costly and increase demand on our systems and resources, particularly after we are no longer an “emerging growth company,” as defined in the JOBS Act. In addition, rules implemented by the SEC and the New York Stock Exchange require changes in corporate governance practices of public companies. We expect these rules and regulations to increase our legal and financial compliance costs and to make some activities more time-consuming and costly. We expect these rules and regulations to make it more expensive for us to obtain director and officer liability insurance, and we may be required to accept reduced policy limits and coverage or incur substantially higher costs to obtain the same or similar coverage, which may have the effect of making it more difficult for us to attract and retain qualified people to serve on our board of directors or as executive officers.
The Exchange Act requires, among other things, that we file annual, quarterly and current reports with respect to our business and operating results. The Sarbanes-Oxley Act requires, among other things, that we maintain effective disclosure controls and procedures and internal control over financial reporting. In order to maintain and, if required, improve our disclosure controls and procedures and internal control over financial reporting to meet this standard, significant resources and management oversight may be required. As a result, management’s attention may be diverted from other business concerns, which could adversely affect our business and operating results. We will likely need to hire more employees in the future or engage outside consultants to comply with these regulations, which will increase our costs and expenses.
In addition, changing laws, regulations and standards relating to corporate governance and public disclosure are creating uncertainty for public companies, increasing legal and financial compliance costs and making some activities more time consuming. For example, rule making with respect to the Dodd-Frank Act has not yet been completed. These laws, regulations and standards are subject to varying interpretations, in many cases due to their lack of specificity, and, as a result, their application in practice may evolve over time as new guidance is provided by regulatory and governing bodies. This could result in continuing uncertainty regarding compliance matters and higher costs necessitated by ongoing revisions to disclosure and governance practices. We intend to invest resources to comply with evolving laws, regulations and standards, and this investment may result in increased general and
33
Table of Contents
administrative expenses and a diversion of management’s time and attention from revenue-generating activities to compliance activities. If our efforts to comply with new laws, regulations and standards are unsuccessful or differ from the activities intended by regulatory or governing bodies due to ambiguities related to their application and practice, regulatory authorities may initiate legal proceedings against us and our business may be adversely affected.
We are an “emerging growth company” and we cannot be certain if the reduced disclosure requirements applicable to emerging growth companies will make our common stock less attractive to investors.
For as long as we remain an “emerging growth company” under the JOBS Act, we may take advantage of certain exemptions from various reporting requirements that are applicable to public companies that are not “emerging growth companies” including, but not limited to, not being required to comply with the auditor attestation requirements of Section 404, reduced disclosure obligations regarding executive compensation in our periodic reports and proxy statements, and exemptions from the requirements of holding a nonbinding advisory vote on executive compensation and shareholder approval of any golden parachute payments not previously approved. We may take advantage of these reporting exemptions until we are no longer an “emerging growth company.” We would cease to be an “emerging growth company” upon the earliest of:
| Ÿ | the first fiscal year following the fifth anniversary of this offering; |
| Ÿ | the first fiscal year after our annual gross revenue is $1.0 billion or more; |
| Ÿ | the date on which we have, during the previous three-year period, issued more than $1.0 billion in non-convertible debt securities; or |
| Ÿ | the end of any fiscal year in which the market value of our common stock held by non-affiliates exceeded $700 million as of the end of the second quarter of that fiscal year. |
We cannot predict if investors will find our common stock less attractive because we may rely on these exemptions. If some investors find our common stock less attractive as a result, there may be a less active trading market for our common stock and our stock price may be more volatile.
In addition, under the JOBS Act, “emerging growth companies” can delay adopting new or revised accounting standards until such time as those standards apply to private companies. We have irrevocably elected not to avail ourselves of this exemption from new or revised accounting standards, and, therefore, we will be subject to the same new or revised accounting standards as other public companies that are not “emerging growth companies.”
We do not intend to pay dividends following the completion of this offering.
We have never declared or paid any dividends on our stock. Following the completion of this offering, we intend to retain any earnings to finance the operation and expansion of our business, and we do not anticipate paying any cash dividends for the foreseeable future. In addition, our loan facility contains restrictions on our ability to declare and pay cash dividends on our capital stock. As a result, you may only receive a return on your investment in our common stock if the market price of our common stock increases.
34
Table of Contents
Provisions in our amended and restated certificate of incorporation and amended and restated bylaws and under Delaware law might discourage, delay or prevent a change of control of our company or changes in our management and, therefore, depress the trading price of our common stock.
Our amended and restated certificate of incorporation and amended and restated bylaws, each to be in effect upon the completion of this offering, contain provisions that could depress the trading price of our common stock by acting to discourage, delay or prevent a change of control of our company or changes in our management that the stockholders of our company may deem advantageous. These provisions:
| Ÿ | establish a classified board of directors so that not all members of our board of directors are elected at one time; |
| Ÿ | authorize the issuance of “blank check” preferred stock that our board of directors could issue to increase the number of outstanding shares to discourage a takeover attempt; |
| Ÿ | prohibit stockholder action by written consent, which requires all stockholder actions to be taken at a meeting of our stockholders; |
| Ÿ | prohibit stockholders from calling a special meeting of our stockholders; |
| Ÿ | provide that the board of directors is expressly authorized to make, alter or repeal our bylaws; and |
| Ÿ | establish advance notice requirements for nominations for elections to our board of directors or for proposing matters that can be acted upon by stockholders at stockholder meetings. |
Additionally, we are subject to Section 203 of the Delaware General Corporation Law, which generally prohibits a Delaware corporation from engaging in any of a broad range of business combinations with any “interested” stockholder for a period of three years following the date on which the stockholder became an “interested” stockholder and which may discourage, delay or prevent a change of control of our company.
Any provision of our amended and restated certificate of incorporation or amended and restated bylaws, to be in effect upon the completion of this offering, or Delaware law that has the effect of delaying or deterring a change in control could limit the opportunity for our stockholders to receive a premium for their shares of our common stock, and could also affect the price that some investors are willing to pay for our common stock.
35
Table of Contents
SPECIAL NOTE REGARDING FORWARD-LOOKING STATEMENTS
This prospectus contains forward-looking statements within the meaning of the federal securities laws, which statements involve substantial risks and uncertainties. Forward-looking statements generally relate to future events or our future financial or operating performance. In some cases you can identify forward-looking statements because they contain words such as “may,” “will,” “should,” “expects,” “plans,” “anticipates,” “could,” “intends,” “target,” “projects,” “contemplates,” “believes,” “estimates,” “predicts,” “potential” or “continue” or the negative of these words or other similar terms or expressions that concern our expectations, strategy, plans or intentions. Forward-looking statements contained in this prospectus include, but are not limited to, statements about:
| Ÿ | our future financial performance, including our expectations regarding our revenue, cost of revenue, gross profit or gross margin, operating expenses, ability to generate cash flow, and ability to achieve, and maintain, future profitability; |
| Ÿ | anticipated trends, growth rates and challenges in our business and in the markets in which we operate; |
| Ÿ | market acceptance of our recently introduced Blue Planet solution and its effect on our product mix and financials; |
| Ÿ | the impact of seasonality on our business; |
| Ÿ | our anticipated growth and growth strategies and our ability to effectively manage that growth; |
| Ÿ | maintaining and expanding our customer base and our relationships with our channel partners; |
| Ÿ | our ability to anticipate market needs and develop new and enhanced products and services to meet those needs, and our ability to successfully monetize them; |
| Ÿ | our ability to hire necessary qualified employees to expand our operations; |
| Ÿ | our reliance on our third-party manufacturers and component suppliers; |
| Ÿ | the evolution of technology affecting our products, services and markets; |
| Ÿ | our ability to adequately protect our intellectual property; |
| Ÿ | our liquidity and working capital requirements; |
| Ÿ | our spending of the net proceeds from this offering; |
| Ÿ | our ability to stay abreast of new or modified laws and regulations that currently apply or become applicable to our business both in the United States and internationally; |
| Ÿ | the estimates and estimate methodologies used in preparing our consolidated financial statements and determining option exercise prices; |
| Ÿ | the future trading prices of our common stock and the impact of securities analysts’ reports on these prices; and |
| Ÿ | our ability to sell our products and expand internationally. |
We caution you that the foregoing list may not contain all of the forward-looking statements made in this prospectus.
You should not rely upon forward-looking statements as predictions of future events. We have based the forward-looking statements contained in this prospectus primarily on our current expectations and projections about future events and trends that we believe may affect our business, financial condition, operating results and growth prospects. The outcome of the events described in these forward-looking statements is subject to risks, uncertainties and other factors described in the
36
Table of Contents
section titled “Risk Factors” and elsewhere in this prospectus. Moreover, we operate in a very competitive and rapidly changing environment. New risks and uncertainties emerge from time to time, and it is not possible for us to predict all risks and uncertainties that could have an impact on the forward-looking statements contained in this prospectus. We cannot assure you that the results, events and circumstances reflected in the forward-looking statements will be achieved or occur, and actual results, events or circumstances could differ materially from those described in the forward-looking statements.
The forward-looking statements made in this prospectus relate only to events as of the date on which the statements are made. We undertake no obligation to update any forward-looking statements made in this prospectus to reflect events or circumstances after the date of this prospectus or to reflect new information or the occurrence of unanticipated events, except as required by law. We may not actually achieve the plans, intentions or expectations disclosed in our forward-looking statements and you should not place undue reliance on our forward-looking statements. Our forward-looking statements do not reflect the potential impact of any future acquisitions, mergers, dispositions, joint ventures or investments we may make.
37
Table of Contents
This prospectus contains estimates and other statistical data, including those relating to our industry and the market in which we operate, that we have obtained or derived from industry publications and reports, including reports from ACG Research, Gartner, Inc. and International Data Corporation, or IDC. These industry publications and reports generally indicate that they have obtained their information from sources believed to be reliable, but do not guarantee the accuracy and completeness of their information. This information involves a number of assumptions, limitations and estimates, and there is no assurance that any of them will be reached. Based on our industry experience, we believe that the publications and reports are reliable and that the conclusions contained in the publications and reports are reasonable. The industry in which we operate is subject to a high degree of uncertainty and risk due to a variety of factors, including those described in “Risk Factors.” These and other factors could cause our actual results to differ materially from those expressed in the industry publications and reports.
The Gartner Reports described herein represent data, research opinion or viewpoints published as part of a syndicated subscription service, by Gartner, and are not representations of fact. Each Gartner Report speaks as of its original publication date (and not as of the date of this prospectus) and the opinions expressed in the Gartner Reports are subject to change without notice.
In certain instances the sources of the industry and market data contained in this prospectus are identified by superscript notations. The sources of these data are provided below:
| (1) | ACG Research Forecast, Optical Networking, 2H 2012 Worldwide and ACG Research Forecast, Carrier Routing & Switching, Q4 2011 Worldwide. |
| (2) | Gartner, Market Trends: Mobile Data and Video Traffic, 2012, Market Analysis and Statistics, G00237896, dated August 28, 2012, by Jessica Ekholm. |
| (3) | Gartner, Forecast Analysis: Enterprise Network Services, Worldwide, 2009-2016, 4Q12 Update, Market Analysis and Statistics, G00231698, dated December 14, 2012, by Daniel O’Connell, Nhat Pham, Kenshi Tazaki, Lisa Unden-Farbound, Katja Ruud, To Chee Eng, Lydia Leong, Vincent Fu, Elia San Miguel and Fernando Elizalde. |
| (4) | IDC—Press Release, September 26, 2012: “IDC Expects Smart Connected Device Shipments to Grow by 14% Annually Through 2016, Led by Tablets and Smartphones.” |
| (5) | IDC, Worldwide User-Generated Video Content and Archive 2012-2016 Forecast: The Video Bible, IDC #235421, June 2012. |
38
Table of Contents
We estimate that the net proceeds to us from the sale of shares of our common stock in this offering will be approximately $78.3 million, based on an assumed initial public offering price of $11.00 per share, which is the midpoint of the estimated offering price range set forth on the cover page of this prospectus, after deducting estimated underwriting discounts and commissions and estimated offering expenses. If the underwriters’ option to purchase additional shares from us is exercised in full, we estimate that our net proceeds would be approximately $90.5 million, after deducting estimated underwriting discounts and commissions and estimated offering expenses.
Each $1.00 increase or decrease in the assumed initial public offering price of $11.00 per share, which is the midpoint of the estimated offering price range set forth on the cover page of this prospectus, would increase or decrease the net proceeds that we receive from this offering by approximately $7.4 million, assuming that the number of shares offered by us, as set forth on the cover page of this prospectus, remains the same, and after deducting estimated underwriting discounts and commissions. Similarly, each increase or decrease of one million shares in the number of shares of common stock offered by us would increase or decrease the net proceeds that we receive from this offering by approximately $10.2 million, assuming the assumed initial public offering price remains the same and after deducting estimated underwriting discounts and commissions.
The principal purposes of this offering are to increase our financial flexibility, improve brand awareness, create a public market for our common stock and facilitate our future access to the public capital markets. We expect to use the net proceeds that we will receive from this offering for working capital and other general corporate purposes, including the expansion of our sales organization, overseas expansion, primarily through channel partners, and further development and expansion of our solutions. We may also use a portion of the net proceeds that we receive to acquire or invest in complementary businesses, products, services, technologies or other assets. We have not entered into any agreements or commitments with respect to any acquisitions or investments at this time.
We cannot specify with certainty all of the particular uses of the net proceeds that we will receive from this offering. Accordingly, we will have broad discretion in using these proceeds. Furthermore, the amount and timing of our actual expenditures will depend on numerous factors, including the cash used in or generated by our operations, the status of our development, the level of our sales and marketing activities, the pace of our international expansion plans, and our investments and acquisitions. Pending the use of proceeds from this offering as described above, we plan to invest the net proceeds that we receive in this offering in short-term and intermediate-term interest-bearing obligations, investment-grade investments, certificates of deposit or direct or guaranteed obligations of the U.S. government. We cannot predict whether the invested proceeds will yield a favorable return.
We have never declared or paid cash dividends on our common stock. We currently intend to retain all available funds and any future earnings for use in the operation of our business and do not anticipate paying any dividends on our common stock in the foreseeable future. Any future determination to declare dividends will be made at the discretion of our board of directors and will depend on our financial condition, operating results, capital requirements, general business conditions and other factors that our board of directors may deem relevant. In addition, our loan facility contains restrictions on our ability to declare and pay cash dividends on our capital stock.
39
Table of Contents
The following table sets forth our cash and cash equivalents and capitalization as of March 31, 2013 on:
| Ÿ | an actual basis; |
| Ÿ | a pro forma basis, giving effect to (i) the automatic conversion of all outstanding shares of our redeemable convertible preferred stock into 33,897,005 shares of our common stock immediately prior to the closing of this offering, (ii) the reclassification of the preferred stock warrant liability of $8.3 million as of March 31, 2013 into additional paid-in capital, and (iii) the filing of our amended and restated certificate of incorporation in Delaware, which will occur in connection with the completion of this offering; and |
| Ÿ | a pro forma as adjusted basis, giving effect to the pro forma adjustments set forth above and the sale by us of 8,000,000 shares of our common stock offered by this prospectus at an assumed initial public offering price of $11.00 per share, which is the midpoint of the estimated offering price range set forth on the cover page of this prospectus, after deducting estimated underwriting discounts and commissions and estimated offering expenses of approximately $3.6 million (of which approximately $1.7 million of offering costs have already been paid by us and approximately $0.5 million of offering costs were included in accounts payable and accrued liabilities as of March 31, 2013). |
You should read the information in this table together with the section titled “Management’s Discussion and Analysis of Financial Condition and Results of Operations” and our consolidated financial statements and related notes included elsewhere in this prospectus.
| As of March 31, 2013 | ||||||||||||
| Actual | Pro Forma | Pro Forma As Adjusted(1) |
||||||||||
| (in thousands, except share and per share data) |
||||||||||||
| Cash and cash equivalents |
$ | 14,007 | $ | 14,007 | $ | 93,932 | ||||||
|
|
|
|
|
|
|
|||||||
| Total debt |
$ | 12,563 | $ | 12,563 | $ | 12,563 | ||||||
|
|
|
|
|
|
|
|||||||
| Redeemable convertible preferred stock, $0.0001 par value, 35,031,602 shares authorized; 33,897,005 shares issued and outstanding, actual; no shares authorized, issued and outstanding, pro forma and pro forma as adjusted |
98,133 | — | — | |||||||||
| Stockholders’ equity: |
||||||||||||
| Common stock, $0.0001 par value, 50,000,000 shares authorized, actual, and 1,000,000,000 shares authorized pro forma and pro forma as adjusted; 2,634,313, 36,531,318 and 44,531,318 shares issued and outstanding, actual, pro forma and pro forma as adjusted |
— | 4 | 4 | |||||||||
| Additional paid-in capital |
4,639 | 111,020 | 189,293 | |||||||||
| Accumulated other comprehensive loss |
(32 | ) | (32 | ) | (32 | ) | ||||||
| Accumulated deficit |
(95,900 | ) | (95,900 | ) | (95,900 | ) | ||||||
|
|
|
|
|
|
|
|||||||
| Total stockholders’ equity (deficit) |
(91,293 | ) | 15,092 | 93,365 | ||||||||
|
|
|
|
|
|
|
|||||||
| Total capitalization |
$ | 19,403 | $ | 27,655 | $ | 105,928 | ||||||
|
|
|
|
|
|
|
|||||||
| (1) | Each $1.00 increase or decrease in the assumed initial public offering price of $11.00 per share, which is the midpoint of the estimated offering price range set forth on the cover page of this prospectus, would increase or decrease each of cash |
40
Table of Contents
| and cash equivalents, additional paid-in capital, total stockholders’ equity (deficit) and total capitalization by approximately $7.4 million, assuming the number of shares offered by us, as set forth on the cover page of this prospectus, remains the same, and after deducting estimated underwriting discounts and commissions. Similarly, each increase or decrease of one million shares in the number of shares offered by us would increase or decrease, as applicable, cash and cash equivalents, additional paid-in capital, total stockholders’ equity (deficit) and total capitalization by approximately $10.2 million, assuming an initial public offering price of $11.00 per share, which is the midpoint of the estimated offering price range set forth on the cover page of this prospectus, and after deducting estimated underwriting discounts and commissions. The pro forma as adjusted information discussed above is illustrative only and will change based on the actual initial public offering price and other terms of this offering determined at pricing. |
The outstanding share information in the table above is based on 36,531,318 shares of common stock (including redeemable convertible preferred stock on an as-converted basis) outstanding as of March 31, 2013, and excludes:
| Ÿ | 11,184,817 shares of common stock issuable upon the exercise of options to purchase common stock that were outstanding as of March 31, 2013, with a weighted-average exercise price of $3.18 per share; |
| Ÿ | 1,009,597 shares of common stock issuable upon the exercise of warrants outstanding as of March 31, 2013, with a weighted-average exercise price of $2.34 per share (of which warrants to purchase 894,596 shares of redeemable convertible preferred stock will either be exercised or terminated immediately prior to the completion of this offering); |
| Ÿ | 4,811,203 additional shares of common stock, subject to increase on an annual basis, reserved for future issuance under our 2013 Equity Incentive Plan, which will become effective in connection with the completion of this offering, consisting of: |
| Ÿ | 3,600,000 shares of common stock reserved for future grant or issuance under our 2013 Equity Incentive Plan, which will become effective in connection with the completion of this offering; and |
| Ÿ | 1,211,203 shares of common stock reserved for future issuance under our 2006 Stock Plan, which shares will be added to the shares of common stock to be reserved under our 2013 Equity Incentive Plan upon its effectiveness. |
41
Table of Contents
If you invest in our common stock in this offering, your interest will be diluted to the extent of the difference between the initial public offering price per share of our common stock and the pro forma as adjusted net tangible book value per share of our common stock immediately after this offering. Net tangible book value dilution per share to new investors represents the difference between the amount per share paid by purchasers of shares of common stock in this offering and the pro forma as adjusted net tangible book value per share of common stock immediately after completion of this offering.
Net tangible book value per share is determined by dividing our total tangible assets less our total liabilities by the number of shares of common stock outstanding. Our historical net tangible book value as of March 31, 2013 was $(93.4 million), or $(35.47) per share. Our pro forma net tangible book value as of March 31, 2013 was $13.0 million, or $0.35 per share, based on the total number of shares of our common stock outstanding as of March 31, 2013, after giving pro forma effect to the conversion of all outstanding shares of redeemable convertible preferred stock into shares of common stock, which will occur upon the completion of this offering and the resulting reclassification of the preferred stock warrant liability to additional paid-in capital.
After giving effect to the sale by us of 8,000,000 shares of our common stock in this offering at the assumed initial public offering price of $11.00 per share, which is the midpoint of the estimated offering price range set forth on the cover page of this prospectus, after deducting estimated underwriting discounts and commissions and estimated offering expenses, our pro forma as adjusted net tangible book value as of March 31, 2013 would have been approximately $93.4 million, or $2.10 per share. This represents an immediate increase in pro forma net tangible book value of $1.75 per share to our existing stockholders and an immediate dilution of $8.90 per share to investors purchasing shares of common stock in this offering at the assumed initial public offering price.
The following table illustrates this dilution:
| Assumed initial public offering price per share |
$ | 11.00 | ||||||
| Pro forma net tangible book value per share as of March 31, 2013 |
$ | 0.35 | ||||||
| Increase in pro forma net tangible book value per share attributable to new investors in this offering |
1.75 | |||||||
|
|
|
|||||||
| Pro forma net tangible book value per share immediately after this offering |
$ | 2.10 | ||||||
|
|
|
|||||||
| Dilution in pro forma net tangible book value per share to new investors in this offering |
$ | 8.90 | ||||||
|
|
|
Each $1.00 increase or decrease in the assumed initial public offering price of $11.00 per share, which is the midpoint of the estimated offering price range set forth on the cover page of this prospectus, would increase or decrease, as applicable, our pro forma as adjusted net tangible book value per share by $0.17 and would increase or decrease, as applicable, dilution per share to new investors in this offering by $0.83, assuming that the number of shares offered by us, as set forth on the cover page of this prospectus, remains the same, after deducting estimated underwriting discounts and commissions. In addition, to the extent any outstanding options to purchase common stock are exercised, new investors will experience further dilution.
If the underwriters exercise their option to purchase additional shares from us in full, the pro forma as adjusted net tangible book value per share of our common stock immediately after this offering would be $2.31 per share, and the dilution in pro forma net tangible book value per share to new investors in this offering would be $8.69 per share.
42
Table of Contents
The following table presents on a pro forma as adjusted basis as of March 31, 2013, after giving effect to the conversion of all outstanding shares of redeemable convertible preferred stock into shares of common stock in connection with the completion of this offering, the differences between the existing stockholders and the new investors purchasing shares of our common stock in this offering, with respect to the number of shares purchased from us, the total consideration paid or to be paid to us, giving effect to the assumed initial public offering price of $11.00 per share, which is the midpoint of the estimated offering price range set forth on the cover page of this prospectus, before deducting estimated underwriting discounts and commissions and estimated offering expenses.
| Shares Purchased | Total Consideration | Average Price Per Share |
||||||||||||||||||
| Number | Percent | Amount | Percent | |||||||||||||||||
| Existing stockholders |
36,531,318 | 82.0 | % | $ | 99,069,325 | 53.0 | % | $ | 2.71 | |||||||||||
| New investors |
8,000,000 | 18.0 | 88,000,000 | 47.0 | 11.00 | |||||||||||||||
|
|
|
|
|
|
|
|
|
|||||||||||||
| Total |
44,531,318 | 100.0 | % | $ | 187,069,325 | 100.0 | % | $ | 4.20 | |||||||||||
|
|
|
|
|
|
|
|
|
|||||||||||||
Each $1.00 increase or decrease in the assumed initial public offering price of $11.00 per share, which is the midpoint of the estimated price range set forth on the cover page of this prospectus, would increase or decrease the total consideration paid by new investors and total consideration paid by all stockholders by approximately $7.4 million, assuming that the number of shares offered by us, as set forth on the cover page of this prospectus, remains the same, after deducting estimated underwriting discounts and commissions. In addition, to the extent any outstanding options to purchase common stock are exercised, new investors will experience further dilution.
If the underwriters exercise their option to purchase additional shares from us in full, our existing stockholders would own 79.9% and our new investors would own 20.1% of the total number of shares of our common stock outstanding upon the completion of this offering.
The outstanding share information in the table above is based on 36,531,318 shares of common stock (including redeemable convertible preferred stock on an as-converted basis) outstanding as of March 31, 2013, and excludes:
| Ÿ | 11,184,817 shares of common stock issuable upon the exercise of options to purchase common stock that were outstanding as of March 31, 2013, with a weighted-average exercise price of $3.18 per share; |
| Ÿ | 1,009,597 shares of common stock issuable upon the exercise of warrants outstanding as of March 31, 2013, with a weighted-average exercise price of $2.34 per share (of which warrants to purchase 894,596 shares of redeemable convertible preferred stock will either be exercised or terminated immediately prior to the completion of this offering); |
| Ÿ | 4,811,203 additional shares of common stock, subject to increase on an annual basis, reserved for future issuance under our 2013 Equity Incentive Plan, which will become effective in connection with the completion of this offering, consisting of: |
| Ÿ | 3,600,000 shares of common stock reserved for future grant or issuance under our 2013 Equity Incentive Plan, which will become effective in connection with the completion of this offering; and |
| Ÿ | 1,211,203 shares of common stock reserved for future issuance under our 2006 Stock Plan, which shares will be added to the shares of common stock to be reserved under our 2013 Equity Incentive Plan upon its effectiveness. |
43
Table of Contents
SELECTED CONSOLIDATED FINANCIAL DATA
The following selected consolidated financial data should be read in conjunction with “Management’s Discussion and Analysis of Financial Condition and Results of Operations” and our audited consolidated financial statements and related notes that are included elsewhere in this prospectus.
Our consolidated statements of operations data for the years ended December 31, 2010, 2011 and 2012 and our consolidated balance sheet data as of December 31, 2011 and 2012 are derived from our audited consolidated financial statements that are included elsewhere in this prospectus. Our consolidated statements of operations data for the three months ended March 31, 2012 and 2013 and our consolidated balance sheet data as of March 31, 2013 are derived from our unaudited interim consolidated financial statements that are included elsewhere in this prospectus. Our unaudited interim consolidated financial statements were prepared on a basis consistent with our audited consolidated financial statements and include, in our opinion, all adjustments, consisting only of normal recurring adjustments, that we consider necessary for a fair presentation of the financial information set forth in those statements included elsewhere in this prospectus. Our historical results are not necessarily indicative of the results that may be expected in the future, and our interim results are not necessarily indicative of the results that may be expected for the full year or any other period.
| Year Ended December 31, | Three Months Ended March 31, |
|||||||||||||||||||
| 2010 | 2011 | 2012 | 2012 | 2013 | ||||||||||||||||
| (in thousands, except per share data) | ||||||||||||||||||||
| Consolidated Statements of Operations Data: |
||||||||||||||||||||
| Revenue |
$ | 23,484 | $ | 40,421 | $ | 95,872 | $ | 14,187 | $ | 26,319 | ||||||||||
| Cost of revenue(1) |
18,263 | 27,074 | 57,315 | 8,467 | 15,402 | |||||||||||||||
|
|
|
|
|
|
|
|
|
|
|
|||||||||||
| Gross profit |
5,221 | 13,347 | 38,557 | 5,720 | 10,917 | |||||||||||||||
| Operating expenses(1): |
||||||||||||||||||||
| Research and development |
10,430 | 12,986 | 18,447 | 3,552 | 7,239 | |||||||||||||||
| Sales and marketing |
7,919 | 12,825 | 25,243 | 4,774 | 8,017 | |||||||||||||||
| General and administrative |
2,380 | 3,310 | 6,055 | 910 | 2,863 | |||||||||||||||
|
|
|
|
|
|
|
|
|
|
|
|||||||||||
| Total operating expenses |
20,729 | 29,121 | 49,745 | 9,236 | 18,119 | |||||||||||||||
| Loss from operations |
(15,508 | ) | (15,774 | ) | (11,188 | ) | (3,516 | ) | (7,202 | ) | ||||||||||
| Interest expense |
(429 | ) | (419 | ) | (33 | ) | (20 | ) | (126 | ) | ||||||||||
| Other income (expense), net |
(406 | ) | 322 | (5,340 | ) | (356 | ) | (2,001 | ) | |||||||||||
|
|
|
|
|
|
|
|
|
|
|
|||||||||||
| Total other income (expense), net |
(835 | ) | (97 | ) | (5,373 | ) | (376 | ) | (2,127 | ) | ||||||||||
|
|
|
|
|
|
|
|
|
|
|
|||||||||||
| Loss before provision for income taxes |
(16,343 | ) | (15,871 | ) | (16,561 | ) | (3,892 | ) | (9,329 | ) | ||||||||||
| Provision for income taxes |
1 | 14 | 40 | 8 | 21 | |||||||||||||||
|
|
|
|
|
|
|
|
|
|
|
|||||||||||
| Net loss |
$ | (16,344 | ) | $ | (15,885 | ) | $ | (16,601 | ) | $ | (3,900 | ) | $ | (9,350 | ) | |||||
|
|
|
|
|
|
|
|
|
|
|
|||||||||||
| Basic and diluted net loss per share(2) |
$ | (7.54 | ) | $ | (6.63 | ) | $ | (6.60 | ) | $ | (1.60 | ) | $ | (3.61 | ) | |||||
|
|
|
|
|
|
|
|
|
|
|
|||||||||||
| Weighted-average number of shares used in computing basic and diluted net loss per share(2) |
2,167 | 2,396 | 2,515 | 2,441 | 2,593 | |||||||||||||||
|
|
|
|
|
|
|
|
|
|
|
|||||||||||
| Pro forma basic and diluted net loss per share(2) |
$ | (0.31 | ) | $ | (0.20 | ) | ||||||||||||||
|
|
|
|
|
|||||||||||||||||
| Weighted-average number of shares used in computing pro forma basic and diluted net loss per share(2) |
36,412 | 36,490 | ||||||||||||||||||
|
|
|
|
|
|||||||||||||||||
44
Table of Contents
| (1) | Stock-based compensation included in the statements of operations data above was as follows: |
| Year Ended December 31, | Three Months Ended March 31, | |||||||||||||||||||
| 2010 | 2011 | 2012 | 2012 | 2013 | ||||||||||||||||
| (in thousands) | ||||||||||||||||||||
| Cost of revenue |
$ | — | $ | 73 | $ | 57 | $ | 8 | $ | 29 | ||||||||||
| Research and development |
57 | 338 | 745 | 105 | 401 | |||||||||||||||
| Sales and marketing |
66 | 229 | 656 | 90 | 313 | |||||||||||||||
| General and administrative |
72 | 125 | 639 | 49 |
|
319 |
| |||||||||||||
|
|
|
|
|
|
|
|
|
|
|
|||||||||||
| Total stock-based compensation |
$ | 195 | $ | 765 | $ | 2,097 | $ | 252 | $ |
1,062 |
| |||||||||
|
|
|
|
|
|
|
|
|
|
|
|||||||||||
| (2) | See Note 9 to our audited consolidated financial statements for an explanation of the calculations of our basic and diluted net loss per share of common stock and pro forma net loss per share of common stock. |
| As of December 31, | As of March 31, 2013 |
|||||||||||
| 2011 | 2012 | |||||||||||
| (in thousands) | ||||||||||||
| Consolidated Balance Sheet Data: |
||||||||||||
| Cash and cash equivalents |
$ | 25,740 | $ | 20,221 | $ | 14,007 | ||||||
| Working capital |
26,703 | 13,919 | 3,560 | |||||||||
| Property and equipment, net |
3,791 | 6,485 | 7,480 | |||||||||
| Total assets |
43,528 | 70,789 | 63,069 | |||||||||
| Total debt |
45 | 12,563 | 12,563 | |||||||||
| Total deferred revenue |
5,219 | 17,417 | 17,512 | |||||||||
| Preferred stock warrant liability |
900 | 6,254 | 8,252 | |||||||||
| Redeemable convertible preferred stock |
98,133 | 98,133 | 98,133 | |||||||||
| Total stockholders’ deficit |
$ | (68,675 | ) | $ | (83,055 | ) | $ | (91,293 | ) | |||
45
Table of Contents
MANAGEMENT’S DISCUSSION AND ANALYSIS OF
FINANCIAL CONDITION AND
RESULTS OF OPERATIONS
The following discussion and analysis of our financial condition and results of operations should be read in conjunction with our consolidated financial statements and the related notes that are included elsewhere in this prospectus. In addition to historical financial information, the following discussion and analysis contains forward-looking statements that involve risks, uncertainties and assumptions. Our actual results and timing of selected events may differ materially from those anticipated in these forward-looking statements as a result of many factors, including those discussed under “Risk Factors” and elsewhere in this prospectus. See “Special Note Regarding Forward-Looking Statements.”
Overview
We have pioneered innovative carrier-grade networking solutions that transform disparate and inefficient legacy networks into open high-performance networks. Our solutions include high-capacity, multi-layer switching and transport platforms, as well as a carrier-grade software-defined networking platform and applications. We designed our Z-Series platforms to support the multiple concurrent technologies used in regional and metro networks, including both Ethernet-based services as well as optical services. In December 2012, we introduced our Blue Planet platform, a carrier-grade software-defined networking solution purpose-built to address network operator requirements. Blue Planet is the latest implementation of our network virtualization and management software that we first introduced in 2009 to work in combination with our high-capacity, multi-layer switching and transport platforms. Customers may choose to deploy Blue Planet either on a standalone basis or integrated with our Z-Series platforms. Our solutions enable network operators to virtualize their networks, accelerate service delivery and increase scalability and performance, while reducing costs.
We were founded in October 2006 to simplify network operations and to accelerate innovation through a centralized, open, multi-vendor, software orchestration model. We launched our first Z-Series platform in September 2009. In April 2010, we launched CyMS, one of the first multi-layer network management solutions. In December 2012, we launched Blue Planet. To date, sales of our Z-Series platforms have accounted for substantially all of our revenue. Standalone sales of Blue Planet have accounted for an immaterial amount of our revenue to date and are expected to increase only modestly as a portion of our revenue in the near term. However, we expect that the portion of our revenue derived from standalone sales of Blue Planet will increase over the longer term.
Our customers range from service providers to high-performance data center and large, private network operators. Our solutions have been deployed primarily across North America, as well as in Asia and Europe, by over 130 customers, including our top ten customers by revenue in 2012, DukeNet Communications, LLC, Great Plains Communications Inc., Intelleq Communications LLC, Lynx Network Group, Inc., TDS Telecommunications Corporation, US Carrier Telecom, LLC, US Signal Company, LLC, Vision Net, Inc., Windstream Corporation and Zayo Group, LLC.
Historically, our revenue has been derived primarily from customers located in the United States. For the years ended December 31, 2011 and 2012, and the three months ended March 31, 2013, our largest customer was Windstream Corporation, which accounted for approximately 37%, 45% and 47% of our revenue, respectively. No other customer represented greater than 10% of our revenue in any of these periods. Windstream has publically indicated its intention to reduce its overall capital expenditures in 2013. Accordingly, we expect our revenue derived from sales to Windstream to decline in future periods. We also expect our revenue derived from sales to Windstream to decline as a percentage of our revenue in future periods as we expand our customer base both in the United States and internationally.
46
Table of Contents
In addition, approximately 6.9%, 12.3%, 9.3% and 10.0% of our revenue for the years ended December 31, 2010, 2011 and 2012, and the three months ended March 31, 2013, respectively, was attributable to Independent Operating Companies, or IOCs, and other telecommunications network providers that used government-supported loan programs or grants to fund purchases from us. Changes to or elimination of similar government programs have occurred in the past and are likely to occur in the future, especially given the current U.S. federal government fiscal issues. To the extent that any of our customers have received grants or loans under government stimulus programs, but no longer have access to such assistance, they may substantially reduce or curtail future purchases of our solutions.
Revenue from customers located outside of the United States was approximately 1%, 5% and 1% of our revenue for the years ended December 31, 2011 and 2012, and the three months ended March 31, 2013, respectively. We expect the percentage of our revenue derived from international sales to significantly increase in future periods.
Our customers have historically purchased our solutions using a pay-as-you-grow approach that begins with a targeted product purchase to address specific services or portions of their networks and expands over time to additional product purchases as they experience the benefits of our solutions. The sales cycle for a new customer deployment, from the time of prospect qualification to the completion of the first sale, may span multiple quarters. Typically, after we have completed an initial customer deployment, we experience much shorter sales cycles.
We have historically employed a direct sales model. During 2012, we began to transition to a mixed sales channel approach, complementing our direct sales force with a channel distribution strategy, particularly in international markets. We expect to generate a substantial portion of our international sales through this network of channel partners in future periods.
We intend to continue to invest in our sales force, field operations and support capacity, deepen our engagement with our current channel partners and establish relationships with new channel partners to target our existing core markets. We also intend to target additional customer verticals, including large data center networks, governments, cable MSOs and enterprises that build and operate large, private networks.
We outsource the manufacturing of our Z-Series platforms. Our outsourced manufacturing model allows us to scale our business without the significant capital investment and ongoing expenses required to establish and maintain manufacturing operations. Our Z-Series platforms leverage industry standard components, and we work closely with our contract manufacturer and key suppliers to manage the procurement, quality and cost of these components. We seek to maintain an optimal level of finished goods inventory to meet our forecasted sales and unanticipated shifts in sales volume and mix.
We believe that our technological advantages will continue to support our growth and demand for our solutions. However, our business may be affected by future challenging economic conditions, decreased availability of capital for network infrastructure projects, as well as whether the market for Blue Planet develops. In addition, capital spending in our industry is cyclical and sporadic, can change on short notice, and can fluctuate in response to outside factors, such as the availability of government stimulus assistance. As a result, changes in spending behavior in any given quarter or during any economic downturn can reduce our revenue. Spending on network construction, maintenance, expansion and upgrades is also affected by seasonality, delays in the purchasing cycles and reductions in budgets of network operators. Finally, we may face direct and indirect risks as a result of our planned international expansion, including expenses of doing business in multiple jurisdictions, differing regulatory environments, foreign currency fluctuations and varying collection practices.
47
Table of Contents
How We Generate Revenue
We generate revenue primarily from the sales of our Z-Series platforms, subscriptions and licenses to our Blue Planet software-defined networking solutions and various professional service fees.
Cyan Z-Series
Our Z-Series hardware is a family of high-capacity, multi-layer switching and transport platforms. Each Z-Series platform is comprised of a chassis that supports a variety of interchangeable Z-Series line cards to provide a wide range of network applications. Our customers make an initial purchase of chassis and line cards to address their particular network deployment needs, then typically make subsequent purchases of line cards and/or larger chassis as the capacity and service needs of their networks evolve. The majority of our revenue is generated from sales of our Z-Series platforms. We generally recognize product revenue at the time of shipment, provided that all other revenue recognition criteria have been met.
Cyan Blue Planet
In December 2012, we expanded our network virtualization and management software offerings with the commercial launch of Blue Planet. Blue Planet is the latest implementation of the network virtualization and management software that we first introduced in 2009 to work in combination with our Z-Series platforms. Blue Planet is available to customers regardless of whether they have deployed our Z-Series platforms in their networks. Customers may purchase Blue Planet using standard configurations to address common network needs or may customize their implementations by pairing the Blue Planet orchestration layer with their own selection of applications and element adapters. We intend to offer Blue Planet primarily on a software-as-a-service, or SaaS, subscription basis deployed from the cloud. We invoice Blue Planet SaaS customers for the entire contract amount at the start of the subscription term, which will lead to the majority of these invoiced amounts being treated as deferred revenue that will be recognized ratably over the term. In certain cases, we may offer Blue Planet on a perpetual license basis bundled with maintenance and support. In such circumstances, and until we have established vendor-specific objective evidence, or VSOE, of the maintenance and support element of the arrangement, we will invoice Blue Planet license customers for the entire contract amount at the start of the license term, which will lead to the majority of these invoiced amounts being treated as deferred revenue that will be recognized ratably over the term. Given its recent introduction, Blue Planet revenue has been immaterial to date.
CyNOC Professional Services
Our CyNOC offering is a network operations center service through which we monitor, and, in some cases, manage our customers’ multi-vendor networks. Additionally, a number of our customers which maintain their own internal NOC leverage our services as a backup NOC. These services are typically sold to our customers for a one-year term at the time of the initial product sale and renewed on an annual basis thereafter.
Maintenance, Support and Training Services
We offer Cyan PRO professional services, including our CySupport and CyService offerings, to provide a variety of customer service products and support through our technical support engineers as well as through our growing network of authorized and certified channel partners. These services are sold to our customers at the time of the initial product sale, typically for one-year terms that customers may choose to renew for successive annual or multi-year periods.
48
Table of Contents
CySupport is our integrated software maintenance and technical support services package, which provides all essential software and services in one simple and cost-effective package.
CyService encompasses a range of additional professional services to assist our customers with network deployment and installation services. These services are invoiced separately at the time of the initial product sale. We also provide training and other professional services to our end-customers, including services related to the implementation, use, functionality and ongoing maintenance of our products. These services are invoiced separately when the services are delivered.
Deferred Revenue
Our deferred revenue consists of amounts that have been invoiced but that have not yet been recognized as revenue as of the period end, pending completion of the revenue recognition process. Our deferred revenue was $5.2 million, $17.4 million and $17.5 million as of December 31, 2011 and 2012, and March 31, 2013, respectively. The majority of our deferred revenue consists of amounts related to sales of our Z-Series platforms, and relates primarily to shipped and billed hardware awaiting customer acceptance. The remainder consists of subscription and support and maintenance revenue that is recognized ratably over the contractual service period. We monitor our deferred revenue balance because it represents a significant portion of revenue to be recognized in future periods. Over the longer term, we expect that the proportion of our deferred revenue relating to subscriptions under our SaaS model for Blue Planet will increase relative to Z-Series related deferred revenue. In most cases, we expect to invoice our customers for the entire contract amount at the start of the annual term of the Blue Planet subscription, which will lead to the majority of these invoiced amounts being treated as deferred revenue and recognized ratably over the term of the subscription.
Components of Operating Results
Cost of Revenue
Cost of revenue primarily consists of manufacturing costs of our products payable to our contract manufacturer. Our cost of revenue also includes third-party manufacturing and supply chain logistics costs, provisions for excess and obsolete inventory, warranty, hosting costs, certain allocated costs for facilities, depreciation and other expenses associated with logistics and quality control. Additionally, it includes salaries, benefits and stock-based compensation for personnel directly involved with manufacturing, installation, maintenance and support services and the provision of Blue Planet.
Gross Margin
Gross margin, or gross profit as a percentage of revenue, has been and will continue to be affected by a variety of factors. In the near term, we generally expect gross margin to increase modestly as a result of our continued efforts and those of our contract manufacturer to manage our supply chain and raw materials pricing and scale efficiencies in our production model, as well as shifts in product mix from line cards that are more focused on pure optical transport to line cards with packet handling capabilities. In the longer term, we expect that the market adoption of Blue Planet, and the resulting increase in Blue Planet revenue as a percentage of our revenue, will contribute to increases in gross margin. From time to time, however, we may experience lower gross margin in any particular period as a result of large initial deployments. These deployments typically include a significant proportion of lower-margin Z-Series chassis. As our customers expand their networks after large initial deployments, they typically purchase additional higher-margin line cards.
49
Table of Contents
Operating Expenses
Our operating expenses consist of research and development, sales and marketing, and general and administrative expenses. Personnel costs are the most significant component of our operating expenses and consist of salaries, benefits, bonuses, stock-based compensation, and with regard to sales and marketing expense, sales commissions.
Research and Development. Research and development expense consists primarily of personnel and consultant costs. Research and development expense also includes costs for prototypes, product certification, travel, depreciation, recruiting and allocated costs for certain facilities and benefits costs allocated based on headcount. In 2012, we nearly doubled the size of our engineering team, predominantly with software engineers, as we have broadened our focus on Blue Planet. We expect the total dollar amount of research and development expense to increase for the foreseeable future as we continue to invest in our future products and services as described above. Despite the expected increase in our research and development spending, these expenses may fluctuate as a percentage of revenue from period to period based on fluctuations in our revenue and the timing of the significant research and development spending.
Sales and Marketing. Sales and marketing expense consists primarily of personnel costs including commission costs. We expense commission costs as incurred. Sales and marketing expense also includes the costs of trade shows, marketing programs, promotional materials, demonstration equipment, travel, depreciation, recruiting and allocated costs for certain facilities and benefits costs. In 2012, we nearly doubled the size of our sales force, with substantial growth of our sales presence internationally. We expect sales and marketing expense to continue to increase in dollar amount as we increase the size of our sales and marketing organizations to increase touch points with end-customers and to expand our international presence, although our sales and marketing expense may fluctuate as a percentage of revenue from period to period depending on the timing of those expenses.
General and Administrative. General and administrative expense consists of personnel costs as well as costs for professional services. General and administrative personnel include our executive, finance, human resources, IT and legal organizations. Professional services consist primarily of legal, auditing, accounting, and other consulting costs. We expect general and administrative expense to continue to increase for the foreseeable future due to expansion of our finance and legal departments to support our public company reporting requirements, as well as additional legal and accounting fees, insurance, investor relations, and other costs associated with being a public company. Our general and administrative expense may fluctuate as a percentage of revenue from period to period depending on the timing of those expenses.
Interest Expense
Interest expense consists of interest on our notes payable and capital leases as well as amortization of loan fees. In December 2012, we established a new loan facility consisting of a revolving loan facility and a term loan facility governed by a Loan and Security Agreement with Silicon Valley Bank, or SVB. Under the revolving loan facility, we may, from time to time, borrow up to $10.0 million due December 2014 at a floating annual interest rate equal to the greater of 3.25% or the prime rate (3.25% as of March 31, 2013). Under the term loan facility we may, from time to time, borrow up to $5.0 million due 48 months following an advance at an annual interest rate equal to the prime rate plus 0.5%, which will float for the first 12 months of the loan and will be fixed thereafter. Borrowings under the loan facility are secured by a first-priority security interest in our assets, excluding our intellectual property and certain other assets. Borrowings under the loan facility are subject to our compliance with certain negative and affirmative covenants, including financial covenants, covenants relating to our
50
Table of Contents
ability to incur other indebtedness, our maintenance of depository accounts with SVB, our selling assets or entering into change of control transactions, liens on our assets and our ability to pay dividends to our stockholders. As of March 31, 2013, we had drawn down $5.0 million as term loans and $7.6 million as revolving loans under the agreement.
Other Income (Expense), net
Other income (expense), net consists primarily of the change in fair value of our preferred stock warrant liability offset in part by interest income. Preferred stock warrants are classified as a liability on our consolidated balance sheets and their estimated fair value is re-measured at each balance sheet date with the corresponding change recorded within other income (expense), net. If the fair value of our common stock increases, the fair value of preferred stock warrant liability will increase, which will also increase the charges recognized through other income (expense), net. We expect the fair value of preferred stock warrant liability to increase in future periods prior to completion of this offering. Immediately prior to the completion of this offering, warrants to purchase 115,001 shares of our redeemable convertible preferred stock will either be exercised or converted into warrants to purchase 115,001 shares of our common stock, and warrants to purchase 894,596 shares of our redeemable convertible preferred stock will either be exercised or terminated, and as a result, we will no longer be required to mark-to-market the fair value of such warrants.
Provision for Income Taxes
Provision for income taxes consists primarily of federal and state income taxes in the United States and income taxes in foreign jurisdictions in which we conduct business. Due to the uncertainty as to the realization of the benefits of our domestic deferred tax assets (including net operating loss carryforwards and research and development and other tax credits), we have a full valuation allowance reserved against such assets. We expect to maintain this full valuation allowance in the near term. We also expect our provision for income taxes to increase in future years.
As of December 31, 2012, we had $73.7 million of federal and $74.0 million of state net operating loss carryforwards available to reduce future taxable income. These net operating loss carryforwards begin to expire in 2026 for U.S. federal income tax and 2016 for state income tax purposes and may fully expire by 2031. Our ability to use our net operating loss carryforwards to offset any future taxable income may currently, or in the future be subject to limitations in the event that we experience a change of ownership as defined by Section 382 of the Internal Revenue Code of 1986, as amended, or the Internal Revenue Code.
51
Table of Contents
Results of Operations
The following tables set forth our results of operations for the periods presented and as a percentage of our revenue for those periods. The period-to-period comparison of our financial results is not necessarily indicative of our future results.
| Year Ended December 31, | Three Months Ended March 31, |
|||||||||||||||||||
| 2010 | 2011 | 2012 | 2012 | 2013 | ||||||||||||||||
| (in thousands) | ||||||||||||||||||||
| Revenue |
$ | 23,484 | $ | 40,421 | $ | 95,872 | $ | 14,187 | $ | 26,319 | ||||||||||
| Cost of revenue |
18,263 | 27,074 | 57,315 | |
8,467 |
|
15,402 | |||||||||||||
|
|
|
|
|
|
|
|
|
|
|
|||||||||||
| Gross profit |
5,221 | 13,347 | 38,557 | 5,720 | 10,917 | |||||||||||||||
| Operating expenses: |
||||||||||||||||||||
| Research and development |
10,430 | 12,986 | 18,447 | 3,552 | 7,239 | |||||||||||||||
| Sales and marketing |
7,919 | 12,825 | 25,243 | 4,774 | 8,017 | |||||||||||||||
| General and administrative |
2,380 | 3,310 | 6,055 | 910 | 2,863 | |||||||||||||||
|
|
|
|
|
|
|
|
|
|
|
|||||||||||
| Total operating expenses |
20,729 | 29,121 | 49,745 | 9,236 | 18,119 | |||||||||||||||
| Loss from operations |
(15,508 | ) | (15,774 | ) | (11,188 | ) | (3,516 | ) | (7,202 | ) | ||||||||||
| Interest expense |
(429 | ) | (419 | ) | (33 | ) | (20 | ) | (126 | ) | ||||||||||
| Other income (expense), net |
(406 | ) | 322 | (5,340 | ) | (356 | ) | (2,001 | ) | |||||||||||
|
|
|
|
|
|
|
|
|
|
|
|||||||||||
| Total other income (expense), net |
(835 | ) | (97 | ) | (5,373 | ) | (376 | ) | (2,127 | ) | ||||||||||
|
|
|
|
|
|
|
|
|
|
|
|||||||||||
| Loss before provision for income taxes |
(16,343 | ) | (15,871 | ) | (16,561 | ) | (3,892 | ) | (9,329 | ) | ||||||||||
| Provision for income taxes |
1 | 14 | 40 | 8 | 21 | |||||||||||||||
|
|
|
|
|
|
|
|
|
|
|
|||||||||||
| Net loss |
$ | (16,344 | ) | $ | (15,885 | ) | $ | (16,601 | ) | $ | (3,900 | ) | $ | (9,350 | ) | |||||
|
|
|
|
|
|
|
|
|
|
|
|||||||||||
Stock-based compensation included in the statements of operations data above was as follows:
| Year Ended December 31, | Three Months Ended March 31, |
|||||||||||||||||||
| 2010 | 2011 | 2012 | 2012 | 2013 | ||||||||||||||||
| (in thousands) | ||||||||||||||||||||
| Cost of revenue |
$ | — | $ | 73 | $ | 57 | $ | 8 | $ | 29 | ||||||||||
| Research and development |
57 | 338 | 745 | 105 | 401 | |||||||||||||||
| Sales and marketing |
66 | 229 | 656 | 90 | 313 | |||||||||||||||
| General and administrative |
72 | 125 | 639 | 49 | 319 | |||||||||||||||
|
|
|
|
|
|
|
|
|
|
|
|||||||||||
| Total stock-based compensation |
$ | 195 | $ | 765 | $ | 2,097 | $ | 252 | $ | 1,062 | ||||||||||
|
|
|
|
|
|
|
|
|
|
|
|||||||||||
52
Table of Contents
| Year Ended December 31, | Three Months Ended March 31, |
|||||||||||||||||||
| 2010 | 2011 | 2012 | 2012 | 2013 | ||||||||||||||||
| Revenue |
100.0 | % | 100.0 | % | 100.0 | % | 100.0 | % | 100.0 | % | ||||||||||
| Cost of revenue |
77.8 | 67.0 | 59.8 | 59.7 | 58.5 | |||||||||||||||
|
|
|
|
|
|
|
|
|
|
|
|||||||||||
| Gross margin |
22.2 | 33.0 | 40.2 | 40.3 | 41.5 | |||||||||||||||
| Operating expenses: |
||||||||||||||||||||
| Research and development |
44.4 | 32.1 | 19.2 | 25.0 | 27.5 | |||||||||||||||
| Sales and marketing |
33.7 | 31.7 | 26.4 | 33.7 | 30.5 | |||||||||||||||
| General and administrative |
10.1 | 8.2 | 6.3 | 6.4 | 10.9 | |||||||||||||||
|
|
|
|
|
|
|
|
|
|
|
|||||||||||
| Total operating expenses |
88.2 | 72.0 | 51.9 | 65.1 | 68.9 | |||||||||||||||
| Loss from operations |
(66.0 | ) | (39.0 | ) | (11.7 | ) | (24.8 | ) | (27.4 | ) | ||||||||||
| Interest expense |
(1.9 | ) | (1.0 | ) | — | (0.1 | ) | (0.4 | ) | |||||||||||
| Other income (expense), net |
(1.7 | ) | 0.7 | (5.6 | ) | (2.5 | ) | (7.6 | ) | |||||||||||
|
|
|
|
|
|
|
|
|
|
|
|||||||||||
| Total other expense, net |
(3.6 | ) | (0.3 | ) | (5.6 | ) | (2.6 | ) | (8.0 | ) | ||||||||||
|
|
|
|
|
|
|
|
|
|
|
|||||||||||
| Loss before provision for income taxes |
(69.6 | ) | (39.3 | ) | (17.3 | ) | (27.4 | ) | (35.4 | ) | ||||||||||
| Provision for income taxes |
— | — | — | 0.1 | 0.1 | |||||||||||||||
|
|
|
|
|
|
|
|
|
|
|
|||||||||||
| Net loss |
(69.6 | )% | (39.3 | )% | (17.3 | )% | (27.5 | )% | (35.5 | )% | ||||||||||
|
|
|
|
|
|
|
|
|
|
|
|||||||||||
Comparison of the Three Months Ended March 31, 2012 and 2013
Revenue
| Three Months Ended March 31, |
||||||||||||||||
| 2012 | 2013 | Change | ||||||||||||||
| Amount | Amount | Amount | % | |||||||||||||
| ( dollars in thousands) | ||||||||||||||||
| Revenue |
$ | 14,187 | $ | 26,319 | $ | 12,132 | 85.5% | |||||||||
Revenue increased by $12.1 million, or 85.5%, from the three months ended March 31, 2012 to the three months ended March 31, 2013. This increase was attributable to increased unit shipments of our Z-Series platforms. Approximately 99% of our revenue for the three months ended March 31, 2013 was attributable to customers located in the United States. We believe that an improving economy, continued growth in bandwidth demand and increased acceptance of our software-defined networking technology and our high-capacity, multi-layer switching and transport platforms, as an alternative to router-based architecture, contributed to our revenue growth. To drive and support this growing demand and increase our revenue, we increased our sales and marketing headcount from March 31, 2012 to March 31, 2013.
Cost of Revenue, Gross Profit and Gross Margin
| Three Months Ended March 31, |
||||||||||||||||
| 2012 | 2013 | Change | ||||||||||||||
| Amount | Amount | Amount | % | |||||||||||||
| (dollars in thousands) | ||||||||||||||||
| Cost of revenue |
$ | 8,467 | $ | 15,402 | $ | 6,935 | 81.9% | |||||||||
| Gross profit |
$ | 5,720 | $ | 10,917 | $ | 5,197 | 90.9% | |||||||||
| Gross margin |
40.3% | 41.5% | 1.2% | |||||||||||||
53
Table of Contents
Cost of revenue increased by $6.9 million, or 81.9%, from the three months ended March 31, 2012 to the three months ended March 31, 2013, primarily due to the increase in revenue.
Gross profit increased by $5.2 million and gross margin increased by 1.2% from 40.3% to 41.5% from the three months ended March 31, 2012 to the three months ended March 31, 2013. Most of the increase in gross margin was attributable to a decrease in our manufacturing overhead resulting from scale efficiencies as a result of higher volume production. To a lesser extent, the increase in gross margin was positively affected by component and materials cost reductions resulting from a combination of dual sourcing of various components, which enabled us to obtain more favorable component pricing, and volume discounts attributable to the higher volume of component purchases.
Operating Expenses
| Three Months Ended March 31, | ||||||||||||||||||||||||
| 2012 | 2013 | Change | ||||||||||||||||||||||
| Amount | % of revenue |
Amount | % of revenue |
Amount | % | |||||||||||||||||||
| (dollars in thousands) | ||||||||||||||||||||||||
| Research and development |
$ | 3,552 | 25.0% | $ | 7,239 | 27.5% | $ | 3,687 | 103.8% | |||||||||||||||
| Sales and marketing |
4,774 | 33.7% | 8,017 | 30.5% | 3,243 | 67.9% | ||||||||||||||||||
| General and administrative |
910 | 6.4% | 2,863 | 10.9% | 1,953 | 214.6% | ||||||||||||||||||
|
|
|
|
|
|
|
|
|
|
|
|||||||||||||||
| Total operating expenses |
$ | 9,236 | 65.1% | $ | 18,119 | 68.9% | $ | 8,883 | 96.2% | |||||||||||||||
|
|
|
|
|
|
|
|
|
|
|
|||||||||||||||
Research and development expense increased by $3.7 million, or 103.8%, from the three months ended March 31, 2012 to the three months ended March 31, 2013, primarily due to an increase in personnel-related costs of $2.6 million (including a $0.4 million increase in stock-based compensation) resulting from an increase in headcount of 49, primarily to support continued investment in Blue Planet and our Z-Series platforms. Additional components of the increase include an increase in consulting and outside services of $0.5 million, an increase in expensed prototypes and supplies of $0.3 million to support our product development efforts and an increase of $0.1 million in depreciation as a result of current and prior acquisitions of property and equipment.
Sales and marketing expense increased by $3.2 million, or 67.9%, from the three months ended March 31, 2012 to the three months ended March 31, 2013, primarily due to an increase of $2.0 million (including a $0.2 million increase in stock-based compensation) in personnel-related expenses due to the expansion of our sales force. To drive and support increasing revenue, we increased our sales and marketing headcount by 46 from March 31, 2012 to March 31, 2013, representing an increase of 71.4%. As a result of increasing our sales and marketing headcount and international expansion, we also experienced increases in travel and related expenses of $0.4 million and consulting and outside services of $0.2 million for the three months ended March 31, 2013 as compared to the three months ended March 31, 2012.
General and administrative expense increased by $2.0 million, or 214.6%, from the three months ended March 31, 2012 to the three months ended March 31, 2013, primarily due to an increase in headcount of 13, which resulted in increased personnel-related expenses of $0.9 million (including a $0.3 million increase in stock-based compensation) due to the hiring of additional executive and other administrative employees to support our growth. Additional components of the increase included increases in accounting related expenses and legal costs of $0.5 million.
54
Table of Contents
Interest Expense
| Three Months Ended March 31, |
||||||||||||
| 2012 | 2013 | Change | ||||||||||
| Amount | Amount | Amount | ||||||||||
| (in thousands) | ||||||||||||
| Interest expense |
$ | 20 | $ | 126 | $ | 106 | ||||||
Interest expense for the three months ended March 31, 2012 related to our notes payable, which matured and were fully repaid in the first quarter of 2012. Interest expense for the three months ended March 31, 2013 related to obligations under our revolving loans and term loans, which were entered into during December 2012.
Other Income (Expense), Net
| Three Months Ended March 31, |
||||||||||||
| 2012 | 2013 | Change | ||||||||||
| Amount | Amount | Amount | ||||||||||
| (in thousands) | ||||||||||||
| Interest income |
$ | 7 | $ | 2 | $ | (5) | ||||||
| Preferred stock warrant liabilities |
(363) | (1,998) | (1,635) | |||||||||
| Foreign currency |
(1) | (5) | (4) | |||||||||
| Other |
1 | — | (1) | |||||||||
|
|
|
|
|
|
|
|||||||
| Other income (expense), net |
$ | (356) | $ | (2,001) | $ | (1,645) | ||||||
|
|
|
|
|
|
|
|||||||
Other income (expense), net changed from an expense of $0.4 million for the three months ended March 31, 2012 to an expense of $2.0 million for the three months ended March 31, 2013, primarily due to an increase in the quarterly change in value of the preferred stock warrant liabilities of $1.6 million. This change was due to the increase in the underlying valuation of our capital stock.
Comparison of the Years Ended December 31, 2011 and 2012
Revenue
| Year Ended December 31, |
||||||||||||||||
| 2011 | 2012 | Change | ||||||||||||||
| Amount | Amount | Amount | % | |||||||||||||
| (dollars in thousands) | ||||||||||||||||
| Revenue |
$ | 40,421 | $ | 95,872 | $ | 55,451 | 137.2% | |||||||||
Revenue increased by $55.5 million, or 137.2%, from the year ended December 31, 2011 to the year ended December 31, 2012. This increase was attributable to increased unit shipments of our Z-Series platforms. Approximately 95% of our revenue for the year ended December 31, 2012 was attributable to customers located in the United States. We believe that an improving economy, continued growth in bandwidth demand and increased acceptance of our software-defined networking technology and our high-capacity, multi-layer switching and transport platforms, as an alternative to router-based architecture, contributed to our revenue growth. To drive and support this growing demand and increase our revenue, we increased our sales and marketing headcount from December 31, 2011 to December 31, 2012.
55
Table of Contents
Cost of Revenue, Gross Profit and Gross Margin
| Year Ended December 31, |
||||||||||||||||
| 2011 | 2012 | Change | ||||||||||||||
| Amount | Amount | Amount | % | |||||||||||||
| (dollars in thousands) | ||||||||||||||||
| Cost of revenue |
$ | 27,074 | $ | 57,315 | $ | 30,241 | 111.7% | |||||||||
| Gross profit |
$ | 13,347 | $ | 38,557 | $ | 25,210 | 188.9% | |||||||||
| Gross margin |
33.0% | 40.2% | 7.2% | |||||||||||||
Cost of revenue increased by $30.2 million, or 111.7%, from the year ended December 31, 2011 to the year ended December 31, 2012, primarily due to the increase in revenue.
Gross profit increased by $25.2 million and gross margin increased by 7.2% from 33.0% to 40.2% from the year ended December 31, 2011 to the year ended December 31, 2012. Of the 7.2% increase in gross margin, approximately 4% was attributable to improved profitability on sales of our solutions. This improvement was principally due to component and materials cost reductions resulting from a combination of dual sourcing of various components, which enabled us to obtain more favorable component pricing, and volume discounts attributable to the higher volume of component purchases. To a lesser extent, the increase in gross margin was positively affected by a decrease in our manufacturing overhead resulting from scale efficiencies as a result of higher volume production.
Operating Expenses
| Year Ended December 31, | ||||||||||||||||||||||||
| 2011 | 2012 | Change | ||||||||||||||||||||||
| Amount | % of revenue |
Amount | % of revenue |
Amount | % | |||||||||||||||||||
| (dollars in thousands) | ||||||||||||||||||||||||
| Research and development |
$ | 12,986 | 32.1% | $ | 18,447 | 19.2% | $ | 5,461 | 42.1% | |||||||||||||||
| Sales and marketing |
12,825 | 31.7% | 25,243 | 26.4% | 12,418 | 96.8% | ||||||||||||||||||
| General and administrative |
3,310 | 8.2% | 6,055 | 6.3% | 2,745 | 82.9% | ||||||||||||||||||
|
|
|
|
|
|
|
|
|
|
|
|||||||||||||||
| Total operating expenses |
$ | 29,121 | 72.0% | $ | 49,745 | 51.9% | $ | 20,624 | 70.8% | |||||||||||||||
|
|
|
|
|
|
|
|
|
|
|
|||||||||||||||
Research and development expense increased by $5.5 million, or 42.1%, from the year ended December 31, 2011 to the year ended December 31, 2012, primarily due to an increase in personnel-related expenses of $5.0 million (including a $0.4 million increase in stock-based compensation) resulting from an increase in headcount of 37, primarily to support continued investment in Blue Planet and our Z-Series platforms. Additional components of the increase include an increase of $0.3 million in depreciation of property and equipment to support our product development efforts and an increase of $0.8 million in consulting expenses. These increases were offset in part by a $0.8 million decrease in expensed prototypes and supplies.
Sales and marketing expense increased by $12.4 million, or 96.8%, from the year ended December 31, 2011 to the year ended December 31, 2012, primarily due to an increase of $6.4 million (including a $0.4 million increase in stock-based compensation) in personnel-related expenses due to the expansion of our sales force. Sales and marketing headcount increased by 46 from December 31, 2011 to December 31, 2012, representing an increase of 97.9%. As a result of increasing our sales and marketing headcount and international expansion, we also experienced increases in travel and related expenses of $1.8 million and consulting and outside services of $0.9 million for the year ended December 31, 2012 as compared to the year ended December 31, 2011. Commission expenses also increased by $2.1 million for the year ended December 31, 2012 due to the increased revenue for the period.
56
Table of Contents
General and administrative expense increased by $2.7 million, or 82.9%, from the year ended December 31, 2011 to the year ended December 31, 2012, primarily due to an increase in headcount of 11, which resulted in increased personnel-related expenses of $1.8 million (including a $0.5 million increase in stock-based compensation) due to the hiring of additional executive and other administrative employees to support our growth. Additional components included modest increases in accounting related expenses and increased legal costs.
Interest Expense
| Year Ended December 31, |
||||||||||||
| 2011 | 2012 | Change | ||||||||||
| Amount | Amount | Amount | ||||||||||
| (in thousands) | ||||||||||||
| Interest expense |
$ | 419 | $ | 33 | $ | (386 | ) | |||||
Interest expense for 2011 related to our capital leases and notes payable. In the second quarter of 2011, we made final payments on our capital lease obligations. In addition, our notes payable matured and were repaid in the first quarter of 2012, and additional 2012 obligations under our revolving loans and term loans were incurred in late December 2012. As a result, we expect our interest expense to increase in future periods.
Other Income (Expense), Net
| Year Ended December 31, |
||||||||||||
| 2011 | 2012 | Change | ||||||||||
| Amount | Amount | Amount | ||||||||||
| (in thousands) | ||||||||||||
| Interest income |
$ | 14 | $ | 33 | $ | 19 | ||||||
| Preferred stock warrant liabilities |
313 | (5,354 | ) | (5,667 | ) | |||||||
| Foreign currency |
(6 | ) | (20 | ) | (14 | ) | ||||||
| Other |
1 | 1 | — | |||||||||
|
|
|
|
|
|
|
|||||||
| Other income (expense), net |
$ | 322 | $ | (5,340 | ) | $ | (5,662 | ) | ||||
|
|
|
|
|
|
|
|||||||
Other income (expense), net changed from income of $0.3 million for the year ended December 31, 2011 to an expense of $5.3 million for the year ended December 31, 2012, due to the change in value of the preferred stock warrant liabilities of $5.4 million. This change was due to the increase in the underlying valuation of our capital stock, which was partially offset by the decrease in the expected term of the warrant as it comes closer to expiration.
Comparison of the Years Ended December 31, 2010 and 2011
Revenue
| Year Ended December 31, |
||||||||||||||||
| 2010 | 2011 | Change | ||||||||||||||
| Amount | Amount | Amount | % | |||||||||||||
| (dollars in thousands) | ||||||||||||||||
| Revenue |
$ | 23,484 | $ | 40,421 | $ | 16,937 | 72.1% | |||||||||
57
Table of Contents
Revenue increased by $16.9 million, or 72.1%, from the year ended December 31, 2010 to the year ended December 31, 2011. This increase was attributable to increased unit shipments of our Z-Series platforms. Approximately 99% of our revenue for the year ended December 31, 2011 was attributable to customers located in the United States. We believe that an improving economy, continued growth in bandwidth demand and increased acceptance of our software-defined networking technology and our high-capacity, multi-layer switching and transport platforms, as an alternative to router-based architecture, contributed to our revenue growth. To drive and support this growing demand and increase our revenue, we increased our sales and marketing headcount from December 31, 2010 to December 31, 2011.
Cost of Revenue, Gross Profit and Gross Margin
| Year Ended December 31 |
||||||||||||||||
| 2010 | 2011 | Change | ||||||||||||||
| (dollars in thousands) | ||||||||||||||||
| Cost of revenue |
$ | 18,263 | $ | 27,074 | $ | 8,811 | 48.2% | |||||||||
| Gross profit |
$ | 5,221 | $ | 13,347 | $ | 8,126 | 155.6% | |||||||||
| Gross margin |
22.2% | 33.0% | 10.8% | |||||||||||||
Cost of revenue increased by $8.8 million, or 48.2%, from the year ended December 31, 2010 to the year ended December 31, 2011, primarily due to the increase in revenue.
Gross profit increased by $8.1 million and gross margin increased by 10.8% from 22.2% to 33.0% from the year ended December 31, 2010 to the year ended December 31, 2011. Of the 10.8% increase in gross margin, approximately 8% was attributable to improved profitability on sales of our solutions. This improvement was principally due to component and materials cost reductions resulting from a combination of dual sourcing of various components, which enabled us to obtain more favorable component pricing, and volume discounts attributable to the higher volume of component purchases. To a lesser extent, the increase in gross margin was positively affected by a decrease in our manufacturing overhead resulting from scale efficiencies as a result of higher volume production.
Operating Expenses
| Year Ended December 31, | ||||||||||||||||||||||||
| 2010 | 2011 | Change | ||||||||||||||||||||||
| Amount | % of revenue |
Amount | % of revenue |
Amount | % | |||||||||||||||||||
| (dollars in thousands) | ||||||||||||||||||||||||
| Research and development |
$ | 10,430 | 44.4% | $ | 12,986 | 32.1% | $ | 2,556 | 24.5% | |||||||||||||||
| Sales and marketing |
7,919 | 33.7% | 12,825 | 31.7% | 4,906 | 62.0% | ||||||||||||||||||
| General and administrative |
2,380 | 10.1% | 3,310 | 8.2% | 930 | 39.1% | ||||||||||||||||||
|
|
|
|
|
|
|
|
|
|
|
|||||||||||||||
| Total operating expenses |
$ | 20,729 | 88.2% | $ | 29,121 | 72.0% | $ | 8,392 | 40.5% | |||||||||||||||
|
|
|
|
|
|
|
|
|
|
|
|||||||||||||||
Research and development expense increased by $2.6 million, or 24.5%, from the year ended December 31, 2010 to the year ended December 31, 2011, primarily attributable to an increase of $2.9 million in personnel-related expenses due to an increase of research and development headcount of 23 and an increase of $0.4 million in depreciation of equipment to support our product development efforts. These increases were offset in part by a $0.9 million decrease in expensed prototypes and supplies.
58
Table of Contents
Sales and marketing expense increased by $4.9 million, or 62.0%, from the year ended December 31, 2010 to the year ended December 31, 2011, primarily due to an increase of $3.0 million in personnel-related expenses resulting from the sales and marketing headcount increase of 23. As a result of increasing our headcount, we also experienced an increase in travel and related expenses of $0.5 million for the year ended December 31, 2011 as compared to the year ended December 31, 2010. Commission expenses also increased by $0.7 million for the year ended December 31, 2011 as compared to the year ended December 31, 2010 due to increased revenue for the period.
General and administrative expense increased by $0.9 million, or 39.1%, from the year ended December 31, 2010 to the year ended December 31, 2011, primarily due to an increase in headcount as we added personnel in late 2010 and early 2011 to support our growth and infrastructure, which resulted in increased personnel-related expenses of $0.9 million and $0.2 million for increases in legal and insurance costs. These increases were partially offset by decreases of $0.2 million in the use of outside services as we hired additional support staff to manage administrative functions.
Interest Expense
| Year Ended December 31, |
||||||||||||
| 2010 | 2011 | Change | ||||||||||
| Amount | Amount | Amount | ||||||||||
| (in thousands) | ||||||||||||
| Interest expense |
$ | 429 | $ | 419 | $ | (10 | ) | |||||
Interest expense for the years ended December 31, 2010 and 2011 related to our capital leases and notes payable. In the second quarter of 2011, we made final payments on our capital lease obligations.
Other Income (Expense), Net
| Year Ended December 31, |
||||||||||||
| 2010 | 2011 | Change | ||||||||||
| Amount | Amount | Amount | ||||||||||
| (in thousands) | ||||||||||||
| Interest income |
$ | 1 | $ | 14 | $ | 13 | ||||||
| Preferred stock warrant liabilities |
(411 | ) | 313 | 724 | ||||||||
| Foreign currency |
— | (6 | ) | (6 | ) | |||||||
| Other |
4 | 1 | (3 | ) | ||||||||
|
|
|
|
|
|
|
|||||||
| Other income (expense), net |
$ | (406 | ) | $ | 322 | $ | 728 | |||||
|
|
|
|
|
|
|
|||||||
Total other income (expense), net changed from an expense of $0.4 million for the year ended December 31, 2010 to income of $0.3 million for the year ended December 31, 2011, primarily due to the change in value of preferred stock warrant liabilities of $0.7 million. This change was driven by the increase in the underlying valuation of our capital stock.
59
Table of Contents
Quarterly Results of Operations
The following tables set forth selected unaudited quarterly consolidated statements of operations data for each of the quarters indicated. The consolidated financial statements for each of these quarters have been prepared on the same basis as the audited consolidated financial statements included in this prospectus and, in the opinion of management, include all adjustments necessary for the fair presentation of the consolidated results of operations for these periods. You should read this information together with our consolidated financial statements and related notes included elsewhere in this prospectus. These quarterly operating results are not necessarily indicative of the results for any future period.
| Three Months Ended | ||||||||||||||||||||||||||||||||||||
| Mar. 31, 2011 |
June 30, 2011 |
Sept. 30, 2011 |
Dec. 31, 2011 |
Mar. 31, 2012 |
June 30, 2012 |
Sept. 30, 2012 |
Dec. 31, 2012 |
Mar. 31, 2013 |
||||||||||||||||||||||||||||
| (in thousands, except per share data) | ||||||||||||||||||||||||||||||||||||
| Revenue |
$ | 9,288 | $ | 8,419 | $ | 9,594 | $ | 13,120 | $ | 14,187 | $ | 23,069 | $ | 28,843 | $ | 29,773 | $ | 26,319 | ||||||||||||||||||
| Cost of revenue |
6,497 | 5,885 | 6,317 | 8,375 | 8,467 | 13,456 | 17,572 | 17,820 | 15,402 | |||||||||||||||||||||||||||
|
|
|
|
|
|
|
|
|
|
|
|
|
|
|
|
|
|
|
|||||||||||||||||||
| Gross profit |
2,791 | 2,534 | 3,277 | 4,745 | 5,720 | 9,613 | 11,271 | 11,953 | 10,917 | |||||||||||||||||||||||||||
| Operating expenses(1): |
||||||||||||||||||||||||||||||||||||
| Research and development |
2,705 | 3,526 | 3,256 | 3,499 | 3,552 | 3,864 | 4,889 | 6,142 | 7,239 | |||||||||||||||||||||||||||
| Sales and marketing |
2,731 | 3,018 | 3,148 | 3,927 | 4,774 | 5,607 | 6,798 | 8,064 | 8,017 | |||||||||||||||||||||||||||
| General and administrative |
789 | 840 | 796 | 886 | 910 | 1,236 | 1,741 | 2,168 | 2,863 | |||||||||||||||||||||||||||
|
|
|
|
|
|
|
|
|
|
|
|
|
|
|
|
|
|
|
|||||||||||||||||||
| Total operating expenses |
6,225 | 7,384 | 7,200 | 8,312 | 9,236 | 10,707 | 13,428 | 16,374 | 18,119 | |||||||||||||||||||||||||||
|
|
|
|
|
|
|
|
|
|
|
|
|
|
|
|
|
|
|
|||||||||||||||||||
| Loss from operations |
(3,434 | ) | (4,850 | ) | (3,923 | ) | (3,567 | ) | (3,516 | ) | (1,094 | ) | (2,157 | ) | (4,421 | ) | (7,202 | ) | ||||||||||||||||||
|
|
|
|
|
|
|
|
|
|
|
|
|
|
|
|
|
|
|
|||||||||||||||||||
| Other income (expense), net |
(263 | ) | 22 | (36 | ) | 180 | (376 | ) | (374 | ) | (1,041 | ) | (3,582 | ) | (2,127 | ) | ||||||||||||||||||||
|
|
|
|
|
|
|
|
|
|
|
|
|
|
|
|
|
|
|
|||||||||||||||||||
| Loss before provision for income taxes |
(3,697 | ) | (4,828 | ) | (3,959 | ) | (3,387 | ) | (3,892 | ) | (1,468 | ) | (3,198 | ) | (8,003 | ) | (9,329 | ) | ||||||||||||||||||
| Provision for income taxes |
2 | 4 | 3 | 5 | 8 | 9 | 10 | 13 | 21 | |||||||||||||||||||||||||||
|
|
|
|
|
|
|
|
|
|
|
|
|
|
|
|
|
|
|
|||||||||||||||||||
| Net loss |
$ | (3,699 | ) | $ | (4,832 | ) | $ | (3,962 | ) | $ | (3,392 | ) | $ | (3,900 | ) | $ | (1,477 | ) | $ | (3,208 | ) | $ | (8,016 | ) | $ | (9,350 | ) | |||||||||
|
|
|
|
|
|
|
|
|
|
|
|
|
|
|
|
|
|
|
|||||||||||||||||||
| Basic and diluted net loss per share |
$ | (1.59 | ) | $ | (2.03 | ) | $ | (1.63 | ) | $ | (1.39 | ) | $ | (1.60 | ) | $ | (0.59 | ) | $ | (1.26 | ) | $ | (3.13 | ) | $ | (3.61 | ) | |||||||||
|
|
|
|
|
|
|
|
|
|
|
|
|
|
|
|
|
|
|
|||||||||||||||||||
| Weighted-average number of shares used in computing basic and diluted net loss per share |
2,326 | 2,379 | 2,436 | 2,441 | 2,441 | 2,512 | 2,545 | 2,563 | 2,593 | |||||||||||||||||||||||||||
|
|
|
|
|
|
|
|
|
|
|
|
|
|
|
|
|
|
|
|||||||||||||||||||
| (1) | Stock-based compensation included in the statements of operations data above was as follows: |
| Three Months Ended | ||||||||||||||||||||||||||||||||||||
| Mar. 31, 2011 |
June 30, 2011 |
Sept. 30, 2011 |
Dec. 31, 2011 |
Mar. 31, 2012 |
June 30, 2012 |
Sept. 30, 2012 |
Dec. 31, 2012 |
Mar. 31, 2013 |
||||||||||||||||||||||||||||
| (in thousands) | ||||||||||||||||||||||||||||||||||||
| Cost of revenue |
$ | 39 | $ | 25 | $ | 4 | $ | 4 | $ | 8 | $ | 8 | $ | 9 | $ | 32 | $ | 29 | ||||||||||||||||||
| Research and development |
70 | 81 | 91 | 96 | 105 | 116 | 163 | 361 | 401 | |||||||||||||||||||||||||||
| Sales and marketing |
49 | 57 | 60 | 63 | 90 | 113 | 169 | 284 | 313 | |||||||||||||||||||||||||||
| General and administrative |
17 | 34 | 35 | 40 | 49 | 108 | 225 | 257 | 319 | |||||||||||||||||||||||||||
|
|
|
|
|
|
|
|
|
|
|
|
|
|
|
|
|
|
|
|||||||||||||||||||
| Total stock-based compensation |
$ | 175 | $ | 197 | $ | 190 | $ | 203 | $ | 252 | $ | 345 | $ | 566 | $ | 934 | $ | 1,062 | ||||||||||||||||||
|
|
|
|
|
|
|
|
|
|
|
|
|
|
|
|
|
|
|
|||||||||||||||||||
60
Table of Contents
The following table sets forth selected unaudited consolidated statements of operations data as a percentage of revenue for each of the periods indicated.
| Three Months Ended | ||||||||||||||||||||||||||||||||||||
| Mar. 31, 2011 |
June 30, 2011 |
Sept. 30, 2011 |
Dec. 31, 2011 |
Mar. 31, 2012 |
June 30, 2012 |
Sept. 30, 2012 |
Dec. 31, 2012 |
Mar. 31, 2013 |
||||||||||||||||||||||||||||
| Revenue |
100 | % | 100 | % | 100 | % | 100 | % | 100 | % | 100 | % | 100 | % | 100 | % | 100 | % | ||||||||||||||||||
| Cost of revenue |
70 | 70 | 66 | 64 | 60 | 58 | 61 | 60 | 59 | |||||||||||||||||||||||||||
|
|
|
|
|
|
|
|
|
|
|
|
|
|
|
|
|
|
|
|||||||||||||||||||
| Gross margin |
30 | 30 | 34 | 36 | 40 | 42 | 39 | 40 | 41 | |||||||||||||||||||||||||||
| Operating expenses: |
||||||||||||||||||||||||||||||||||||
| Research and development |
29 | 42 | 34 | 26 | 25 | 17 | 17 | 21 | 28 | |||||||||||||||||||||||||||
| Sales and marketing |
29 | 35 | 33 | 30 | 34 | 24 | 23 | 27 | 30 | |||||||||||||||||||||||||||
| General and administrative |
9 | 10 | 8 | 7 | 6 | 5 | 6 | 7 |
|
11 |
| |||||||||||||||||||||||||
|
|
|
|
|
|
|
|
|
|
|
|
|
|
|
|
|
|
|
|||||||||||||||||||
| Total operating expenses |
67 | 87 | 75 | 63 | 65 | 46 | 46 | 55 |
|
69 |
| |||||||||||||||||||||||||
|
|
|
|
|
|
|
|
|
|
|
|
|
|
|
|
|
|
|
|||||||||||||||||||
| Loss from operations |
(37) | (57) | (41) | (27) | (25) | (4) | (7) | (15) | (28) | |||||||||||||||||||||||||||
|
|
|
|
|
|
|
|
|
|
|
|
|
|
|
|
|
|
|
|||||||||||||||||||
| Other income (expense), net |
(3) | — | — | 1 | (3) | (2) | (4) | (12) |
|
(8) |
| |||||||||||||||||||||||||
|
|
|
|
|
|
|
|
|
|
|
|
|
|
|
|
|
|
|
|||||||||||||||||||
| Loss before provision for income taxes |
(40) | (57) | (41) | (26) | (28) | (6) | (11) | (27) | (36) | |||||||||||||||||||||||||||
| Provision for income taxes |
— | — | — | — | — | — | — | — | — | |||||||||||||||||||||||||||
|
|
|
|
|
|
|
|
|
|
|
|
|
|
|
|
|
|
|
|||||||||||||||||||
| Net loss |
(40) | % | (57) | % | (41) | % | (26) | % | (28) | % | (6) | % | (11) | % | (27) | % | (36) | % | ||||||||||||||||||
|
|
|
|
|
|
|
|
|
|
|
|
|
|
|
|
|
|
|
|||||||||||||||||||
Quarterly Revenue Trends
Our quarterly revenue increased year-over-year for all periods presented. We believe that comparisons of our year-over-year quarterly revenue are more meaningful than comparisons of our sequential results due to seasonality in the sale of our products and services to varying degrees. We generally expect an increase in business activity as we approach December, as some of our customers accelerate spending to use remaining capital budget dollars. Similarly, we generally expect a decrease in business activity in our first quarter, as many of our customers develop and finalize their spending budgets for the year. From time to time, however, customers may place large orders that may significantly impact sequential trends. For example, in our quarter ended March 31, 2011, we had a large order with one customer that led to strong growth in our revenue for the quarter. The lack of a similar sized order contributed to a decline in revenue on a sequential basis in the following quarter ended June 30, 2011. While we believe that seasonal trends will continue to affect our quarterly results, our recent rapid growth has largely mitigated the effect of these seasonal trends. Historical patterns in our business may not be a reliable indicator of our future sales activity or performance.
Quarterly Gross Margin Trends
Gross margin has increased year-over-year for all periods presented. This increase was largely driven by our continued efforts and those of our contract manufacturer to manage our supply chain and raw materials pricing, growth in revenue resulting in scale efficiencies and shifts in product mix from line cards that are more focused on pure optical transport to line cards with packet-handling capabilities as customers increasingly address applications formerly handled by routers with our packet-optical solutions. We expect our gross margin to fluctuate in a similar pattern to the seasonality we observe in our revenue given the relatively fixed nature of our manufacturing overhead. The decrease in gross margin for the quarter ended September 30, 2012 compared to the quarter ended June 30, 2012 reflected price competition associated with a large customer opportunity and an increase in sales of chassis relative to line cards resulting from a significant number of new customer deployments.
61
Table of Contents
Quarterly Operating Expenses Trends
Total operating expenses increased year-over-year for all periods presented primarily due to the addition of personnel in connection with the expansion of our business. The addition of headcount has been the primary cause of increases in operating expenses to date, and we expect this trend to continue.
Liquidity and Capital Resources
We had cash and cash equivalents of $14.0 million at March 31, 2013. Cash and cash equivalents consist of cash and money market funds. We did not have any short-term or long-term investments at March 31, 2013.
Since inception, we have financed our operations and capital expenditures primarily through private sales of redeemable convertible preferred stock for aggregate net proceeds of $98.1 million, as well as through a commercial credit facility and capital leases.
We borrowed approximately $6.0 million under a commercial lender growth capital credit facility and various other promissory note agreements to finance hardware and software product development from 2008 to 2009. These borrowings were repaid at various dates through January 2012. In December 2012, we established a new loan facility consisting of a revolving loan facility and a term loan facility governed by a Loan and Security Agreement with Silicon Valley Bank under which we may borrow up to a combined $15.0 million. As of March 31, 2013, we had drawn down $5.0 million as term loans and $7.6 million as revolving loans under the agreement. Loans drawn under the agreement will be used for working capital and general corporate purposes.
In 2008 and 2010, we entered into four capital leases for financed equipment, which were repaid at various dates through October 2011.
We plan to continue to invest for long-term growth. We believe that our existing cash and cash equivalents, together with our expected cash flow from operations and the net proceeds of this offering, will be sufficient to meet our projected operating and capital expenditure requirements for at least the next 12 months.
The following table summarizes our cash flows:
| Year Ended December 31, |
Three Months Ended March 31, |
|||||||||||||||||||
| 2010 | 2011 | 2012 | 2012 | 2013 | ||||||||||||||||
| (in thousands) | ||||||||||||||||||||
| Net cash used in operations |
$ | (14,650 | ) | $ | (13,423 | ) | $ | (12,463 | ) | $ | (830 | ) | $ | (3,650 | ) | |||||
| Net cash used in investing activities |
(1,289 | ) | (2,772 | ) | (5,698 | ) | (815 | ) | (962 | ) | ||||||||||
| Net cash provided by financing activities |
26,645 | 7,888 | 12,634 | (47 | ) | (1,589 | ) | |||||||||||||
| Effect of exchange rates on cash |
— | (27 | ) | 8 | 2 | (13 | ) | |||||||||||||
|
|
|
|
|
|
|
|
|
|
|
|||||||||||
| Net increase (decrease) in cash and cash equivalents |
$ | 10,706 | $ | (8,334 | ) | $ | (5,519 | ) | $ | (1,690 | ) | $ | (6,214 | ) | ||||||
|
|
|
|
|
|
|
|
|
|
|
|||||||||||
Operating Activities
Three Months Ended March 31, 2012 and 2013
We used cash in operations of $3.7 million in the three months ended March 31, 2013, primarily as a result of a net loss of $9.4 million which was partially offset by $3.6 million in non-cash
62
Table of Contents
depreciation and amortization, stock-based compensation and revaluation of preferred stock warrants. In addition, we experienced decreases in a majority of our working capital accounts primarily due to seasonality in sales as compared to the quarter ended December 31, 2012. This resulted in decreases in accounts receivable of $2.0 million and inventory of $1.3 million, partially offset by a net decrease in other working capital amounts of $1.2 million.
We used cash in operations of $0.8 million in the three months ended March 31, 2012, primarily as a result of a net loss of $3.9 million which was offset by $1.0 million in non-cash depreciation, amortization, stock-based compensation and revaluation of warrants. In addition, we experienced increases in a majority of our working capital accounts primarily due to significant increases in our operations as a result of growth in the business. Accounts receivable increased by $1.9 million and deferred costs increased by $1.4 million. These increases were more than offset by increases in accounts payable of $2.5 million and deferred revenue of $2.8 million. The increases in deferred costs and deferred revenue primarily related to shipped and billed hardware awaiting formal acceptance for contracts with customers who received loans and grants from the RUS.
Years Ended December 31, 2010, 2011 and 2012
We used cash in operations of $12.5 million for the year ended December 31, 2012, primarily as a result of a net loss of $16.6 million which was partially offset by $9.3 million in non-cash depreciation and amortization, stock-based compensation and revaluation of preferred stock warrants. In addition, we experienced increases in a majority of our working capital accounts, primarily due to significant increases in our operations as a result of growth in the business. Accounts receivable increased $12.7 million, primarily due to the significant increase in shipments and billings and inventories increased $8.2 million as we prepared for increases in shipments to customers based on demand for our products. These changes were partially offset by an increase in deferred revenue of $12.2 million, partially offset by an increase in deferred costs of $5.9 million related to such deferred revenue. In addition, accounts payable and accrued liabilities increased approximately $7.6 million, primarily as a result of significant inventory purchases and timing of payments of invoices from our contract manufacturer. Additionally, accrued compensation increased by $2.3 million as we increased total headcount.
We used cash in operations of $13.4 million for the year ended December 31, 2011, primarily as a result of a net loss of $15.9 million, which was partially offset by $1.8 million in non-cash depreciation and amortization, stock-based compensation, revaluation of warrants and non-cash interest charges. In addition, we experienced increases in a majority of our working capital accounts, primarily due to significant increases in our operations as a result of growth in the business. Accounts receivable increased $3.5 million as a result of an increase in sales in the fourth quarter of 2011 and inventory increased $1.9 million as we prepared for increases in shipment to customers based on demand for our products. These changes were partially offset by increase in deferred revenue of $5.0 million, partially offset by an increase in deferred costs of $2.3 million related to such deferred revenue. In addition, accounts payable and accrued liabilities increased approximately $2.9 million, primarily as a result of significant inventory purchases and timing of payments of invoices from our contract manufacturer.
We used cash in operations of $14.7 million for the year ended December 31, 2010, primarily as a result of a net loss of $16.3 million which was offset by $1.7 million in non-cash depreciation and amortization, stock-based compensation, revaluation of warrants and non-cash interest charges. We experienced increases in a majority of our working capital accounts, primarily due to significant increases in our operations as a result of growth in our business. Accounts receivable, prepaid expenses, accounts payable and other current liabilities increased primarily due to significant increases in our operations as a result of growth in the business. Our inventory decreased due to strong sales and shipments in the fourth quarter of 2010 where we were not able to replenish finished goods until the first quarter of 2011. Customer deposits as of December 31, 2009 related to prepayments from customers that had prepaid, but units had not yet been shipped. We shipped these units in 2010.
63
Table of Contents
Investing Activities
Three Months Ended March 31, 2012 and 2013
We used $0.8 million and $1.0 million in cash for investing activities in the three months ended March 31, 2012 and 2013, respectively, primarily related to the purchase of lab equipment, tooling and computer hardware to support our growth.
Years Ended December 31, 2010, 2011 and 2012
We used $5.7 million, $2.8 million and $1.3 million in cash for investing activities for the years ended December 31, 2012, 2011 and 2010, respectively, primarily related to the purchase of lab equipment, tooling and computer hardware to support our growth.
Financing Activities
Three Months Ended March 31, 2012 and 2013
We used $1.6 million in cash for financing activities in the three months ended March 31, 2013, primarily due to $1.7 million in costs related to this offering which were partially offset by proceeds of $0.1 million from the exercise of stock options. We used less than $0.1 million in cash for financing activities in the three months ended March 31, 2012 as a result of payments on our notes payable obligations.
Years Ended December 31, 2010, 2011 and 2012
Cash from financing activities for the year ended December 31, 2012 reflected proceeds of $12.6 million related to a $7.6 million draw on our newly established revolving loan facility, a $5.0 million draw on our newly established term loan facility and $116,000 from the exercise of stock options.
We generated $7.9 million in cash from financing activities for the year ended December 31, 2011 as a result of our issuance of 110,446 and 2,138,535 shares of Series E and F redeemable convertible preferred stock, respectively, for aggregate net proceeds of $10.4 million. This increase was partially offset by $2.6 million in payments on our capital lease and notes payable obligations.
Cash from financing activities for the year ended December 31, 2010 was $26.6 million as a result of our issuance of 6,626,765 shares of Series E redeemable convertible preferred stock for net proceeds of $29.9 million. This increase was partially offset by $3.3 million in payments on our capital lease and notes payable obligations.
Contractual Obligations and Known Future Cash Requirements
Debt and Capital Leases
On December 21, 2012, we entered into a Loan and Security Agreement with SVB. The agreement provides a revolving loan facility of up to $10.0 million and a term loan facility of up to $5.0 million, for a total loan facility of up to $15.0 million. As of March 31, 2013, we had drawn down $5.0 million as term loans and $7.6 million as revolving loans under the agreement. Loans drawn under the Loan and Security Agreement will be used for working capital and general corporate purposes.
Revolving loans bear interest at a floating rate equal to the greater of (i) 3.25% or (ii) the prime rate (3.25% as of March 31, 2013). For the first 12 months following each term loan advance, each term loan advance bears interest at a floating rate equal to the prime rate, plus 0.50%. On the date following such 12 month period and thereafter, each term loan advance bears interest at a fixed rate equal to the prime rate on the date following such 12 month period, plus 0.50%.
64
Table of Contents
Interest on the revolving loans and the term loans is due and payable monthly in arrears. Revolving loans may be borrowed, repaid and reborrowed until December 21, 2014, when all outstanding amounts must be repaid. Principal on each term loan advance is payable in 36 equal monthly installments beginning 12 months after the date on which such term loan advance is made. Prepayments of the revolving loan facility and the term loan facility prior to their respective termination dates will be subject to early termination fees, subject to certain exceptions.
Our obligations under the Loan and Security Agreement are secured by a security interest on substantially all of our assets, excluding our intellectual property and certain other assets. Additionally, our future domestic subsidiaries, if any, may be required to become co-borrowers or guarantors under the agreement. The Loan and Security Agreement contains customary affirmative covenants and customary negative covenants limiting our ability and the ability of our subsidiaries to, among other things, dispose of assets, undergo a change in control, merge or consolidate, make acquisitions, incur debt, incur liens, pay dividends, repurchase stock and make investments, in each case subject to certain exceptions. We must also comply with a minimum adjusted quick ratio financial covenant, which is the ratio of our unrestricted cash and net billed accounts receivable to our current liabilities minus the current portion of our deferred revenue.
The Loan and Security Agreement also contains customary events of default including, among others, payment defaults, breaches of covenants, investor abandonment, bankruptcy and insolvency events, cross defaults with certain material indebtedness, judgment defaults, and breaches of representations and warranties. Upon an event of default, SVB may declare all or a portion of our outstanding obligations to be immediately due and payable and exercise other rights and remedies provided for under the agreement. During the existence of an event of default, interest on the obligations could be increased by 5.0%.
Operating Leases and Purchase Commitments
We lease our headquarters in Petaluma, California and other locations worldwide under non-cancelable operating leases that expire at various dates through 2015. In addition, we subcontract with other companies to manufacture and supply components for our products. During the normal course of business, our contract manufacturer procures components from suppliers based on our forecasts. If we cancel all or part of the orders, we will be liable to our contract manufacturer for the cost of the components purchased by the subcontractors to manufacture our products. We periodically review this potential liability and, as of December 31, 2012, we have no significant related accruals recorded. Our financial position and results of operations could be negatively impacted if we are required to compensate our contract manufacturer for any unrecorded liabilities incurred.
The following table summarizes our fixed and determinable contractual obligations at December 31, 2012, including leases:
| Total | Less Than 1 Year |
1-3 Years | 3-5 Years | More Than 5 Years |
||||||||||||||||
| (in thousands) | ||||||||||||||||||||
| Operating lease obligations |
$ | 1,819 | $ | 630 | $ | 1,030 | $ | 159 | $ | — | ||||||||||
| Revolving loan(1) |
7,563 | 7,563 | — | — | — | |||||||||||||||
| Term loan(2) |
5,477 | 178 | 5,299 | — | — | |||||||||||||||
| Purchase commitments(3) |
6,571 | 6,571 | — | — | — | |||||||||||||||
|
|
|
|
|
|
|
|
|
|
|
|||||||||||
| Total |
$ | 21,430 | $ | 14,942 | $ | 6,329 | $ | 159 | $ | — | ||||||||||
|
|
|
|
|
|
|
|
|
|
|
|||||||||||
| (1) | Accrues interest at a floating rate equal to the greater of (i) 3.25% or (ii) the prime rate (3.25% as of December 31, 2012). |
65
Table of Contents
| (2) | Includes $5.0 million of principal and approximately $477,000 of expected interest. |
| (3) | Consists of minimum purchase commitments with our contract manufacturer. |
Future Capital Requirements
We believe that our existing cash and cash equivalents, together with our expected cash flow from operations and the net proceeds of this offering, will be sufficient to meet our projected operating and capital expenditure requirements for at least the next 12 months. To the extent that funds from this offering, combined with existing cash, cash equivalents and operating cash flows are insufficient to fund our future activities and requirements, we may need to raise additional funds through public or private equity or debt financing. If we issue equity securities in order to raise additional funds, substantial dilution to existing stockholders may occur. If we raise cash through the issuance of indebtedness, we may be subject to additional contractual restrictions on our business. We cannot assure you that we will be able to raise additional funds on favorable terms, or at all.
Guaranties, Warranties and Indemnifications
We generally offer hardware warranties on our products for one to eight years based on a tiered structure as determined by the type of customer. In accordance with the Financial Accounting Standards Board’s, or FASB’s, Accounting Standards Codification, or ASC 450-20, Loss Contingencies, we record an accrual when we believe it is estimable and probable based upon historical experience. We record a provision for estimated future warranty work in cost of goods sold upon recognition of revenue and we review the resulting accrual regularly and periodically adjust it to reflect changes in warranty estimates.
From time to time, we enter into certain types of contracts that contingently require us to indemnify various parties against claims from third parties. These contracts primarily relate to (i) certain real estate leases, under which we may be required to indemnify property owners for environmental and other liabilities, and other claims arising from our use of the applicable premises; (ii) certain agreements with our officers, directors, and employees, under which we be required to indemnify such persons for liabilities arising out of their relationship with us; (iii) contracts under which we may be required to indemnify customers against third-party claims that our product infringes a patent, copyright, or other intellectual property right; and (iv) procurement or license agreements, under which we may be required to indemnify licensors or vendors for certain claims that may be brought against us arising from our acts or omissions with respect to the supplied products or technology.
Generally, a maximum obligation under these contracts is not explicitly stated. Because the obligated amounts associated with these types of agreements are not explicitly stated, the overall maximum amount of the obligation cannot be reasonably estimated. Historically, we have not been required to make any payments under these obligations, and no liabilities have been recorded for these obligations in our consolidated balance sheets.
Critical Accounting Policies and Estimates
Our consolidated financial statements are prepared in accordance with U.S. generally accepted accounting principles, or GAAP. The preparation of these consolidated financial statements requires us to make estimates and assumptions that affect the reported amounts of assets, liabilities, revenue, expenses and related disclosures. We evaluate our estimates and assumptions on an ongoing basis. Our estimates are based on historical experience and various other assumptions that we believe to be reasonable under the circumstances. Our actual results could differ from these estimates.
66
Table of Contents
We believe that the assumptions and estimates associated with revenue recognition, inventory, warranty and stock-based compensation have the greatest potential impact on our consolidated financial statements. Therefore, we consider these to be our critical accounting policies and estimates. For further information on all of our significant accounting policies, please see Note 1 of the accompanying notes to our consolidated financial statements.
We are an “emerging growth company” within the meaning of the rules under the Securities Act, and we will utilize certain exemptions from various reporting requirements that are applicable to public companies that are not “emerging growth companies.” For example, we will not have to provide an auditor’s attestation report on our internal controls in future annual reports on Form 10-K as otherwise required by Section 404(b) of the Sarbanes-Oxley Act. In addition, Section 107 of the JOBS Act provides that an “emerging growth company” can utilize the extended transition period provided in Section 7(a)(2)(B) of the Securities Act for complying with new or revised accounting standards. Thus, an “emerging growth company” can delay the adoption of certain accounting standards until those standards would otherwise apply to private companies. We have irrevocably elected to opt out of the extended transition period for complying with new or revised accounting standards pursuant to Section 107(b) of the JOBS Act. As a result, we will comply with new or revised accounting standards on the relevant dates on which adoption of such standards is required for non-“emerging growth companies.”
Revenue Recognition
We generate revenue from the sales of our networking and packet-optical solutions. These solutions include our Z-Series high-capacity, multi-layer switching and transport platforms, our Blue Planet platform and applications and support, maintenance and other services. Our solutions are sold primarily through our direct sales force.
Revenue is recognized when all of the following criteria have been met:
| Ÿ | Persuasive evidence of an arrangement exists. Customer purchase orders are generally used to determine the existence of an arrangement. |
| Ÿ | Delivery has occurred. Shipping documents and customer acceptance, when applicable, are used to verify delivery. |
| Ÿ | The price is fixed or determinable. We assess whether the price is fixed or determinable based on the payment terms associated with the transaction and whether the sales price is subject to refund or adjustment. |
| Ÿ | Collectability is reasonably assured. We assess collectability based primarily on the creditworthiness of the customer as determined by credit checks and analysis, as well as the customer’s payment history. |
We recognize product revenue at the time of shipment provided that all other revenue recognition criteria have been met. From time to time, we offer customers sales incentives, including discounts. Revenue is recorded net of these amounts. We recognize services revenue from subscriptions and support and maintenance ratably over the service period, typically one year.
Most of our arrangements, other than renewals of subscriptions and support and maintenance, are multiple-element arrangements with a combination of hardware, software, subscriptions, support and maintenance and other services. Products and services generally qualify as separate units of accounting. When accounting for multiple-element arrangements, U.S. GAAP requires we allocate revenue to individual elements using VSOE of the selling price, third-party evidence, or TPE, of the selling price, or our best estimated selling price, or BESP, of deliverables if VSOE and TPE cannot be determined. Our hardware deliverables typically include proprietary operating system software, which
67
Table of Contents
together deliver the essential functionality of our products. When allocating consideration, we first do so on the basis of the deliverables’ relative selling prices, without regard to any contingent consideration, and then subsequently determine whether the revenue that may be recognized is limited based on the amount of non-contingent revenue. To the extent that the stated contractual prices agree to our estimated selling price on a standalone basis, the allocation of the consideration is based on stated contractual prices. However, if the stated contractual price for any deliverable is outside a narrow range of the estimated selling price on a standalone basis, the allocation is adjusted using the “relative-selling-price method.” Because the individual products and services meet the criteria for separate units of accounting, we recognize revenue upon delivery of each element.
To determine the estimated selling price in multiple-element arrangements, we establish VSOE of the selling price using the prices charged for a deliverable when sold separately and, for subscriptions and support and maintenance, based on the renewal rates and discounts offered to customers. If VSOE of the selling price cannot be established for a deliverable, we establish TPE of the selling price by evaluating similar and interchangeable competitor products or services in standalone arrangements with similarly situated customers. However, as our products contain a significant element of unique technology and offer substantially different features and functionality from our competitors, we have historically been unable to obtain comparable pricing of our competitors’ products with similar functionality on a standalone basis. Therefore, we have not been able to obtain reliable evidence of TPE of the selling price. If neither VSOE nor TPE of the selling price can be established for a deliverable, we establish BESP primarily based on historical transaction pricing. Historical transactions are segregated based on our pricing model and our go-to-market strategy, which include factors such as market vertical, type of sales channel (reseller or end-customer), the geographies in which our products and services were sold (domestic or international) and offering type (products or services). In analyzing historical transaction pricing, we evaluate whether a majority of the prices charged for a product, as represented by a percentage of list price, fall within a reasonable range. To further support the best estimate of selling price as determined by the historical transaction pricing or when such information is unavailable, such as when there are limited sales of a new product, we consider the same factors we have established through our pricing model and go-to-market strategy. The determination of BESP is made through consultation with and approval by our management. In determining BESP, we rely on certain assumptions and apply significant judgment. As our business offerings evolve over time, we may be required to modify our estimated selling prices in subsequent periods, and our revenue could be adversely affected.
In instances where substantive acceptance provisions are specified in the customer agreement, revenue is deferred until all acceptance criteria have been met. Our arrangements generally do not include any provisions for cancellation, termination, or refunds that would materially impact revenue recognition.
We enter into arrangements with certain of our customers who receive government supported loans and grants from the U.S. Department of Agriculture’s Rural Utility Service, or RUS, to finance capital spending. Under the terms of an RUS equipment contract that includes installation services, the customer does not take possession and control and the title does not pass until formal acceptance is obtained from the customer. Under this type of arrangement, we do not recognize revenue until we have received formal acceptance from the customer, and all other revenue recognition criteria have been met.
Inventories
Inventories consisting of finished goods purchased from our contract manufacturer are stated at the lower of cost or market value, with cost being determined using standard cost, which approximates actual cost, on a first-in, first-out basis. We regularly monitor inventory quantities on hand and on order,
68
Table of Contents
and record write-downs for excess and obsolete inventories based on our estimate of the demand for our products, potential obsolescence of technology, product life cycles, and whether pricing trends or forecasts indicate that the carrying value of inventory exceeds our estimated selling price. These factors are affected by market and economic conditions, technology changes, and new product introductions and require estimates that may include elements that are uncertain. Actual demand may differ from forecasted demand and may have a material effect on gross margin. If inventory is written down, a new cost basis will be established that cannot be increased in future periods. During the years ended December 31, 2010, 2011 and 2012, and the three months ended March 31, 2012 and 2013, we recorded a provision of $0.1 million, $0.2 million, $0.3 million, $0.1 million and $0.1 million, respectively, for excess or obsolete inventory in cost of revenue in the accompanying statements of operations.
Warranty
Our products are covered by a warranty for periods generally ranging from one to eight years. We recognize estimated costs related to warranty activities as a component of cost of revenue upon product shipment. The estimates are based on historical product failure rates and historical costs incurred in correcting product failures. The recorded amount is adjusted from time to time for specifically identified warranty exposure. Actual warranty expenses are charged against our estimated warranty liability when incurred. Factors that affect our warranty liability include the number of installed units and historical and anticipated rates of warranty claims and cost per claim. An increase in warranty claims or the related costs associated with satisfying these warranty obligations could increase our cost of sales and negatively affect our gross margin. As of December 31, 2011 and 2012, and March 31, 2013, our warranty liability was $0.8 million, $1.3 million and $1.3 million, respectively.
Stock-Based Compensation
Compensation expense related to stock-based compensation, including employee and non-employee director awards, is measured and recognized in the financial statements based on fair value. The fair value of the common stock underlying our stock options was determined by our board of directors. The valuations of our common stock were determined in accordance with the guidelines outlined in the American Institute of Certified Public Accountants Practice Aid, Valuation of Privately-Held-Company Equity Securities Issued as Compensation. The assumptions we use in the valuation model are based on future expectations regarding our business, combined with management judgment. Under the fair value recognition provisions of this guidance, stock-based compensation is measured at the grant date based on the fair value of the award and is recognized as expense, net of estimated forfeitures, over the requisite service period, which is generally the vesting period of the award.
Determining the fair value of stock-based awards at the grant date represents the board of directors’ best estimates; however, the estimates involve inherent uncertainties and the application of judgment. We use the Black-Scholes option pricing model to determine the fair value of stock options. The determination of the grant date fair value of options using an option pricing model is affected by our estimated common stock fair value as well as assumptions regarding a number of other complex and subjective variables. These variables include the fair value of our common stock, our expected stock price volatility over the expected term of the options, stock option exercise and cancellation behaviors, risk-free interest rates and expected dividends, which are estimated as follows:
Fair Value of Our Common Stock. Because our stock is not publicly traded, we must estimate the fair value of our common stock, as discussed in “Common Stock Valuations” below.
Expected Term. The expected term represents the period that our share-based awards are expected to be outstanding. The expected term was generally estimated using the simplified
69
Table of Contents
method allowed under SEC guidance. The simplified method calculates the expected term as the average of the time-to-vesting and the contractual life of the awards. We intend to continue to utilize the simplified method for all “regular” awards until we have established a reasonable period of representative trading history as a public company, at which time we will determine the expected term based on the historical option exercise behavior of our option holders, expectations about future option exercise behavior and post-vesting cancellation.
Volatility. As we have been a private company and do not have a trading history for our common stock, we estimated the expected stock price volatility by taking the average historic price volatility for industry peers that we selected based on daily price observations over a period equivalent to the expected term of the stock option grants. We selected the peer group of companies from publicly traded companies in the same or similar lines of business to us, with consideration given to the fact that these companies had longer operating lives and were larger when compared to us, typically both in terms of revenue and net worth. We also selected companies with similar growth rates to us. We did not rely on implied volatilities of traded options in these industry peers’ common stock because the volume of activity was relatively low. We intend to continue to consistently apply this process using the same or similar public companies until a sufficient amount of historical information regarding the volatility of our own common stock share price becomes available, or unless circumstances change such that the identified companies are no longer similar to us, in which case more suitable companies whose share prices are publicly available would be utilized in the calculation. Higher volatility and longer expected lives would result in an increase to stock-based compensation expense determined at the date of grant.
Risk-free Rate. The risk-free interest rate is based on the yields of zero coupon U.S. Treasury securities with maturities similar to the expected term of the options.
Dividend Yield. We have never declared or paid any cash dividends and do not presently plan to pay cash dividends in the foreseeable future. Consequently, we used an expected dividend yield of zero.
The following table presents the assumptions used to estimate the fair value of options granted during the periods presented:
| Year Ended December 31, | Three Months Ended March 31, | |||||||||||||||||||
| 2010 | 2011 | 2012 | 2012 | 2013 | ||||||||||||||||
| Volatility |
56.7%-59.5% | 55.0%-56.7% | 55.0% | 55.0% | 55.0% | |||||||||||||||
| Expected term (in years) |
6.08 | 6.08 | 6.08 | 6.08 | 6.08 | |||||||||||||||
| Risk-free rate |
1.4%-2.6% | 0.97%-2.25% | 0.62%-1.02% | 0.83%-1.02% | 0.78-0.9% | |||||||||||||||
| Dividend yield |
— % | — % | — % | — % | — % | |||||||||||||||
In addition to assumptions used in the Black-Scholes option pricing model, we must also estimate a forfeiture rate to calculate the stock-based compensation for our awards. Our forfeiture rate is based on an analysis of our actual forfeitures since the beginning of the option plan. We routinely evaluate the appropriateness of the forfeiture rate based on actual forfeiture experience, analysis of employee turnover and expectations of future option exercise behavior. Quarterly changes in the estimated forfeiture rate can have a significant impact on our stock-based compensation expense as the cumulative effect of adjusting the forfeiture rate is recognized in the period the forfeiture estimate is changed. If a revised forfeiture rate is higher than the previously estimated forfeiture rate, an adjustment is made that will result in a decrease to the stock-based compensation expense recognized in the financial statements. If a revised forfeiture rate is lower than the previously estimated forfeiture rate, an adjustment is made that will result in an increase to the stock-based compensation expense recognized in the financial statements.
70
Table of Contents
We will continue to use judgment in evaluating the assumptions related to our stock-based compensation on a prospective basis. If any of the assumptions used in the Black-Scholes model change significantly, stock-based compensation for future awards may differ materially compared with the awards granted previously.
Common Stock Valuations
We are required to estimate the fair value of the common stock underlying our stock-based compensation awards when performing the fair value calculations with the Black-Scholes option-pricing model. The fair values of the common stock underlying our stock-based compensation awards were determined by our board of directors, with input from management. Our board of directors has been and continues to be comprised of a majority of non-employee directors that we believe have the relevant experience and expertise to determine the fair value of our common stock on each respective grant date.
Given the absence of a public trading market of our common stock, and in accordance with the American Institute of Certified Public Accountants Practice Guide, Valuation of Privately-Held-Company Equity Securities Issued as Compensation, our board of directors exercised reasonable judgment and considered numerous objective and subjective factors to determine the best estimate of the fair value of our common stock including:
| Ÿ | contemporaneous valuations performed by unrelated third-party valuation specialists; |
| Ÿ | sales by the company of preferred stock to outside investors in arm’s-length transactions; |
| Ÿ | the prices, rights, preferences and privileges of the company preferred stock relative to the common stock; |
| Ÿ | our operating and financial performance and forecasts; |
| Ÿ | the market performance of comparable publicly traded technology companies; |
| Ÿ | hiring of key personnel; |
| Ÿ | the introduction by us and risks related to market acceptance of new products or services; |
| Ÿ | the likelihood of achieving a liquidity event for the shares of common stock underlying these stock options, such as an initial public offering or sale of our company, given prevailing market conditions and the nature and history of our business; |
| Ÿ | the general lack of private, third-party, secondary transactions in our common and preferred stock; |
| Ÿ | adjustments necessary to recognize a lack of marketability for our common stock; |
| Ÿ | the U.S. and global capital market conditions; and |
| Ÿ | other changes in the company since the last time the board of directors had approved option grants and made a determination of fair value. |
In order to determine the fair value of our common stock underlying option grants issued prior to this initial public offering, we estimated the business enterprise value, or BEV, and then allocated the BEV to each element of our capital structure (preferred stock, common stock, warrants and options). For all periods below, our BEV was determined as the average of two generally accepted approaches: the income approach and the market-based approach. We believe an equal weighting under the two valuation approaches was appropriate for all of these periods considering the inherent strengths and weaknesses of each valuation approach. We believe that neither valuation technique was more reflective of our BEV than the other after taking into account our continued progress as an enterprise.
71
Table of Contents
We believe the income approach provided an appropriate indicator of our BEV based on discounted projected cash flows, particularly given our operating history. In the application of the income approach, a discounted cash flow method, or DCF, is utilized. The DCF estimates enterprise value based on the estimated present value of future net cash flows the business is expected to generate over a forecasted period and an estimate of the present value of cash flows beyond that period, which is referred to as terminal value. The terminal value was estimated by applying a multiple to the terminal year’s debt free net income. This multiple was selected based on market multiples observed as well as long-term market indices. The terminal value was then discounted to its present value and added to the present value of the cash flows from the discrete projection period.
The market approach was applied as we believed that the market multiples of our comparable industry peer companies would be an appropriate measure to determine our BEV while factoring in our inherent strengths and weaknesses relative to comparable public companies in our industry. The market approach measures the value of a business through an analysis of recent sales or offerings of comparable investments or assets, and in our case, focused on comparing us to the group of peer companies. In applying the market approach, valuation multiples are derived from historical operating data of a peer company group. We selected the peer group of companies from publicly-traded companies in the same or similar lines of business to us, with consideration given to the fact that these companies had longer operating lives and were larger when compared to us, typically both in terms of revenue and net worth. We also selected companies with similar growth rates to us. This same peer group of companies was used for the volatility calculation in our Black-Scholes option pricing model. We then apply multiples to our operating data, with an emphasis on revenue multiples given our lack of profitability, to arrive at a range of indicated values of the company.
Our indicated BEV at each valuation date was allocated to the shares of preferred stock, common stock, warrants and options, using an option pricing method, or OPM. OPM treats preferred stock, common stock, warrants and options as call options on an enterprise value, with exercise prices based on the liquidation preference of the preferred stock. Therefore, the common stock has value only if the funds available for distribution to the stockholders exceed the value of the liquidation preference at the time of a liquidity event such as a merger, sale or initial public offering, assuming the enterprise has funds available to make a liquidation preference meaningful and collectible by the stockholders. The common stock is modeled to be a call option with a claim on the enterprise at an exercise price equal to the remaining value immediately after the preferred stock is liquidated. OPM uses the Black-Scholes option-pricing model to price the call option. In our case, we assumed that the preferred stock would convert to common stock based on the computed BEV for the periods presented. An OPM is appropriate to use when the range of possible future outcomes is so difficult to predict that forecasts would be highly speculative.
Commencing with our valuation for the November 30, 2012 valuation date, we utilized a probability-weighted expected return method, or PWERM, to estimate the fair value of our common stock using the methods discussed above. Preparing for this initial public offering led us to apply the PWERM analysis as we had better visibility into the likelihood of achieving a liquidity event in the next year. Under the PWERM, the value of our common stock is estimated based upon an analysis of values for our common stock assuming the following possible future events for the company: initial public offering; strategic merger or sale; remaining a private company; and liquidation of the company. For each of the possible events, a range of future equity values is estimated over a range of possible event dates, all discounted for the time-value of money. The timing of these events is based on management’s estimates. For each future equity value scenario, we determined the appropriate allocation of value to holders of outstanding shares of our common stock. The value of each share of common stock is then multiplied by a discount factor derived from the calculated discount rate and the expected timing of the event. The value per share of common stock is then multiplied by an estimated
72
Table of Contents
probability for each of the possible events based on management’s estimates. The calculated value per share of common stock under each scenario is then discounted for a lack of marketability. A probability-weighted value per share of common stock is then determined.
For each valuation, we prepared financial projections to be used in the income approach. The financial projections took into account our historical financial operating results, our business experiences and our future expectations. We factored the risk associated with achieving our forecast into selecting the appropriate exit multiple and discount rate. There is inherent uncertainty in these estimates, as the assumptions we used were highly subjective and subject to change as a result of new operating data and economic and other conditions that affect our business.
For determining the fair value per share of our common stock for financial reporting purposes for the periods from December 31, 2011 to March 31, 2013, we used a straight-line calculation over the period based on our determination of fair value at each quarter end and November 30, 2012. We determined that the straight-line calculation provided the most reasonable basis for the valuations of the shares of common stock underlying the options granted on these interim dates for financial reporting purposes because we did not identify any single event that occurred during this interim period that would have caused a material increase or decrease in fair value. In addition, as discussed in detail below under “October 2012 Grants,” we re-evaluated our determination of fair value as of September 30, 2012, and used that updated fair value amount for purposes of our straight-line calculation. A combination of the factors described below in each period led to the changes in the fair value of our common stock.
The following stock options were granted between January 1, 2012 and March 31, 2013 to employees and members of our board of directors with the following fair value per share of our common stock for purposes of calculating share-based compensation:
| Option Grant Date |
Number of Shares Underlying Options |
Common Stock Fair Value Per Share |
||||||
| February 28, 2012 |
694,635 | $ | 2.49 | |||||
| March 27, 2012 |
436,050 | $ | 2.65 | |||||
| May 22, 2012 |
1,729,934 | $ | 2.97 | |||||
| July 10, 2012 |
205,330 | $ | 3.34 | |||||
| July 24, 2012 |
94,820 | $ | 3.53 | |||||
| August 28, 2012 |
83,634 | $ | 4.01 | |||||
| September 6, 2012 |
193,550 | $ | 4.14 | |||||
| September 25, 2012 |
2,263,695 | $ | 4.40 | |||||
| October 23, 2012 |
138,905 | $ | 5.49 | |||||
| December 22, 2012 |
362,228 | $ | 7.98 | |||||
| January 29, 2013 |
166,570 | $ | 8.97 | |||||
| February 26, 2013 |
1,208,427 | $ | 9.61 | |||||
As of March 31, 2013, the aggregate intrinsic value of vested and unvested options was $31.0 million and $56.4 million, respectively, based on the estimated fair value for our common stock of $11.00 per share, which is the midpoint of the estimated offering price range set forth on the cover page of this prospectus. As of March 31, 2013, we had $16.5 million of unrecognized stock-based compensation expense, net of estimated forfeitures, that is expected to be recognized over a weighted-average period of 3.12 years. In future periods, we expect our stock-based compensation expense to increase in dollar amount as a result of our existing stock-based compensation to be recognized as these options vest and as we issue additional stock-based awards to attract and retain employees.
73
Table of Contents
The following discussion presents the determination of our board of directors of the fair value per share of our common stock underlying option grants and the exercise price for such option grants, together with our determination of the fair value per share of our common stock for financial reporting purposes for the respective periods as follows:
February and March 2012 Grants
We experienced continued revenue growth of 37% in the fourth quarter of 2011, generating $13.1 million for the fourth quarter of 2011, compared to $9.6 million for the third quarter of 2011. However, we also experienced continued losses from operations. In connection with these grants, we obtained a third-party valuation of our common stock as of December 31, 2011. We relied upon an average of the income and market approaches to arrive at the BEV. For this valuation, we used a 20% discount rate for the DCF income calculation, a blended revenue multiple of 1.73 for the market approach and a discount for lack of marketability of 29%. Our board of directors determined the fair value of our common stock to be $2.15, consistent with the third-party valuation report. Our board of directors considered numerous factors related to our business and determined that it would set the exercise price of the options at $2.54 per share, consistent with the exercise price for grants in May through October of 2011. For financial reporting purposes, we determined, based on the straight-line calculation, the fair value per share of our common stock to be $2.49 for February 2012 and $2.65 for March 2012.
May 2012 Grants
Despite certain year-end cyclicality in our business, we experienced continued revenue growth of 8% in the first quarter of 2012, generating $14.2 million for the first quarter of 2012, compared to $13.1 million for the fourth quarter of 2011. Our operating losses were relatively flat at $3.5 million for the same quarters, but our revenue forecast for the remainder of 2012 remained positive, despite these continued operating losses. In connection with these grants, we obtained a third-party valuation of our common stock as of March 31, 2012. We continued to apply the average of the income and market approaches to arrive at the BEV. We also continued to use a 20% discount rate for the DCF income calculation, a blended revenue multiple of 1.79 for the market approach and a discount for lack of marketability of 29%. Our board of directors determined the fair value of our common stock to be $2.67, consistent with the third-party valuation report, and granted options with an exercise price of $2.67 per share. For financial reporting purposes, we determined, based on the straight-line calculation, the fair value per share of our common stock to be $2.97.
July, August and September 2012 Grants
We experienced strong revenue growth of 63% in the second quarter of 2012, generating $23.1 million for the second quarter of 2012, compared to $14.2 million for the first quarter of 2012. Our operating losses decreased slightly for the same quarters and our revenue forecast for the remainder of 2012 remained positive. In connection with these grants, we obtained a third-party valuation of our common stock as of June 30, 2012. We continued to use an average of the income and market approaches to arrive at the BEV for the periods covered by the July, August and September 2012 option grants. We utilized a 25% discount rate for the DCF income calculation, increased from the prior period to account for the fact that we aggressively increased our forecast of projected income as a result of our growth in the second quarter of 2012 and, accordingly, the risk of achieving these higher projections increased. We used a blended revenue multiple of 1.71 for the market approach and a discount for lack of marketability of 25% reflecting slightly better prospects for a liquidity event based upon the expected performance of our business. Our board of directors determined the fair value of our common stock to be $3.20, consistent with the third-party valuation report, and granted options with an exercise price of $3.20 per share. For financial reporting purposes, we determined, based on the
74
Table of Contents
straight-line calculation, the fair value per share of our common stock to be $3.34 for July 10, 2012, $3.53 for July 24, 2012, $4.01 for August 28, 2012, $4.14 for September 6, 2012 and $4.40 for September 25, 2012.
October 2012 Grants
We experienced revenue growth of 25% in the third quarter of 2012, generating $28.8 million for the third quarter of 2012, compared to $23.1 million for the second quarter of 2012. Our operating losses increased slightly for the same period and our revenue forecast for the remainder of 2012 remained positive. In connection with these grants, we obtained a third-party valuation of our common stock as of September 30, 2012. We continued to use an average of the income and market approaches to arrive at the BEV for the periods covered by the October 2012 option grants. We also utilized a 25% discount rate for the DCF income calculation, a blended revenue multiple of 1.62 for the market approach and a discount for lack of marketability of 25% reflecting better prospects for a liquidity event based upon the expected performance of our business. Our board of directors determined the fair value of our common stock to be $3.61, consistent with the third-party valuation report, and granted options with an exercise price of $3.61 per share. However, for financial reporting purposes, in light of discussions with underwriters in preparation for the initiation of this offering, in December 2012, we re-evaluated the assumptions used in the third-party valuation as of September 30, 2012, that was used to assist our board of directors in its determination of the fair value for equity awards granted in October 2012. The reassessed common stock fair value was determined using the same valuation methodologies used previously except that, in order to better reflect our outlook at that time, we determined that it would be appropriate to use revenue multiples that were at higher points in the ranges of our comparable companies, which resulted in a blended revenue multiple of 2.37. As a result of this, we determined the fair value of our common stock for financial reporting purposes to be $4.47 as of September 30, 2012. We then determined, based on the straight-line calculation between the re-evaluated September 30, 2012 valuation of $4.47 and the November 30, 2012 valuation of $7.18, the fair value per share of our common stock to be $5.49.
December 2012 Grants
Financial markets continued to show strength and relatively low volatility in the fourth quarter, and the number of initial public offerings was up for the year, including for technology companies. In addition, economic growth was occurring in our industry during the quarter. We began preparing for a potential initial public offering in October 2012, with our initial confidential submission of a registration statement being made on December 20, 2012. We also introduced our Blue Planet platform in December 2012, which reflected a strategic shift in our business plan to a more software-enabled characteristic company, to enhance our offerings with the goal of increasing our revenue and improving our gross margin. Finally, we continued to grow our revenue throughout the fourth quarter of 2012, which was not yet complete at the time of our December 2012 stock option grants. In connection with these grants, we obtained a third-party valuation of our common stock as of November 30, 2012. This valuation was the first application of the PWERM, with the weighting of the probability of an initial public offering at 60%, a sale of the company at 20%, remaining a private company at 17.5% and a liquidation scenario at 2.5%. For the initial public offering scenario, we used an estimated valuation based on a revenue multiple, discounted for an estimated 10 month period from the date of the valuation to the estimated date of the offering including the six-month lock-up period. For the sale and remaining-private scenarios, we continued to use an average of the income and market approaches to arrive at the BEV. For the income approach element of this analysis, we utilized a 22.5% discount rate, reflecting a slight decrease over our prior discount rate. For the market approach element of this analysis, we used revenue multiples that were at the midpoints in the ranges of a broader group of comparable companies, which resulted in a blended revenue multiple of 2.83. In connection with developing the revenue multiple, we broadened our comparable company set to add six public
75
Table of Contents
companies in the communications networking industry, including one new company that had recently completed its initial public offering, and to drop two companies that we believed were less relevant. These changes to our comparable companies group were based upon additional information that was brought to management’s attention regarding which companies the market may consider most comparable to us, including taking into account companies whose business models included significant software content given our goals for growth with our Blue Planet software offering. In addition, several of the new companies that were added to the broader group had experienced significant increases in value in the two months prior to November 30, 2012, which contributed significantly to the increases in the revenue multiple that we used for the December grants. Had we considered the additional comparable company group in our valuation analysis as of September 30, 2012, the $4.47 per share value as of September 30, 2012 would not have been affected. We applied a 21% discount for lack of marketability to the sale and remaining-private values. Consistent with the third-party valuation, our board of directors determined the fair value of our common stock to be $7.18 and granted options with an exercise price of $7.18 per share. For financial reporting purposes, we determined, based on the straight-line calculation, the fair value per share of our common stock to be $7.98.
January and February 2013 Grants
Financial markets enjoyed strong growth at the end of 2012, with various indices reaching new highs in the first quarter of 2013 and the markets exhibiting lower volatility than the previous year. Our industry performed well in 2012, particularly at the end of the fourth quarter. We also were fully engaged in the preparation for our initial public offering. We finalized our 2012 results and had early indications that our growth would continue in the first quarter of 2013, including good indications of market acceptance of our Blue Planet platform. In connection with our January and February 2013 grants, we obtained a third-party valuation of our common stock as of December 31, 2012. This valuation also applied the PWERM, with the weighting of the probability of an initial public offering at 70%, a sale of the company at 15%, remaining a private company at 12.5% and a liquidation scenario at 2.5%. For the initial public offering scenario, we used an estimated valuation based on a revenue multiple, discounted for an estimated nine month period from the date of the valuation to the estimated date of the offering including the six-month lock-up period. For the sale and remaining-private scenarios, we continued to use an average of the income and market approaches to arrive at the BEV. For the income approach element of this analysis, we utilized a 20% discount rate, reflecting a slight decrease over our prior discount rate. For the market approach element of this analysis, we used revenue multiples that were at the midpoints in the ranges of a broader group of comparable companies, which resulted in a blended revenue multiple of 3.23. In connection with developing the revenue multiple, we added an additional public company in the communications networking industry to our set of comparable companies based upon further input from our management influenced by our initial public offering process. We applied a 21% discount for lack of marketability to the sale and remaining-private values. Our board of directors determined the fair value of our common stock to be $8.31, consistent with the third-party valuation report, and granted options with an exercise price of $8.31 per share.
We obtained a third-party valuation of our common stock as of March 31, 2013. We continued to use a PWERM, with the weighting of the probability of an initial public offering at 80%, reflecting the increased likelihood of this offering, a sale of the company at 10%, remaining a private company at 10% and a liquidation scenario at 0%. For the initial public offering scenario, we used the midpoint of an estimated preliminary price range, discounted for an estimated seven month period from the date of the valuation to the estimated date of the offering including the six-month lock-up period. For the sale and remaining-private scenarios, we continued to use an average of the income and market approaches to arrive at the BEV. For the income approach element of this analysis, we utilized an 18% discount rate, reflecting a slight decrease over our prior discount rate. For the market approach element of this analysis, we used a blended revenue multiple of 3.48, reflecting a slight increase over
76
Table of Contents
our prior blended revenue multiple. This March 31, 2013 valuation report maintained the same set of comparable public companies as the prior report. We applied a 21% discount for lack of marketability to the sale and remaining-private values. Pursuant to this valuation report, the fair value of our common stock was determined to be $10.37 per share as of March 31, 2013.
For financial reporting purposes, we determined, based on the straight-line calculation, the fair value per share of our common stock to be $8.97 for the options granted in January 2013 and $9.61 for the options granted in February 2013.
Off-Balance Sheet Arrangements
We do not engage in transactions that generate relationships with unconsolidated entities or financial partnerships, such as entities often referred to as structured finance or special purpose entities, as part of our ongoing business.
Quantitative and Qualitative Disclosures About Market Risk
We are exposed to market risks in the ordinary course of our business, primarily related to interest rate, inflation and foreign currency risks. We also are exposed to risks relating to changes in the general economic conditions that affect our business. To reduce certain of these risks, we monitor the financial condition of our customers and manage our contract manufacturer and suppliers. In addition, our investment strategy has been to invest in cash and cash equivalents. To date, we have not used derivative instruments to mitigate any market risk exposures. We have not used, nor do we intend to use, derivatives for trading or speculative purposes. We do not believe that these risks have been material to date.
We are exposed to market risk related to changes in interest rates. Our investments are considered cash equivalents and primarily consist of money market funds. As of March 31, 2013, we had cash and cash equivalents of $14.0 million. The primary objectives of our investment activities are the preservation of capital, the fulfillment of liquidity needs and the fiduciary control of cash and investments. We do not enter into investments for trading or speculative purposes. Our investments are exposed to market risk due to a fluctuation in interest rates, which may affect our interest income and the fair market value of our investments. In addition, as of March 31, 2013, we had drawn down $5.0 million as term loans and $7.6 million as revolving loans under our Loan and Security Agreement with SVB. Due to the short-term nature of our investment portfolio and our outstanding loan amounts, we believe that only dramatic fluctuations in interest rates would have a material effect on us. As a result, we do not expect our operating results or cash flows to be materially affected by a sudden change in market interest rates.
We do not believe that inflation has had a material effect on our business, financial condition or results of operations. However, if our costs, in particular salaries and manufacturing costs, were to become subject to significant inflationary pressures, we may not be able to fully offset such higher costs through price increases. Our inability or failure to do so could harm our business, operating results and financial condition.
Historically, as our operations and sales, including all of our manufacturing, have been primarily in the United States, we have not faced any significant foreign currency risk. As our international operations grow, our risks associated with fluctuation in currency rates will become greater, and we will continue to reassess our approach to managing this risk. In addition, currency fluctuations or a weakening U.S. dollar can increase the costs of our international expansion efforts.
77
Table of Contents
Overview
We have pioneered innovative, carrier-grade networking solutions that transform disparate and inefficient legacy networks into open, high-performance networks. Our solutions include high-capacity, multi-layer switching and transport platforms as well as a carrier-grade software-defined networking platform and applications. Our solutions enable network operators to virtualize their networks, accelerate service delivery and increase scalability and performance, while reducing costs. We have designed our solutions to provide a variety of existing and emerging premium applications, including business Ethernet, wireless backhaul, broadband backhaul and cloud connectivity. By deploying our solutions, network operators can transform legacy networks into open, multi-vendor, carrier-grade software-defined networks, or SDNs. Our solutions not only reduce network operators’ ongoing capital and operating expenses, but also enable their networks to more flexibly support rapidly changing service requirements and new business models.
Network operators, which include service providers as well as others with similar network requirements, are facing immense pressure on their existing networks and business models. New applications and communications trends are driving tremendous growth in bandwidth demand, resulting in increased service requirements as well as dramatic shifts in overall network traffic patterns. At the same time, competition from traditional vendors as well as new market entrants is limiting service providers’ ability to sustain and grow revenue. As a result, service providers must upgrade their networks, and in particular their regional and metro or “middle mile” networks, both to handle the exponential scaling challenges driven by these trends as well as to profitably deliver the growing breadth of premium services demanded by their subscribers. Other network operators are also facing these scalability requirements while seeking to deliver new applications that improve the productivity and efficiency of their businesses. We designed our solutions to enable network operators to address these challenges while scaling their networks and services efficiently.
Fundamental to our solution is our software-defined networking approach that enables an array of Cyan as well as third-party applications to manage and control underlying network infrastructure. In December 2012, we introduced our Blue Planet platform, a carrier-grade software-defined networking solution purpose-built to address network operator requirements. Blue Planet is the latest implementation of our network virtualization and management software that we first introduced in 2009 to work in combination with our high-capacity, multi-layer switching and transport platforms. Blue Planet is designed to simplify the development, deployment and orchestration of scalable communications and business applications over high-performance networks. Blue Planet enables our customers to make more efficient use of existing network assets, cost-effectively expand network capacity and significantly accelerate the delivery of premium, revenue-generating services to their customers. By deploying Blue Planet, our customers can also provide their subscribers with network-as-a-service, or NaaS, allowing for real-time tailoring and customization of their network architecture and services to meet their end-customers’ specific needs.
We also offer high-capacity, multi-layer switching and transport platforms, known as our Cyan Z-Series, designed to support the multiple concurrent technologies used in regional and metro networks, including both Ethernet-based services as well as optical services. Our Z-Series platforms have been designed to transport traffic over the most efficient network layer, utilizing both electrical and optical domains, to enable network operators to maximize network capacity at the lowest cost per bit. Our solutions are designed to support a variety of use cases from traffic aggregation at the network edge to multi-terabit switching optimized for handoff at the network core.
78
Table of Contents
We were founded in October 2006 to simplify network operations and accelerate innovation through a centralized, open, multi-vendor, software orchestration model. We launched our first Z-Series platform in September 2009. Since then, we have led emerging, carrier-grade SDN initiatives in the industry through our development of open, multi-vendor and multi-layer planning, management and verification software. In April 2010, we launched one of the first multi-layer network management solutions. In December 2012, we launched Blue Planet, our carrier-grade SDN platform that is designed to allow network operators of all types to virtualize their networks and simplify the development, deployment and orchestration of scalable communications and business applications over high-performance networks.
Our customers range from service providers to high-performance data center and large, private network operators. We target our customers through our direct sales force and through channel partners. Our solutions have been deployed primarily across North America as well as in Asia and Europe by over 130 customers, including our top ten customers by revenue in 2012, DukeNet Communications, LLC, Great Plains Communications Inc., Intelleq Communications LLC, Lynx Network Group, Inc., TDS Telecommunications Corporation, US Carrier Telecom, LLC, US Signal Company, LLC, Vision Net, Inc., Windstream Corporation and Zayo Group, LLC.
Our revenue increased from $23.5 million in 2010, to $40.4 million in 2011, and to $95.9 million in 2012, and from $14.2 million in the three months ended March 31, 2012 to $26.3 million in the three months ended March 31, 2013. Our net losses were $16.3 million, $15.9 million and $16.6 million in the years ended December 31, 2010, 2011 and 2012, respectively, and $3.9 million and $9.4 million in the three months ended March 31, 2012 and 2013, respectively.
Industry Background
Service providers are facing an imperative for significant network and business model transformation. Despite growing demand for bandwidth and expanded service offerings, service provider revenue has remained relatively flat, mainly due to competitive pressures. Accordingly, service providers are increasingly challenged to provide their services in a cost-effective manner and to deliver new services that drive additional revenue streams. In addition, the service provider business model is changing from one of deploying fixed bandwidth to one of dynamically provisioning services. However, due to the proprietary and inflexible nature of existing networks and infrastructure, dynamically provisioning services and managing these networks and infrastructure has become cost-prohibitive. This is especially true in regional and metro networks. In addition, other network operators are also facing these scalability requirements while seeking to deliver new applications that improve the productivity and efficiency of their businesses.
Regional and metro networks sit between core networks—the networks that provide national connectivity—and access networks—the networks that provide the connection point to fixed and mobile business and consumer users. Regional and metro networks distribute the traffic from the core to the access networks and back, thereby enabling the end-to-end communications that connect content and applications to the enterprises and consumers who use them. These networks also typically serve as critical aggregation points, aggregating traffic for transport to other regional and metro networks via core networks.
Traditional regional and metro network architectures were built over decades, and were typically designed to deliver voice and legacy data services, such as frame relay, to business and residential subscribers that were primarily local or proximate to that specific regional or metro network. As services were added or offerings were scaled to serve more subscribers, network operators typically built, operated and managed segregated networks running in parallel. Network operators have historically used a variety of technologies to deliver reliable service at scale, including Ethernet as well as legacy optical technologies such as fixed DWDM and SONET/SDH, which has added to the
79
Table of Contents
complex and disparate nature of these legacy regional and metro networks. Given the limitations of legacy optical technology and network design practices, these dedicated and disparate networks are struggling to accommodate the explosion of services with high-bandwidth or strict service level agreement, or SLA, requirements.
Technology Shifts are Pressuring Network Operators to Increase Bandwidth and Enhance Performance
Today’s networks require dramatic transformation to meet the service demands driven by significant technology shifts, including:
| Ÿ | Proliferation of Mobile Devices. Users of all types are increasingly connecting to networks through powerful mobile devices ranging from smartphones to tablets. According to a September 2012 report, IDC estimates that the market for smart connected devices—a combination of PCs, smartphones and tablets—will grow from 1.2 billion devices in 2012 to over 2 billion devices by 2016. These devices include multiple forms of connectivity such as Wi-Fi and cellular, including 3G and 4G Long-Term Evolution, or LTE, enabling users to remain connected wherever they are and to consume more content. Additionally, according to an August 2012 study, Gartner expects worldwide mobile device traffic to grow from 6.4 million terabytes in 2011 to 91.3 million terabytes in 2016. |
| Ÿ | Rapid Adoption of Bandwidth-Intensive Applications. Innovation in consumer and enterprise applications has driven rapid adoption and increases in time spent online, both in mobile and fixed environments. Moreover, these new types of applications, such as video, social media, gaming and enterprise software-as-a-service, are increasingly bandwidth intensive and latency sensitive. For example, according to a June 2012 IDC report, global video captured by device users grew by approximately 15% in 2011 to 9.1 billion gigabytes, of which 3.2 billion gigabytes were recorded on mobile phones, representing a 68% year-over-year increase. |
| Ÿ | Growth in Cloud Computing. Enterprises and consumers are rapidly adopting cloud-based technologies to host an increasing number of applications, store their data and leverage on-demand computing resources. |
At the same time, the nature of data traffic has transformed from static point-to-point fixed connections to dynamic provisioning of new services. As a result, network operators are being forced to upgrade their networks to profitably deliver these premium services as well as to handle the increased demands of their end-customers, which include higher throughput and utilization, better performance and increased provisioning speed in order to deliver high-quality services cost-effectively.
Ethernet has Emerged as the Dominant Network Protocol
As network operators have sought to meet the demand for greater bandwidth and deliver a variety of services at lower costs, their networks increasingly have come under stress. To address these pressures, they have increasingly looked to deploy Ethernet-based technologies. Ethernet standards have evolved significantly and now support carrier-grade public network requirements. Moreover, Ethernet now supports high-bandwidth, carrier-grade environments with enhanced granularity at a significantly lower price per bit than traditional technologies. As subscribers have also been rapidly adopting Ethernet, transitioning to packet-based architectures affords network operators greater flexibility and efficiency in service delivery. According to a December 2012 report, Gartner estimates that revenue from enterprise Ethernet data services is expected to be $20 billion in 2012 and grow to $26 billion in 2016. As a result, we believe that network operators will shift more of their capital budgets towards purchasing Ethernet-based solutions.
80
Table of Contents
Regional and Metro Networks Are Increasingly Critical to Network Operators’ Abilities to Scale and Provide Enhanced Services
As the demands on networks increase, regional and metro networks are becoming increasingly critical to network operators’ abilities to scale network capacity as well as aggregate, deliver and manage required services and content efficiently. Additionally, network operators are now seeking to offer new premium services with guaranteed service levels, as opposed to relying on traditional best-efforts service delivery models. Network operators desire to offer premium services for the following applications:
| Ÿ | Business Ethernet. Providing scalable bandwidth and flexible Ethernet services to support business applications with high service level requirements. |
| Ÿ | Cloud Connectivity. Offering direct, high-speed links to cloud-based services and between data centers. |
| Ÿ | Broadband Backhaul. Transporting traffic for advanced services such as video between the core network and subscribers. |
| Ÿ | Wireless Backhaul. Providing high-capacity transport services at strict service levels optimized for cellular networks. |
| Ÿ | Wholesale Transport. Offering backbone infrastructure to deliver scalable services at low latency under high service levels. |
| Ÿ | Private Networks. The ability to implement IP, Ethernet and optical-based private networks for secure and dedicated bandwidth services. |
Legacy Approaches are Inadequate to Address Network Growth and Performance Requirements
Regional and metro networks are highly capital intensive to build, operate and maintain. Historically, network operators have upgraded capacity only as technology and subscriber demands on their networks have changed. Although network operators must increase the scale of their complex networks to accommodate the increased demand for packet-based services, they must also maintain legacy services for subscribers over their existing networks. Legacy approaches to augmenting regional and metro networks suffer from multiple challenges, including limitations on scalability, performance, flexibility and ability to provision new services efficiently and cost-effectively. These legacy approaches include:
| Ÿ | Adding Dedicated Networks. The historical practice of adding new dedicated and often disparate overlay networks has failed to cost-effectively scale. Deploying disparate overlay networks with hardware and software infrastructure from multiple vendors increases the operational and management complexity and expense associated with operating these networks. Moreover, the capital expense associated with scaling services to other areas of the network is burdensome. |
| Ÿ | Deploying Router-Based Products. Routers have historically been deployed to forward traffic between network connections leveraging a variety of physical mediums and protocols. A router essentially processes every packet that it forwards using commonly available computer processors. Although innovation in router technology has improved processing performance over time, the approach of adding more routers to address continually increasing capacity requirements remains cost-prohibitive. Despite improvements in technology, it is impractical to scale a router-based architecture to address these increasing network requirements, such as 10 gigabit-per-second, or 10G, and 100 gigabit-per-second, or 100G, environments. While routers are required at select network locations, they would be cost-prohibitive to deploy throughout regional and metro transport networks. |
81
Table of Contents
| Ÿ | Modifying Existing Operations Support Systems. Core operations support systems, or OSS, were designed decades ago to support routine administrative tasks associated with network operations. They interact poorly with modern software systems, are not designed to address the higher level network planning, management and coordination functions necessary in today’s networks and do not provide holistic visibility over the entire network. Traditionally, network operators have implemented a patchwork of disparate software systems that run on top of legacy OSS systems to augment their functionality. This creates difficulties coordinating between systems or network layers, increases maintenance costs and slows the provisioning of new services. |
Need for Network Transformation
We believe that the legacy approaches to designing regional and metro networks are inadequate to effectively handle next-generation service demands. Network operators require a new approach to drive network transformation, including new levels of scalability and service flexibility, while reducing their ongoing capital and operating expenses. They are seeking an open architecture that is conducive to deploying multi-vendor, best-of-breed networks and to supporting future innovations while enhancing network efficiency and performance. Moreover, to remain competitive, network operators need to evolve their networks to support higher-bandwidth requirements, introduce new revenue-generating, premium services and manage network traffic at the optimal layer in a low-latency, cost-optimized way using both the optical and Ethernet layers. Accordingly, we believe that network operators require new approaches to both their software and infrastructure to achieve network transformation.
| Ÿ | Software Transformation. To virtualize their networks and realize the promise of NaaS, network operators must deploy SDNs. SDNs simplify networks and create a more open environment by removing proprietary control planes from legacy network elements and replacing them with a network control plane using protocols such as OpenFlow to orchestrate connections and services over cost-optimized, multi-vendor networks. Utilizing an SDN approach would enable network operators to customize and differentiate their networks and would allow for the development of third-party applications. |
Similar to the changes brought about by server virtualization in which IT managers can decouple applications and their environments from the underlying hardware, introducing greater levels of freedom and flexibility in the data center environment, SDNs decouple network logic and policies from the underlying switching hardware, bringing new flexibility into the wide-area networking environment. Network operators that virtualize their networks can partition subsets of their network resources to present a custom network to each enterprise customer, enabling the activation, control and provisioning of services on demand.
| Ÿ | Infrastructure Transformation. Given the heterogeneous characteristics of regional and metro networks, network operators should embrace multi-layer platforms that provide embedded switching capabilities. These platforms would enable a more flexible network architecture, reducing the dependency on legacy technologies, such as routers, that do not scale cost-effectively. An optimal approach would leverage packet and optical technologies to transport and deliver network traffic over the most appropriate layer, thereby maximizing network capacity and minimizing the cost per bit of traffic. |
Network operators need a new approach that incorporates the benefits of software-defined networking and multi-layer switching platforms. We believe that this transformation of network architecture would provide network operators with improved flexibility, increased scalability and performance, accelerated time to value from new services, delivery of a broad range of applications and lower total cost of ownership through decreased capital expenditure and operating expenses.
82
Table of Contents
We believe that an innovative solution which meets capital budget constraints for both green field deployments and existing network environments is imperative. We also believe that this type of solution would enable network operators to address a range of network upgrades associated with spending typically earmarked for products and markets including Ethernet services edge routing, access aggregation, metro WDM, multi-service provisioning platforms and packet-optical equipment. According to ACG Research, markets for these products were forecasted to collectively represent approximately $15.7 billion in worldwide revenue in 2012. We believe that our solutions address a substantial portion of these aggregated markets. In addition, our solutions also address a portion of the OSS market which is not included in the ACG Research forecast above.
Our Solution
We have pioneered innovative, carrier-grade networking solutions that transform disparate and inefficient legacy networks into open, high-performance networks. Our solutions include high-capacity, multi-layer switching and transport platforms, as well as a carrier-grade software-defined networking platform and applications.
Fundamental to our solution is our software-defined networking approach, which enables an array of Cyan and third-party applications to manage and control underlying network infrastructure. In December 2012, we introduced our Blue Planet platform, a carrier-grade software-defined networking solution purpose-built to address network operator requirements. Blue Planet is the latest implementation of our network virtualization and management software that we first introduced in 2009 to work in combination with our high-capacity, multi-layer switching and transport platforms. We also offer high-capacity, multi-layer switching and transport platforms, known as our Cyan Z-Series, designed to support the multiple concurrent technologies used in regional and metro networks, including both Ethernet-based services as well as optical services. Our solutions are designed to support a variety of use cases from traffic aggregation at the network edge to multi-terabit switching optimized for handoff at the network core.
Customers may choose to deploy Blue Planet either on a standalone basis or integrated with our Z-Series platforms. By deploying our solutions, network operators can realize the following benefits:
| Ÿ | Deliver Virtual Networks. Our solutions enable our customers to activate, control and modify network services through our centralized, software control plane. By deploying our Blue Planet platform, network operators can present a custom network to each enterprise customer and rapidly offer services based on packet, OTN and WSS-based wavelength aggregation and switching technologies. Additionally, our approach embraces a multi-vendor environment by integrating with third-party network devices and centralizing the visualization and management of the disparate network elements. Our solutions also integrate with open protocols, such as OpenStack, to enable end-to-end virtualization of networks including data center interconnect. |
| Ÿ | Enhance Flexibility and Support Open Architectures. Our multi-layer solutions give network operators the flexibility to support a changing service mix and the ability to evolve their networks to a packet-based approach at their own pace. For example, our Z-Series platforms are modular and support any combination of Ethernet and legacy optical services that can be swapped or added at any time. Our solutions were designed for network-wide deployment and support a variety of use cases from aggregation at the network edge to multi-terabit platforms optimized for handoff at the network core. Our solutions have open APIs that our customers can use to develop custom business applications or integrate with third-party applications. |
| Ÿ | Increase Capacity and Scalability. Our solutions are designed to scale in a distributed and highly available manner to manage large networks of thousands of network elements supporting tens of thousands of services. Moreover, our Z-Series family of high-capacity, |
83
Table of Contents
| multi-layer switching and transport platforms increase network capacity and optimize cost per bit by tailoring traffic transport to the appropriate network layer, leveraging both electrical and optical domains. Because aggregation may be performed at one layer and multiplexing and transport at others, networks that incorporate our solutions require fewer router ports and offer lower latency than legacy approaches. Additionally, our purpose-built Z-Series platforms support high-capacity networks using industry standard components, facilitating backplane and switch fabric interconnect rates in excess of 100G per line card slot, enabling an easy migration to future 40G and 100G Ethernet services. |
| Ÿ | Accelerate Time to Value. Our Blue Planet platform includes advanced network and service planning applications, enabling network operators to design multi-layer networks quickly and cost-effectively. Advanced algorithms and an intuitive user interface simplify and accelerate the network planning process. Advanced three-dimensional visualization tools combined with network virtualization technology enable on-demand provisioning and deployment of customized services to subscribers. Additionally, our carrier-grade SDN approach enables network operators to access network peripherals and functions remotely, thereby allowing them to rapidly extend the delivery of new services throughout their networks. Because network operators can deploy our software independently from our Z-Series platforms, we can offer valuable network operations services to our customers on an expedited basis. |
| Ÿ | Enhance Performance and Intelligence. Our Blue Planet platform includes real-time and historical analytics to track network performance and assist in capacity planning. This intelligence is available through a centralized service portal that our customers can utilize, and through which they can provide secure access to their customers in order to provide a differentiated service offering. This service portal not only provides the ability to verify compliance of SLAs and a variety of other metrics, but can also be configured to allow end-user bandwidth changes for the contracted service and automatically provide this data to billing systems via APIs. Network operators and their end-customers can use Blue Planet extensively to troubleshoot network performance issues, monitor and report on network SLAs and make better business planning decisions. |
| Ÿ | Offer a Broad Range of Premium Applications. Our solutions enable network operators to offer a wide range of applications in their regional and metro networks. Blue Planet enables network operators to deliver differentiated Ethernet services that enhance their end-customers’ experiences, allowing network operators to derive additional sources of revenue. For example, our customers frequently offer business Ethernet, wireless backhaul, broadband backhaul, cloud connectivity and wholesale transport. Our solution simplifies and accelerates the delivery of these services for all types of customers, including multinational, regional, wholesale and retail service providers. Moreover, Blue Planet allows network operators to either develop their own custom applications, utilize our applications or seamlessly integrate third-party applications. |
| Ÿ | Scale Networks Cost-Effectively. Our solutions enable network operators to reduce capital and operating expenses by minimizing the need for disparate legacy networks and related software. Moreover, our Z-Series platforms reduce the need for unnecessary routers and optimize cost per bit by transporting traffic over the appropriate network layer according to the needs of the application. Our platforms leverage industry standard components and are designed to be controlled by software, thereby reducing capital expenditures associated with deploying as well as operating expenses associated with monitoring and maintaining our products. The modular design of our solutions further reduces costs by enabling our customers to add services and functionality on a pay-as-you-grow basis as well as by limiting field technician dispatches. Our Blue Planet platform with flexible hosting models, including private, public and hybrid cloud options, significantly reduces costs and administrative burdens associated with network management, software updates, SLA monitoring and network |
84
Table of Contents
| planning. Additionally, our multi-layer approach to networks enhances long-term capital efficiency and reduces operating expenses by enabling our customers to migrate to packet-based networks over time. |
Our Strategy
Our goal is to establish our position as a leading provider of open, multi-vendor, carrier-grade networking solutions. The key elements of our strategy include:
| Ÿ | Extend Our Technology Leadership in High-Performance, Carrier-Grade Networking. Our carrier-grade SDN solution is purpose-built for high-performance network requirements. We intend to leverage our technology leadership position by continuing to define the market requirements for carrier-grade SDNs and high-capacity, multi-layer switching and transport solutions. We also plan to continue to invest in sales and marketing resources to raise awareness of the full benefits of virtualizing high-performance networks. A key element of this strategy is to continue to develop innovative Blue Planet applications, as well as leverage third-party application development through our open APIs. |
| Ÿ | Develop Innovative Products and Technology. We plan to continue to introduce new software and hardware products that enable our customers to more effectively offer new services and increase their profitability. For example, we are developing new applications that enhance the value of our Blue Planet platform as well as new line cards that augment our Z-Series platforms for new use cases. Our strong relationships with our customers provide us with valuable insights into deployment demands, market trends and end-user needs. We plan to leverage these relationships and insights to continue to develop and enhance our solutions. |
| Ÿ | Expand Our Service Provider Customer Base. Because our approach enables service providers to improve the return on their existing networks while transitioning to packet-based networks over time, we target customers through multiple initial deployment opportunities. We have found that our solutions are well suited to deployments that involve green field network projects as well as helping our customers replace or evolve legacy architectures. We recently launched our Blue Planet platform that can be purchased with or without deploying our Z-Series platforms, thus enabling network operators to deploy our network operations services quickly and efficiently in legacy networks. We intend to target new service provider customers by continuing to invest in our sales force, field operations and support functions as well as by deepening our engagement with our current partners and establishing relationships with new channel partners. |
| Ÿ | Sell Additional Solutions to Existing Customers. We intend to sell additional solutions to our growing installed base of existing customers. Our customers have historically purchased our solutions using an incremental approach that begins with a targeted product purchase to address specific services or portions of their networks and expands to additional product purchases as they experience the benefits of our solutions. The loyalty of our customer base is evidenced by the fact that over 90% of our customers, who have been our customers for more than six months, placed additional orders with us following their initial deployments. Our solutions are well suited for a pay-as-you-grow approach. We intend to continue investing in our existing customer relationships to drive the adoption of additional products as our customers scale and evolve their network services over time. |
| Ÿ | Extend Our Presence in New Geographies. We believe that international markets represent a significant growth opportunity for us. As of March 31, 2013, we had over 130 customers, primarily in North America. We have found that establishing relationships with recognized network operators in a new region enables us to win new business at other additional potential customers in the region more rapidly and at a lower acquisition cost. In Asia, Europe and South America, we plan to leverage our relationships with our existing customers to enhance our |
85
Table of Contents
| brand recognition and broaden deployment by other customers in the region. Additionally, we have or are in the process of engaging channel partners in various regions outside of the United States, and we are growing our channel partner network as we continue our growth and international expansion. |
| Ÿ | Expand in Emerging Customer Verticals. We have initially targeted our solutions to traditional service providers, such as local access service providers and regional transport providers. We plan to target emerging customer verticals with use cases well suited to the benefits of our solutions, including large data center networks, governments, cable MSOs as well as enterprises that build and operate large, private networks. |
Our Technology
The key strength of our solutions is the integration of our various packet, optical and software technologies across our range of products. Since our founding in October 2006, we have focused our efforts on developing solutions based on a centralized, open, multi-vendor software orchestration model. Our hardware solutions are comprised of the integration of commercially available network components into a robust packet-optical, high-capacity, multi-layer switching and transport platform. Our software has been designed to provide our customers with the benefits of our solutions regardless of whether deployed in conjunction with our hardware platforms or with third-party hardware platforms. The differentiating elements of our proprietary technology include:
| Ÿ | Scalability. While 10G Ethernet services are the dominant interface of choice in most current networks elements, 100G Ethernet is rapidly evolving and projected to be an increasingly dominant service interface over the next several years. Our Z-Series family of high-capacity, multi-layer switching and transport platforms provide for scalability and density, supporting well over 100G per card slot and hundreds of gigabits to terabits of non-blocking platform capacity. Our Z-Series platforms support 100G of card-to-card interconnectivity through ultra-high-capacity backplanes and switch fabrics providing a simple migration path to 100G Ethernet services support. This non-blocking 100G grooming capability, combined with DWDM line cards, supports a mix of 10G and 100G wavelength services and provides a robust foundation to scale future services. Leveraging our Z-Series architectural scalability and software capabilities, Ethernet services of up to 10G are supported on current line cards, while the ability to support over 100G of protected service capacity per line card slot will enable the migration to future 40G and 100G Ethernet line cards as those technologies mature and become more broadly adopted. In addition, certain features and functionalities, including capacity upgrades, can be enabled remotely through our provisioning software. |
| Ÿ | Multi-Layer Technology. Our Z-Series platforms, as controlled by our orchestration software, direct network traffic across the most appropriate and efficient network layer, including both electrical and optical paths. Our regional and metro network solutions encompass the Ethernet service layer, and other transport layers including connection-oriented Ethernet, SONET, SDH, G.709 OTN and wavelength transport technologies. Our Z-Series platforms facilitate the transition from legacy time-division multiplexing, or TDM, to packet and/or DWDM. Our Z-Series platforms support a complete range of transport requirements across aggregation, transit and hub locations. |
| Ÿ | Open Software Development Process. We have designed our technology to integrate with legacy networks and third-party vendor network infrastructure. The capabilities of our platforms allow our customers to continue to leverage their legacy network investments while migrating to more software-oriented, packet-based networks at their own pace. Additionally, our technology can be integrated into regional and metro networks currently utilizing decades-old OSS and provide our customers with a bridge to migrate from these antiquated systems to our Blue |
86
Table of Contents
| Planet and Z-Series solutions. Additionally, our open APIs allow our customers to custom build their own applications or integrate third-party applications, thereby diversifying the services they can offer and allowing our customers to tailor services to the specific needs of their end-user customers. |
| Ÿ | Abstraction and Visualization. Through the abstraction and centralization of network control software, our technology allows network planning and control decisions to be made with full knowledge of all available network resources and all contractually committed services. These attributes also enable the virtualization of the network for NaaS and other dynamic service capabilities. High-performance networks are comprised of multiple technologies and a number of logical layers which include fibers, DWDM wavelengths, TDM and packet transport technologies and services. We have developed technology that allows for an integrated view and software control of these network elements with unique three-dimensional network visualization. Our software provides end-to-end visibility and control over how circuits and services are groomed and routed as well as the ability to visualize the data path across the nodes, shelves, line cards and optical fibers across the different transport layers of the network. The visibility provided by our software increases the efficiency of network configurations and reduces errors when making additions or changes to the network. |
Products and Solutions
We provide comprehensive solutions consisting of our family of Z-Series high-capacity, multi-layer switching and transport platforms, our Blue Planet carrier-grade SDN orchestration platform and applications and a range of professional services. Network operators can use our software solutions either on a standalone basis or integrated with our hardware solutions, to realize the benefits of our solutions and enable multi-vendor, best-of-breed networks.
We launched our first Z-Series platform in September 2009. Since then, we have led emerging SDN initiatives in the industry through our development of open, multi-vendor, multi-layer planning, management and verification software. In April 2010, we announced one of the industry’s first multi-layer network management solutions. Building on our continued expansion of our software offerings over time, in December 2012, we launched Blue Planet, a carrier-grade SDN platform for regional and metro networks that allows network operators of all types to virtualize networks and simplify the development, deployment and orchestration of scalable communications and business applications over high-performance networks.
Cyan Z-Series
Our Z-Series family of high-capacity, multi-layer switching and transport platforms is comprised of three different chassis that support interchangeable Z-Series line cards that network operators can deploy to allow for scalable solutions from the access edge of the network, across the metro and regional network to the core of the network. Each Z-Series platform is comprised of a chassis that supports a variety of interchangeable line cards to provide a wide range of applications for Ethernet services, TDM or wavelength aggregation, signal grooming and transport services. Our Z-Series platforms integrate with our software, including Blue Planet and our predecessor multi-layer network management solutions, to provide network operators with a range of software solutions.
Our Z-Series platforms are scalable with a backplane and switch fabric design that supports over 100G per line card slot. 100G services can be deployed across our Z-Series platforms via line cards and, in certain cases, software upgrades. Our Z-Series line cards can be software upgraded remotely for future features and functionality. We enable this functionality through our Blue Planet software and associated Z-Series software upgrades without the need for costly field technician deployment.
87
Table of Contents
The Z-Series platforms range in size and capability from the Z22 to the Z77, allowing our Z-Series products to be deployed from the edge to the core of the network as well as in high-performance networks of varying size and capacity. We also offer our Cyan Z-Series L-AMP, which is a fully self-contained line card that is a bi-directional mid-span optical amplifier/repeater. We currently offer approximately 20 different line cards that provide varying functionality to our Z-Series chassis, each of which can be utilized in all of our Z-Series chassis.
The following table highlights our Z-Series platforms:
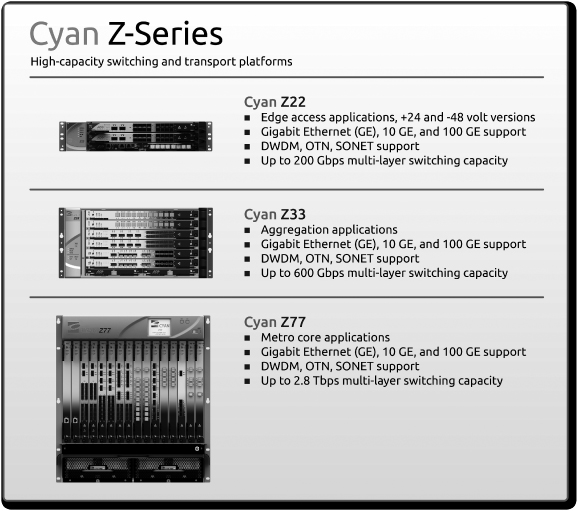
Our Z-Series platforms provide a level of integration that exceeds that available from legacy platforms. For example, a single Z-Series platform natively supports the transportation of packet, TDM and wavelength services with the option of supporting a reconfigurable optical add/drop multiplexer. The solution also supports the functionality and scale of Ethernet transport switches with connection oriented Ethernet transport standards and Metro Ethernet Forum-based services. The Z-Series platforms can be remotely provisioned using our Blue Planet operations app, which provides multi-layer, three-dimensional network visualization, simplifies provisioning and provides ongoing operations support for improved operational performance.
88
Table of Contents
Certain features of our Z-Series platforms can be activated remotely utilizing Blue Planet or our previous network management solutions. For example, many of our Z-Series platforms contain multiple functionalities, some of which may not initially be utilized by our customers. Once a customer decides to implement these capabilities, they can be enabled through Blue Planet.
Cyan Blue Planet
Cyan Blue Planet is a carrier-grade software-defined networking platform that provides network virtualization and service-enabling applications, including networks and service planning, operations and monitoring. This carrier-grade SDN platform includes a core management platform and a range of applications to meet diverse requirements of network virtualization and control across the multiple layers of regional, metro and data center networks. Blue Planet provides for control of multi-vendor networks, and allows network operators to virtualize their networks, make more efficient use of their network assets and accelerate delivery of services to their customers. The Blue Planet platform and apps provide our customers with visibility and centralized control over disparate network elements.
Blue Planet is the latest implementation of the network virtualization and management software that we first introduced in 2009 to work in combination with our Z-Series platforms. Blue Planet is offered as a SaaS subscription model deployed from the cloud or through term licenses with the software installed at our customers’ premises. Blue Planet is available to customers using our Z-Series platforms as well as customers desiring to control networks that do not have any of our hardware deployed.
89
Table of Contents
The Blue Planet software platform is comprised of three fundamental elements: a core operating system, or SDN orchestration layer; applications which provide the interface for and delivery of specific services, referred to as apps; and element adapters that allow customers using Blue Planet to control a wide range of Cyan and third-party network elements in their networks. The following diagram depicts the key elements of the Blue Planet platform:
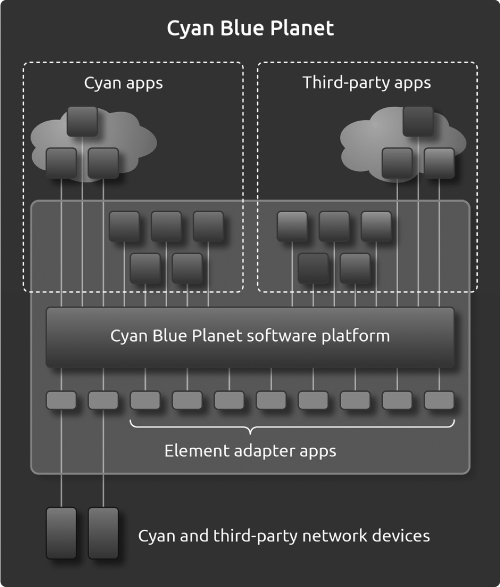
The core of Blue Planet is a carrier-grade SDN orchestration platform, which includes an operating system, a hypervisor, a messaging system, middleware and a web portal, all running on a scalable, distributed, computing environment. Blue Planet provides an open architecture with advanced clustering and database management to meet performance and availability requirements.
Blue Planet offers the capability to deploy an array of apps, including both our own Blue Planet apps, as well as apps built by third-party developers or our customers themselves, to monitor and control underlying network infrastructure and plan, manage, and verify networks and services. Blue
90
Table of Contents
Planet allows apps to interact not only with OpenFlow compliant network devices, but also with legacy devices deployed prior to the development of carrier-grade SDN, thereby providing our customers with added flexibility in network deployment. By allowing our customers to deploy their own apps or third-party apps on Blue Planet, we allow our customers to provide their own unique set of value-added service offerings.
We currently offer the following apps:
| Ÿ | Blue Planet Planning Apps. Blue Planet provides multi-layer network and service planning apps that provide conventional optical layer network design and support concurrent packet, TDM and optical layer designs. Blue Planet integrates with web-based mapping software to provide network architecture location planning for network design. Blue Planet also features latency modeling and prediction applications that factor in the latency allocations of all layers of network service aggregation and transport, as well as fiber latency for accurate predictive SLA performance modeling prior to the deployment of equipment. |
| Ÿ | Blue Planet Operations App. Blue Planet provides a multi-layer operations app that uses three-dimensional network visualization tools to simplify provisioning and fault management with built-in fault correction. This operations app uses our carrier-grade SDN to extend management control to third-party network hardware to further simplify provisioning and troubleshooting. The operations app also offers simplified operations and robust fault management, configuration, accounting, performance and security, referred to as FCAPS. Additionally, our operations app links with our planning app for network provisioning and integration of ongoing network changes, enabling simple and accurate incremental planning activities. |
| Ÿ | Blue Planet Trail Analyzer App. Blue Planet provides a comprehensive top-down view of flows across multiple nodes composing an end-to-end service connection, illustrating the paths of network traffic. We provide “x-ray” vision capabilities to expand visual information, displaying the line cards, ports and faceplate or backplane interconnections associated with each service. The health and status of every monitored point is displayed, across every node, card, port and switch fabric, allowing for focus on the source of service impacting network conditions. |
| Ÿ | Blue Planet Performance and SLA Monitoring App. Blue Planet offers performance monitoring, SLA assurance services and other value-added service extensions. This app allows network operators to provide their customers real-time and historical visibility into the usage and performance of their services. End-to-end SLA performance monitoring and reporting capabilities are offered in order to enhance a network operator’s ability to confirm that they are meeting their service level commitments. The app will also trigger alerts whenever committed metrics are in danger of being violated. |
| Ÿ | CyClone App. Blue Planet allows our customers the ability to create renderings of simulated networks in the cloud, which allows them to alter their networks in a virtual setting in order to simulate the effects of such changes without effecting network services and without the risk of network downtime. |
The third component of the Blue Planet platform is element adapters. These element adapters act as the control and communications interface between the Blue Planet orchestration platform and apps and the specific hardware installed in a network. In addition to providing element adapters for our own Z-Series platforms, we currently offer element adapters that enable monitoring and/or control of approximately 50 network devices from a number of network hardware manufacturers.
91
Table of Contents
Customer Service, Support and Training
CyNOC Professional Services
CyNOC is our network operations center service that offers monitoring and managing of our customers’ services, providing our customers with an added layer of services and support for those that subscribe to this service. CyNOC expands on the power of our Blue Planet platform with network operations center services provided by our customer service engineers. CyNOC services are available in multiple service levels ranging from proactively monitoring to full scale managing of our customer’s Z-Series platforms and legacy network elements. We offer our customers partial or complete NOC services to manage their entire multi-vendor networks. Additionally, a number of our customers who maintain their own internal NOC leverage our services as a backup NOC. These services are typically sold to our customers for a one-year term at the time of the initial product sale, subject to annual renewals thereafter.
Maintenance, Support and Training Services
We offer Cyan PRO professional services to provide ongoing technical support with our hardware and software products through a variety of service packages to meet the requirements of most network operators as well as customized packages to meet more specialized requirements. We provide this variety of customer service products and support through our technical support engineers as well as through our growing network of authorized and certified channel partners. Our customer support organization operates 24 hours a day and is available by phone, email and online through our customer portal and offers a single point of contact for technical assistance with hardware, software and network issues. Additionally, we offer our end-user customers access to ongoing software updates, upgrades, bug fixes and repairs when and if available. We also have a customer portal available through our website which allows our channel partners and our customers to manage support tickets, download software and search our online knowledge database. These services are sold to our customers typically for one-year terms at the time of the initial product sale, subject to annual or multi-year renewals thereafter.
CySupport is our integrated software maintenance and technical support services package, which provides all essential software and services in one simple and cost-effective package.
CyService encompasses a range of additional professional services to assist our customers in their operations, including network deployment and installation services. We offer an innovative suite of professional services to ensure successful network deployment that can be tailored to the needs of our customers and range from site surveys to test plan creation. In addition to complete engineer, furnish and install, or EF&I, services, we also offer assistance with network design, integration and migration planning, network performance analysis, and installation of both our products as well as third-party equipment. These services are invoiced separately at the time of the initial product sale.
We also provide training services to educate our end-customers on the implementation, use, functionality and ongoing maintenance of our products. These training services can be provided at our facilities, on-site at the location of our customer’s choice or through a variety of multimedia resources based upon customer preference.
Customers
We sell our Z-Series and Blue Planet platforms and other services primarily to service providers and high performance data center and private network operators.
92
Table of Contents
As of March 31, 2013, our solutions have been sold to over 130 customers, including our top ten customers by revenue in 2012, DukeNet Communications, LLC, Great Plains Communications Inc., Intelleq Communications LLC, Lynx Network Group, Inc., TDS Telecommunications Corporation, US Carrier Telecom, LLC, US Signal Company, LLC, Vision Net, Inc., Windstream Corporation and Zayo Group, LLC. For the years ended December 31, 2011 and 2012, and the three months ended March 31, 2013, our largest customer was Windstream Corporation, which accounted for approximately 37%, 45% and 47% of our revenue, respectively. No other customer represented greater than 10% of our revenue in any of these periods.
All orders by Windstream are made pursuant to purchase orders but not pursuant to a long-term purchase commitment. We expect our revenue derived from sales to Windstream to decline in future periods. Revenue from customers located outside of the United States was approximately 1%, 5% and 1% of our revenue for the years ended December 31, 2011 and 2012, and the three months ended March 31, 2013, respectively. The loyalty of our customer base is evidenced by the fact that over 90% of our customers, who have been our customers for more than six months, placed additional orders with us following their initial deployments.
Our sales are made primarily pursuant to purchase orders with our customers rather than pursuant to committed long-term supply contracts. At any given time, we have backlog orders for products that have not shipped. Our backlog consists of confirmed orders for products scheduled to be shipped to customers, generally within the same quarter. Because customers may cancel purchase orders or change delivery schedules without significant penalty, we believe that our backlog at any given date may not be a reliable indicator of future operating results. The amount of our aggregate order backlog was approximately $11.1 million, $12.6 million and $17.2 million as of December 31, 2011 and 2012, and March 31, 2013, respectively.
Case Studies
We believe that the following case studies provide a representative sample of how our customers deployed and benefited from our solutions.
Leading U.S. Telecommunications Provider
The Problem: A leading nationwide provider of telecommunication and network services to business and residential customers needed to expand its network’s transport capacity to accommodate increasing demands for Ethernet services. This customer’s existing SONET-based optical network and legacy MSPP platforms were unable to cost-effectively transport Ethernet and other packet-based services or efficiently leverage its existing fiber network.
Solutions and Benefits: This customer deployed our Z33 platforms to transition to a packet-optical network optimized for Ethernet and other premium services. Our Z-Series platforms, equipped with our WDM line cards, significantly increased our customer’s network capacity by efficiently transporting both Ethernet and SONET traffic over a single fiber pair while leveraging its existing SONET-based hardware. By deploying our solutions, this customer was also able to significantly reduce its capital expenditures relative to alternative solutions it evaluated. Additionally, in order to fully realize the capabilities of our Z-Series platforms, this customer embraced the management capabilities of our CyMS management solution. Subsequently, this customer deployed the full suite of our Z-Series solutions throughout its extensive network and selected us as one of its primary suppliers for regional and metro network infrastructure hardware and management software solutions.
Wireless Backhaul Provider
The Problem: A large regional provider of wireless backhaul and other network transport services needed to provide its wireless service provider customers with monitoring and assurance solutions that
93
Table of Contents
could confirm that SLA performance metrics were being met. This customer operates a multi-vendor network delivering packet and optical services requiring significant personnel resources and various software systems to monitor the third-party equipment separately. This multi-faceted monitoring environment made it difficult for our customer to monitor its SLA compliance, and was incapable of providing real-time visibility to its end-customers.
Solutions and Benefits: This customer installed CyPortal, an early version of our Blue Planet performance and SLA monitoring app, to provide SLA performance monitoring for its own operations personnel as well as to its end-customers. Through the deployment of our solution, this customer was able to provide its end-customers with reporting and visibility of its SLA compliance through a cloud-based web portal. In addition, the open, standards-based architecture of CyPortal supports a number of third-party hardware elements in the network, allowing our customer and its end-customers to monitor network services from end-to-end across multi-vendor environments riding third-party waves and ITU standard DWDM channels. Following the deployment of our software solution, this customer approached us and another vendor to provide backhaul services to support a wireless service provider’s LTE deployment. Together, we designed and deployed a new metro Ethernet-based backhaul network that incorporated our Z-Series platforms. Our hardware and software solutions were integrated with third-party products to manage and operate the multi-vendor network as well as provide SLA assurance.
Global Telecommunications Provider
The Problem: A global telecommunications provider wanted to develop a more scalable metro network architecture to cost-effectively interconnect its data centers, extend 10G metro network services to its enterprise customers and better leverage its extensive global IP network. The customer had been utilizing a router-based approach for its metro network, which had limited capacity and did not allow for the cost-efficient deployment of new network infrastructure or services on an as-needed basis.
Solutions and Benefits: This customer used our CyService offering to design its network and installed our Z33 platforms to implement WDM over leased optical fibers between its data centers, thereby increasing the capacity and flexibility of its metro network to better serve its enterprise customers in one large U.S. metropolitan area. Our scalable Z-Series architecture enabled our customer to cost-effectively build out its metro network on an as-needed basis. The customer subsequently implemented our Blue Planet carrier-grade SDN platform and management application, and later developed and deployed its own Blue Planet app that facilitated system configuration and integration of its OSS with network elements. This customer has since utilized our Z-Series and Blue Planet platforms to build out metro networks in multiple cities in the United States, Europe and Asia to better leverage its global IP footprint. By deploying Blue Planet, this customer accelerated its time to delivery of new services and reduced ongoing network management and monitoring costs.
Sales and Marketing
We sell our products and services in the United States through a direct sales force. During 2012 we began to direct a portion of our sales and marketing efforts to international markets. Although initial sales outside of the United States were through our direct sales force, we are continuing to build our network of channel partners through which we expect to make a substantial portion of our international sales in future periods. As of March 31, 2013, we had 108 employees in our sales and marketing organization. Our direct sales teams are typically comprised of a combination of a sales representative and a systems engineer. Each sales team is responsible for a specific geographical territory, has responsibility for a number of major direct end-user customer accounts or has assigned accounts in a specific vertical market. Our direct sales force is primarily based in our headquarters in Petaluma, California with additional sales personnel located in select locations elsewhere in the United States as well as in the United Kingdom, the Netherlands, Germany, China, Hong Kong, Japan, Korea and Australia.
94
Table of Contents
Our sales process entails planning discussions with prospective customers, analyzing their existing networks and identifying how these potential customers can leverage our solutions within their network. The sales cycle for the initial targeted product purchase, from the time of prospect qualification to the completion of the first sale, may span multiple quarters. Typically, after we have completed an initial sale with a customer, we experience shorter sales cycles for additional orders as a result of the customer having previously implemented our solutions. The loyalty of our customer base is evidenced by the fact that over 90% of our customers, who have been our customers for more than six months, placed additional orders with us following their initial deployments.
We currently have channel partners in Asia and Europe to whom we provide marketing assistance, technical training and support. In addition to their lead generation and sales activities, our channel partners perform installation services as well as some level of support to their customers. We are in the process of expanding our channel partner network both internationally and in the United States.
Our marketing strategy is focused on building our brand, communicating product advantages and increasing customer awareness of our solutions, particularly our recently launched Blue Planet platform. We execute on this strategy through a variety of marketing vehicles, including trade shows, advertising, public relations, industry research, our website and collaborative relationships with technology vendors. Our marketing activities, including demand generation activities, are focused primarily on local access service providers, regional transport providers, data center operators, cable MSOs, private network operators and wholesale carriers. We also focus on ongoing account management for existing customers and the development of follow-on sales as our existing end-user customers continue to expand and enhance their demand for our products.
Our sales and marketing expenses were $8.0 million, or 30.5% of our revenue, in the three months ended March 31, 2013, $25.2 million, or 26.3% of our revenue, in the year ended December 31, 2012, $12.8 million, or 31.7% of our revenue, in the year ended December 31, 2011, and $7.9 million, or 33.7% of our revenue, in the year ended December 31, 2010.
Research and Development
The intensely competitive nature of the industry in which we operate makes it critical that we continue to focus on investment in research and development. To this end, we utilize data-driven development methodologies to accelerate our time to market. Our research and development efforts focus primarily on improving and enhancing our existing hardware and software solutions as well as developing new products and additional features and functionality.
As of March 31, 2013, we had 115 employees in our research and development organization, the substantial majority of whom were located at our headquarters in Petaluma, California. Our research and development expenses were $7.2 million, or 27.5% of our revenue, in the three months ended March 31, 2013, $18.4 million, or 19.2% of our revenue, in the year ended December 31, 2012, $13.0 million, or 32.1% of our revenue, in the year ended December 31, 2011, and $10.4 million, or 44.4% of our revenue, in the year ended December 31, 2010. We plan to continue to dedicate significant resources to our research and development efforts.
Manufacturing
We subcontract the manufacture of all of our hardware products to a leading contract manufacturer, Flextronics, which purchases components from our approved list of suppliers and builds our hardware appliances according to our specifications at its Milpitas, California facility. Our outsourcing of our hardware manufacturing extends from prototypes to full production and includes activities such as material procurement, software implementation, and final assembly and testing. Once the completed products are manufactured and tested, Flextronics ships our products directly or
95
Table of Contents
through our third-party distribution centers to our customers for installation. By utilizing this outsourcing strategy, we are able to optimize our operations by lowering costs and reducing time to market.
Our contract manufacturer generally manages the procurement of the components and parts used in our products. We also engage in direct sourcing of certain strategic components. While our preference is to select components and materials that are available from multiple sources, we utilize a number of components that are available from only one source. Generally, neither we nor our contract manufacturer have written agreements with these sole-source component providers to guarantee the supply of the key components used in our hardware products. However, we regularly monitor the supply of components and the availability of qualified and approved alternative sources. We provide forecasts to Flextronics so that they can purchase key components in advance of their anticipated use, with the objective of maintaining an adequate supply of those components.
We have entered into a manufacturing services agreement with Flextronics, dated June 22, 2007, pursuant to which Flextronics manufactures, assembles and tests our products. This agreement permits Flextronics to procure materials and components required for the manufacture and testing of our products while also reserving our right to direct Flextronics to purchase specific materials and components from specified vendors. We also provide Flextronics with a list of preferred vendors from which it will attempt to source components first before seeking other sources of supply. The initial term of this agreement was five years, with the term automatically renewing for additional one-year terms, unless terminated by either party by giving 90 days or more written notice prior to the end of the then current term. Additionally, either party may terminate the agreement by giving written notice if the other party has materially breached its obligations under the agreement, subject to applicable cure periods.
Although the contract manufacturing services required to manufacture and assemble our products may be readily available from a number of established manufacturers, it is time consuming and costly to qualify and implement contract manufacturer relationships. As a result, if Flextronics or our sole-source component suppliers suffer an interruption in their businesses, or experience delays, disruptions or quality control problems in their manufacturing operations, or we have to change or add additional contract manufacturers or suppliers of our sole-sourced components, our ability to ship our products to our customers could be delayed, and our business, operating results and financial condition could be adversely affected.
Competition
The markets in which we compete are highly competitive and characterized by rapidly changing customer needs and continually evolving industry standards. We expect competition to intensify in the future as existing competitors and new market entrants introduce new products or enhance existing products. Our business will be adversely affected if we are unable to meet the demand for existing products and innovate to bring new products and solutions to market.
We compete either directly or indirectly with large networking and optical companies, such as Alcatel-Lucent SA, Ciena Corporation, Cisco Systems, Inc., Fujitsu Limited, Huawei Technologies Co. Limited and Juniper Networks, Inc., and specialized technology providers that offer point solutions that address a portion of the issues that we solve. In addition, we seek to replace legacy network control tools and processes that have already been purchased or were internally developed, and potential customers may be reluctant to adopt a solution that replaces or changes existing tools and processes in which they have made significant investments.
The principal competitive factors applicable to our products include:
| Ÿ | service breadth and functionality; |
96
Table of Contents
| Ÿ | performance, reliability and security; |
| Ÿ | price; |
| Ÿ | speed and ease of use and deployment; |
| Ÿ | existing deployed base; and |
| Ÿ | brand awareness and reputation within the market. |
Although we believe that we compete favorably with respect to the above factors, we expect competition and competitive pressure, from both new and existing competitors, to increase in the future. Additionally, some of our competitors have greater name recognition, longer operating histories, well-established relationships with customers or channel partners in our market and substantially greater financial, technical, personnel and other resources than we have. Our competitors may be able to anticipate, influence or adapt more quickly to new or emerging technologies and changes in customer requirements, devote greater resources to the promotion and sale of their products and services, initiate or withstand substantial price competition, take advantage of acquisitions or other opportunities more readily and develop and expand their product and service offerings more quickly than we can. In addition, competitors with substantially larger installed customer bases beyond the packet-optical solutions and NaaS markets may leverage their relationships based on other products or incorporate functionality into existing products in a manner that may discourage users from purchasing our solutions. These larger competitors may also have more diversified businesses that allow them to better withstand significant reduction in capital spending by end-user customers. Moreover, potential customers may also prefer to purchase from their existing providers rather than a new provider, regardless of product performance or features, because our solutions may require additional investment of time and funds to install. In addition, as a result of these transition costs, competition to secure contracts with potential customers is particularly intense. Some of our competitors may offer substantial discounts or rebates to win new customers. If we are forced to reduce prices in order to secure customers, we may be unable to sustain gross margins at desired levels or achieve profitability. In the future, in selling Blue Planet we may also compete with companies that are focused on providing virtualization software solutions for other end-markets as they may try to adapt their solutions to meet the needs of network operators or compete with networking companies that develop or acquire SDN solutions. Some of our competitors have made acquisitions of businesses that may allow them to offer more directly competitive and comprehensive solutions than they had previously offered.
Intellectual Property
Our success as a company depends critically upon our ability to protect our core technology and intellectual property. To accomplish this, we rely on a combination of intellectual property rights, including trade secret laws, copyrights, patents and trademarks, as well as customary contractual protections. As of March 31, 2013, we had three issued U.S. patents set to expire between 2029 and 2030. We also license software from third parties for integration into our products, including open source software and other commercially available software.
We generally control access to and use of our proprietary software and other confidential information through the use of internal and external controls, including contractual protections with employees, contractors, customers and partners, and our software is protected by U.S. and international copyright laws. We also incorporate certain generally available software programs into Blue Planet and our other software solutions pursuant to license agreements with third parties.
The steps we have taken to protect our intellectual property rights may not be adequate. Third parties may infringe or misappropriate our intellectual property rights. We may initiate claims against
97
Table of Contents
third parties that we believe are infringing our intellectual property rights if we are unable to resolve matters satisfactorily through negotiation. If we fail to protect our intellectual property rights adequately, our competitors could offer similar products, potentially harming our business.
Employees
As of March 31, 2013, we had 254 employees. None of our employees is represented by a labor union or is a party to any collective bargaining arrangement in connection with his or her employment with us and we consider our relations with our employees to be good.
Facilities
Our headquarters occupy approximately 22,780 square feet in Petaluma, California under a lease, a portion of which expires in May 2015 and the remainder of which expires in October 2018. We have leased additional offices for our sales and marketing personnel in additional locations on leases that generally have term of one year or less. Our current facilities are adequate to meet our existing needs. However, to the extent we meet our current growth expectations, we will need to expand our facilities. We believe that we will be able to obtain additional or substitute facilities on commercially reasonable terms.
Regulation
We are subject to federal, state and local laws, regulations, guidelines and determinations, common laws, codes of conduct and other similar parameters that directly and indirectly impact our business and methods of operation, including export control classifications. We also work closely with our contract manufacturer to ensure that their activities on our behalf also comply with applicable regulations, including export regulations.
Legal Proceedings
We are not party to any legal proceedings the outcome of which, we believe, if determined adversely to us, would individually or in the aggregate have a material adverse effect on our future business, consolidated results of operations, cash flows or financial position. We may, from time to time, be subject to legal proceedings and claims arising from the normal course of business activities.
On February 11, 2013, John Halliwell, a former employee of ours, filed a lawsuit against us in the Superior Court of the State of California alleging that we wrongfully terminated his employment. The complaint seeks damages of an unspecified amount. We believe that we have meritorious defenses to the allegations set forth in the complaint and intend to vigorously defend the action. While it is not possible at this stage to predict the outcome of this matter, we do not believe that, even in the event of an unfavorable outcome, the damages would have a material impact on us.
98
Table of Contents
Executive Officers and Directors
The following table provides information regarding our executive officers, key employees and directors as of April 25, 2013:
| Name |
Age | Position | ||||
| Executive Officers | ||||||
| Mark A. Floyd |
57 | Chief Executive Officer and Chairman of the Board | ||||
| Michael L. Hatfield |
50 | President and Director | ||||
| Norman L. Foust |
48 | Vice President of Operations | ||||
| James A. Hamilton |
49 | Senior Vice President of Worldwide Sales | ||||
| Scott A. Pradels |
39 | Vice President of Engineering | ||||
| Kenneth M. Siegel |
54 | Vice President and General Counsel | ||||
| Michael W. Zellner |
57 | Vice President and Chief Financial Officer | ||||
| Key Employees | ||||||
| Scott T. Bauer |
43 | Vice President of Finance | ||||
| Eric M. Clelland |
50 | Vice President of North American Sales | ||||
| Thomas A. Corker |
48 | Vice President of Product Management and Business Development | ||||
| Joseph R. Cumello |
41 | Chief Marketing Officer | ||||
| J. Rick Johnston |
51 | Vice President of Business Operations and Customer Service | ||||
| Steve J. West |
56 | Chief Technology Officer | ||||
| Non-Employee Directors | ||||||
| Michael J. Boustridge |
50 | Director | ||||
| Paul A. Ferris |
42 | Director | ||||
| Promod Haque |
65 | Director | ||||
| M. Niel Ransom |
63 | Director | ||||
| Robert E. Switz |
66 | Director | ||||
Executive Officers
Mark A. Floyd has served as our Chief Executive Officer since May 2012 and on our board of directors since October 2008 and was appointed chairman of our board of directors in November 2011. Prior to joining us, Mr. Floyd served as Chief Executive Officer of SafeNet, Inc., a data security company, from July 2009 to July 2011. From May 2008 to June 2009, Mr. Floyd served as a venture partner at Sevin Rosen Ventures, and from March 2007 to March 2008 served in the same capacity at El Dorado Ventures, each of which is a venture capital firm. Previously, Mr. Floyd served as president and Chief Executive Officer of Entrisphere, Inc., a telecommunications equipment company, from August 2002 until its acquisition by Ericsson, Inc. in February 2007. Mr. Floyd served as a director of Tekelec, Inc., a network applications company, from October 2004 to May 2011 and Carrier Access Corporation, a telecommunications equipment manufacturer, from June 2001 to March 2008. Mr. Floyd holds a B.B.A. in Finance from the University of Texas.
We believe that Mr. Floyd is qualified to serve as a member of our board of directors because of the perspective he brings as our Chief Executive Officer and because of the knowledge and experience he brings having held officer and director positions at numerous other successful private and public companies.
Michael L. Hatfield co-founded our company in October 2006 and has served as our president and on our board of directors since inception. Mr. Hatfield also served as our Chief Executive Officer from October 2006 to May 2012. Prior to co-founding our company, Mr. Hatfield co-founded and served as Chief Executive Officer of Calix, Inc., a communication systems company, from August 1999
99
Table of Contents
to December 2005. From May 1997 to October 1998, Mr. Hatfield served as Chief Operating Officer of Cerent Corporation, an optical equipment company. Mr. Hatfield holds a B.S. in Electrical Engineering and Mathematical Economics from Rose-Hulman Institute of Technology and an M.B.A. in Finance from Indiana University.
We believe that Mr. Hatfield is qualified to serve as a member of our board of directors because of the perspective and experience he brings as our co-founder and president and because of his experience in founding and growing technology companies.
Norman L. Foust has served as our Vice President of Operations since March 2007. Prior to joining us, Mr. Foust served as Vice President of Operations and Director of Operations at Dilithium Networks, Inc., a telephony equipment provider, from March 2005 to March 2007. From March 2000 to March 2005, Mr. Foust was the Director of Operations and Director of Supply Chain at Calix, Inc., a communication systems company. Previously, Mr. Foust served as Director of Materials and Planning Manager with Advanced Fibre Communications, Inc., a telecommunications company. Mr. Foust holds a B.S.I.E. in Industrial Engineering from Penn State University.
James A. Hamilton has served as our Senior Vice President of Worldwide Sales since March 2013. Prior to joining us, he served as President of Click Security, Inc., a security analytics company, from March 2012 to March 2013. From September 2011 to February 2012, he served as Chief Executive Officer of CPSG Partners, a professional services and consulting company. From November 2009 to September 2011, Mr. Hamilton served as Senior Vice President of Corporate Development at SafeNet, Inc., a data security company. Mr. Hamilton served as President and Chief Operating Officer of TippingPoint Technologies, Inc., a supplier of intrusion prevention systems, from September 2003 until January 2005, when it was acquired by 3Com Corporation, a digital electronics manufacturer. As a result of the acquisition, from January 2005 to April 2009, Mr. Hamilton was employed in various capacities by 3Com serving most recently as President of the TippingPoint Division. Mr. Hamilton currently serves on the boards of directors of CSPG Partners and Commtouch Software Ltd., a provider of internet security technology. Mr. Hamilton holds a B.S. in Computer Science from Lawrence Technological University.
Scott A. Pradels has served as our Vice President of Engineering since April 2010. He previously served as our Director of Engineering and Manager of Hardware Engineering from November 2006 to April 2010. Prior to joining us, Mr. Pradels was a staff engineer at Turin Networks, Inc., a carrier Ethernet solutions company, from October 1999 to November 2006. From January 1997 to October 1999, Mr. Pradels was a Design Engineer in the Advanced Research and Development group at Advanced Fibre Communications, Inc., a telecommunications company. Mr. Pradels holds a B.S. in Electrical Engineering from California State University, Chico.
Kenneth M. Siegel has served as our Vice President and General Counsel since September 2012. Prior to joining us, Mr. Siegel served as Senior Vice President and General Counsel at QuinStreet, Inc., an online performance marketing company, from February 2012 to September 2012. From February 2010 to February 2012, Mr. Siegel served as Senior Vice President and General Counsel at SafeNet, Inc., a data security company. From February 2006 to February 2010, Mr. Siegel served as Vice President and General Counsel at Verigy Ltd., a semiconductor automatic test equipment business acquired by Advantest Corporation in July 2011. From October 2003 to January 2006, Mr. Siegel served as Senior Vice President and General Counsel at Agile Software Corporation, a provider of product lifecycle management software that was later acquired by Oracle Corporation. Mr. Siegel holds a B.A. in International Policy Studies from the Monterey Institute of International Studies and a J.D. from the University of California Hastings College of the Law.
Michael W. Zellner has served as our Chief Financial Officer since February 2013. Prior to joining us, Mr. Zellner served as Vice President, Finance and Chief Financial Officer at PMC-Sierra,
100
Table of Contents
Inc., a semiconductor solutions company, from March 2007 to November 2012. From October 2000 through February 2007, he served as Senior Vice President of Finance and Administration and Chief Financial Officer at Wind River Systems, Inc., a software company acquired by Intel Corporation. Additionally, Mr. Zellner currently serves on the board of directors of FormFactor, Inc., a wafer probe card company. Mr. Zellner has completed the Stanford Executive Program at Stanford University Graduate School of Business and holds a B.B.A. in accounting and an M.B.A from Florida Atlantic University.
Key Employees
Scott T. Bauer has served as our Vice President of Finance since February 2013, and previously served as our Chief Financial Officer from February 2011 to February 2013. Prior to joining us, Mr. Bauer served as Chief Financial Officer at Yipes Enterprise Services, Inc., a communications services provider, from November 2006 to April 2010. Previously, Mr. Bauer served as Vice President and Corporate Controller at Ask Jeeves, Inc., an Internet search engine company acquired by IAC/InterActiveCorp in July 2005, from August 2002 to November 2005 and as its Director of Treasury and Strategic Transactions from March 2000 until July 2002. Mr. Bauer holds a B.A. in Business Economics from the University of California, Santa Barbara and an M.B.A. from the University of Southern California.
Eric M. Clelland is one of our founders and has served as our Vice President of North American Sales since August 2012. He previously served as our Chief Marketing Officer from August 2012 to April 2013 and in various sales and marketing positions from October 2006 to August 2012. Prior to joining us, Mr. Clelland served as Vice President of Sales at Caymas Systems, Inc., a network security company from April 2002 to April 2006. Prior to joining Caymas, Mr. Clelland was a senior sales executive at Cisco Systems, Inc., a networking equipment company, from November 1999 to March 2002. Mr. Clelland holds a B.S. in Electrical Engineering from Oakland University and an M.S. in Electrical Engineering from the University of Michigan.
Thomas A. Corker has served as our Vice President of Product Management and Business Development since September 2009. From October 2006 until joining us, Mr. Corker was an independent business consultant. Prior to that, Mr. Corker co-founded Calix, Inc., a communication systems company, in August 1999 and held the position of Vice President and General Manager of Access Products until October 2006. Previously, Mr. Corker served as Vice President of Product Marketing at Cerent Corporation, an optical equipment company, from January 1997 to December 1999. From 1994 to 1997 Mr. Corker served as Director of Product Marketing at Advanced Fibre Communications, Inc., a telecommunications company. Mr. Corker holds a B.S. in Electrical Engineering and an M.S. in Electrical Engineering from the Georgia Institute of Technology.
Joseph R. Cumello has served as our Chief Marketing Officer since April 2013. Prior to joining us, Mr. Cumello served as Vice President of Marketing for Sidera Networks, Inc., a fiber communications service provider, from January 2012 to April 2013. From October 2010 to January 2012, Mr. Cumello served as Vice President of Marketing for SafeNet, Inc., a data security company. From September 2002 until October 2010, Mr. Cumello held various positions with Ciena Corporation, a networking equipment company, most recently serving as Senior Director of Global Field and Industry Marketing. Mr. Cumello holds a B.A. in English from the University of Maryland at College Park.
J. Rick Johnston is one of our founders and has served as our Vice President of Business Operations and Customer Service since June 2008. He served as our Vice President of Business Development from October 2006 until June 2008. Prior to joining us, Mr. Johnston was a co-founder and Vice President of Business Development at Calix, Inc., a communication systems company, from September 1999 to October 2006. Previously, from May 1994 to September 1999, he served as Vice
101
Table of Contents
President of Customer Service at Advanced Fibre Communications, Inc., a telecommunications company. Mr. Johnston holds a B.S. in Electrical and Electronics Engineering from New Mexico State University.
Steve J. West is one of our founders and has served as our Chief Technology Officer since October 2006. From August 2005 until co-founding our company in October 2006, Mr. West was involved in developing the concepts upon which our company was founded. Prior to co-founding our company, Mr. West was a founder and Vice President of Architecture at Turin Networks, Inc., a carrier Ethernet company, from October 1999 to July 2005. From March 1993 until September 1999, Mr. West served in various capacities including as Director of International Product Development at Advanced Fibre Communications Inc., a telecommunications equipment company. Mr. West holds a BSc and an MSc in Engineering from the University of the Witwatersrand.
Non-Employee Directors
Michael J. Boustridge has served on our board of directors since August 2012. Mr. Boustridge has served as Chief Executive Officer of BoKiwi Corporation, a consulting services firm, since June 2011. From April 2007 to April 2011, he served as President of BT Global Services, a division of United Kingdom telecommunications operator BT Group. Mr. Boustridge currently serves on the boards of directors of CIBER, Inc., an information technology consulting and managed services company, and Riverbed Technology, Inc., an information technology performance company. Prior to joining BT, Mr. Boustridge was with Electronic Data Systems Corporation, an information technology equipment and services company acquired by Hewlett-Packard Company, from January 1996 to March 2007, where he served in various executive roles, most recently as Chief Sales and Chief Marketing Officer.
We believe that Mr. Boustridge is qualified to serve as a member of our board of directors because of his extensive background working with technology companies.
Paul A. Ferris has served on our board of directors since February 2007. Mr. Ferris has been a general partner of Azure Capital Partners, a venture capital firm he co-founded, since April 2000. Prior to Azure Capital, Mr. Ferris worked at several investment banks, including Credit Suisse First Boston, where he was the global head of the communications investment banking group, and at Deutsche Bank Securities Inc. and Morgan Stanley & Co., where he focused on emerging technology companies. He currently serves on the board of directors of Breaktime Studios, Inc. and previously served as a director of Calix, Inc. from June 2000 until July 2010. Mr. Ferris holds B.A. degrees in Computer Science and English from Amherst College.
We believe that Mr. Ferris is qualified to serve as a member of our board of directors because of his experience in the venture capital industry analyzing, investing in and serving on the boards of directors of technology companies, as well as his perspective as a representative of one of our largest stockholders.
Promod Haque has served on our board of directors since April 2007. Dr. Haque has been a senior managing partner of Norwest Venture Partners, a venture capital firm, since January 2013 and had previously served as a managing partner since 1990. He currently serves on the boards of directors of several privately held companies, including FireEye, Inc., Apigee Corporation, PCH International, Virtela Technology Services Incorporated and Health Catalyst, LLC, and previously served on the board of directors of Persistent Systems Limited from November 2005 to November 2010 and as a chairman of the board of directors of Veraz Networks, Inc., a provider of application, control and bandwidth optimization solutions, from July 2001 until October 2010 when it merged with Dialogic Corporation. Dr. Haque holds a B.S. in Electrical Engineering from the University of Delhi, India, an M.B.A. from Northwestern’s Kellogg Graduate School of Management and a Ph.D. in Electrical Engineering from Northwestern University.
102
Table of Contents
We believe that Dr. Haque is qualified to serve as a member of our board of directors because of his experience in the venture capital industry analyzing, investing in and serving on the boards of directors of technology companies, as well as his perspective as a representative of one of our largest stockholders.
M. Niel Ransom has served on our board of directors since September 2009. Dr. Ransom has served as President and Chief Executive Officer of Ransomshire Associates, Inc., an advisory venture capital firm he founded, since July 2005. He currently serves on the board of directors of Radisys Corporation, a provider of embedded wireless infrastructure solutions, and several privately held companies and served on the board of directors of Applied Micro Circuits Corporation, a fabless semiconductor company, from July 2006 to August 2009. Dr. Ransom holds B.S. and M.S. degrees in Electrical Engineering from Old Dominion University, an M.B.A. from the University of Chicago, Graduate School of Business and a Ph.D. in Electrical Engineering from the University of Notre Dame.
We believe that Dr. Ransom is qualified to serve as a member of our board of directors because of his technical expertise, his experience in senior management positions at several communications companies and his business background.
Robert E. Switz has served on our board of directors since March 2011. Mr. Switz served as President and Chief Executive Officer of ADC Telecommunications, Inc., a supplier of broadband network equipment and software from August 2003 to December 2010 when it was acquired by Tyco Electronics, Ltd. From 1994 until August 2003 he served in various senior management positions at ADC, including Chief Financial Officer. Mr. Switz was appointed a director of ADC in August 2003 and was appointed Chairman of the Board in August 2008. Mr. Switz currently serves on the boards of directors of Broadcom Corporation, a semiconductor solution for wired and wireless communications, GT Advanced Technologies Inc., a supplier of polysilicon production technology, Leap Wireless International, Inc., a wireless communications provider, and Micron Technology, Inc., a semiconductor company. Mr. Switz holds a B.S. in Business Administration from Quinnipiac University and an M.B.A. from the University of Bridgeport.
We believe that Mr. Switz is qualified to serve as a member of our board of directors because of his extensive background working with technology companies.
There are no family relationships among any of our directors or executive officers.
Code of Business Conduct and Ethics
Our board of directors has adopted a code of business conduct and ethics that applies to all of our employees, officers and directors, including our Chief Executive Officer, Chief Financial Officer and other principal executive and senior financial officers.
Board of Directors
Our business and affairs are managed under the direction of our board of directors. The number of directors will be fixed by our board of directors, subject to the terms of our amended and restated certificate of incorporation and amended and restated bylaws that will become effective immediately prior to the completion of this offering. Upon the completion of this offering, our board of directors will consist of seven directors, four of whom will qualify as “independent” under the New York Stock Exchange listing standards.
In accordance with our amended and restated certificate of incorporation and our amended and restated bylaws, immediately after the completion of this offering our board of directors will be divided
103
Table of Contents
into three classes with staggered three-year terms. Only one class of directors will be elected at each annual meeting of our stockholders, with the other classes continuing for the remainder of their respective three-year terms. Our directors will be divided among the three classes as follows:
| Ÿ | the Class I directors will be Messrs. Floyd and Ferris, and their terms will expire at the annual meeting of stockholders to be held in 2014; |
| Ÿ | the Class II directors will be Messrs. Haque, Hatfield and Ransom, and their terms will expire at the annual meeting of stockholders to be held in 2015; and |
| Ÿ | the Class III directors will be Messrs. Boustridge and Switz, and their terms will expire at the annual meeting of stockholders to be held in 2016. |
Any increase or decrease in the number of directors will be distributed among the three classes so that, as nearly as possible, each class will consist of one-third of the directors.
This classification of our board of directors may have the effect of delaying or preventing changes in control of our company.
Director Independence
Our board of directors has undertaken a review of the independence of each director. Based on information provided by each director concerning his background, employment and affiliations, our board of directors determined that Messrs. Ferris, Haque, Ransom and Switz do not have a relationship that would interfere with the exercise of independent judgment in carrying out the responsibilities of a director and that each of these directors is “independent” as that term is defined under the applicable rules and regulations of the SEC and the listing requirements and rules of the New York Stock Exchange. In making these determinations, our board of directors considered the current and prior relationships that each non-employee director has with our company and all other facts and circumstances our board of directors deemed relevant in determining their independence, including the beneficial ownership of our capital stock by each non-employee director, and the transactions involving them described in the section titled “Certain Relationships, Related Party and Other Transactions.”
Committees of the Board of Directors
Our board of directors has established an audit committee and a compensation committee and, effective prior to the completion of this offering, will establish a nominating and governance committee. The composition and responsibilities of each of the committees of our board of directors is described below. Members will serve on these committees until their resignation or until otherwise determined by our board of directors.
Audit Committee
Our audit committee is comprised of Messrs. Haque, Ransom and Switz, with Mr. Switz serving as chairman. Messrs. Ransom and Switz meet the requirements for independence of audit committee members under current New York Stock Exchange listing standards and SEC rules and regulations. Each member of our audit committee meets the financial literacy requirements of the current New York Stock Exchange listing standards. We expect to satisfy the member independence requirements for the audit committee prior to the end of the transition period provided under current New York Stock Exchange listing standards and SEC rules and regulations for companies completing their initial public offering. In addition, our board of directors has determined that Mr. Switz is an audit committee financial expert within the meaning of Item 407(d) of Regulation S-K under the Securities Act. The responsibilities of our audit committee include, among other things:
| Ÿ | selecting a qualified firm to serve as the independent registered public accounting firm to audit our financial statements; |
104
Table of Contents
| Ÿ | helping to ensure the independence and performance of the independent registered public accounting firm; |
| Ÿ | discussing the scope and results of the audit with the independent registered public accounting firm, and reviewing with management and the independent accountants, our interim and year end operating results; |
| Ÿ | developing procedures for employees to submit concerns anonymously about questionable accounting or audit matters; |
| Ÿ | reviewing our policies on risk assessment and risk management; |
| Ÿ | reviewing related party transactions; |
| Ÿ | obtaining and reviewing a report by the independent registered public accounting firm at least annually, that describes our internal quality-control procedures, any material issues with such procedures, and any steps taken to deal with such issues; and |
| Ÿ | approving (or, as permitted, pre-approve) all audit and all permissible non-audit services, other than de minimis non-audit services, to be performed by the independent registered public accounting firm. |
Our audit committee will operate under a written charter, to be effective prior to the completion of this offering, that satisfies the applicable rules of the SEC and the listing standards of the New York Stock Exchange.
Compensation Committee
Our compensation committee is comprised of Messrs. Boustridge, Ferris and Haque, with Mr. Ferris serving as chairman. Messrs. Ferris and Haque meet the requirements for independence of compensation committee members under current New York Stock Exchange listing standards and SEC rules and regulations. We expect to satisfy the member independence requirements for the compensation committee prior to the end of the transition period provided under current New York Stock Exchange listing standards and SEC rules and regulations for companies completing their initial public offering. The purpose of our compensation committee is to discharge the responsibilities of our board of directors relating to compensation of our executive officers. The responsibilities of our compensation committee include, among other things:
| Ÿ | reviewing, approving and determining, or making recommendations to our board of directors regarding, the compensation of our executive officers; |
| Ÿ | administering our stock and equity incentive plans; |
| Ÿ | reviewing and approving and make recommendations to our board of directors regarding incentive compensation and equity plans; and |
| Ÿ | establishing and reviewing general policies relating to compensation and benefits of our employees. |
Our compensation committee will operate under a written charter, to be effective prior to the completion of this offering, that satisfies the applicable rules of the SEC and the listing standards of the New York Stock Exchange.
Nominating and Governance Committee
Our nominating and governance committee is comprised of Messrs. Boustridge, Ferris and Ransom, with Mr. Boustridge serving as chairman. Messrs. Ferris and Ransom meet the requirements for independence of nominating and corporate governance committee members under current New
105
Table of Contents
York Stock Exchange listing standards and SEC rules and regulations. We expect to satisfy the member independence requirements for the nominating and corporate governance committee prior to the end of the transition period provided under current New York Stock Exchange listing standards and SEC rules and regulations for companies completing their initial public offering. The responsibilities of our nominating and governance committee will include, among other things:
| Ÿ | identifying, evaluating and selecting, or making recommendations to our board of directors regarding nominees for election to our board of directors and its committees; |
| Ÿ | evaluating the performance of our board of directors and of individual directors; |
| Ÿ | considering and making recommendations to our board of directors regarding the composition of our board of directors and its committees; |
| Ÿ | reviewing developments in corporate governance practices; |
| Ÿ | evaluating the adequacy of our corporate governance practices and reporting; and |
| Ÿ | developing and making recommendations to our board of directors regarding corporate governance guidelines and matters. |
The nominating and governance committee will operate under a written charter to be effective prior to the completion of this offering that satisfies the applicable listing requirements and rules of the New York Stock Exchange.
Compensation Committee Interlocks and Insider Participation
None of our executive officers currently serves, or in the past year has served, as a member of the board of directors or compensation committee of any entity that has one or more executive officers serving on our board of directors or compensation committee.
Non-Employee Director Compensation
Prior to this offering, we had not implemented a formal policy with respect to compensation payable to our non-employee directors for service as directors. In 2011 and 2012, we paid cash director fees to Messrs. Floyd, Ransom, Switz and Boustridge in the amounts set forth below. In addition, we granted an award of non-statutory stock options under our 2006 Stock Plan to Messrs. Floyd, Switz and Boustridge in the amounts set forth below. In addition to the foregoing amounts, we reimburse our directors for expenses associated with attending meetings of our board of directors and committees of our board of directors. The following table provides information regarding compensation of our non-employee directors for 2011 and 2012.
| Name |
Year |
Fees Earned or Paid in Cash($)(1) |
Option Awards($)(2) | All Other Compensation($) |
Total($) | |||||||||||||
| Mark A. Floyd(3) |
2011 | 21,000 | — | — | 21,000 | |||||||||||||
| 2012 | 12,000 | 126,955 | (3) | — | 138,955 | |||||||||||||
| M. Niel Ransom |
2011 | 36,000 | — | — | 36,000 | |||||||||||||
| 2012 | 36,000 | — | — | 36,000 | ||||||||||||||
| Robert E. Switz |
2011 | 30,000 | 112,480 | (4) | — | 142,480 | ||||||||||||
| 2012 | 36,000 | — | — | 36,000 | ||||||||||||||
| Michael J. Boustridge(5) |
2012 | 12,000 | 230,196 | (5) | — | 242,196 | ||||||||||||
| (1) | Represents 2012 director fees paid in cash. |
| (2) | The amounts in the “Option Awards” column reflect the aggregate grant date fair value of stock options granted during the fiscal year computed in accordance with FASB ASC Topic 718. The assumptions that we used to calculate these amounts are discussed in Note 8 to our financial |
106
Table of Contents
| statements appearing at the end of this prospectus. As required by SEC rules, the amounts shown exclude the impact of estimated forfeitures related to service-based vesting conditions. |
| (3) | Mr. Floyd was appointed as our Chief Executive Officer effective May 2012. As of December 31, 2012, Mr. Floyd had outstanding options to purchase a total of 1,706,559 shares of our common stock. On February 28, 2012, Mr. Floyd was granted an option to purchase 100,000 shares in connection with his role as Chairman of the Board of Directors. Of the shares underlying this option, 27,083 of the shares were vested as of December 31, 2012. Mr. Floyd’s compensation and option holdings are reflected in “Executive Compensation” below. |
| (4) | As of December 31, 2012, Mr. Switz had outstanding one option to purchase a total of 88,685 shares of our common stock. This option began vesting on March 22, 2011 and is early exercisable. The shares subject to the option vest over a four year period, with 1/48th of the shares vesting each month, subject to continued service to us through each vesting date. Of the shares underlying this option, 38,799 of the shares were vested as of December 31, 2012. |
| (5) | Mr. Boustridge joined our board of directors effective August 2012. As of December 31, 2012, Mr. Boustridge had outstanding one option to purchase a total of 88,685 shares of our common stock, which option was granted on September 25, 2012. Of the shares underlying this option, 5,542 of the shares were vested as of December 31, 2012. |
In connection with this offering, we have implemented a formal policy pursuant to which our non-employee directors will be eligible to receive equity awards and annual cash retainers as compensation for service on our board of directors and committees of our board of directors. Under this policy, we will grant non-employee directors an initial stock option grant, at the time of joining our board of directors, of 42,000 shares and an annual restricted stock unit grant, or RSU, at each annual meeting of stockholders of 8,500 units. All director options will have an exercise price equal to the fair market value of our common stock on the date of grant. Initial director options will vest ratably in equal installments over four years. Annual director RSUs will vest quarterly over a period of one year. These equity awards will fully accelerate in the event that we undergo a change of control. Under this policy, each non-employee director will also receive the following cash compensation for board services: an annual cash retainer of $35,000 for board service; an annual cash retainer for serving as the chairperson of the audit committee of $18,000, for serving as chairperson of the compensation committee of $12,000, and for serving as chairperson of the nominating and corporate governance committee of $7,500; and an annual cash retainer for serving as a non-chair member of the audit committee of $7,500, for serving as a non-chair member of the compensation committee of $5,000, and for serving as a non-chair member of the nominating and corporate governance committee of $3,750.
107
Table of Contents
In 2012, our named executive officers, or NEOs, were Michael L. Hatfield, Mark A. Floyd, Scott A. Pradels and Kenneth M. Siegel. For 2011, Mr. Hatfield was our only NEO.
2012 Summary Compensation Table
The following table sets forth all of the compensation awarded to, earned by or paid to our NEOs during 2011 and 2012.
| Name and Principal |
Year | Salary($) | Option Awards($)(1) |
Non-Equity Incentive Plan Comp($)(2) |
All Other Compensation($)(3) |
Total($) | ||||||||||||||||||
| Michael L. Hatfield(4) |
2012 | 135,982 | 1,760,000 | 53,423 | 741 | 1,950,146 | ||||||||||||||||||
| Former Chief Executive Officer |
2011 | 10,400 | — | — | 106 | 10,506 | ||||||||||||||||||
| Mark A. Floyd(4) |
2012 | 175,577 | 4,508,086 | 120,000 | 9,090 | 4,812,753 | ||||||||||||||||||
| Chief Executive Officer |
||||||||||||||||||||||||
| Scott A. Pradels |
2012 | 227,258 | 1,320,000 | 37,502 | 741 | 1,585,501 | ||||||||||||||||||
| Vice President of Engineering |
||||||||||||||||||||||||
| Kenneth M. Siegel |
2012 | 64,308 | 1,100,000 | 22,548 | 13,664 | 1,200,520 | ||||||||||||||||||
| Vice President and General Counsel |
||||||||||||||||||||||||
| (1) | The amounts in the “Option Awards” column reflect the aggregate grant date fair value of stock options granted during the fiscal year computed in accordance with FASB ASC Topic 718. The assumptions that we used to calculate these amounts are discussed in Note 8 to our financial statements appearing at the end of this prospectus. As required by SEC rules, the amounts shown exclude the impact of estimated forfeitures related to service-based vesting conditions. |
| (2) | Includes amounts paid in 2013 for 2012 services |
| (3) | Includes company-paid premiums for health and welfare insurance and for life insurance on behalf of our NEOs. |
| (4) | Mr. Floyd was appointed as our Chief Executive Officer in May 2012. |
Executive Employment Arrangements
Michael L. Hatfield
Michael L. Hatfield, our co-founder and Chief Executive Officer from January 2012 through April 2012, has not entered into a formal compensation arrangement with the company. Mr. Hatfield has historically received a de minimis salary as compensation for his services as our Chief Executive Officer and President. During 2012, he received $135,982 in salary.
On September 25, 2012, we granted Mr. Hatfield an option to purchase 400,000 shares of our common stock at an exercise price of $3.20 per share pursuant to our 2006 Stock Plan. The option agreement provides that, in the event that we consummate a “change of control” (as defined in Mr. Hatfield’s option grant notices) and within the period commencing thirty days prior to and ending twelve months following the consummation of such change of control, (1) his employment is terminated for any reason other than “cause” (as defined in Mr. Hatfield’s option grant notice), death or inability to perform the essential functions of his job, or (2) he resigns for “good reason” (as defined in his option grant notices), then, in each case, 50% of his then-unvested shares, if any, subject to the option, shall vest and become exercisable. As of December 31, 2012, 24,999 of the shares underlying this option were vested.
108
Table of Contents
Mark A. Floyd
In May 2012, we entered into an offer letter agreement with Mark A. Floyd, our current Chief Executive Officer. The offer letter agreement has no specific term and constitutes at-will employment. Mr. Floyd’s current annual base salary is $275,000, and for 2012 he was eligible for an annual cash bonus of up to $120,000. Mr. Floyd’s base salary is subject to review annually.
On February 28, 2012, we granted Mr. Floyd an option to purchase 100,000 shares of our common stock at an exercise price per share of $2.54, which is partially unvested. This option was granted pursuant to our 2006 Stock Plan. This option is scheduled to vest, subject to Mr. Floyd’s continued role as a service provider to us, as to 1/48th of the total shares, on a monthly basis beginning on November 22, 2011. This option is early-exercisable as to unvested shares, subject to our right to repurchase any unvested shares upon termination of Mr. Floyd’s status as a service provider at a repurchase price equal to the original purchase price per share. Of the shares underlying this option, 27,083 of the shares were vested as of December 31, 2012. In the event that we consummate a “liquidation transaction” (as defined in his option grant notice), the vesting of the option granted to Mr. Floyd shall accelerate such that 100% of the shares granted to Mr. Floyd shall become fully vested, effective as of immediately prior to the consummation of such transaction.
In connection with Mr. Floyd’s offer letter agreement, Mr. Floyd was granted an option to purchase 1,517,874 shares of our common stock at an exercise price per share of $2.67, 100% of which is unvested. This option was granted pursuant to our 2006 Stock Plan on May 22, 2012. This option is scheduled to vest, subject to Mr. Floyd’s continued role as a service provider to us, as to 1/4th of the total shares on the one-year anniversary of May 14, 2012, with 1/48th of the total shares vesting monthly thereafter.
The option granted in connection with Mr. Floyd’s offer letter agreement provide that in the event that we consummate a “change of control” (as defined in Mr. Floyd’s option grant notice) and within the period commencing thirty days prior to and ending twelve months following the consummation of such change of control (1) his employment is terminated for any reason other than “cause” (as defined in Mr. Floyd’s option grant notice), death or inability to perform the essential functions of his job, or (2) he resigns for “good reason” (as defined in his option grant notice), then, in each case, 50% of his then-unvested shares, if any, subject to the option shall vest and become exercisable.
Scott A. Pradels
In November 2006, we entered into an offer letter agreement with Scott A. Pradels, our Vice President of Engineering. The offer letter agreement has no specific term and constitutes at-will employment. Mr. Pradels’ current annual base salary is $227,258. Mr. Pradels’ base salary is subject to review annually. In addition, Mr. Pradels is eligible for an annual cash bonus of 30% of his base compensation, with the payout based upon achievement of company objectives to be established by our board of directors or compensation committee. For 2012, incentive compensation was tied to achievement of revenue and net loss goals.
On September 25, 2012 we granted Mr. Pradels an option to purchase 300,000 shares of our common stock at an exercise price of $3.20 per share pursuant to our 2006 Stock Plan. This option provides that, in the event that we consummate a “change of control” (as defined in Mr. Pradels’ option grant notice) and within the period commencing thirty days prior to and ending twelve months following the consummation of such change of control, (1) his employment is terminated for any reason other than “cause” (as defined in Mr. Pradels’ option grant notice), death or inability to perform the essential functions of his job, or (2) he resigns for “good reason” (as defined in his option grant notice), then, in each case, 50% of his then-unvested shares, if any, subject to the option shall vest and become exercisable. As of December 31, 2012, 18,750 of the shares underlying this option were vested.
109
Table of Contents
Kenneth M. Siegel
In August 2012, we entered into an offer letter agreement with Kenneth M. Siegel, our Vice President and General Counsel. The offer letter agreement has no specific term and constitutes at-will employment. Mr. Siegel’s current annual base salary is $220,000. Mr. Siegel’s base salary is subject to review annually. In addition, Mr. Siegel is eligible for an annual cash bonus of 30% of his base compensation, with the payout based upon achievement of company objectives to be established by our board of directors or compensation committee. For 2012, incentive compensation was tied to achievement of revenue and net loss goals.
In connection with Mr. Siegel’s offer letter agreement, Mr. Siegel was granted an option to purchase 250,000 shares of our common stock at an exercise price per share of $3.20, 100% of which is unvested. This option was granted pursuant to our 2006 Stock Plan on September 25, 2012. This option is scheduled to vest, subject to Mr. Siegel’s continued role as a service provider to us, as to 1/4th of the total shares on the one-year anniversary of September 17, 2012, with 1/48th of the total shares vesting monthly thereafter.
The option granted in connection with Mr. Siegel’s offer letter agreement provides that, in the event that we consummate a “change of control” (as defined in Mr. Siegel’s option grant notices) and within the period commencing thirty days prior to and ending twelve months following the consummation of such change of control, (1) his employment is terminated for any reason other than “cause” (as defined in Mr. Siegel’s option grant notice), death or inability to perform the essential functions of his job, or (2) he resigns for “good reason” (as defined in his option grant notices), then, in each case, 50% of his then-unvested shares, if any, subject to the option shall vest and become exercisable.
Outstanding Equity Awards at Fiscal Year End
The following table provides information regarding outstanding equity awards held by our NEOs at the 2012 fiscal year end.
| Option Awards | ||||||||||||||||||||
| Name |
Grant Date | Number of Securities Underlying Unexercised Options (#) Exercisable |
Number of Securities Underlying Unexercised Options (#) Unexercisable |
Option Exercise Price ($) |
Option Expiration Date |
|||||||||||||||
| Michael L. Hatfield |
12/14/2010 | — | 250,000 | (1) | $ | 2.35 | 12/13/2020 | |||||||||||||
| 9/25/2012 | 25,000 | 375,000 | (2) | $ | 3.20 | 9/24/2022 | ||||||||||||||
| Mark A. Floyd |
10/29/2008 | 88,685 | (3) | — | $ | 0.42 | 10/28/2018 | |||||||||||||
| 2/28/2012 | 100,000 | (4) | — | $ | 2.54 | 2/27/2022 | ||||||||||||||
| 5/22/2012 | — | 1,517,874 | (5) | $ | 2.67 | 5/21/2022 | ||||||||||||||
| Scott A. Pradels |
12/14/2010 | — | 50,000 | (6) | $ | 2.35 | 12/13/2020 | |||||||||||||
| 1/26/2011 | 9,375 | 5,625 | (7) | $ | 2.35 | 1/25/2021 | ||||||||||||||
| 9/25/2012 | 18,750 | 281,250 | (8) | $ | 3.20 | 9/24/2022 | ||||||||||||||
| Kenneth M. Siegel |
9/25/2012 | — | 250,000 | (9) | $ | 3.20 | 9/24/2022 | |||||||||||||
| (1) | This option vests according to the following schedule: such shares as equals X multiplied by 1/48th of the total shares subject to this option shall vest and become exercisable on the cliff vest date (as defined below), where X is equal to the number of full month periods that have elapsed between November 13, 2010 and the cliff vest date, and 1/48th of the total number of shares subject to this option shall vest and become exercisable each month thereafter. The cliff vest date is the earliest to occur of (1) the audit committee’s determination that the company has achieved, for the first time, positive net income on a pro forma basis for a fiscal quarter, (2) the four-year anniversary of November 13, 2010, or (3) the consummation of a “change of control” (as defined |
110
Table of Contents
| in Mr. Hatfield’s option grant notice). All of the shares underlying this option were unvested as of December 31, 2012. |
| (2) | This option vests, subject to Mr. Hatfield’s continued role as a service provider to us, as to 1/48th of the total shares each month, beginning on the one-month anniversary of September 25, 2012. Of the shares underlying this option, 25,000 of the shares were vested as of December 31, 2012. |
| (3) | All of the shares underlying this option are fully vested. |
| (4) | This option vests, subject to Mr. Floyd’s continued role as a service provider to us, as to 1/48th of the total shares each month, beginning on the one-month anniversary of November 22, 2011. Of the shares underlying this option, 27,083 of the shares were vested as of December 31, 2012. |
| (5) | This option vests, subject to Mr. Floyd’s continued role as a service provider to us, as to 1/4th of the total shares on the one-year anniversary of May 14, 2012, with 1/48th of the total shares vesting monthly thereafter. All of the shares underlying this option were unvested as of December 31, 2012. |
| (6) | This option vests according to the following schedule: such shares as equals X multiplied by 1/48th of the total shares subject to this option shall vest and become exercisable on the cliff vest date (as defined below), where X is equal to the number of full month periods that have elapsed between November 15, 2010 and the cliff vest date, and 1/48th of the total number of shares subject to this option shall vest and become exercisable each month thereafter. The cliff vest date is the earliest to occur of (1) the audit committee’s determination that the company has achieved, for the first time, positive net income on a pro forma basis for a fiscal quarter, (2) the four-year anniversary of November 15, 2010, or (3) the consummation of a “change of control” (as defined in Mr. Pradels’ option grant notice). All of the shares underlying this option were unvested as of December 31, 2012. |
| (7) | This option vests, subject to Mr. Pradels’ continued role as a service provider to us, as to 1/4th of the total shares on the one-year anniversary of June 7, 2010, with 1/48th of the total shares vesting monthly thereafter. Of the shares underlying this option, 9,375 of the shares were vested as of December 31, 2012. |
| (8) | This option vests, subject to Mr. Pradels’ continued role as a service provider to us, as to 1/48th of the total shares each month, beginning on the one-month anniversary of September 25, 2012. Of the shares underlying this option, 18,750 of the shares were vested as of December 31, 2012. |
| (9) | This option vests, subject to Mr. Siegel’s continued role as a service provider to us, as to 1/4th of the total shares on the one-year anniversary of September 17, 2012, with 1/48th of the total shares vesting monthly thereafter. All of the shares underlying this option were unvested as of December 31, 2012. |
Employee Benefit Plans
2013 Equity Incentive Plan
Our 2013 Equity Incentive Plan, or our 2013 Plan was adopted by our board of directors and stockholders in 2013. We do not expect to utilize our 2013 Plan until after the completion of this offering. Our 2013 Plan permits the grant of incentive stock options, within the meaning of Section 422 of the Code, to our employees and any of our parent and subsidiary corporations’ employees, and the grant of nonstatutory stock options, stock appreciation rights, restricted stock, restricted stock units, performance shares and performance units to our employees, members of our board of directors and consultants and our parent and subsidiary corporations’ employees and consultants.
Authorized Shares. The maximum aggregate number of shares issuable under the 2013 Plan is 3,600,000 shares of our common stock, plus (i) any shares that, as of the date of this offering, are reserved but unissued under our 2006 Stock Plan that are not subject to any awards granted under our 2006 Stock Plan, and (ii) any shares subject to stock options or similar awards granted under our 2006 Stock Plan that expire or terminate without having been exercised in full or are forfeited to or repurchased by us, with the maximum number of shares to be added under clauses (i) and (ii) equal to 11,400,000 shares. In addition, the number of shares available for issuance under the 2013 Plan will be annually increased on the first day of each of our fiscal years beginning with 2014, by an amount equal to the least of:
| Ÿ | 5,000,000 shares; |
111
Table of Contents
| Ÿ | 4.5% of the outstanding shares of our common stock as of the last day of our immediately preceding fiscal year; or |
| Ÿ | such other amount as our board of directors may determine no later than the last day of the immediately preceding fiscal year. |
Shares may be authorized, but unissued, or reacquired shares of our common stock. Shares issued pursuant to awards under the 2013 Plan that expire, become unexercisable without being exercised in full, or are forfeited to or repurchased by us due to failure to vest, shares that are surrendered pursuant to an exchange program, as well as shares used to pay the exercise price of an award or to satisfy the tax withholding obligations related to an award, will become available for future grant under the 2013 Plan. In addition, to the extent that an award is paid out in cash rather than shares, such cash payment will not reduce the number of shares available for issuance under the 2013 Plan. With respect to stock appreciation rights, only shares actually issued pursuant to the award cease to be available under the 2013 Plan.
Plan Administration. Our board of directors or one or more committees appointed by our board of directors will administer the 2013 Plan. In the case of awards intended to qualify as “performance-based compensation” within the meaning of Section 162(m) of the Code, the compensation committee will consist of two or more “outside directors” within the meaning of Section 162(m) of the Code.
Subject to the provisions of our 2013 Plan, the administrator has the power to determine the terms of awards, including the recipients, the exercise price, if any, the number of shares covering each award, the fair market value of a share of our common stock, the vesting schedule applicable to the awards, together with any vesting acceleration, the form of consideration, if any, payable upon exercise of the award, and the terms of the award agreement for use under the 2013 Plan. The administrator also has the authority, subject to the terms of the 2013 Plan, to amend existing awards to reduce or increase their exercise price, to allow participants the opportunity to transfer outstanding awards to a financial institution or other person or entity selected by the administrator, to institute an exchange program by which outstanding awards may be surrendered in exchange for awards that may have different exercise prices and terms and/or for cash, to prescribe rules and to construe and interpret the 2013 Plan and awards granted under the 2013 Plan. The administrator may make all other determinations deemed necessary or advisable for administering the 2013 Plan.
Stock Options. The administrator may grant incentive and/or nonstatutory stock options under our 2013 Plan, provided that incentive stock options are granted only to our employees or employees of our parent or subsidiary corporations. The exercise price of such options must equal at least the fair market value of our common stock on the date of grant. The term of an incentive stock option may not exceed 10 years; provided, however, that an incentive stock option held by a participant who owns more than 10% of the total combined voting power of all classes of our stock, or of certain of our parent or subsidiary corporations, may not have a term in excess of five years and must have an exercise price of at least 110% of the fair market value of our common stock on the grant date. The administrator will determine the methods of payment of the exercise price of an option, which may include cash, shares or other property acceptable to the administrator, as well as other types of consideration permitted by applicable law. Subject to the provisions of our 2013 Plan, the administrator determines the remaining terms of the options. After the termination of service of a participant, the participant may exercise his or her option, to the extent vested as of such date of termination, for the period of time stated in his or her option agreement. However, in no event may an option be exercised later than the expiration of its term. The specific terms of any grant of stock options will be set forth in an award agreement between us and the recipient.
Stock Appreciation Rights. Stock appreciation rights may be granted under our 2013 Plan. Stock appreciation rights allow the recipient to receive the appreciation in the fair market value of our
112
Table of Contents
common stock between the exercise date and the date of grant. Subject to the provisions of our 2013 Plan, the administrator determines the terms of stock appreciation rights, including when such rights vest and become exercisable and whether to settle such awards in cash or with shares of our common stock, or a combination thereof, except that the per share base price for the shares to be issued pursuant to the exercise of a stock appreciation right will be no less than 100% of the fair market value per share on the date of grant. The specific terms of any grant of stock appreciation rights will be set forth in an award agreement between us and the recipient.
Restricted Stock. Restricted stock may be granted under our 2013 Plan. Restricted stock awards are grants of shares of our common stock that are subject to various restrictions, including restrictions on transferability and forfeiture provisions. Shares of restricted stock will vest and the restrictions on such shares will lapse, in accordance with terms and conditions established by the administrator. Such terms may include, among other things, vesting upon the achievement of specific performance goals determined by the administrator and/or continued service to us. The administrator, in its sole discretion, may accelerate the time at which any restrictions will lapse or be removed. Recipients of restricted stock awards generally will have voting and dividend rights with respect to such shares upon grant without regard to vesting, unless the administrator provides otherwise. Shares of restricted stock that do not vest for any reason will be forfeited by the recipient and will revert to us. The specific terms of any grant of restricted stock will be set forth in an award agreement between us and the recipient.
Restricted Stock Units. Restricted stock units may be granted under our 2013 Plan. Each restricted stock unit granted is a bookkeeping entry representing an amount equal to the fair market value of one share of our common stock. The administrator determines the vesting criteria in its discretion which, depending on the extent to which they are met, will determine the number of shares to be paid out to the participant. The administrator may set vesting criteria based on achievement of company-wide, divisional, business unit or individual goals, including continued employment or service, applicable federal or state securities laws, or any other basis the administrator determines, in its discretion. After the grant of a restricted stock unit award, the administrator, in its sole discretion, may reduce or waive any vesting criteria for such award. The administrator determines in its sole discretion whether an award will be settled in shares, cash or a combination of both. The specific terms of any grant of restricted stock units will be set forth in an award agreement between us and the recipient.
Performance Shares, Performance Units. Performance units and performance shares may be granted under our 2013 Plan. Performance units and performance shares are awards that will result in a payment to a participant only if performance goals established by the administrator are achieved or the awards otherwise vest. The administrator will establish performance objectives or other vesting provisions in its discretion, which, depending on the extent to which they are met, will determine the number or value of performance units and performance shares to be paid out to the participant. The administrator may set performance objectives based on company-wide, divisional, business unit or individual goals, including continued employment or service, applicable federal or state securities laws, or any other basis the administrator determines, in its discretion. After the grant of a performance unit or performance share award, the administrator, in its sole discretion, may reduce or waive any performance objectives or other vesting provisions for such award. Performance units will have an initial dollar value established by the administrator on or before the grant date. Performance shares will have an initial value equal to the fair market value of our common stock on the grant date. The administrator, in its sole discretion, may pay earned performance units or performance shares in the form of cash, in shares or a combination of both. Performance shares or units that do not vest for any reason will be forfeited by the recipient and will revert to us. The specific terms of any grant of performance units and performance shares will be set forth in an award agreement between us and the recipient.
113
Table of Contents
Transferability of Awards. Unless the administrator provides otherwise, our 2013 Plan generally does not allow for the transfer of awards and only the recipient of an award may exercise such an award during his or her lifetime.
Certain Adjustments. In the event of certain changes in our capitalization, to prevent diminution or enlargement of the benefits or potential benefits available under the 2013 Plan, the administrator will make adjustments to the number and class of shares that may be delivered under the plan and/or the number, class and price of shares covered by each outstanding award and the numerical share limits contained in the 2013 Plan.
Merger or Change in Control, Dissolution or Liquidation. Our 2013 Plan provides that in the event of our merger with or into another corporation or other entity or our change in control, as defined under the 2013 Plan, each outstanding award will be treated as the administrator determines, except that if a successor corporation or its parent or subsidiary does not assume or substitute an equivalent award for any outstanding award, then such award will fully vest, all restrictions on such award will lapse, all performance goals or other vesting criteria applicable to such award will be deemed achieved at 100% of target levels and such award will become fully exercisable, if applicable, for a specified period prior to the transaction. The award will then terminate upon the expiration of the specified period of time. If the service of an outside director is terminated on or following a change in control, other than pursuant to a voluntary resignation, his or her awards will become fully vested and exercisable, and all performance goals or other vesting requirements will be deemed achieved at 100% of target levels. In the event of our proposed liquidation or dissolution, the administrator will notify participants as soon as practicable and all awards will terminate immediately prior to the consummation of such proposed transaction.
Plan Amendment, Termination. The administrator has the authority to amend, suspend or terminate the 2013 Plan provided such action does not impair the existing rights of any participant. Our 2013 Plan will automatically terminate in 2023, unless we terminate it sooner.
2006 Stock Plan
Our board of directors adopted, and our stockholders approved, our 2006 Stock Plan, or 2006 Plan, in December 2006. Our 2006 Plan was amended most recently in February 2013.
Our 2006 Plan permits the grant of incentive stock options, within the meaning of Code Section 422, to our employees and any of our parent and subsidiary corporations’ employees, and for the grant of nonstatutory stock options and restricted stock to our employees and consultants and any of our parent and subsidiary corporations’ employees and consultants. We will not grant any additional awards under our 2006 Plan following this offering and will instead grant awards under our 2013 Plan; however, the 2006 Plan will continue to govern the terms and conditions of the outstanding awards previously granted thereunder.
Authorized Shares. The maximum aggregate number of shares issuable under the 2006 Plan is 13,002,500 shares of our common stock. As of March 31, 2013, options to purchase 11,184,817 shares of our common stock were outstanding under our 2006 Plan and 1,211,203 shares of our common stock remained available for future grant under the 2006 Plan. Shares issued pursuant to awards under the 2006 Plan that we repurchase, that expire or are forfeited, or become unexercisable without having been exercised in full, as well as shares used to pay the exercise or purchase price of an award or to satisfy the tax withholding obligations related to an award, will become available for future grant under the 2006 Plan. In addition, to the extent that an option is surrendered pursuant to an option exchange program, such surrendered option will not reduce the number of shares available for issuance under the 2006 Plan.
114
Table of Contents
Plan Administration. The 2006 Plan may be administered by our board of directors and/or a committee of our board of directors, as determined by our board of directors (referred to as the “administrator”).
Subject to the provisions of our 2006 Plan, the administrator has the power to determine the terms of awards, including the recipients, the exercise price of the options, the number of shares subject to each award, the fair market value of a share of our common stock, the vesting schedule applicable to the awards, together with any vesting acceleration, the form of consideration, if any, payable upon exercise of the award, and the terms of the award agreement for use under the 2006 Plan, among other powers. The administrator also has the authority, subject to the terms of the 2006 Plan, to institute an option exchange program under which the exercise price of an outstanding option is reduced or outstanding options may be exchanged for options with a lower exercise price and to construe and interpret the 2006 Plan and awards granted under the 2006 Plan. The administrator’s decisions and interpretations will be final and binding on all participants.
Stock Options. The administrator may grant incentive stock options and nonstatutory stock options under our 2006 Plan; provided that incentive stock options are only granted to our employees and the employees of our parent or subsidiary corporations. The per share exercise price of an incentive stock option must equal at least the fair market value of a share of our common stock on the grant date and the per share exercise price of a nonstatutory stock option must equal at least 85% of the fair market value of a share of our common stock on the grant date; provided, however, that an option held by a participant who owns more than 10% of the total combined voting power of all classes of our stock, or the stock of any of our parent or subsidiary corporations (a “10% holder”) must have a per share exercise price of at least 110% of the fair market value of a share of our common stock on the grant date. The term of an incentive stock option may not exceed ten years; provided, however, that an incentive stock option granted to a 10% holder may not have a term in excess of five years.
The administrator will determine the methods of payment of the exercise price of an option, which may include cash, shares or other forms of consideration determined by the administrator. After the termination of service of an employee or consultant, the participant may exercise his or her option, to the extent vested as of such date of termination, for a specified period of time. Generally, if termination is due to death or disability or if the participant’s death occurs within 30 days after the termination of service, the option will remain exercisable for twelve months. If the participant’s service is terminated for cause, the option will terminate immediately upon first notification of such termination of service, and if the participant’s service is suspended as a result of any related investigation, then any rights under the option will be suspended during such investigation. In all other cases, the option generally will remain exercisable for 90 days following a termination of service. The administrator may offer to buy out for cash or shares an option granted under the 2006 Plan based on terms that the administrator determines.
Restricted Stock. Restricted stock may be granted under our 2006 Plan. Restricted stock awards are grants of shares of our common stock that are subject to various restrictions, including restrictions on transferability and forfeiture provisions. Shares of restricted stock will vest and the restrictions on such shares will lapse, in accordance with terms and conditions established by the administrator. Recipients of restricted stock awards generally will have voting and dividend rights with respect to such shares upon exercise without regard to vesting. Unless the administrator determines otherwise, shares of restricted stock may be repurchased by us upon the termination of the purchaser’s employment with us for any reason. The specific terms will be set forth in an award agreement.
Transferability of Awards. Unless the administrator provides otherwise, our 2006 Plan generally does not allow for the transfer of awards and only the recipient of an award may exercise such an award during his or her lifetime.
115
Table of Contents
Certain Adjustments. In the event of certain changes in our capitalization, the number of shares subject to each outstanding award, the number of shares that remain available for issuance under the 2006 Plan, and the price per share of common stock covering each outstanding award will be proportionately adjusted.
Corporate Transactions, Dissolution, Liquidation. Our 2006 Plan provides that in the event of a corporate transaction, as defined under the 2006 Plan, the administrator may provide that each outstanding award will (i) be assumed or substituted for an equivalent award, (ii) become fully vested and be exercisable before or in connection with the corporate transaction and terminate upon the corporate transaction, and/or (iii) terminate upon the corporate transaction pursuant to terms and conditions determined by the administrator, including that awards may be terminated in exchange for a cash payment. In the event of our dissolution or liquidation, each award will terminate immediately prior to such event, unless otherwise determined by the administrator.
Plan Amendment, Termination. Our board of directors has the authority to amend, alter, suspend or terminate the 2006 Plan provided such action does not materially adversely affect the rights of any participant under any outstanding award.
401(k) Plan
We maintain a tax-qualified 401(k) retirement plan for all employees who satisfy certain eligibility requirements, including requirements relating to age and length of service. Under our 401(k) plan, employees may elect to defer up to all eligible compensation, subject to applicable annual Internal Revenue Code limits. Historically, we have not matched any contributions made by our employees, including executives, but have the discretion to, and may do so in the future. We intend for our 401(k) plan to qualify under Section 401(a) and 501(a) of the Code so that contributions by employees to our 401(k) plan, and income earned on those contributions, are not taxable to employees until withdrawn from our 401(k) plan.
Limitation of Liability and Indemnification of Officers and Directors
Our amended and restated certificate of incorporation and amended and restated bylaws, each to be effective upon the completion of this offering, will provide that we will indemnify our directors and officers, and may indemnify our employees and other agents, to the fullest extent permitted by Delaware law, which prohibits our amended and restated certificate of incorporation from limiting the liability of our directors for the following:
| Ÿ | any breach of the director’s duty of loyalty to us or to our stockholders; |
| Ÿ | acts or omissions not in good faith or that involve intentional misconduct or a knowing violation of law; |
| Ÿ | unlawful payment of dividends or unlawful stock repurchases or redemptions; and |
| Ÿ | any transaction from which the director derived an improper personal benefit. |
If Delaware law is amended to authorize corporate action further eliminating or limiting the personal liability of a director, then the liability of our directors will be eliminated or limited to the fullest extent permitted by Delaware law, as so amended. Our amended and restated certificate of incorporation does not eliminate a director’s duty of care and, in appropriate circumstances, equitable remedies, such as injunctive or other forms of non-monetary relief, remain available under Delaware law. This provision also does not affect a director’s responsibilities under any other laws, such as the federal securities laws or other state or federal laws. Under our amended and restated bylaws, we will also be empowered to purchase insurance on behalf of any person whom we are required or permitted to indemnify.
116
Table of Contents
In addition to the indemnification required in our amended and restated certificate of incorporation and amended and restated bylaws, we have entered into an indemnification agreement with each member of our board of directors, which will be amended prior to the completion of this offering. In addition, we plan to enter into indemnification agreements with each of our officers before the completion of this offering. These agreements will provide for the indemnification of our directors, officers and some employees for certain expenses and liabilities incurred in connection with any action, suit, proceeding or alternative dispute resolution mechanism, or hearing, inquiry or investigation that may lead to the foregoing, to which they are a party, or are threatened to be made a party, by reason of the fact that they are or were a director, officer, employee, agent or fiduciary of our company, or any of our subsidiaries, by reason of any action or inaction by them while serving as an officer, director, agent or fiduciary, or by reason of the fact that they were serving at our request as a director, officer, employee, agent or fiduciary of another entity. In the case of an action or proceeding by or in the right of our company or any of our subsidiaries, no indemnification will be provided for any claim where a court determines that the indemnified party is prohibited from receiving indemnification. We believe that these charter and bylaw provisions and indemnification agreements are necessary to attract and retain qualified persons as directors and officers.
The limitation of liability and indemnification provisions in our amended and restated certificate of incorporation and amended and restated bylaws may discourage stockholders from bringing a lawsuit against directors for breach of their fiduciary duties. They may also reduce the likelihood of derivative litigation against directors and officers, even though an action, if successful, might benefit us and our stockholders. Moreover, a stockholder’s investment may be harmed to the extent we pay the costs of settlement and damage awards against directors and officers pursuant to these indemnification provisions. Insofar as indemnification for liabilities arising under the Securities Act may be permitted to our directors, officers and controlling persons pursuant to the foregoing provisions, or otherwise, we have been advised that, in the opinion of the SEC, such indemnification is against public policy as expressed in the Securities Act, and is, therefore, unenforceable. There is no pending litigation or proceeding naming any of our directors or officers as to which indemnification is being sought, nor are we aware of any pending or threatened litigation that may result in claims for indemnification by any director or officer.
117
Table of Contents
CERTAIN RELATIONSHIPS, RELATED PARTY AND OTHER TRANSACTIONS
In addition to the director and executive officer compensation and indemnification agreements discussed above in the section titled “Management” and “Executive Compensation” and the registration rights described below in the section titled “Description of Capital Stock—Registration Rights,” the following is a description of certain relationships and transactions since January 1, 2010 involving our directors, executive officers, beneficial holders of more than 5% of our capital stock, or entities affiliated with them.
Series E Preferred Stock Financing
On November 19, 2010, and at additional closings on November 22, 2010 and May 6, 2011, we issued and sold an aggregate of 6,737,211 shares of Series E redeemable convertible preferred stock at a per share purchase price of $4.5271, for aggregate consideration of $30.5 million. The participants in our Series E redeemable convertible preferred stock financing include venture capital funds that hold 5% or more of our capital stock and which were represented on our board of directors, as well as certain of our current and former directors and officers. The following table summarizes the number of shares and total purchase price paid by these individuals and entities:
| Name of Stockholder |
Our Director | Number of Series E Shares |
Total Purchase Price |
|||||||
| Funds affiliated with Tenaya Capital(1) |
N/A | 596,409 | $ | 2,700,003 | ||||||
| Funds affiliated with Norwest Venture Partners(2) |
Promod Haque | 1,700,869 | 7,700,004 | |||||||
| Funds affiliated with Focus Ventures(3) |
N/A | 733,796 | 3,321,968 | |||||||
| Michael L. Hatfield |
Michael L. Hatfield |
388,602 | 1,759,240 | |||||||
| Robert E. Switz Revocable Trust dated July 27, 2009 |
Robert E. Switz |
55,223 | 250,000 | |||||||
| Scott T. Bauer |
N/A | 55,223 | 250,000 | |||||||
| (1) | Affiliates of Tenaya Capital holding our securities whose shares are aggregated for purposes of reporting share ownership information include Tenaya Capital V, L.P. and Tenaya Capital V-P, L.P. |
| (2) | Affiliates of Norwest Venture Partners holding our securities whose shares are aggregated for purposes of reporting share ownership information include Norwest Venture Partners X, LP and Norwest Venture Partners VII-A, LP |
| (3) | Affiliates of Focus Ventures holding our securities whose shares are aggregated for purposes of reporting share ownership information include Focus Ventures III, L.P. and FV Investors III, L.P. |
118
Table of Contents
Series F Preferred Stock Financing
On December 9, 2011, and at an additional closing on December 12, 2011, we issued and sold an aggregate of 2,138,535 shares of Series F redeemable convertible preferred stock at a per share purchase price of $4.6761, for aggregate consideration of $10.0 million. The participants in our Series F redeemable convertible preferred stock financing include venture capital funds that hold 5% or more of our capital stock and which were represented on our board of directors, as well as certain of our current and former directors and officers. The following table summarizes the number of shares and total purchase price paid by these individuals and entities:
| Name of Stockholder |
Our Director | Number of Series F Shares |
Total Purchase Price |
|||||||
| Funds affiliated with Tenaya Capital(1) |
N/A | 319,132 | $ | 1,492,293 | ||||||
| Funds affiliated with Norwest Venture Partners(2) |
Promod Haque | 1,059,331 | 4,953,538 | |||||||
| Funds affiliated with Focus Ventures(3) |
N/A | 151,886 | 710,234 | |||||||
| Robert E. Switz Revocable Trust dated July 27, 2009 |
Robert E. Switz | 9,366 | 43,796 | |||||||
| Scott T. Bauer |
N/A | 17,992 | 84,132 | |||||||
| (1) | Affiliates of Tenaya Capital holding our securities whose shares are aggregated for purposes of reporting share ownership information include Tenaya Capital V, L.P. and Tenaya Capital V-P, L.P. |
| (2) | Affiliates of Norwest Venture Partners holding our securities whose shares are aggregated for purposes of reporting share ownership information include Norwest Venture Partners X, LP and Norwest Venture Partners VII-A, LP |
| (3) | Affiliates of Focus Ventures holding our securities whose shares are aggregated for purposes of reporting share ownership information include Focus Ventures III, L.P. and FV Investors III, L.P. |
Facility Lease
In August 2007, we entered into a six-year lease agreement for our Petaluma headquarters, which was originally scheduled to expire in September 2013. This agreement has been amended and now the lease expires with respect to a portion of the premises in May 2015 and the remainder of the premises in October 2018, providing the company a total of 22,780 square feet. Michael L. Hatfield, our president, who is a member of our board of directors, and a greater than 5% stockholder owns approximately 40% of the limited liability company from whom we are leasing our headquarters. The approximate dollar value of the transaction for the period beginning January 1, 2009 and ending October 31, 2018 is $3,156,000. This transaction was approved by the disinterested members of our board of directors.
Consulting Services
Between January 2013 and April 2013, Michael J. Boustridge, a member of our board of directors, provided certain sales consulting services to us in exchange for cash fees of approximately $50,000 and the grant to him of an option to purchase 40,000 shares, issued on January 29, 2013, at an exercise price of $8.31 per share, with an aggregate grant date fair value of approximately $190,000. This option became fully exercisable in April 2013.
Investors’ Rights Agreement
Our amended and restated investors’ rights agreement among us and certain purchasers of our preferred stock, including our principal stockholders with whom certain of our directors are affiliated, grants these stockholders certain registration rights with respect to certain shares of our common stock
119
Table of Contents
that will be issuable upon conversion of the shares of preferred stock held by them. For a description of these registration rights, see “Description of Capital Stock—Registration Rights.”
Voting Agreement
Our amended and restated voting agreement among us and certain purchasers of our preferred stock, including our principal stockholders with whom certain of our directors are affiliated, requires purchasers to vote their shares on certain matters pursuant to the terms of the voting agreement, including with respect to the election of directors. Pursuant to our amended and restated voting agreement, each of Azure Capital Partners, Norwest Venture Partners and Tenaya Capital was granted the right to designate one member of our board of directors, subject to each entity and its affiliates owning at least one million shares of our preferred stock. As of the date hereof, Paul Ferris and Promod Haque are members of our board of directors pursuant to the designation rights granted to Azure Capital Partners and Norwest Venture Partners, respectively, under our amended and restated voting agreement. Currently, Tenaya Capital has elected to forego its right under our amended and restated voting agreement to designate a member of our board of directors. Upon the completion of this offering, the voting agreement will terminate and none of our stockholders will have any special rights regarding the election or designation of members of our board of directors or the voting of capital stock of the company.
Policies and Procedures for Related Party Transactions
Immediately following the completion of this offering, the audit committee will have the primary responsibility for reviewing and approving or disapproving “related party transactions,” which are transactions between us and related persons in which the aggregate amount involved exceeds or may be expected to exceed $120,000 and in which a related person has or will have a direct or indirect material interest. For purposes of this responsibility, a related person will be defined as a director, executive officer, nominee for director, or stockholders who own greater than 5% of our outstanding common stock and their affiliates, in each case since the beginning of the most recently completed fiscal year, and their immediate family members. Our audit committee charter will provide that the audit committee shall review and approve or disapprove any related party transactions. As of the date of this prospectus, we have not adopted any formal standards, responsibilities or procedures governing the review and approval of related-party transactions, but we expect that our audit committee will do so in the future.
120
Table of Contents
The following table sets forth certain information with respect to the beneficial ownership of our common stock as of March 31, 2013, after giving effect to the conversion of all outstanding shares of redeemable convertible preferred stock into shares of common stock, and as adjusted to reflect the sale of common stock in this offering, for:
| Ÿ | each of our current named executive officers; |
| Ÿ | each of our current directors; |
| Ÿ | all of our current executive officers and directors as a group; and |
| Ÿ | each person, or group of affiliated persons, known by us to beneficially own more than 5% of our common stock. |
We have determined beneficial ownership in accordance with the rules of the SEC and the information is not necessarily indicative of beneficial ownership for any other purpose. Except as indicated in the footnotes below, to our knowledge, the persons and entities named in the table below have sole voting and sole investment power with respect to all shares of common stock that they beneficially own, subject to applicable community property laws.
Applicable percentage ownership prior to this offering is based on 36,531,318 shares of common stock outstanding as of March 31, 2013, after giving effect to the conversion of all outstanding shares of redeemable convertible preferred stock into shares of common stock. Applicable percentage ownership after this offering is based on 44,531,318 shares of common stock outstanding as of March 31, 2013, after giving effect to the conversion of all outstanding shares of redeemable convertible preferred stock into shares of common stock and after giving effect to the issuance of 8,000,000 shares of our common stock in this offering. In computing the number of shares of common stock beneficially owned by a person and the percentage ownership of such person, we deemed to be outstanding all shares of common stock subject to options held by the person that are currently exercisable or exercisable within 60 days of March 31, 2013. We did not deem such shares outstanding, however, for the purpose of computing the percentage ownership of any other person.
Unless otherwise indicated, the address of each of the individuals and entities named below is c/o Cyan, Inc., 1383 N. McDowell Blvd., Suite 300, Petaluma, California 94954.
| Shares Beneficially Owned Prior to this Offering |
Shares Beneficially Owned After this Offering |
|||||||||||||||
| Beneficial Owner Name |
Shares | Percentage | Shares | Percentage | ||||||||||||
| Executive Officers and Directors: |
||||||||||||||||
| Mark A. Floyd(1) |
568,153 | 1.5 | 568,153 | 1.3 | ||||||||||||
| Michael L. Hatfield(2) |
2,043,577 | 5.6 | 2,043,577 | 4.6 | ||||||||||||
| Scott A. Pradels(3) |
210,937 | * | 210,937 | * | ||||||||||||
| Kenneth M. Siegel(4) |
— | * | — | * | ||||||||||||
| Michael J. Boustridge(5) |
88,685 | * | 88,685 | * | ||||||||||||
| Paul A. Ferris(6) |
6,060,122 | 16.5 | 6,060,122 | 13.5 | ||||||||||||
| Promod Haque(7) |
11,004,099 | 29.9 | 11,004,099 | 24.5 | ||||||||||||
| M. Niel Ransom(8) |
88,685 | * | 88,685 | * | ||||||||||||
| Robert E. Switz (9) |
153,274 | * | 153,274 | * | ||||||||||||
| All executive officers and directors as a group (12 persons)(10) |
20,541,489 | 53.4 | 20,541,489 | 44.2 | ||||||||||||
| 5% Stockholders: |
||||||||||||||||
| Entities affiliated with Norwest Venture Partners(11) |
11,004,099 | 29.9 | 11,004,099 | 24.5 | ||||||||||||
| Entities affiliated with Azure Capital(12) |
6,060,122 | 16.5 | 6,060,122 | 13.5 | ||||||||||||
| Entities affiliated with Tenaya Capital(13) |
3,315,081 | 9.1 | 3,315,081 | 7.4 | ||||||||||||
| Entities affiliated with Focus Ventures(14) |
2,485,375 | 6.8 | 2,485,375 | 5.6 | ||||||||||||
| Entities affiliated with Meritech Capital Partners(15) |
2,444,216 | 6.7 | 2,444,216 | 5.5 | ||||||||||||
| Michael L. Hatfield(2) |
2,043,577 | 5.6 | 2,043,577 | 4.6 | ||||||||||||
121
Table of Contents
| (*) | Represents beneficial ownership of less than 1%. |
| (1) | Consists of 568,153 shares issuable upon exercise of options exercisable within 60 days of March 31, 2013, of which 505,653 shares will be fully vested as of May 1, 2013 and the remainder of which, if purchased, would be subject to a repurchase right until fully vested. Excludes unvested and unexercisable options to purchase 1,200,906 shares of common stock. |
| (2) | Consists of (i) 1,873,656 shares held by Mr. Hatfield; (ii) 66,666 shares issuable upon exercise of options exercisable within 60 days of March 31, 2013; (iii) 53,924 shares issuable upon the exercise of warrants held by Mr. Hatfield that are immediately exercisable at an exercise price of $1.30 per share; and (iv) 49,331 shares issuable upon the exercise of warrants held by Mr. Hatfield that are immediately exercisable at an exercise price of $2.45 per share. Excludes unvested and unexercisable options to purchase 583,334 shares of common stock. |
| (3) | Consists of (i) 150,000 shares held by Mr. Pradels; and (ii) 60,937 shares issuable upon exercise of options exercisable within 60 days of March 31, 2013. Excludes unvested and unexercisable options to purchase 304,063 shares of common stock. |
| (4) | Excludes unvested and unexercisable options to purchase 250,000 shares of common stock. |
| (5) | Consists of 88,685 shares exercisable within 60 days of March 31, 2013, of which 14,780 will be fully vested as of May 1, 2013 and the remainder of which, if purchased, would be subject to a repurchase right until fully vested. Excludes unvested and unexercisable options to purchase 40,000 shares of common stock. |
| (6) | Consists of the shares listed in footnote (12) below, which are held by the Azure Capital entities. Mr. Ferris, one of our directors, is a general partner at Azure Capital and shares voting and dispositive power with respect to the shares held by the Azure Capital entities. |
| (7) | Consists of the shares listed in footnote (11) below, which are held by the Norwest Venture Partners entities. Mr. Haque, one of our directors, is a member of Genesis VC Partners X, LLC and Itasca VC VII-A, LLC and shares voting and dispositive power with respect to the shares held by the Norwest Venture Partners entities. |
| (8) | Consists of 88,685 shares issuable upon exercise of options exercisable within 60 days of March 31, 2013, of which 81,294 will be fully vested as of May 1, 2013 and the remainder of which, if purchased, would be subject to a repurchase right until fully vested. |
| (9) | Consists of (i) 64,589 shares held by the Robert E. Switz Revocable Trust dated July 27, 2009 for which Mr. Switz serves as trustee; and (ii) 88,685 shares exercisable within 60 days of March 31, 2013, of which 48,037 will be fully vested as of May 1, 2013 and the remainder of which, if purchased, would be subject to a repurchase right until fully vested. |
| (10) | Consists of (i) 18,599,043 shares beneficially owned by our current executive officers and directors; (ii) 1,285,768 shares issuable upon exercise of options exercisable within 60 days of March 31, 2013, of which 1,101,324 will be fully vested as of May 1, 2013; (iii) 53,924 shares issuable upon the exercise of warrants that are immediately exercisable at an exercise price of $1.30 per share; and (iv) 602,754 shares issuable upon the exercise of warrants that are immediately exercisable at an exercise price of $2.45 per share. Excludes unvested and unexercisable options to purchase 3,270,596 shares of common stock. |
| (11) | Consists of (i) 10,044,826 shares held by Norwest Venture Partners X, LP (“NVP X”); (ii) 641,560 shares held by Norwest Venture Partners VII-A, LP (“NVP VII-A”); and (iii) 317,713 shares issuable upon the exercise of warrants held by NVP X that are immediately exercisable at an exercise price of $2.45 per share. NVP Associates, LLC (“NVP”) is the managing member of Genesis VC Partners X, LLC (“Genesis X”) the general partner of NVP X and Itasca VC VII-A, LLC (“Itasca VII-A”), the general partner of NVP VII-A. Promod Haque, Matthew Howard and Jeffrey Crowe, as co-Chief Executive Officers of NVP and members of Genesis X and Itasca VII-A, may be deemed to share voting and dispositive power with respect to the shares held by NVP X and NVP VII-A. The address for the Norwest Venture Partners entities is 525 University Avenue, Suite 800, Palo Alto, California 94301. |
122
Table of Contents
| (12) | Consists of (i) 5,162,335 shares held by Azure Capital Partners II, L.P. (“Azure Capital II”); (ii) 662,077 shares held by Azure Entrepreneurs II, L.P. (“Azure Entrepreneurs II”); (iii) 208,916 shares issuable upon the exercise of warrants held by Azure Capital II that are immediately exercisable at an exercise price of $2.45 per share; and (iv) 26,794 shares issuable upon the exercise of warrants held by Azure Entrepreneurs II that are immediately exercisable at an exercise price of $2.45 per share. The general partner of each of Azure Capital II and Azure Entrepreneurs II is Azure Capital Partners VC Administrators II, LP, whose general partner is Azure Parent, LLC (“Azure Capital Partners”). Paul Ferris, Mike Kwatinetz, Cameron Lester and Paul Weinstein are the managing members of Azure Capital Partners and share voting and investment power with respect to the shares held by Azure Capital II and Azure Entrepreneurs II. The address for each of these entities is c/o Azure Capital Partners, 650 California Street, 11th Floor, San Francisco, California 94108. |
| (13) | Consists of (i) 2,598,058 shares held by Tenaya Capital V, L.P.; and (ii) 717,023 shares held by Tenaya Capital V, L.P. The general partner of each of Tenaya Capital V, L.P. and Tenaya Capital V-P, L.P. is Tenaya Capital V GP, LP whose general partner is Tenaya Capital V GP, LLC. Messrs. Tom Banahan, Ben Boyer, Stewart Gollmer, Brian Melton and Brian Paul are the managers of Tenaya Capital V GP, LLC and such managers share voting and dispositive power over the shares held by Tenaya Capital V, L.P. and Tenaya Capital V-P, L.P. The address for each of these entities is c/o Tenaya Capital, 2965 Woodside Road, Suite A, Woodside, California 94062. |
| (14) | Consists of (i) 2,441,831 shares held by Focus Ventures III, L.P. (“Focus Ventures”); and (ii) 43,544 shares held by FV Investors III, L.P. (“FV Investors”). The general partner of each of Focus Ventures and FV Investors is Focus Ventures Partners III, LLC (“Focus Ventures Partners”). James H. Boettcher, Steven Bird and Kevin J. McQuillan are the managing members of Focus Ventures Partners and may be deemed to share voting and dispositive power with respect to the shares held by Focus Ventures and FV Investors. The address for each of these entities is c/o Focus Ventures, 525 University Avenue, Suite 225, Palo Alto, California 94301. |
| (15) | Consists of (i) 2,400,466 shares held by Meritech Capital Partners III L.P. (“MCP III LP”); and (ii) 43,750 shares held by Meritech Capital Affiliates III L.P. (“MCA III LP”). Meritech Management Associates III L.L.C. (“MMA III LLC”), a managing member of Meritech Capital Associates III L.L.C. (“MCA III LLC”), the general partner of MCP III LP and MCA III LP, has sole voting and dispositive power with respect to the shares held by MCP III LP and MCA III LP. Paul S. Madera, Michael B. Gordon, Robert D. Ward and George H. Bischof, the managing members of MMA III LLC, share voting and dispositive power with respect to the shares held by these entities and disclaim beneficial ownership of these shares except to the extent of their pecuniary interest therein. The address for each of these entities is c/o Meritech Capital Partners, 245 Lytton Avenue, Suite 350, Palo Alto, California 94301. |
123
Table of Contents
General
The following description summarizes the most important terms of our capital stock, as they are expected to be in effect upon the completion of this offering. We have adopted an amended and restated certificate of incorporation and amended and restated bylaws which will become effective in connection with the completion of this offering, and this description summarizes the provisions that are expected to be included in such documents. This summary does not purport to be complete and is qualified in its entirety by the provisions of our amended and restated certificate of incorporation and amended and restated bylaws, copies of which have been filed as exhibits to the registration statement of which this prospectus is a part. For a complete description of our capital stock, you should refer to our amended and restated certificate of incorporation, amended and restated bylaws and investor rights agreement, that are or will be included as exhibits to the registration statement of which this prospectus forms a part, and to the applicable provisions of Delaware law. Immediately following the completion of this offering, our authorized capital stock will consist of 1,000,000,000 shares of common stock, $0.0001 par value per share, and 20,000,000 shares of undesignated preferred stock, $0.0001 par value per share.
As of March 31, 2013, there were 36,531,318 shares of our common stock outstanding, held by approximately 65 stockholders of record, assuming the automatic conversion of all outstanding shares of redeemable convertible preferred stock into shares of common stock, which will occur upon the completion of this offering. Our board of directors is authorized, without stockholder approval, except as required by the listing standards of the New York Stock Exchange, to issue additional shares of our capital stock.
Common Stock
Dividend Rights
Subject to preferences that may apply to any shares of preferred stock outstanding at the time, the holders of our common stock will be entitled to receive dividends out of funds legally available if our board of directors, in its discretion, determines to issue dividends and then only at the times and in the amounts that our board of directors may determine. See the section titled “Dividend Policy” for additional information.
Voting Rights
Holders of our common stock are entitled to one vote for each share held on all matters submitted to a vote of stockholders. We have not provided for cumulative voting for the election of directors in our amended and restated certificate of incorporation. Our amended and restated certificate of incorporation establishes a classified board of directors that is divided into three classes with staggered three-year terms. Only the directors in one class will be subject to election by a plurality of the votes cast at each annual meeting of our stockholders, with the directors in the other classes continuing for the remainder of their respective three-year terms.
No Preemptive or Similar Rights
Our common stock is not entitled to preemptive rights, and is not subject to conversion, redemption or sinking fund provisions.
124
Table of Contents
Right to Receive Liquidation Distributions
If we become subject to a liquidation, dissolution or winding-up, the assets legally available for distribution to our stockholders would be distributable ratably among the holders of our common stock and any participating preferred stock outstanding at that time, subject to prior satisfaction of all outstanding debt and liabilities and the preferential rights of and the payment of liquidation preferences, if any, on any outstanding shares of preferred stock.
Preferred Stock
Each currently outstanding share of our redeemable convertible preferred stock will be converted into common stock on a one-to-one basis upon either (i) the closing of an offering with proceeds to us of at least $50 million and in which our valuation immediately prior to the closing of this offering is $300 million or (ii) the written consent or agreement of the holders of a majority of our then outstanding shares of redeemable convertible preferred stock.
Following this offering, our board of directors will be authorized, subject to limitations prescribed by Delaware law, to issue preferred stock in one or more series, to establish from time to time the number of shares to be included in each series, and to fix the designation, powers, preferences and rights of the shares of each series and any of its qualifications, limitations or restrictions, in each case without further vote or action by our stockholders. Our board of directors can also increase or decrease the number of shares of any series of preferred stock, but not below the number of shares of that series then outstanding, without any further vote or action by our stockholders. Our board of directors may authorize the issuance of preferred stock with voting or conversion rights that could adversely affect the voting power or other rights of the holders of our common stock. The issuance of preferred stock, while providing flexibility in connection with possible acquisitions and other corporate purposes, could, among other things, have the effect of delaying, deferring or preventing a change in our control of our company and might adversely affect the market price of our common stock and the voting and other rights of the holders of our common stock. We have no current plan to issue any shares of preferred stock.
Stock Options
As of March 31, 2013, there were 11,184,817 outstanding options to purchase shares of our common stock pursuant to our 2006 Plan, with a weighted-average exercise price of $3.18 per share.
Warrants
As of March 31, 2013, we had the following warrants outstanding, with a weighted-average exercise price of $2.34 per share:
| Ÿ | warrants to purchase 115,001 shares of our redeemable convertible preferred stock that will either be exercised or converted into warrants to purchase 115,001 shares of our common stock, all of which are exercisable for a period of five years following the effectiveness of the registration statement, in connection with the completion of this offering; and |
| Ÿ | warrants to purchase 894,596 shares of our redeemable convertible preferred stock that will either be exercised or terminated, in each case immediately prior to the completion of this offering. |
Exclusive Jurisdiction
Unless we consent in writing to the selection of an alternative forum, the Court of Chancery of the State of Delaware will be the sole and exclusive forum for: (i) any derivative action or proceeding brought on behalf of us; (ii) any action asserting a claim of breach of a fiduciary duty owed by any of
125
Table of Contents
our directors, officers or other employees or agents to the us or the our stockholders; (iii) any action asserting a claim against us arising pursuant to any provision of the DGCL or our amended and restated certificate of incorporation or amended and restated bylaws; (iv) any action to interpret, apply, enforce or determine the validity of our amended and restated certificate of incorporation or our amended and restated bylaws; or (v) any action asserting a claim against us governed by the internal affairs doctrine, in each such case, subject to said Court of Chancery having personal jurisdiction over the indispensable parties named as defendants therein.
Registration Rights
After the completion of this offering, the holders of an aggregate of 36,556,602 shares of our common stock, calculated on a fully diluted basis, or their permitted transferees, are entitled to rights with respect to the registration of these shares under the Securities Act. These rights are provided under the terms of an investors’ rights agreement between us and the holders of these shares, and include demand registration rights, short form registration rights and piggyback registration rights.
These registration rights will expire (i) five years following the completion of this offering, (ii) upon the closing of a transfer of a majority of our common stock or securities exchangeable for or convertible into our common stock (through a merger, consolidation or stock purchase) or sale or disposal of all or substantially all of our assets, including granting one or more exclusive licenses of all or substantially all of our intellectual property, or (iii) with respect to any stockholder holding less than five percent of our outstanding capital stock, when such stockholder is able to sell all of its shares during a three-month period without registration pursuant to Rule 144 or another similar exemption under the Securities Act. We will pay the registration expenses (other than underwriting discounts and selling commissions) of the holders of the shares registered pursuant to the registrations described below. In an underwritten offering, the managing underwriter, if any, has the right, subject to specified conditions, to limit the number of shares such holders may include. In connection with the completion of this offering, each stockholder that has registration rights agreed not to sell or otherwise dispose of any securities without the prior written consent of the underwriters for a period of 180 days after the date of this prospectus, subject to certain terms and conditions. See the section titled “Underwriters” for additional information.
Demand Registration Rights
After the completion of this offering, the holders of approximately 34,791,601 shares of our common stock will be entitled to certain demand registration rights, which number assumes the exercise and conversion to common stock of (i) warrants to purchase 77,033 shares of Series A redeemable convertible preferred stock; and (ii) warrants to purchase 817,563 shares of Series C redeemable convertible preferred stock. Six months after the completion of this offering, the holders of at least 30% of these shares then outstanding can request that we register the offer and sale of their shares, provided that such registration of shares would result in an anticipated aggregate offering price of at least $5,000,000. If we determine that it would be materially detrimental to our stockholders to effect such a demand registration, we have the right to defer such registration, not more than once in any 12-month period, for a period of up to 120 days. Additionally, we will not be required to effect a demand registration during the period beginning with 90 days prior to our good faith estimate of the date of the filing of, and ending 180 days following the effectiveness of a registration statement relating to the public offering of our securities.
Form S-3 Registration Rights
After the completion of this offering, the holders of up to approximately 34,906,602 shares of our common stock may make a written request that we register the offer and sale of their shares on Form S-3 if we are eligible to file a registration statement on Form S-3 so long as the sale of securities registered pursuant to such request would result in an anticipated aggregate offering price of at least one million
126
Table of Contents
dollars. These stockholders may make an unlimited number of requests for registration on Form S-3; however, we will not be required to effect a registration on Form S-3 if we have effected two such registrations within the 12-month period preceding the date of the request. Additionally, if we determine that it would be materially detrimental to our stockholders to effect such a registration, we have the right to defer such registration, not more than once in any 12-month period, for a period of up to 120 days.
Piggyback Registration Rights
After the completion of this offering, if we propose to register the offer and sale of any of our securities under the Securities Act, in connection with the public offering of such securities, the holders of up to approximately 36,556,602 shares of our common stock will be entitled to certain “piggyback” registration rights allowing the holders to include their shares in such registration, subject to certain limitations. As a result, whenever we propose to file a registration statement under the Securities Act, other than with respect to a registration related to a company stock plan, a registration related to a corporate reorganization or transaction under Rule 145 of the Securities Act or a registration in which the only common stock being registered is common stock issuable upon conversion of debt securities that are also being registered, the holders of these shares are entitled to notice of the registration and have the right, subject to limitations that the underwriters may impose on the number of shares included in the registration, to include their shares in the registration.
Anti-Takeover Provisions
The provisions of Delaware law, our amended and restated certificate of incorporation and our amended and restated bylaws may have the effect of delaying, deferring or discouraging another person from acquiring control of our company. These provisions, which are summarized below, may have the effect of discouraging takeover bids. They are also designed, in part, to encourage persons seeking to acquire control of us to negotiate first with our board of directors. We believe that the benefits of increased protection of our potential ability to negotiate with an unfriendly or unsolicited acquirer outweigh the disadvantages of discouraging a proposal to acquire us because negotiation of these proposals could result in an improvement of their terms.
Delaware Law
We are governed by the provisions of Section 203 of the Delaware General Corporation Law, or DGCL. In general, Section 203 prohibits a public Delaware corporation from engaging in a “business combination” with an “interested stockholder” for a period of three years after the date of the transaction in which the person became an interested stockholder, unless the business combination is approved in a prescribed manner. A “business combination” includes mergers, asset sales or other transactions resulting in a financial benefit to the stockholder. An “interested stockholder” is a person who, together with affiliates and associates, owns, or within three years of the date on which it is sought to be determined whether such person is an “interested stockholder,” did own, 15% or more of the corporation’s outstanding voting stock. These provisions may have the effect of delaying, deferring or preventing a change in our control.
Amended and Restated Certificate of Incorporation and Amended and Restated Bylaw Provisions
Our amended and restated certificate of incorporation and our amended and restated bylaws include a number of provisions that could deter hostile takeovers or delay or prevent changes in control of our management team, including the following:
| Ÿ | Board of Directors Vacancies. Our amended and restated certificate of incorporation and amended and restated bylaws will authorize only our board of directors to fill vacant |
127
Table of Contents
| directorships, including newly created seats. In addition, the number of directors constituting our board of directors will be permitted to be set only by a resolution adopted by a majority vote of our entire board of directors. These provisions would prevent a stockholder from increasing the size of our board of directors and then gaining control of our board of directors by filling the resulting vacancies with its own nominees. This makes it more difficult to change the composition of our board of directors but promotes continuity of management. |
| Ÿ | Classified Board. Our amended and restated certificate of incorporation and amended and restated bylaws will provide that our board is classified into three classes of directors. A third party may be discouraged from making a tender offer or otherwise attempting to obtain control of us as it is more difficult and time consuming for stockholders to replace a majority of the directors on a classified board of directors. See the section titled “Management—Board of Directors” for additional information. |
| Ÿ | Stockholder Action; Special Meeting of Stockholders. Our amended and restated certificate of incorporation will provide that our stockholders may not take action by written consent, but may only take action at annual or special meetings of our stockholders. As a result, a holder controlling a majority of our capital stock would not be able to amend our amended and restated bylaws or remove directors without holding a meeting of our stockholders called in accordance with our amended and restated bylaws. Our amended and restated bylaws will further provide that special meetings of our stockholders may be called only by a majority of our board of directors, the chairman of our board of directors, our Chief Executive Officer or our president, thus prohibiting a stockholder from calling a special meeting. These provisions might delay the ability of our stockholders to force consideration of a proposal or for stockholders controlling a majority of our capital stock to take any action, including the removal of directors. |
| Ÿ | Advance Notice Requirements for Stockholder Proposals and Director Nominations. Our amended and restated bylaws will provide advance notice procedures for stockholders seeking to bring business before our annual meeting of stockholders or to nominate candidates for election as directors at our annual meeting of stockholders. Our amended and restated bylaws will also specify certain requirements regarding the form and content of a stockholder’s notice. These provisions might preclude our stockholders from bringing matters before our annual meeting of stockholders or from making nominations for directors at our annual meeting of stockholders if the proper procedures are not followed. We expect that these provisions may also discourage or deter a potential acquirer from conducting a solicitation of proxies to elect the acquirer’s own slate of directors or otherwise attempting to obtain control of our company. |
| Ÿ | No Cumulative Voting. The Delaware General Corporation Law provides that stockholders are not entitled to the right to cumulate votes in the election of directors unless a corporation’s certificate of incorporation provides otherwise. Our amended and restated certificate of incorporation and amended and restated bylaws will not provide for cumulative voting. |
| Ÿ | Directors Removed Only for Cause. Our amended and restated certificate of incorporation will provide that stockholders may remove directors only for cause. |
| Ÿ | Amendment of Charter Provisions. Any amendment of the above provisions in our amended and restated certificate of incorporation would require approval by holders of at least two-thirds of our then outstanding common stock. |
| Ÿ | Issuance of Undesignated Preferred Stock. Our board of directors will have the authority, without further action by the stockholders, to issue up to 20,000,000 shares of undesignated preferred stock with rights and preferences, including voting rights, designated from time to time by our board of directors. The existence of authorized but unissued shares of preferred stock would enable our board of directors to render more difficult or to discourage an attempt to obtain control of us by means of a merger, tender offer, proxy contest or other means. |
128
Table of Contents
Transfer Agent and Registrar
Upon the completion of this offering, the transfer agent and registrar for our common stock will be Computershare Trust Company, N.A. The transfer agent and registrar’s address is 250 Royall Street, Canton, Massachusetts 02021. Our shares of common stock will be issued in uncertificated form only, subject to limited circumstances.
Listing
Our common stock has been approved for listing on the New York Stock Exchange under the symbol “CYNI.”
129
Table of Contents
SHARES ELIGIBLE FOR FUTURE SALE
Prior to this offering, there has been no public market for our common stock, and we cannot predict the effect, if any, that market sales of shares of our common stock or the availability of shares of our common stock for sale will have on the market price of our common stock prevailing from time to time. Future sales of our common stock in the public market, or the availability of such shares for sale in the public market, could adversely affect market prices prevailing from time to time. As described below, only a limited number of shares will be available for sale shortly after this offering due to contractual and legal restrictions on resale. Nevertheless, sales of our common stock in the public market after such restrictions lapse, or the perception that those sales may occur, could adversely affect the prevailing market price at such time and our ability to raise equity capital in the future.
Following the completion of this offering, and after giving effect to the automatic conversion of all outstanding shares of redeemable convertible preferred stock which will occur upon the completion of this offering, based on the number of shares of our capital stock outstanding as of March 31, 2013, we will have a total of 44,531,318 shares of our common stock outstanding. Of these outstanding shares, all of the shares of common stock sold in this offering will be freely tradable, except that any shares purchased in this offering by our affiliates, as that term is defined in Rule 144 under the Securities Act, would only be able to be sold in compliance with the Rule 144 limitations described below.
The remaining outstanding shares of our common stock will be deemed “restricted securities” as defined in Rule 144. Restricted securities may be sold in the public market only if they are registered or if they qualify for an exemption from registration under Rule 144 or Rule 701 under the Securities Act, which rules are summarized below. In addition, holders of all or substantially all of our equity securities have entered into or will enter into lock-up agreements with the underwriters under which they have agreed, subject to specific exceptions, not to sell any of our stock for at least 180 days following the date of this prospectus, as described below. As a result of these agreements and the provisions of our investors’ rights agreement described above under “Description of Capital Stock—Registration Rights,” subject to the provisions of Rule 144 or Rule 701, based on an assumed offering date of March 31, 2013, shares will be available for sale in the public market as follows:
| Ÿ | beginning on the date of this prospectus, the 8,000,000 shares of common stock sold in this offering will be immediately available for sale in the public market; |
| Ÿ | beginning 181 days after the date of this prospectus, 36,531,318 additional shares of common stock will become eligible for sale in the public market, of which 26,843,715 shares will be held by affiliates and subject to the volume and other restrictions of Rule 144, as described below; and |
| Ÿ | the remainder of the shares of common stock will be eligible for sale in the public market from time to time thereafter, subject in some cases to the volume and other restrictions of Rule 144, as described below. |
Lock-Up Agreements
We, our officers and directors and holders of substantially all of our common stock and securities convertible into or exchangeable for our common stock, have agreed or will agree that, subject to certain exceptions and under certain conditions, for a period of 180 days after the date of this prospectus, we and they will not, without the prior written consent of Goldman, Sachs & Co. and J.P. Morgan Securities LLC, dispose of or hedge any shares or any securities convertible into or exchangeable for shares of our capital stock. Goldman, Sachs & Co. and J.P. Morgan Securities LLC may, in their discretion, release any of the securities subject to these lock-up agreements at any time.
130
Table of Contents
The restrictions described in the immediately preceding paragraph to do not apply to:
| Ÿ | the sale of shares to the underwriters; |
| Ÿ | the transfer by a security holder of shares of common stock or any securities convertible into or exercisable or exchangeable for common stock (i) to an immediate family member of a security holder or to a trust formed for the benefit of such an immediate family member, (ii) by bona fide gift, will or intestacy, (iii) if the security holder is a corporation, partnership, limited liability company or other business entity (A) to another corporation, partnership, limited liability company or other business entity that is an affiliate of such security holder or (B) as part of a distribution to an equity holder of such stockholder or (iv) if the security holder is a trust, to a beneficiary of the trust, provided that in each case, the transferee, donee or distributee signs and delivers a lock-up agreement prior to or upon such transfer and no filing under Section 16 of the Exchange Act nor any other public filing or disclosure of such transfer is required or voluntarily made during the restricted period; |
| Ÿ | transactions by a security holder relating to shares of common stock or other securities acquired in open market transactions after completion of this offering; provided that no filing under Section 16 of the Exchange Act is required or voluntarily made in connection with subsequent sales of common stock or other securities acquired in such open market transactions; |
| Ÿ | the sale of shares to us in connection with the repurchase of shares of common stock issued pursuant to the 2006 Plan or 2013 Plan or pursuant to the agreements pursuant to which such shares were used; |
| Ÿ | if the security holder is an individual, the transfer of shares of common stock or any security convertible into or exercisable or exchangeable for common stock that occurs by operation of law, such as pursuant to a qualified domestic order or in connection with a divorce settlement, provided that the security holder uses its reasonable best efforts to cause the transferee to sign and deliver a lock-up agreement prior to such transfer; |
| Ÿ | the transfer of shares of common stock or any security convertible into or exercisable or exchangeable for common stock by a security holder pursuant to a bona fide third-party tender offer, merger, consolidation or other similar transaction made to all holders of our common stock involving a change of control of us, provided that in the event that the tender offer, merger, consolidation or other such transaction is not completed, such securities will continue to be subject to these restrictions; |
| Ÿ | the issuance by us of shares of our common stock upon the exercise of an option or the conversion or exchange of a security outstanding immediately prior to the completion of the offering; |
| Ÿ | the issuance by us of shares of our common stock or any securities convertible into, exchangeable for or that represent the right to receive shares of our common stock, in each case pursuant to the 2006 Plan or 2013 Plan; or |
| Ÿ | the entry into an agreement by us providing for the issuance of shares of our common stock or any security convertible into or exercisable for shares of our common stock, (i) in connection with the acquisition by us of the securities, business, property or other assets of another person or entity or pursuant to an employee benefit plan assumed by us in connection with such acquisition, and the issuance of any such securities pursuant to any such agreement, or (ii) in connection with joint ventures, commercial relationships or other strategic transactions; provided, however, that in the case of clauses (i) and (ii), the aggregate number of shares of our common stock that we may sell or issue or agree to sell or issue shall not exceed 10% of the shares of our common stock outstanding following the completion of this offering. |
131
Table of Contents
In the event that any of our officers or directors or a person or group (as such term is used in Section 13(d)(3) of the Exchange Act) that is the record or beneficial owner of one percent (aggregating ownership of affiliates) or more of our capital stock is granted an early release, then each person or group who has executed a lock-up agreement automatically will be granted an early release from its obligations under the lock-up agreement on a pro rata basis.
Rule 144
In general, under Rule 144 as currently in effect, once we have been subject to the public company reporting requirements of Section 13 or Section 15(d) of the Securities Exchange Act of 1934, as amended, or the Exchange Act, for at least 90 days, a person who is not deemed to have been one of our affiliates for purposes of the Securities Act at any time during the 90 days preceding a sale and who has beneficially owned the shares proposed to be sold for at least six months, including the holding period of any prior owner other than our affiliates, is entitled to sell those shares without complying with the manner of sale, volume limitation or notice provisions of Rule 144, subject to compliance with the public information requirements of Rule 144. If such a person has beneficially owned the shares proposed to be sold for at least one year, including the holding period of any prior owner other than our affiliates, then that person would be entitled to sell those shares without complying with any of the requirements of Rule 144.
In general, under Rule 144, as currently in effect, our affiliates or persons selling shares on behalf of our affiliates are entitled to sell upon expiration of the lock-up agreements described above, within any three-month period, a number of shares that does not exceed the greater of:
| Ÿ | 1% of the number of shares of our common stock then outstanding, which will equal approximately 445,313 shares immediately after this offering; or |
| Ÿ | the average weekly trading volume of our common stock during the four calendar weeks preceding the filing of a notice on Form 144 with respect to that sale. |
Sales under Rule 144 by our affiliates or persons selling shares on behalf of our affiliates are also subject to certain manner of sale provisions and notice requirements and to the availability of current public information about us.
Rule 701
Rule 701 generally allows a stockholder who purchased shares of our common stock pursuant to a written compensatory plan or contract and who is not deemed to have been an affiliate of our company during the immediately preceding 90 days to sell these shares in reliance upon Rule 144, but without being required to comply with the public information, holding period, volume limitation or notice provisions of Rule 144. Rule 701 also permits affiliates of our company to sell their Rule 701 shares under Rule 144 without complying with the holding period requirements of Rule 144. All holders of Rule 701 shares, however, are required by that rule to wait until 90 days after the date of this prospectus before selling those shares pursuant to Rule 701.
132
Table of Contents
Registration Rights
Pursuant to an investor rights agreement, the holders of approximately 36,556,602 shares of our common stock, or their transferees, will be entitled to certain rights with respect to the registration of the offer and sale of those shares under the Securities Act. For a description of these registration rights, see the section titled “Description of Capital Stock—Registration Rights.” If the offer and sale of these shares is registered, the shares will be freely tradable without restriction under the Securities Act, and a large number of shares may be sold into the public market.
Stock Options
As of March 31, 2013, there were 11,184,817 outstanding options to purchase shares of common stock pursuant to our 2006 Plan, with a weighted-average exercise price of $3.18 per share. We intend to file a registration statement on Form S-8 under the Securities Act as promptly as possible after the completion of this offering to register all of the shares of common stock issued or reserved for issuance under our 2006 Plan and our 2013 Plan. The registration statement on Form S-8 is expected to become effective immediately upon filing, and shares covered by the registration statement will then become eligible for sale in the public markets, subject to the Rule 144 limitations applicable to affiliates, vesting restrictions and any applicable lock-up agreements. See the section titled “Executive Compensation—Employee Benefit Plans” for additional information.
133
Table of Contents
MATERIAL U.S. FEDERAL INCOME TAX CONSEQUENCES TO NON-U.S. HOLDERS
The following is a summary of the material U.S. federal income tax consequences of the ownership and disposition of our common stock to non-U.S. holders, but does not purport to be a complete analysis of all the potential tax considerations relating thereto. This summary is based upon the provisions of the Code, Treasury regulations promulgated thereunder, administrative rulings and judicial decisions, all as of the date hereof. These authorities may be changed, possibly retroactively, so as to result in U.S. federal income tax consequences different from those set forth below. We have not sought any ruling from the Internal Revenue Service, or the IRS, with respect to the statements made and the conclusions reached in the following summary, and there can be no assurance that the IRS will agree with such statements and conclusions.
This summary also does not address the tax considerations arising under the laws of any non-U.S., state or local jurisdiction or under U.S. federal gift and estate tax laws, except to the limited extent set forth below. In addition, this discussion does not address tax considerations applicable to an investor’s particular circumstances or to investors that may be subject to special tax rules, including, without limitation:
| Ÿ | banks, insurance companies or other financial institutions; |
| Ÿ | persons subject to the alternative minimum tax; |
| Ÿ | tax-exempt organizations; |
| Ÿ | controlled foreign corporations, passive foreign investment companies and corporations that accumulate earnings to avoid U.S. federal income tax; |
| Ÿ | dealers in securities or currencies; |
| Ÿ | traders in securities that elect to use a mark-to-market method of accounting for their securities holdings; |
| Ÿ | persons that own, or are deemed to own, more than five percent of our capital stock (except to the extent specifically set forth below); |
| Ÿ | certain former citizens or long-term residents of the United States; |
| Ÿ | persons who hold our common stock as a position in a hedging transaction, “straddle,” “conversion transaction” or other risk reduction transaction; |
| Ÿ | persons who do not hold our common stock as a capital asset within the meaning of Section 1221 of the Code; or |
| Ÿ | persons deemed to sell our common stock under the constructive sale provisions of the Code. |
In addition, if a partnership or entity classified as a partnership for U.S. federal income tax purposes holds our common stock, the tax treatment of a partner generally will depend on the status of the partner and upon the activities of the partnership. Accordingly, partnerships that hold our common stock, and partners in such partnerships, should consult their tax advisors.
You are urged to consult your tax advisor with respect to the application of the U.S. federal income tax laws to your particular situation, as well as any tax consequences of the purchase, ownership and disposition of our common stock arising under the U.S. federal estate or gift tax rules or under the laws of any state, local, non-U.S. or other taxing jurisdiction or under any applicable tax treaty.
134
Table of Contents
Non-U.S. Holder Defined
For purposes of this discussion, you are a non-U.S. holder if you are any holder other than:
| Ÿ | an individual citizen or resident of the United States (for tax purposes); |
| Ÿ | a corporation or other entity taxable as a corporation created or organized in the United States or under the laws of the United States or any political subdivision thereof; |
| Ÿ | an estate whose income is subject to U.S. federal income tax regardless of its source; or |
| Ÿ | a trust (x) whose administration is subject to the primary supervision of a U.S. court and that has one or more U.S. persons who have the authority to control all substantial decisions of the trust or (y) that has made an election to be treated as a U.S. person. |
Distributions
We do not anticipate making any distributions on our common stock following the completion of this offering. However, if we do make distributions on our common stock, those payments will constitute dividends for U.S. tax purposes to the extent paid from our current or accumulated earnings and profits, as determined under U.S. federal income tax principles. To the extent those distributions exceed both our current and our accumulated earnings and profits, they will constitute a return of capital and will first reduce your basis in our common stock, but not below zero, and then will be treated as gain from the sale of stock.
Any dividend paid to you generally will be subject to U.S. withholding tax either at a rate of 30% of the gross amount of the dividend or such lower rate as may be specified by an applicable income tax treaty. In order to receive a reduced treaty rate, you must provide us with an IRS Form W-8BEN or other appropriate version of IRS Form W-8 certifying qualification for the reduced rate. A non-U.S. holder of shares of our common stock eligible for a reduced rate of U.S. withholding tax pursuant to an income tax treaty may obtain a refund of any excess amounts withheld by filing an appropriate claim for refund with the IRS. If the non-U.S. holder holds the stock through a financial institution or other agent acting on the non-U.S. holder’s behalf, the non-U.S. holder will be required to provide appropriate documentation to the agent, which then will be required to provide certification to us or our paying agent, either directly or through other intermediaries.
Dividends received by you that are effectively connected with your conduct of a U.S. trade or business (and, if an income tax treaty applies, such dividends are attributable to a permanent establishment maintained by you in the U.S.), are includible in your gross income in the taxable year received, and are exempt from such withholding tax. In order to obtain this exemption, you must provide us with an IRS Form W-8ECI or other applicable IRS Form W-8 properly certifying such exemption. Such effectively connected dividends, although not subject to withholding tax, are taxed at the same graduated rates applicable to U.S. persons, net of certain deductions and credits, subject to an applicable income tax treaty providing otherwise. In addition, if you are a corporate non-U.S. holder, dividends you receive that are effectively connected with your conduct of a U.S. trade or business may also be subject to a branch profits tax at a rate of 30% or such lower rate as may be specified by an applicable income tax treaty.
Gain on Disposition of Common Stock
You generally will not be required to pay U.S. federal income tax on any gain realized upon the sale or other disposition of our common stock unless:
| Ÿ | the gain is effectively connected with your conduct of a U.S. trade or business (and, if an income tax treaty applies, the gain is attributable to a permanent establishment maintained by you in the United States); |
135
Table of Contents
| Ÿ | you are an individual who is present in the United States for a period or periods aggregating 183 days or more during the calendar year in which the sale or disposition occurs and certain other conditions are met; or |
| Ÿ | our common stock constitutes a U.S. real property interest by reason of our status as a “United States real property holding corporation,” or USRPHC, for U.S. federal income tax purposes (a “USRPHC”) at any time within the shorter of the five-year period preceding your disposition of, or your holding period for, our common stock. |
We believe that we are not currently and will not become a USRPHC. However, because the determination of whether we are a USRPHC depends on the fair market value of our U.S. real property relative to the fair market value of our other business assets, there can be no assurance that we will not become a USRPHC in the future. Even if we become a USRPHC, however, as long as our common stock is regularly traded on an established securities market, such common stock will be treated as U.S. real property interests only if you actually or constructively hold more than five percent of such regularly traded common stock at any time during the shorter of the five-year period preceding your disposition of, or your holding period for, our common stock.
If you are a non-U.S. holder described in the first bullet above, you will be required to pay tax on the net gain derived from the sale under regular graduated U.S. federal income tax rates, and a corporate non-U.S. holder described in the first bullet above also may be subject to the branch profits tax at a 30% rate, or such lower rate as may be specified by an applicable income tax treaty. If you are an individual non-U.S. holder described in the second bullet above, you will be required to pay a flat 30% tax on the gain derived from the sale, which tax may be offset by U.S. source capital losses for the year. You should consult any applicable income tax or other treaties that may provide for different rules.
Federal Estate Tax
Our common stock beneficially owned by an individual who is not a citizen or resident of the United States (as defined for U.S. federal estate tax purposes) at the time of their death will generally be includable in the decedent’s gross estate for U.S. federal estate tax purposes, unless an applicable estate tax treaty provides otherwise.
Backup Withholding and Information Reporting
Generally, we must report annually to the IRS the amount of dividends paid to you, your name and address, and the amount of tax withheld, if any. A similar report will be sent to you. Pursuant to applicable income tax treaties or other agreements, the IRS may make these reports available to tax authorities in your country of residence.
Payments of dividends or of proceeds on the disposition of stock made to you may be subject to information reporting and backup withholding at a current rate of 28% unless you establish an exemption, for example, by properly certifying your non U.S. status on a Form W-8BEN or another appropriate version of IRS Form W-8. Notwithstanding the foregoing, backup withholding and information reporting may apply if either we or our paying agent has actual knowledge, or reason to know, that you are a U.S. person.
Backup withholding is not an additional tax; rather, the U.S. income tax liability of persons subject to backup withholding will be reduced by the amount of tax withheld. If withholding results in an overpayment of taxes, a refund or credit may generally be obtained from the IRS, provided that the required information is furnished to the IRS in a timely manner.
136
Table of Contents
Recently Enacted Legislation Affecting Taxation of
our Common Stock Held by or through Foreign
Entities
Recently enacted legislation generally will impose a U.S. federal withholding tax of 30% on dividends, and the gross proceeds of a disposition of our common stock, paid to a “foreign financial institution” (as specially defined under these rules), unless such institution enters into an agreement with the U.S. government to withhold on certain payments and to collect and provide to the U.S. tax authorities substantial information regarding the U.S. account holders of such institution (which includes certain equity and debt holders of such institution, as well as certain account holders that are foreign entities with U.S. owners). The legislation also generally will impose a U.S. federal withholding tax of 30% on dividends and the gross proceeds of a disposition of our common stock paid to a non-financial foreign entity unless such entity provides the withholding agent with a certification identifying the direct and indirect U.S. owners of the entity. This withholding obligation under this legislation with respect to dividends on our common stock will not begin until January 1, 2014 and with respect to the gross proceeds of a sale or other disposition of our common stock will not begin until January 1, 2017. Under certain circumstances, a non-U.S. holder might be eligible for refunds or credits of such taxes. An intergovernmental agreement between the United States and an applicable foreign country may modify the requirements described in this paragraph. Prospective investors are encouraged to consult with their own tax advisors regarding the possible implications of this legislation on their investment in our common stock.
The preceding discussion of U.S. federal tax considerations is for general information only. It is not tax advice. Each prospective investor should consult its own tax advisor regarding the particular U.S. federal, state and local and non-U.S. tax consequences of purchasing, holding and disposing of our common stock, including the consequences of any proposed change in applicable laws.
137
Table of Contents
We and the underwriters named below will enter into an underwriting agreement with respect to the shares being offered. Subject to certain conditions, each underwriter will severally agree to purchase the number of shares indicated in the following table. Goldman, Sachs & Co. and J.P. Morgan Securities LLC are the representatives of the underwriters.
| Underwriters |
Number of Shares | |||
| Goldman, Sachs & Co. |
||||
| J.P. Morgan Securities LLC |
||||
| Jefferies LLC |
||||
| Pacific Crest Securities LLC |
||||
|
|
|
|||
| Total |
8,000,000 | |||
|
|
|
|||
The underwriters will be committed to take and pay for all of the shares being offered, if any are taken, other than the shares covered by the option described below, unless and until this option is exercised.
The underwriters will have an option to buy up to an additional 1,200,000 shares from us. They will be able to exercise that option for 30 days. If any shares are purchased pursuant to this option, the underwriters will severally purchase shares in approximately the same proportion as set forth in the table above.
The following table shows the per share and total underwriting discounts and commissions to be paid to the underwriters by us. Such amounts are shown assuming both no exercise and full exercise of the underwriters’ option to purchase up to 1,200,000 additional shares.
Paid by the Company
| No Exercise | Full Exercise | |||||||
| Per Share |
$ | $ | ||||||
| Total |
$ | $ | ||||||
Shares sold by the underwriters to the public will initially be offered at the initial public offering price set forth on the cover of this prospectus. Any shares sold by the underwriters to securities dealers may be sold at a discount of up to $ per share from the initial public offering price. After the initial offering of the shares, the representatives may change the offering price and the other selling terms. The offering of the shares by the underwriters is subject to receipt and acceptance and subject to the underwriters’ right to reject any order in whole or in part.
We, our officers, directors, and holders of substantially all of our common stock and securities convertible into or exchangeable for our common stock, have agreed or will agree with the underwriters that, subject to certain exceptions, we and they will not to dispose of or hedge any of their common stock or securities convertible into or exchangeable for shares of common stock during the period from the date of this prospectus continuing through the date 180 days after the date of this prospectus, except with the prior written consent of the representatives. This agreement does not apply to any existing employee benefit plans. See “Shares Available for Future Sale” for a discussion of certain transfer restrictions.
138
Table of Contents
The restrictions described in the immediately preceding paragraph do not apply to:
| Ÿ | the sale of shares to the underwriters; |
| Ÿ | the transfer by a security holder of shares of common stock or any securities convertible into or exercisable or exchangeable for common stock (i) to an immediate family member of a security holder or to a trust formed for the benefit of such an immediate family member, (ii) by bona fide gift, will or intestacy, (iii) if the security holder is a corporation, partnership, limited liability company or other business entity (A) to another corporation, partnership, limited liability company or other business entity that is an affiliate of such security holder or (B) as part of a distribution to an equity holder of such stockholder or (iv) if the security holder is a trust, to a beneficiary of the trust, provided that in each case, the transferee, donee or distributee signs and delivers a lock-up agreement prior to or upon such transfer and no filing under Section 16 of the Exchange Act nor any other public filing or disclosure of such transfer is required or voluntarily made during the restricted period; |
| Ÿ | transactions by a security holder relating to shares of common stock or other securities acquired in open market transactions after completion of this offering; provided that no filing under Section 16 of the Exchange Act is required or voluntarily made in connection with subsequent sales of common stock or other securities acquired in such open market transactions; |
| Ÿ | the sale of shares to us in connection with the repurchase of shares of common stock issued pursuant to our 2006 Plan or 2013 Plan or pursuant to the agreements pursuant to which such shares were used; |
| Ÿ | if the security holder is an individual, the transfer of shares of common stock or any security convertible into or exercisable or exchangeable for common stock that occurs by operation of law, such as pursuant to a qualified domestic order or in connection with a divorce settlement, provided that the security holder uses its reasonable best efforts to cause the transferee to sign and deliver a lock-up agreement prior to such transfer; |
| Ÿ | the transfer of shares of common stock or any security convertible into or exercisable or exchangeable for common stock by a security holder pursuant to a bona fide third-party tender offer, merger, consolidation or other similar transaction made to all holders of our common stock involving a change of control of us, provided that in the event that the tender offer, merger, consolidation or other such transaction is not completed, such securities will continue to be subject to these restrictions; |
| Ÿ | the issuance by us of shares of our common stock upon the exercise of an option or the conversion or exchange of a security outstanding immediately prior to the completion of the offering; |
| Ÿ | the issuance by us of shares of our common stock or any securities convertible into, exchangeable for or that represent the right to receive shares of our common stock, in each case pursuant to the 2006 Plan or 2013 Plan; or |
| Ÿ | the entry into an agreement by us providing for the issuance of shares of our common stock or any security convertible into or exercisable for shares of our common stock, (i) in connection with the acquisition by us of the securities, business, property or other assets of another person or entity or pursuant to an employee benefit plan assumed by us in connection with such acquisition, and the issuance of any such securities pursuant to any such agreement, or (ii) in connection with joint ventures, commercial relationships or other strategic transactions; provided, however, that in the case of clauses (i) and (ii), the aggregate number of shares of our common stock that we may sell or issue or agree to sell or issue shall not exceed 10% of the shares of our common stock outstanding following the completion of this offering. |
139
Table of Contents
In the event that any of our officers or directors or a person or group (as such term is used in Section 13(d)(3) of the Exchange Act) that is the record or beneficial owner of one percent (aggregating ownership of affiliates) or more of our capital stock is granted an early release, then each person or group who has executed a lock-up agreement automatically will be granted an early release from its obligations under the lock-up agreement on a pro rata basis.
Prior to the offering, there has been no public market for the shares. The initial public offering price will be negotiated among the company and the representatives. Among the factors to be considered in determining the initial public offering price of the shares, in addition to prevailing market conditions, will be the company’s historical performance, estimates of the business potential and earnings prospects of the company, an assessment of the company’s management and the consideration of the above factors in relation to market valuation of companies in related businesses.
Our common stock has been approved for listing on the New York Stock Exchange under the symbol “CYNI.”
In connection with the offering, the underwriters may purchase and sell shares of common stock in the open market. These transactions may include short sales, stabilizing transactions and purchases to cover positions created by short sales. Short sales involve the sale by the underwriters of a greater number of shares than they are required to purchase in the offering, and a short position represents the amount of such sales that have not been covered by subsequent purchases. A “covered short position” is a short position that is not greater than the amount of additional shares for which the underwriters’ option described above may be exercised. The underwriters may cover any covered short position by either exercising their option to purchase additional shares or purchasing shares in the open market. In determining the source of shares to cover the covered short position, the underwriters will consider, among other things, the price of shares available for purchase in the open market as compared to the price at which they may purchase additional shares pursuant to the option described above. “Naked” short sales are any short sales that create a short position greater than the amount of additional shares for which the option described above may be exercised. The underwriters must cover any such naked short position by purchasing shares in the open market. A naked short position is more likely to be created if the underwriters are concerned that there may be downward pressure on the price of the common stock in the open market after pricing that could adversely affect investors who purchase in the offering. Stabilizing transactions consist of various bids for or purchases of common stock made by the underwriters in the open market prior to the completion of the offering.
The underwriters may also impose a penalty bid. This occurs when a particular underwriter repays to the underwriters a portion of the underwriting discount received by it because the representatives have repurchased shares sold by or for the account of such underwriter in stabilizing or short covering transactions.
Purchases to cover a short position and stabilizing transactions, as well as other purchases by the underwriters for their own accounts, may have the effect of preventing or retarding a decline in the market price of the company’s stock, and together with the imposition of the penalty bid, may stabilize, maintain or otherwise affect the market price of the common stock. As a result, the price of the common stock may be higher than the price that otherwise might exist in the open market. The underwriters are not required to engage in these activities and may end any of these activities at any time. These transactions may be effected on the New York Stock Exchange, in the over-the-counter market or otherwise.
The underwriters do not expect sales to discretionary accounts to exceed five percent of the total number of shares offered.
140
Table of Contents
The company estimates that its share of the total expenses of the offering, excluding underwriting discounts and commissions, will be approximately $3.6 million. We have agreed to reimburse the underwriters for certain expenses in an amount up to $25,000.
The company will agree to indemnify the several underwriters against certain liabilities, including liabilities under the Securities Act of 1933.
The underwriters and their respective affiliates are full service financial institutions engaged in various activities, which may include sales and trading, commercial and investment banking, advisory, investment management, investment research, principal investment, hedging, market making, brokerage and other financial and non-financial activities and services. Certain of the underwriters and their respective affiliates may in the future provide a variety of these services to the issuer and to persons and entities with relationships with the issuer, for which they will receive customary fees and expenses.
In the ordinary course of their various business activities, the underwriters and their respective affiliates, officers, directors and employees may purchase, sell or hold a broad array of investments and actively trade securities, derivatives, loans, commodities, currencies, credit default swaps and other financial instruments for their own account and for the accounts of their customers, and such investment and trading activities may involve or relate to assets, securities and/or instruments of the issuer (directly, as collateral securing other obligations or otherwise) and/or persons and entities with relationships with the issuer. The underwriters and their respective affiliates may also communicate independent investment recommendations, market color or trading ideas and/or publish or express independent research views in respect of such assets, securities or instruments and may at any time hold, or recommend to clients that they should acquire, long and/or short positions in such assets, securities and instruments.
Notice to Prospective Investors in the European Economic Area
In relation to each Member State of the European Economic Area which has implemented the Prospectus Directive (each, a “Relevant Member State”) with effect from and including the date on which the Prospectus Directive is implemented in that Relevant Member State (the “Relevant Implementation Date”) an offer of the shares may not be made to the public in that Relevant Member State other than:
| (a) | to any legal entity which is a qualified investor as defined in the Prospectus Directive; |
| (b) | to fewer than 100 or, if the Relevant Member State has implemented the relevant provision of the 2010 PD Amending Directive, 150, natural or legal persons (other than qualified investors as defined in the Prospectus Directive), as permitted under the Prospectus Directive, subject to obtaining the prior consent of the representatives of the several underwriters; or |
| (c) | in any other circumstances falling within Article 3(2) of the Prospectus Directive, |
provided that no such offer of shares shall require us or any underwriter to publish a prospectus pursuant to Article 3 of the Prospectus Directive or supplement a prospectus pursuant to Article 16 of the Prospectus Directive.
For the purposes of this provision, the expression an “offer of the shares to the public” in relation to any shares in any Relevant Member State means the communication in any form and by any means of sufficient information on the terms of the offer and the shares to be offered so as to enable an investor to decide to purchase or subscribe the shares, as the same may be varied in that Member State by any measure implementing the Prospectus Directive in that Member State. The expression “Prospectus Directive” means Directive 2003/71/EC (and amendments thereto, including the 2010 PD
141
Table of Contents
Amending Directive to the extent implemented in the Relevant Member State) and includes any relevant implementing measure in each Relevant Member State and the expression “2010 PD Amending Directive” means Directive 2010/73/EU.
The sellers of shares have not authorized and do not authorize the making of any offer of the shares through any financial intermediary, other than offers made by the underwriters with a view to underwriting the shares as contemplated in this prospectus supplement and the accompanying prospectus. Accordingly, no purchaser of shares, other than the underwriters, is authorized to make any further offer of shares on behalf of the sellers or the underwriters.
Notice to Prospective Investors in the United Kingdom
Each underwriter has represented and agreed that, in connection with the distribution of the shares,
| (a) | it has complied and will comply with all applicable provisions of the Financial Services and Markets Act 2000 (“FSMA”) with respect to anything done by it in relation to the shares in, from or otherwise involving the United Kingdom; and |
| (b) | it will only communicate or cause to be communicated an invitation or inducement to engage in investment activity (within the meaning of Section 21 of the FSMA) received by it in connection with the issue and sale of such shares in circumstances in which Section 21(1) of the FSMA does not apply to us. |
Notice to Prospective Investors in Hong Kong
The shares may not be offered or sold by means of any document other than (i) in circumstances which do not constitute an offer to the public within the meaning of the Companies Ordinance (Cap.32, Laws of Hong Kong), or (ii) to “professional investors” within the meaning of the Securities and Futures Ordinance (Cap.571, Laws of Hong Kong) and any rules made thereunder, or (iii) in other circumstances which do not result in the document being a “prospectus” within the meaning of the Companies Ordinance (Cap.32, Laws of Hong Kong), and no advertisement, invitation or document relating to the shares may be issued or may be in the possession of any person for the purpose of issue (in each case whether in Hong Kong or elsewhere), which is directed at, or the contents of which are likely to be accessed or read by, the public in Hong Kong (except if permitted to do so under the laws of Hong Kong) other than with respect to shares which are or are intended to be disposed of only to persons outside Hong Kong or only to “professional investors” within the meaning of the Securities and Futures Ordinance (Cap. 571, Laws of Hong Kong) and any rules made thereunder.
Notice to Prospective Investors in Singapore
This prospectus has not been registered as a prospectus with the Monetary Authority of Singapore. Accordingly, this prospectus and any other document or material in connection with the offer or sale, or invitation for subscription or purchase, of the shares may not be circulated or distributed, nor may the shares be offered or sold, or be made the subject of an invitation for subscription or purchase, whether directly or indirectly, to persons in Singapore other than (i) to an institutional investor under Section 274 of the Securities and Futures Act, Chapter 289 of Singapore (the “SFA”), (ii) to a relevant person, or any person pursuant to Section 275(1A), and in accordance with the conditions, specified in Section 275 of the SFA or (iii) otherwise pursuant to, and in accordance with the conditions of, any other applicable provision of the SFA.
Where the shares are subscribed or purchased under Section 275 by a relevant person which is: (a) a corporation (which is not an accredited investor) the sole business of which is to hold investments
142
Table of Contents
and the entire share capital of which is owned by one or more individuals, each of whom is an accredited investor; or (b) a trust (where the trustee is not an accredited investor) whose sole purpose is to hold investments and each beneficiary is an accredited investor, shares, debentures and units of shares and debentures of that corporation or the beneficiaries’ rights and interest in that trust shall not be transferable for 6 months after that corporation or that trust has acquired the shares under Section 275 except: (1) to an institutional investor under Section 274 of the SFA or to a relevant person, or any person pursuant to Section 275(1A), and in accordance with the conditions, specified in Section 275 of the SFA; (2) where no consideration is given for the transfer; or (3) by operation of law.
Notice to Prospective Investors in Japan
The securities have not been and will not be registered under the Financial Instruments and Exchange Law of Japan (the Financial Instruments and Exchange Law) and the underwriters will not offer or sell any securities, directly or indirectly, in Japan or to, or for the benefit of, any resident of Japan (which term as used herein means any person resident in Japan, including any corporation or other entity organized under the laws of Japan), or to others for re-offering or resale, directly or indirectly, in Japan or to a resident of Japan, except pursuant to an exemption from the registration requirements of, and otherwise in compliance with, the Financial Instruments and Exchange Law and any other applicable laws, regulations and ministerial guidelines of Japan.
143
Table of Contents
Wilson Sonsini Goodrich & Rosati, Professional Corporation, Palo Alto, California, which has acted as our counsel in connection with this offering, will pass upon the validity of the shares of common stock being offered by this prospectus. The underwriters are being represented by Cooley LLP, San Francisco, California, in connection with this offering. Cooley LLP has in the past provided, and continues to provide, legal services to us. Certain members of, and investment partnerships comprised of members of, and persons associated with, Cooley LLP own an interest representing less than 0.05% of our common stock.
The consolidated financial statements of Cyan, Inc. at December 31, 2011 and 2012, and for each of the three years in the period ended December 31, 2012, appearing in this prospectus and registration statement have been audited by Ernst & Young LLP, independent registered public accounting firm, as set forth in their report thereon appearing elsewhere herein, and are included in reliance upon such report given on the authority of such firm as experts in accounting and auditing.
WHERE YOU CAN FIND ADDITIONAL INFORMATION
We have filed with the SEC a registration statement on Form S-1 under the Securities Act with respect to the shares of common stock offered by this prospectus. This prospectus, which constitutes a part of the registration statement, does not contain all of the information set forth in the registration statement, some of which is contained in exhibits to the registration statement as permitted by the rules and regulations of the SEC. For further information with respect to us and our common stock, we refer you to the registration statement, including the exhibits filed as a part of the registration statement. Statements contained in this prospectus concerning the contents of any contract or any other document is not necessarily complete. If a contract or document has been filed as an exhibit to the registration statement, please see the copy of the contract or document that has been filed. Each statement is this prospectus relating to a contract or document filed as an exhibit is qualified in all respects by the filed exhibit. You may obtain copies of this information by mail from the Public Reference Section of the SEC, 100 F Street, N.E., Room 1580, Washington, D.C. 20549, at prescribed rates. You may obtain information on the operation of the public reference rooms by calling the SEC at 1-800-SEC-0330. The SEC also maintains an Internet website that contains reports, proxy statements and other information about issuers, like us, that file electronically with the SEC. The address of that website is www.sec.gov.
As a result of this offering, we will become subject to the information and reporting requirements of the Securities Exchange Act of 1934 and, in accordance with this law, will file periodic reports, proxy statements and other information with the SEC. These periodic reports, proxy statements and other information will be available for inspection and copying at the SEC’s public reference facilities and the website of the SEC referred to above. We also maintain a website at www.cyaninc.com. Upon completion of this offering, you may access these materials free of charge as soon as reasonably practicable after they are electronically filed with, or furnished to, the SEC. Information contained on our website is not a part of this prospectus and the inclusion of our website address in this prospectus is an inactive textual reference only.
144
Table of Contents
CYAN, INC.
INDEX TO CONSOLIDATED FINANCIAL STATEMENTS
| F-2 | ||||
| F-3 | ||||
| F-4 | ||||
| F-5 | ||||
| Consolidated Statements of Redeemable Convertible Preferred Stock and Stockholders’ Deficit |
F-6 | |||
| F-7 | ||||
| F-8 | ||||
F-1
Table of Contents
REPORT OF INDEPENDENT REGISTERED PUBLIC ACCOUNTING FIRM
To the Board of Directors and Stockholders of
Cyan, Inc.
We have audited the accompanying consolidated balance sheets of Cyan, Inc. as of December 31, 2011 and 2012, and the related consolidated statements of operations, statements of comprehensive loss, statements of redeemable convertible preferred stock and stockholders’ deficit, and cash flows for each of the three years in the period ended December 31, 2012. These financial statements are the responsibility of the Company’s management. Our responsibility is to express an opinion on the financial statements based on our audits.
We conducted our audits in accordance with the standards of the Public Company Accounting Oversight Board (United States). Those standards require that we plan and perform the audit to obtain reasonable assurance about whether the financial statements are free of material misstatement. We were not engaged to perform an audit of the Company’s internal control over financial reporting. Our audits included consideration of internal control over financial reporting as a basis for designing audit procedures that are appropriate in the circumstances, but not for the purpose of expressing an opinion on the effectiveness of the Company’s internal control over financial reporting. Accordingly, we express no such opinion. An audit also includes examining, on a test basis, evidence supporting the amounts and disclosures in the financial statements, assessing the accounting principles used and significant estimates made by management, and evaluating the overall financial statement presentation. We believe that our audits provide a reasonable basis for our opinion.
In our opinion, the financial statements referred to above present fairly, in all material respects, the consolidated financial position of Cyan, Inc. as of December 31, 2011 and 2012, and the consolidated results of its operations and cash flows for each of the three years in the period ended December 31, 2012, in conformity with U.S. generally accepted accounting principles.
/s/ Ernst & Young LLP
Redwood City, California
February 19, 2013
F-2
Table of Contents
Consolidated Balance Sheets
(in thousands, except share and per share amounts)
| December 31, | March 31, 2013 |
Pro Forma Stockholders’ Equity March 31, 2013 |
||||||||||||||
| 2011 | 2012 | |||||||||||||||
| (unaudited) | ||||||||||||||||
| Assets |
||||||||||||||||
| Current assets: |
||||||||||||||||
| Cash and cash equivalents |
$ | 25,740 | $ | 20,221 | $ | 14,007 | ||||||||||
| Accounts receivable, net |
6,526 | 19,200 | 17,248 | |||||||||||||
| Inventories |
4,684 | 14,049 | 12,738 | |||||||||||||
| Deferred costs |
2,304 | 8,228 | 8,435 | |||||||||||||
| Prepaid expenses and other |
453 | 930 | 854 | |||||||||||||
|
|
|
|
|
|
|
|||||||||||
| Total current assets |
39,707 | 62,628 | 53,282 | |||||||||||||
| Property and equipment, net |
3,791 | 6,485 | 7,480 | |||||||||||||
| Other assets |
30 | 1,676 | 2,307 | |||||||||||||
|
|
|
|
|
|
|
|||||||||||
| Total assets |
$ | 43,528 | $ | 70,789 | $ | 63,069 | ||||||||||
|
|
|
|
|
|
|
|||||||||||
| Liabilities, redeemable convertible preferred stock, and stockholders’ equity (deficit) |
||||||||||||||||
| Current liabilities: |
||||||||||||||||
| Accounts payable |
$ | 4,473 | $ | 11,842 | $ | 11,307 | ||||||||||
| Accrued expenses |
1,852 | 3,636 | 3,031 | |||||||||||||
| Accrued compensation |
1,406 | 3,743 | 3,323 | |||||||||||||
| Revolving loan |
— | 7,563 | 7,563 | |||||||||||||
| Term loan |
45 | — | 396 | |||||||||||||
| Deferred revenue |
4,267 | 15,597 | 15,784 | |||||||||||||
| Preferred stock warrant liability |
900 | 6,254 | 8,252 | $ | — | |||||||||||
| Deferred rent |
61 | 74 | 66 | |||||||||||||
|
|
|
|
|
|
|
|||||||||||
| Total current liabilities |
13,004 | 48,709 | 49,722 | |||||||||||||
| Term loan |
— | 5,000 | 4,604 | |||||||||||||
| Deferred revenue |
952 | 1,820 | 1,728 | |||||||||||||
| Deferred rent |
114 | 182 | 175 | |||||||||||||
|
|
|
|
|
|
|
|||||||||||
| Total liabilities |
14,070 | 55,711 | 56,229 | |||||||||||||
| Commitments and contingencies (Note 6) |
||||||||||||||||
| Redeemable convertible preferred stock issuable in series, $0.0001 par value: 35,031,602 shares authorized as of December 31, 2011 and 2012 and March 31, 2013 (unaudited); 33,897,005 shares issued and outstanding as of December 31, 2011 and 2012 and March 31, 2013 (unaudited); aggregate liquidation preference of $98,751 as of December 31, 2011 and 2012 and March 31, 2013 (unaudited); no shares authorized, issued and outstanding pro forma (unaudited) |
98,133 | 98,133 | 98,133 | $ | — | |||||||||||
| Stockholders’ equity (deficit): |
||||||||||||||||
| Common stock, $0.0001 par value: 50,000,000 shares authorized as of December 31, 2011 and 2012 and March 31, 2013 (unaudited); 2,440,771, 2,575,220, 2,634,313 and 36,531,318 shares issued and outstanding as of December 31, 2011 and 2012 and March 31, 2013 (unaudited) and pro forma (unaudited) |
— | — | — | 4 | ||||||||||||
| Additional paid-in capital |
1,301 | 3,514 | 4,639 | 111,020 | ||||||||||||
| Accumulated other comprehensive loss |
(27 | ) | (19 | ) | (32 | ) | (32 | ) | ||||||||
| Accumulated deficit |
(69,949 | ) | (86,550 | ) | (95,900 | ) | (95,900 | ) | ||||||||
|
|
|
|
|
|
|
|
|
|||||||||
| Total stockholders’ equity (deficit) |
(68,675 | ) | (83,055 | ) | (91,293 | ) | $ | 15,092 | ||||||||
|
|
|
|
|
|
|
|
|
|||||||||
| Total liabilities, redeemable convertible preferred stock, and stockholders’ equity (deficit) |
$ | 43,528 | $ | 70,789 | $ | 63,069 | ||||||||||
|
|
|
|
|
|
|
|||||||||||
See notes to consolidated financial statements.
F-3
Table of Contents
Consolidated Statements of Operations
(in thousands, except per share amounts)
| Year Ended December 31, | Three Months Ended March 31, |
|||||||||||||||||||
| 2010 | 2011 | 2012 | 2012 | 2013 | ||||||||||||||||
| (unaudited) | ||||||||||||||||||||
| Revenue |
$ | 23,484 | $ | 40,421 | $ | 95,872 | $ | 14,187 | $ | 26,319 | ||||||||||
| Cost of revenue |
18,263 | 27,074 | 57,315 | 8,467 | 15,402 | |||||||||||||||
|
|
|
|
|
|
|
|
|
|
|
|||||||||||
| Gross profit |
5,221 | 13,347 | 38,557 | 5,720 | 10,917 | |||||||||||||||
| Operating expenses: |
||||||||||||||||||||
| Research and development |
10,430 | 12,986 | 18,447 | 3,552 | 7,239 | |||||||||||||||
| Sales and marketing |
7,919 | 12,825 | 25,243 | 4,774 | 8,017 | |||||||||||||||
| General and administrative |
2,380 | 3,310 | 6,055 | 910 | 2,863 | |||||||||||||||
|
|
|
|
|
|
|
|
|
|
|
|||||||||||
| Total operating expenses |
20,729 | 29,121 | 49,745 | 9,236 | 18,119 | |||||||||||||||
| Loss from operations |
(15,508 | ) | (15,774 | ) | (11,188 | ) | (3,516 | ) | (7,202 | ) | ||||||||||
| Interest expense |
(429 | ) | (419 | ) | (33 | ) |
|
(20 |
) |
|
(126 |
) | ||||||||
| Other income (expense), net |
(406 | ) | 322 | (5,340 | ) |
|
(356 |
) |
|
(2,001 |
) | |||||||||
|
|
|
|
|
|
|
|
|
|
|
|||||||||||
| Total other income (expense), net |
(835 | ) | (97 | ) | (5,373 | ) |
|
(376 |
) |
|
(2,127 |
) | ||||||||
|
|
|
|
|
|
|
|
|
|
|
|||||||||||
| Loss before provision for income taxes |
(16,343 | ) | (15,871 | ) | (16,561 | ) |
|
(3,892
|
)
|
(9,329 | ) | |||||||||
| Provision for income taxes |
1 | 14 | 40 |
|
8 |
|
|
21 |
| |||||||||||
|
|
|
|
|
|
|
|
|
|
|
|||||||||||
| Net loss |
$ | (16,344 | ) | $ | (15,885 | ) | $ | (16,601 | ) |
$ |
(3,900 |
) |
$ |
(9,350 |
) | |||||
|
|
|
|
|
|
|
|
|
|
|
|||||||||||
| Basic and diluted net loss per share |
$ | (7.54 | ) | $ | (6.63 | ) | $ | (6.60 | ) |
$ |
(1.60 |
) |
$ |
(3.61 |
) | |||||
|
|
|
|
|
|
|
|
|
|
|
|||||||||||
| Weighted-average number of shares used in computing basic and diluted net loss per share |
2,167 | 2,396 | 2,515 | 2,441 |
|
2,593 |
| |||||||||||||
|
|
|
|
|
|
|
|
|
|
|
|||||||||||
| Pro forma basic and diluted net loss per share (unaudited) |
$ | (0.31 | ) |
$ |
(0.20 |
) | ||||||||||||||
|
|
|
|
|
|||||||||||||||||
| Weighted-average number of shares used in computing pro forma basic and diluted net loss per share (unaudited) |
36,412 | 36,490 | ||||||||||||||||||
|
|
|
|
|
|||||||||||||||||
See notes to consolidated financial statements.
F-4
Table of Contents
CYAN, INC.
Consolidated Statements of Comprehensive Loss
(in thousands)
| Year Ended December 31, | Three Months Ended March 31, |
|||||||||||||||||||
| 2010 | 2011 | 2012 | 2012 | 2013 | ||||||||||||||||
| (unaudited) | ||||||||||||||||||||
| Net loss |
$ | (16,344 | ) | $ | (15,885 | ) | $ | (16,601 | ) | $ | (3,900 | ) | $ | (9,350 | ) | |||||
| Other comprehensive income (loss): |
||||||||||||||||||||
| Foreign currency translation adjustments |
— | (27 | ) | 8 | 2 | (13 | ) | |||||||||||||
|
|
|
|
|
|
|
|
|
|
|
|||||||||||
| Other comprehensive income (loss) |
— | (27 | ) | 8 | 2 | (13 | ) | |||||||||||||
|
|
|
|
|
|
|
|
|
|
|
|||||||||||
| Comprehensive loss |
$ | (16,344 | ) | $ | (15,912 | ) | $ | (16,593 | ) | $ | (3,898 | ) | $ | (9,363 | ) | |||||
|
|
|
|
|
|
|
|
|
|
|
|||||||||||
See notes to consolidated financial statements.
F-5
Table of Contents
Consolidated Statements of Redeemable Convertible Preferred Stock and Stockholders’ Deficit
(in thousands, except share amounts)
| Redeemable Convertible Preferred Stock |
Common Stock | Additional Paid-In Capital |
Accumulated Other Comprehensive Loss |
Accumulated Deficit |
Total Stockholders’ Deficit |
|||||||||||||||||||||||||||||
| Shares | Amount | Shares | Amount | |||||||||||||||||||||||||||||||
| Balances at December 31, 2009 |
25,021,259 | $ | 57,793 | 2,107,833 | $ | — | $ | 212 | $ | — | $ | (37,720 | ) | $ | (37,508 | ) | ||||||||||||||||||
| Issuance of Series E redeemable convertible preferred stock, net of issuance costs of $88 |
6,626,765 | 29,912 | — | — | — | — | — | — | ||||||||||||||||||||||||||
| Issuance of common stock upon exercise of stock options |
— | — | 208,208 | — | 79 | — | — | 79 | ||||||||||||||||||||||||||
| Stock-based compensation |
— | — | — | — | 195 | — | — | 195 | ||||||||||||||||||||||||||
| Net loss |
— | — | — | — | — | — | (16,344 | ) | (16,344 | ) | ||||||||||||||||||||||||
|
|
|
|
|
|
|
|
|
|
|
|
|
|
|
|
|
|||||||||||||||||||
| Balances at December 31, 2010 |
31,648,024 | 87,705 | 2,316,041 | — | 486 | — | (54,064 | ) | (53,578 | ) | ||||||||||||||||||||||||
| Issuance of Series E redeemable convertible preferred stock |
110,446 | 500 | — | — | — | — | — | — | ||||||||||||||||||||||||||
| Issuance of Series F redeemable convertible preferred stock, net of issuance costs of $71 |
2,138,535 | 9,928 | — | — | — | — | — | — | ||||||||||||||||||||||||||
| Issuance of common stock upon exercise of stock options |
— | — | 124,730 | — | 50 | — | — | 50 | ||||||||||||||||||||||||||
| Stock-based compensation |
— | — | — | — | 765 | — | — | 765 | ||||||||||||||||||||||||||
| Foreign currency translation adjustment |
— | — | — | — | — | (27 | ) | — | (27 | ) | ||||||||||||||||||||||||
| Net loss |
— | — | — | — | — | — | (15,885 | ) | (15,885 | ) | ||||||||||||||||||||||||
|
|
|
|
|
|
|
|
|
|
|
|
|
|
|
|
|
|||||||||||||||||||
| Balances at December 31, 2011 |
33,897,005 | 98,133 | 2,440,771 | — | 1,301 | (27 | ) | (69,949 | ) | (68,675 | ) | |||||||||||||||||||||||
| Issuance of common stock upon exercise of stock options |
— | — | 134,449 | — | 116 | — | — | 116 | ||||||||||||||||||||||||||
| Stock-based compensation |
— | — | — | — | 2,097 | — | — | 2,097 | ||||||||||||||||||||||||||
| Foreign currency translation adjustment |
— | — | — | — | — | 8 | — | 8 | ||||||||||||||||||||||||||
| Net loss |
— | — | — | — | — | — | (16,601 | ) | (16,601 | ) | ||||||||||||||||||||||||
|
|
|
|
|
|
|
|
|
|
|
|
|
|
|
|
|
|||||||||||||||||||
| Balances at December 31, 2012 |
33,897,005 | 98,133 | 2,575,220 | — | 3,514 | (19 | ) | (86,550 | ) | (83,055 | ) | |||||||||||||||||||||||
| Issuance of common stock upon exercise of stock options (unaudited) |
— | — | 59,093 | — | 63 | — | — | 63 | ||||||||||||||||||||||||||
| Stock-based compensation (unaudited) |
— | — | — | — | 1,062 | — | — | 1,062 | ||||||||||||||||||||||||||
| Foreign currency translation adjustment (unaudited) |
— | — | — | — | — | (13 | ) | — | (13 | ) | ||||||||||||||||||||||||
| Net loss (unaudited) |
— | — | — | — | — | — | (9,350 | ) | (9,350 | ) | ||||||||||||||||||||||||
|
|
|
|
|
|
|
|
|
|
|
|
|
|
|
|
|
|||||||||||||||||||
| Balances at March 31, 2013 (unaudited) |
33,897,005 | $ | 98,133 | 2,634,313 | $ | — | $ | 4,639 | $ | (32 | ) | $ | (95,900 | ) | $ | (91,293 | ) | |||||||||||||||||
|
|
|
|
|
|
|
|
|
|
|
|
|
|
|
|
|
|||||||||||||||||||
See notes to consolidated financial statements.
F-6
Table of Contents
Consolidated Statements of Cash Flows
(in thousands)
| Year Ended December 31 | Three Months Ended March 31, |
|||||||||||||||||||
| 2010 | 2011 | 2012 | 2012 | 2013 | ||||||||||||||||
| (unaudited) | ||||||||||||||||||||
| Operating activities | ||||||||||||||||||||
| Net loss |
$ | (16,344 | ) | $ | (15,885 | ) | $ | (16,601 | ) | $ | (3,900 | ) | $ | (9,350 | ) | |||||
| Adjustments to reconcile net loss to net cash used in operating activities: |
||||||||||||||||||||
| Depreciation and amortization |
794 | 1,358 | 1,801 | 400 | 575 | |||||||||||||||
| Loss on disposal of assets |
23 | — | — | — | — | |||||||||||||||
| Noncash interest expense |
241 | 20 | — | — | — | |||||||||||||||
| Stock-based compensation |
195 | 765 | 2,097 | 252 | 1,062 | |||||||||||||||
| Change in fair value for warrants |
412 | (313 | ) | 5,354 | 362 | 1,998 | ||||||||||||||
| Changes in operating assets and liabilities: |
||||||||||||||||||||
| Accounts receivable |
(1,880 | ) | (3,514 | ) | (12,674 | ) | (1,851 | ) | 1,952 | |||||||||||
| Inventories |
443 | (1,914 | ) | (8,162 | ) | (185 | ) | 1,311 | ||||||||||||
| Deferred costs |
— | (2,304 | ) | (5,924 | ) | (1,387 | ) | (207 | ) | |||||||||||
| Prepaid expenses and other current assets |
(196 | ) | (109 | ) | (477 | ) | (149 | ) | 51 | |||||||||||
| Other assets |
— | 39 | (109 | ) | 14 | — | ||||||||||||||
| Accounts payable |
1,669 | 1,863 | 6,483 | 2,509 | (680 | ) | ||||||||||||||
| Accrued liabilities |
430 | 1,027 | 1,133 | (201 | ) | (22 | ) | |||||||||||||
| Customer deposits |
(890 | ) | — | — | — | — | ||||||||||||||
| Accrued compensation |
408 | 547 | 2,337 | 478 | (420 | ) | ||||||||||||||
| Deferred revenue |
64 | 5,046 | 12,198 | 2,841 | 95 | |||||||||||||||
| Deferred rent |
(19 | ) | (49 | ) | 81 | (13 | ) | (15 | ) | |||||||||||
|
|
|
|
|
|
|
|
|
|
|
|||||||||||
| Net cash used in operating activities |
(14,650 | ) | (13,423 | ) | (12,463 | ) | (830 | ) | (3,650 | ) | ||||||||||
|
|
|
|
|
|
|
|
|
|
|
|||||||||||
| Investing activities |
||||||||||||||||||||
| Purchases of property and equipment |
(1,289 | ) | (2,772 | ) | (5,698 | ) | (815 | ) | (962 | ) | ||||||||||
|
|
|
|
|
|
|
|
|
|
|
|||||||||||
| Net cash used in investing activities |
(1,289 | ) | (2,772 | ) | (5,698 | ) | (815 | ) | (962 | ) | ||||||||||
|
|
|
|
|
|
|
|
|
|
|
|||||||||||
| Financing activities |
||||||||||||||||||||
| Net proceeds from the issuance of redeemable convertible preferred stock |
29,912 | 10,428 | — | — | — | |||||||||||||||
| Proceeds from issuance of common stock, net of repurchase |
79 | 50 | 116 | (2 | ) | 63 | ||||||||||||||
| Borrowings under revolving loan facility |
— | — | |
7,563 |
|
— | — | |||||||||||||
| Borrowings under term loan facility |
— | — | |
5,000 |
|
— | — | |||||||||||||
| Repayments of borrowings under notes payable |
(3,185 | ) | (2,458 | ) | (45 | ) | (45 | ) | — | |||||||||||
| Payments in preparation for initial public offering |
— | — | — | — | (1,652 | ) | ||||||||||||||
| Repayments on sale-leaseback |
(161 | ) | (132 | ) | — | — | — | |||||||||||||
|
|
|
|
|
|
|
|
|
|
|
|||||||||||
| Net cash provided by financing activities |
26,645 | 7,888 | 12,634 | (47 | ) | (1,589 | ) | |||||||||||||
|
|
|
|
|
|
|
|
|
|
|
|||||||||||
| Effect of exchange rate changes on cash and cash equivalents |
— | (27 | ) | 8 | 2 | (13 | ) | |||||||||||||
|
|
|
|
|
|
|
|
|
|
|
|||||||||||
| Net increase (decrease) in cash and cash equivalents |
10,706 | (8,334 | ) | (5,519 | ) | (1,690 | ) | (6,214 | ) | |||||||||||
| Cash and cash equivalents at beginning of year |
23,368 | 34,074 | 25,740 | 25,740 | 20,221 | |||||||||||||||
|
|
|
|
|
|
|
|
|
|
|
|||||||||||
| Cash and cash equivalents at end of year |
$ | 34,074 | $ | 25,740 | $ | 20,221 | $ | 24,050 | $ | 14,007 | ||||||||||
|
|
|
|
|
|
|
|
|
|
|
|||||||||||
| Supplemental disclosures of cash flow information |
||||||||||||||||||||
| Cash paid for interest |
$ | 187 | $ | 399 | $ | 43 | $ | 20 | $ | 98 | ||||||||||
|
|
|
|
|
|
|
|
|
|
|
|||||||||||
| Noncash Investing and Financing |
||||||||||||||||||||
| Noncash transfer of inventory to property and equipment |
$ | — | $ | 393 | $ | 1,203 | $ | 145 | $ | 356 | ||||||||||
|
|
|
|
|
|
|
|
|
|
|
|||||||||||
| Noncash interest expense in relation to the accrual of end-of-term note payments |
$ | 149 | $ | 20 | $ | — | $ | — | $ | — | ||||||||||
|
|
|
|
|
|
|
|
|
|
|
|||||||||||
| Deferred offering costs in accounts payable and accrued liabilities |
$ | — | $ | — | $ | 1,537 | $ | — | $ | 490 | ||||||||||
|
|
|
|
|
|
|
|
|
|
|
|||||||||||
| Property and equipment included in accounts payable |
$ | — | $ | — | $ | — | $ | — | $ | 608 | ||||||||||
|
|
|
|
|
|
|
|
|
|
|
|||||||||||
See notes to consolidated financial statements.
F-7
Table of Contents
NOTES TO CONSOLIDATED FINANCIAL STATEMENTS
(Amounts as of March 31, 2013 and for the three months ended
March 31, 2012 and 2013 are unaudited)
| 1. | Organization and Significant Accounting Policies |
Description of the Business—Cyan, Inc. was incorporated on October 25, 2006, in the state of Delaware and its principal executive offices are located in Petaluma, California. The Company has pioneered innovative, carrier-grade networking solutions that transform disparate and inefficient legacy networks into open, high-performance networks. The Company’s solutions include high-capacity, multi-layer switching and transport platforms as well as a carrier-grade software-defined networking platform and applications. The Company’s solutions enable its customers to virtualize their networks, accelerate service delivery and increase scalability and performance while reducing costs. The Company designed its solutions to provide a variety of existing and emerging premium applications including business Ethernet, wireless backhaul, broadband backhaul and cloud connectivity. The Company’s customers range from service providers to high-performance data center and large, private network operators.
Principles of Consolidation—The accompanying consolidated financial statements include the accounts of Cyan, Inc. and its wholly owned subsidiaries, Cyan EMEA Ltd., Cyan International Holdings, C.V. and Cyan International B.V. (collectively, Cyan or the Company). All intercompany balances and transactions have been eliminated in consolidation.
Fiscal Periods—During 2011, the Company operated on 13-week fiscal quarters ending on the last Sunday of each interim fiscal period. For presentation purposes only, the 2011 interim fiscal periods are shown as ending on the last day of the calendar month of the respective fiscal period. Commencing in 2012, the Company operates on fiscal periods ending on the last day of the calendar month of the respective fiscal period.
Use of Estimates—The preparation of financial statements in conformity with accounting principles generally accepted in the United States (U.S. GAAP) requires management to make estimates and assumptions that affect the reported amounts of assets and liabilities and disclosure of contingent assets and liabilities at the date of the financial statements and the reported amounts of expenses during the reporting period. For the Company, these estimates include, but are not limited to, allowances for credit losses, excess and obsolete inventory, allowances for obligations to its contract manufacturer, useful lives assigned to long-lived assets, the valuation of common and redeemable convertible preferred stock and related warrants and options, warranty costs and contingencies. Actual results could differ from those estimates, and such differences could be material to the Company’s consolidated financial position and results of operations.
Unaudited Interim Financial Information—The accompanying consolidated balance sheet as of March 31, 2013, the consolidated statements of operations, comprehensive loss and cash flows for the three months ended March 31, 2012 and 2013, and the consolidated statement of redeemable convertible preferred stock and stockholders’ deficit for the three months ended March 31, 2013 are unaudited. The unaudited interim financial statements have been prepared on the same basis as the annual consolidated financial statements and, in the opinion of management, reflect all adjustments, which include only normal recurring adjustments, necessary to present fairly the Company’s financial position as of March 31, 2013 and results of operations and cash flows for the three months ended March 31, 2012 and 2013. The financial data and the other information disclosed in these notes to the consolidated financial statements related to these three-month periods are unaudited. The results for the three months ended March 31, 2012 and 2013 are not necessarily indicative of the results to be expected for the year ending December 31, 2013 or any other period.
F-8
Table of Contents
Unaudited Pro Forma Stockholders’ Equity—Upon the consummation of the initial public offering contemplated by the Company, all of the outstanding shares of redeemable convertible preferred stock will automatically convert into shares of common stock, assuming the Company raises at least $50 million. The March 31, 2013 unaudited pro forma consolidated balance sheet data has been prepared assuming the conversion of the redeemable convertible preferred stock outstanding into 33,897,005 shares of common stock as well as the reclassification of the preferred stock warrant liability to additional paid-in capital.
Cash and Cash Equivalents—The Company considers all highly liquid investments purchased with an original or remaining maturity of three months or less, when purchased, to be cash equivalents. At December 31, 2011 and 2012 and March 31, 2013, cash and cash equivalents consist principally of money market funds, the cost of which approximates fair value.
Credit Risk and Concentrations—Financial instruments that potentially subject the Company to significant concentrations of credit risk consist primarily of cash and cash equivalents and accounts receivable. Cash equivalents consist of money market funds that are invested through financial institutions in the United States. Such deposits may, at times, exceed federally insured limits. The Company has not experienced any losses in such accounts. Management believes that the financial institutions that hold the Company’s cash and cash equivalents are financially sound and, accordingly, minimal credit risk exists with respect to these cash and cash equivalents and investments.
Concentrations of credit risk with respect to trade receivables exist to the full extent of amounts presented in the financial statements. The Company performs ongoing credit evaluations of its customers and does not require collateral from its customers to secure accounts receivable. Accounts receivable are derived from shipments to customers located primarily in the United States.
The Company maintains an allowance for doubtful accounts for estimated losses resulting from the inability or unwillingness of its customers to make required payments. The Company records a specific allowance based on an analysis of individual past-due balances, including evaluations of its customers’ financial condition. Additionally, based on its historical write-offs and collections experience, the Company records an additional allowance based on a percentage of outstanding receivables. These valuations require significant judgment and are based on a variety of factors, including, but not limited to, current economic trends, payment history, and financial review of the customer. Actual collection losses may differ from management’s estimates, and such differences could be material to Company’s consolidated financial position and results of operations. The Company had no allowance for doubtful accounts recorded as of December 31, 2011 and 2012 and a $275,000 allowance for doubtful accounts recorded as of March 31, 2013.
The Company depends on its contract manufacturer for its finished goods inventory. The Company operates under a manufacturing services agreement with its contract manufacturer pursuant to which the Company is to provide a rolling quarterly forecast indicating the Company’s monthly production requirements. While the Company seeks to maintain sufficient inventory on hand, the Company’s business and results of operations could be adversely affected by a stoppage or delay in receiving such products, the receipt of defective parts, an increase in the price of such products, or the Company’s inability to obtain lower prices from its contract manufacturer and suppliers in response to competitive pressures.
Inventories—Inventories consisting of finished goods purchased from the contract manufacturer are stated at the lower of cost or market value, with cost being determined using standard cost, which approximates actual cost, on a first-in, first-out basis. The Company regularly monitors inventory quantities on hand and on order and records write-downs as a component of cost of revenue for excess and obsolete inventories based on the Company’s estimate of the demand for its products, potential obsolescence of technology, product life cycles, and whether pricing trends or forecasts indicate that the carrying value of inventory exceeds its estimated selling price. These factors are
F-9
Table of Contents
affected by market and economic conditions, technology changes, and new product introductions and require estimates that may include elements that are uncertain. Actual demand may differ from forecasted demand and may have a material effect on gross margins. If inventory is written down, a new cost basis will be established that cannot be increased in future periods.
Foreign Currency Translation—The Company’s revenue contracts are denominated in U.S. dollars, but certain operating expenses are incurred in various foreign currencies. The functional currency of the Company’s foreign operations is the local country’s currency. Consequently, expenses of operations outside the U.S. are translated into U.S. dollars using average exchange rates for the period reported, while assets and liabilities of operations outside the U.S. are translated into U.S. dollars using the end-of-period exchange rates.
Foreign currency translation adjustments not affecting net loss are included in stockholders’ deficit as a component of accumulated other comprehensive loss in the accompanying consolidated balance sheets.
The revaluation effect of foreign currency fluctuations is recorded in foreign currency gain (loss) and included in other income (expense) in the accompanying consolidated statements of operations.
Property and Equipment, Net—Property and equipment are stated at cost less accumulated depreciation and are depreciated on a straight-line basis over the estimated useful lives of the assets, generally three to five years. Leasehold improvements are amortized over the shorter of their estimated useful life or the related remaining lease term, generally five to 10 years. The costs of repairs and maintenance are expensed when incurred, while expenditures for refurbishments and improvements that significantly add to the productive capacity or extend the useful life of an asset are capitalized. When assets are retired or sold, the asset cost and related accumulated depreciation are eliminated, with any remaining gain or loss reflected in the accompanying consolidated statements of operations.
Impairment of Long-Lived Assets—The Company periodically evaluates long-lived assets for impairment whenever events or changes in circumstances indicate that a potential impairment may have occurred. If such events or changes in circumstances arise, the Company compares the carrying amount of the long-lived assets to the estimated future undiscounted cash flows expected to be generated by the long-lived assets. If the estimated aggregate, undiscounted cash flows are less than the carrying amount of the long-lived assets, an impairment charge, calculated as the amount by which the carrying amount of the asset exceeds the fair value of the assets, is recorded. Through March 31, 2013, no impairment losses have been identified.
Revenue Recognition—Revenue is recognized when all of the following criteria are met:
| Ÿ | Persuasive evidence of an arrangement exists. Customer purchase orders are generally used to determine the existence of an arrangement. |
| Ÿ | Delivery has occurred. Shipping documents and customer acceptance, when applicable, are used to verify delivery. |
| Ÿ | The price is fixed or determinable. The Company assesses whether the price is fixed or determinable based on the payment terms associated with the transaction and whether the sales price is subject to refund or adjustment. |
| Ÿ | Collectability is reasonably assured. The Company assesses collectability based primarily on the creditworthiness of the customer as determined by credit checks and analysis, as well as the customer’s payment history. |
F-10
Table of Contents
The Company derives revenue primarily from the sales of its hardware and software products. Shipping charges billed to customers are included in revenue.
From time to time, the Company offers customers sales incentives, including discounts. Revenue is recorded net of these amounts.
Payment terms to customers are generally net 30 days. The Company does not offer extended payment terms.
In general, the Company’s products and services qualify as separate units of accounting. Products are typically considered delivered upon shipment. In certain cases, the Company’s products are sold along with services, which include installation, training, remote network monitoring services, post-sales software support, software-as-a-service (SaaS) based subscriptions, and/or extended warranty services. Post-sales software support includes rights, on a when-and-if-available basis, to receive unspecified software product upgrades to embedded software or the Company’s management software; maintenance releases; and patches released during the term of the support contract. This type of transaction is considered a multiple-element arrangement. When accounting for multiple-element arrangements, U.S. GAAP requires the Company to allocate revenue to individual elements using vendor-specific objective evidence (VSOE) of the selling price, third-party evidence (TPE) of the selling price, or its best estimated selling price (BESP) of deliverables if VSOE or TPE cannot be determined.
Multiple-element arrangements can include any combination of products and services. When allocating consideration, the Company will first do so on the basis of the deliverables’ relative selling prices, without regard to any contingent consideration, and then subsequently determine whether the revenue that may be recognized is limited based on the amount of non-contingent revenue. To the extent that the stated contractual prices agree to the Company’s estimated selling price on a standalone basis, the allocation of the consideration is based on stated contractual prices. However, if the stated contractual price for any deliverable is outside a narrow range of the estimated selling price on a standalone basis, the allocation is adjusted using the “relative-selling-price method.” Because the individual products and services meet the criteria for separate units of accounting, the Company will recognize revenue upon delivery of each element.
In most instances, the Company is not able to establish VSOE of the selling price for all deliverables in an arrangement with multiple elements. This may be due to the Company infrequently selling each element separately, not pricing elements within a narrow range, or only having a limited sales history. When VSOE cannot be established, the Company attempts to establish the selling price of each element based upon TPE of the selling price by evaluating the pricing of similar and interchangeable competitor products or services in standalone arrangements. However, as the Company’s products contain a significant element of proprietary technology and offer substantially different features and functionality from competitors, the Company has not been able to obtain comparable pricing information with respect to competitors’ products. Therefore, the Company has not been able to obtain reliable evidence of TPE of the selling price.
When the Company is unable to establish a selling price using VSOE or TPE, the Company uses BESP. The objective of BESP is to determine the price at which the Company would transact a sale if the element were sold on a standalone basis. BESP is primarily used for all elements for which the Company has historically not been able to establish VSOE or TPE of the selling price.
The Company determines BESP for an element by considering multiple factors, including, but not limited to, geographies, market conditions, competitive landscape, internal costs, gross margin objectives, characteristics of targeted customers, and pricing practices. The determination of BESP is
F-11
Table of Contents
made through consultation with and formal approval by the Company’s management, taking into consideration the go-to-market strategy. The Company regularly reviews VSOE, TPE, and BESP and has a process for the establishment and updating of these estimates.
Post-sales software support revenue and extended warranty services revenue are deferred and recognized ratably over the period during which the services are to be performed. Installation and training service revenues are recognized upon delivery or completion of performance. These service arrangements are typically short term in nature and are largely completed shortly after delivery of the product.
The Company also delivers software-defined networking solutions to customers most frequently on a term basis with terms typically ranging from 12 to 36 months. While term-based licenses make up the majority of related revenues, the Company occasionally licenses solutions to customers on a perpetual basis with on-going support and maintenance services. License revenue is recognized in accordance with software industry specific guidance. The Company has not established VSOE for support and maintenance related to term or perpetual licenses. As a result, the Company recognizes license, support and maintenance revenue ratably over the contract term beginning on the date the customer has access to the software license key and continuing through contracted support and maintenance period.
In instances where substantive acceptance provisions are specified in the customer agreement, revenue is deferred until all acceptance criteria have been met. The Company’s arrangements generally do not include any provisions for cancellation, termination, or refunds that would materially impact revenue recognition.
The Company enters into arrangements with certain of its customers who receive government supported loans and grants from the U.S. Department of Agriculture’s Rural Utility Service (RUS) to finance capital spending. Under the terms of an RUS equipment contract that includes installation services, the customer does not take possession and control and the title does not pass until formal acceptance is obtained from the customer. Under this type of arrangement, the Company does not recognize revenue until it has received formal acceptance from the customer, and all other revenue recognition criteria have been met.
When the Company’s products have been delivered, but the product revenue associated with the arrangement has been deferred as a result of not meeting the revenue recognition criteria, the related product costs are also deferred and included in deferred costs in the accompanying consolidated balance sheets.
Advertising Costs—Advertising costs, which are expensed and included in sales and marketing expense when incurred, were $0, $0.1 million, $0.2 million, $0 and $0.1 million for the years ended December 31, 2010, 2011 and 2012, and the three months ended March 31, 2012 and 2013, respectively.
Cost of Revenue—Cost of revenue primarily consists of manufacturing costs of products payable to the Company’s contract manufacturer. Cost of revenue also includes third-party manufacturing and supply chain logistics costs, provisions for excess and obsolete inventory, warranty hosting costs, certain allocated costs for facilities, depreciation and other expenses associated with logistics and quality control. Additionally, it includes salaries, benefits and stock-based compensation for personnel directly involved with manufacturing installation, maintenance and support services and the provision of the Company’s service offerings.
Research and Development—Research and development costs primarily include salaries and other personnel-related expenses, contractor fees, facility costs, supplies, and depreciation of
F-12
Table of Contents
equipment associated with the design and development of new products prior to the establishment of their technological feasibility. Such costs are charged to research and development expense as incurred.
Development costs related to software incorporated in the Company’s products incurred subsequent to the establishment of technological feasibility and prior to the product being released are capitalized and amortized over the estimated useful lives of the related products. Technological feasibility is established upon completion of a working model. Through March 31, 2013, these costs have been minimal and, accordingly, all software development costs have been charged to research and development expense in the accompanying consolidated statements of operations.
Warranties—The Company offers limited warranties for its hardware products for periods of one to eight years. The Company recognizes estimated costs related to warranty activities as a component of cost of revenue upon product shipment. The estimates are based upon historical product failure rates and historical costs incurred in correcting product failures. The recorded amount is adjusted from time to time for specifically identified warranty exposures. Actual warranty expenses are charged against the Company’s estimated warranty liability when incurred. Factors that affect the Company’s liability include the number of installed units, historical and anticipated rates of warranty claims, and the cost per claim.
Additionally, the Company offers separately priced extended warranty contracts for coverage beyond the standard warranty period. The Company expenses all warranty costs as incurred related to such extended warranty contracts.
Income Taxes—The Company accounts for income taxes using the liability method, which requires the recognition of deferred income tax assets and liabilities for the temporary differences between the financial reporting and tax basis of assets and liabilities, and are measured using the income tax rates in effect for the years in which the difference are expected to reverse. The effect on deferred income taxes of a change in income tax rates is recognized in income in the period that includes the enactment date. In addition, valuation allowances are established when necessary to reduce deferred income tax assets to the amounts expected to be realized.
The Company records uncertain tax positions using a two-step process whereby (1) a determination is made as to whether it is more likely than not that the tax positions will be sustained based on the technical merits of the position and (2) for those tax positions that meet the more-likely-than-not recognition threshold the Company recognizes the largest amount of tax benefit that is greater than 50% likely to be realized upon ultimate settlement with the related tax authority.
Stock-Based Compensation—The Company measures and recognizes stock-based compensation expense in the financial statements for all share-based payment awards made to employees and directors based on the estimated fair values on the date of grant using the Black-Scholes option-pricing model.
The Company’s determination of fair value of share based payment awards on the date of grant using the Black-Scholes option pricing model is affected by the Company’s estimated fair value of common stock, as well as assumptions regarding a number of highly complex and subjective variables. These variables include the fair value of the Company’s common stock, the Company’s expected stock price volatility over the expected term of the awards, stock option exercise and cancellation behaviors, risk-free interest rates and expected dividends.
Preferred Stock Warrant Liabilities—Freestanding warrants for shares that are either putable or redeemable are classified as liabilities on the balance sheet at fair value. Therefore, the freestanding warrants that give the holder the right to purchase the Company’s redeemable convertible preferred stock are liabilities that should be recorded at the estimated fair value. At the end of each reporting
F-13
Table of Contents
period, changes in fair value during the period are recorded as a component of other income (expense), net.
The Company will continue to adjust the preferred stock warrant liability for changes in the estimated fair value of the warrants until the earlier of the exercise or expiration of the warrants, or the completion of a liquidation event, including the completion of an initial public offering, at which time the liabilities will be reclassified to stockholders’ equity.
Deferred Issuance Costs
Costs directly associated with the planned issuance of equity are capitalized and recorded as deferred issuance costs until the issuance of such instruments. Deferred issuance costs included in other long-term assets were $1.6 million and $2.1 million as of December 31, 2012 and March 31, 2013, respectively.
| 2. | Fair Value Disclosure |
Assets and liabilities recorded at fair value in the consolidated financial statements are categorized based upon the level of judgment associated with the inputs used to measure their fair value. The Company categorizes its financial instruments into a fair value hierarchy that prioritizes the inputs to valuation techniques used to measure fair value. The hierarchy gives the highest priority to unadjusted quoted prices in active markets for identical assets or liabilities (Level 1 measurements) and the lowest priority to unobservable inputs (Level 3 measurements).
A financial instrument’s level within the fair value hierarchy is based on the lowest level of any input that is significant to the fair value measurement. Hierarchical levels that are directly related to the amount of subjectivity associated with the inputs to the valuation of these assets or liabilities are as follows:
Level 1: Inputs are unadjusted quoted prices in active markets for identical assets or liabilities at the measurement date.
Level 2: Inputs (other than quoted market prices included in Level 1) are either directly or indirectly observable for the asset or liability through correlation with market data at the measurement date and for the duration of the instrument’s anticipated life.
Level 3: Inputs reflect management’s best estimate of what market participants would use in pricing the asset or liability at the measurement date. Consideration is given to the risk inherent in the valuation technique and the risk inherent in the inputs to the model.
Cash Equivalents
Where quoted prices are available in an active market, cash equivalents are classified within Level 1 of the valuation hierarchy. Cash equivalents classified in Level 1 at December 31, 2011 and 2012 and March 31, 2013 include money market funds. The valuation of these instruments is determined using a market approach and is based upon unadjusted quoted prices for identical assets in active markets.
Preferred Stock Warrant Liabilities
The Company estimated the fair value of preferred stock warrants at the respective balance sheet dates using the Black-Scholes option-pricing model, based on the market value of the underlying redeemable convertible preferred stock at the valuation measurement date, the remaining contractual term of the warrant, risk-free rates, expected dividends, and the expected volatility of the price of the underlying redeemable convertible preferred stock. Because this model includes significant unobservable inputs, preferred stock warrant liabilities are classified within Level 3 of the valuation hierarchy.
F-14
Table of Contents
The following tables set forth by level, within the fair value hierarchy, the Company’s assets and liabilities at fair value (in thousands) as of:
| Level 1 | Level 2 | Level 3 | Total | |||||||||||||
| December 31, 2011 |
||||||||||||||||
| Assets: |
||||||||||||||||
| Money market funds |
$ | 15,015 | $ | — | $ | — | $ | 15,015 | ||||||||
| Liabilities: |
||||||||||||||||
| Preferred stock warrants |
$ | — | $ | — | $ | 900 | $ | 900 | ||||||||
| Level 1 | Level 2 | Level 3 | Total | |||||||||||||
| December 31, 2012 |
||||||||||||||||
| Assets: |
||||||||||||||||
| Money market funds |
$ | 4,544 | $ | — | $ | — | $ | 4,544 | ||||||||
| Liabilities: |
||||||||||||||||
| Preferred stock warrants |
$ | — | $ | — | $ | 6,254 | $ | 6,254 | ||||||||
| Level 1 | Level 2 | Level 3 | Total | |||||||||||||
| March 31, 2013 |
||||||||||||||||
| Assets: |
||||||||||||||||
| Money market funds (unaudited) |
$ | 4,583 | $ | — | $ | — | $ | 4,583 | ||||||||
| Liabilities: |
||||||||||||||||
| Preferred stock warrants (unaudited) |
$ | — | $ | — | $ | 8,252 | $ | 8,252 | ||||||||
The following table sets forth a summary of changes in the fair value of the Company’s Level 3 liabilities (in thousands):
| Fair value at December 31, 2010 |
$ | 1,213 | ||
| Change in fair value recorded in the statements of operations for the year |
(313 | ) | ||
|
|
|
|||
| Fair value at December 31, 2011 |
900 | |||
| Change in fair value recorded in the statements of operations for the year |
5,354 | |||
|
|
|
|||
| Fair value at December 31, 2012 |
6,254 | |||
| Change in fair value recorded in the statements of operations for the three months (unaudited) |
1,998 | |||
|
|
|
|||
| Fair value at March 31, 2013 (unaudited) |
$ | 8,252 | ||
|
|
|
| 3. | Balance Sheet Components |
Cash and Cash Equivalents
Cash and cash equivalents consisted of the following (in thousands):
| December 31, | March 31, 2013 |
|||||||||||
| 2011 | 2012 | |||||||||||
| (unaudited) | ||||||||||||
| Cash and cash equivalents: |
||||||||||||
| Cash |
$ | 10,725 | $ | 15,677 | $ | 9,424 | ||||||
| Money market funds |
15,015 | 4,544 | 4,583 | |||||||||
|
|
|
|
|
|
|
|||||||
| Total cash and cash equivalents |
$ | 25,740 | $ | 20,221 | $ | 14,007 | ||||||
|
|
|
|
|
|
|
|||||||
F-15
Table of Contents
Property and Equipment, Net
Property and equipment, net consisted of the following (in thousands):
| December 31, | March 31, | |||||||||||
| 2011 | 2012 | 2013 | ||||||||||
| (unaudited) | ||||||||||||
| Lab equipment and tooling |
$ | 5,333 | $ | 8,991 | $ | 10,370 | ||||||
| Software |
504 | 567 | 616 | |||||||||
| Leasehold improvements |
468 | 876 | 876 | |||||||||
| Furniture and fixtures |
246 | 413 | 471 | |||||||||
| Computer equipment |
520 | 719 | 803 | |||||||||
|
|
|
|
|
|
|
|||||||
| 7,071 | 11,566 | 13,136 | ||||||||||
| Less accumulated depreciation and amortization |
(3,280 | ) | (5,081 | ) | (5,656 | ) | ||||||
|
|
|
|
|
|
|
|||||||
| Property and equipment, net |
$ | 3,791 | $ | 6,485 | $ | 7,480 | ||||||
|
|
|
|
|
|
|
|||||||
For the years ended December 31, 2010, 2011 and 2012, and the three months ended March 31, 2013, depreciation and amortization expense on property and equipment was $0.8 million, $1.4 million, $1.8 million and $0.6 million, respectively.
Included in property and equipment are assets acquired under capital lease obligations. As of December 31, 2012 and March 31, 2013, the cost and accumulated depreciation related to these assets was $0.3 million and $0.2 million, and $0.3 million and $0.2 million, respectively. Amortization of these assets is included in depreciation and amortization expense.
Accrued Expenses
Accrued expenses consisted of the following (in thousands):
| December 31, | March 31, | |||||||||||
| 2011 | 2012 | 2013 | ||||||||||
| (unaudited) | ||||||||||||
| Inventory-in-transit |
$ | 237 | $ | 323 | $ | 221 | ||||||
| Warranty reserve(1) |
783 | 1,266 | 1,333 | |||||||||
| Professional fees |
33 | 921 | 646 | |||||||||
| Sales and use taxes |
451 | 627 | 542 | |||||||||
| Other |
348 | 499 | 289 | |||||||||
|
|
|
|
|
|
|
|||||||
| Accrued liabilities |
$ | 1,852 | $ | 3,636 | $ | 3,031 | ||||||
|
|
|
|
|
|
|
|||||||
| (1) | Activity related to warranties is as follows (in thousands): |
| Balance at December 31, 2010 |
$ | 363 | ||
| Charge to cost of sales |
963 | |||
| Costs incurred |
(543 | ) | ||
|
|
|
|||
| Balance at December 31, 2011 |
783 | |||
| Charge to cost of sales |
1,106 | |||
| Costs incurred |
(623 | ) | ||
|
|
|
|||
| Balance at December 31, 2012 |
1,266 | |||
| Charge to cost of sales (unaudited) |
331 | |||
| Costs incurred (unaudited) |
(264 | ) | ||
|
|
|
|||
| Balance at March 31, 2013 (unaudited) |
$ | 1,333 | ||
|
|
|
F-16
Table of Contents
| 4. | Debt |
Loan and Security Agreement
On December 21, 2012, the Company entered into a Loan and Security Agreement with Silicon Valley Bank (“SVB”). The agreement provides a revolving loan facility of up to $10.0 million and a term loan facility of up to $5.0 million, for a total loan facility of up to $15.0 million. As of December 31, 2012 and March 31, 2013, the Company had drawn down $5.0 million and $5.0 million as term loans and $7.6 million and $7.6 million as revolving loans.
Revolving loans bear interest at a floating rate equal to the greater of (i) 3.25% or (ii) the prime rate (3.25% and 3.25% as of December 31, 2012 and March 31, 2013). For the first 12 months following each term loan advance, each term loan advance bears interest at a floating rate equal to the prime rate, plus 0.50%. On the date following such 12 month period and thereafter, each term loan advance bears interest at a fixed rate equal to the prime rate on the date following such 12 month period, plus 0.50%.
Interest on the revolving loans and the term loans is due and payable monthly in arrears. Revolving loans may be borrowed, repaid and reborrowed until December 21, 2014, when all outstanding amounts must be repaid. Principal on each term loan advance is payable in 36 equal monthly installments beginning 12 months after the date on which such term loan advance is made. Prepayments of the revolving loan facility and the term loan facility prior to their respective termination dates will be subject to early termination fees, subject to certain exceptions.
The Company is obligated to pay customary fees for a loan facility of this size and type. The Company’s obligations under the loan facility are secured by a security interest on substantially all of its assets, excluding the Company’s intellectual property and certain other assets. Additionally, the Company’s future domestic subsidiaries, if any, may be required to become co-borrowers or guarantors under the loan facility.
The Loan and Security Agreement contains customary affirmative and negative covenants limiting the Company’s ability and the ability of its subsidiaries to, among other things, dispose of assets, undergo a change in control, merge or consolidate, make acquisitions, incur debt, incur liens, pay dividends, repurchase stock and make investments, in each case subject to certain exceptions. The Company must also comply with a minimum adjusted quick ratio financial covenant which is the ratio of its unrestricted cash and net billed accounts receivable to its current liabilities minus the current portion of deferred revenue.
The Loan and Security Agreement also contains customary events of default including, among others, payment defaults, breaches of covenants, investor abandonment, bankruptcy and insolvency events, cross defaults with certain material indebtedness, judgment defaults, and breaches of representations and warranties. Upon an event of default, SVB may declare all or a portion of the Company’s outstanding obligations payable to be immediately due and payable and exercise other rights and remedies provided for under the agreement. During the existence of an event of default, interest on the obligations could be increased by 5.0%.
As of December 31, 2012 and March 31, 2013, the Company was in compliance with all covenants.
F-17
Table of Contents
The estimated principal payments of the term loan over the next four years are as follows (in thousands):
| Year ending December 31: | ||||
| 2013 |
$ | — | ||
| 2014 |
1,604 | |||
| 2015 |
1,666 | |||
| 2016 |
1,730 | |||
|
|
|
|||
| $ | 5,000 | |||
|
|
|
|||
Growth Capital Loans
In April 2008, the Company obtained a $5.0 million loan commitment from a lender. During 2008 and 2009, the Company borrowed $3.0 million and $2.0 million, respectively, in $1.0 million installments. Each advance had a 36-month term and accrued interest at the prime rate plus 2.5% with a minimum rate of 6%. In addition, the agreement called for a 2% end-of-term payment, which was accrued over the life of the loan as incremental interest expense. Borrowings under the agreement were secured by substantially all assets of the Company. The agreement called for the Company to comply with various financial covenants. As of December 31, 2011, the Company was in compliance with these financial covenants. The Company made the final payments retiring these loans in January 2012.
Promissory Notes
In March and July 2008, the Company entered into three promissory note agreements for an aggregate amount of approximately $1.0 million to finance the purchase of capital equipment. The promissory notes carried interest at 6.25% to 6.5% per annum and had 36-month terms consisting of nine to 12 months of interest only followed by 24 to 27 equal monthly installments of principal and interest. The agreements were collateralized by the underlying equipment. These note obligations were repaid in full during 2011.
| 5. | Capital Leases |
In May and August 2008, the Company entered into three sale-leaseback agreements whereby the Company sold lab equipment for approximately $0.3 million, which was leased back to the Company under 36-month capital lease agreements. Interest on the leases was payable at rates of approximately 4.4%. Additionally, the Company entered into a capital lease for approximately $0.1 million of lab equipment in October 2010. The lease had a one-year term and an interest rate of 6.7%. All capital lease obligations were paid in full during 2011.
| 6. | Commitments and Contingencies |
Facility Lease and Related Party Transaction
In April 2007, the Company entered into a six-year lease agreement for office premises, which was originally scheduled to expire in September 2013. This agreement was amended in March 2010, April 2012 and September 2012 and now includes scheduled expiration dates in May 2015 and October 2018, providing the Company a total of 22,780 square feet. The lease stipulates annual rent totals over the life of the lease that result in uneven cash flows. The total commitment of the lease, with its extended term, is being amortized over the life of the lease on a straight-line basis. The difference between the lease payments required and the recognition of lease expense on a straight-line basis is recorded as deferred rent. As of December 31, 2011 and 2012 and March 31, 2013, total deferred rent was $0.2 million, $0.3 million and $0.2 million, respectively.
F-18
Table of Contents
For the years ended December 31, 2010, 2011 and 2012, and the three months ended March 31, 2013, rent expense was $0.4 million, $0.4 million, $0.5 million and $0.2 million, respectively.
In relation to this lease agreement, an executive officer, who is a member of our board of directors and a greater than 5% stockholder of the Company, owns approximately 40% of the limited liability company from which the Company is leasing this building. As of December 31, 2011 and 2012 and March 31, 2013, no amounts were included in accounts payable as accrued expenses under this agreement.
Future minimum annual obligations under the lease agreement as of December 31, 2012, are approximately as follows (in thousands):
| Year ending December 31: |
||||
| 2013 |
$ | 630 | ||
| 2014 |
632 | |||
| 2015 |
315 | |||
| 2016 |
83 | |||
| 2017 |
85 | |||
| Thereafter |
74 | |||
|
|
|
|||
| $ | 1,819 | |||
|
|
|
Contingencies
In the normal course of business, the Company is subject to various legal matters. In the opinion of management, the resolution of such matters will not have an adverse effect on the Company’s consolidated operations, cash flows or financial position.
In February 2013, a former employee of the Company filed a lawsuit alleging wrongful termination and seeking unspecified damages. The Company believes that it has meritorious defenses and intends to vigorously defend the action. This litigation is still in its early stages and the final outcome, including any estimated liability, if any, is uncertain. At present, the Company is unable to estimate a reasonably possible range of loss, if any, that may result from this matter.
Guarantees
The Company from time to time enters into certain types of contracts that contingently require it to indemnify various parties against claims from third parties. These contracts primarily relate to (i) certain real estate leases, under which the Company may be required to indemnify property owners for environmental and other liabilities, and other claims arising from the Company’s use of the applicable premises; (ii) certain agreements with the Company’s officers, directors, and employees, under which the Company may be required to indemnify such persons for liabilities arising out of their relationship with the Company; (iii) contracts under which the Company may be required to indemnify customers against third-party claims that a Company product infringes a patent, copyright, or other intellectual property right; and (iv) procurement or license agreements, under which the Company may be required to indemnify licensors or vendors for certain claims that may be brought against them arising from the Company’s acts or omissions with respect to the supplied products or technology.
Generally, a maximum obligation under these contracts is not explicitly stated. Because the obligated amounts associated with these types of agreements are not explicitly stated, the overall maximum amount of the obligation cannot be reasonably estimated. Historically, the Company has not been required to make payments under these obligations, and no liabilities have been recorded for these obligations in the Company’s consolidated balance sheet.
F-19
Table of Contents
Contract Manufacturer
As of December 31, 2011 and 2012 and March 31, 2013, the Company has commitments to its contract manufacturer of $5.6 million, $6.6 million and $6.4 million, respectively. Should the Company be required to pay under this guarantee, the Company has the right to obtain and liquidate the related inventory to recover amounts paid under the guarantee.
| 7. | Redeemable Convertible Preferred Stock and Warrants |
Redeemable Convertible Preferred Stock
The Company’s board of directors is authorized to designate the rights and preferences of each series of redeemable convertible preferred stock and to establish the number of shares in each series. Redeemable convertible preferred stock consisted of the following as of December 31, 2011 and 2012 and March 31, 2013:
| Series |
Number of Shares Authorized |
Number of Shares Issued and Outstanding |
Liquidation Preference Per Share |
Aggregate Liquidation Preference |
Carrying Value (Net of Issuance Costs) |
|||||||||||||||
| (in thousands) | ||||||||||||||||||||
| A |
6,830,453 | 6,740,614 | $ | 1.2981 | $ | 8,750 | $ | 8,653 | ||||||||||||
| B |
7,256,366 | 7,154,171 | $ | 2.4463 | 17,501 | 17,428 | ||||||||||||||
| C |
4,905,378 | 4,087,815 | $ | 2.4463 | 10,000 | 9,785 | ||||||||||||||
| D |
7,038,659 | 7,038,659 | $ | 3.1256 | 22,000 | 21,927 | ||||||||||||||
| E |
6,737,211 | 6,737,211 | $ | 4.5271 | 30,500 | 30,412 | ||||||||||||||
| F |
2,263,535 | 2,138,535 | $ | 4.6761 | 10,000 | 9,928 | ||||||||||||||
|
|
|
|
|
|
|
|||||||||||||||
| 33,897,005 | $ | 98,751 | $ | 98,133 | ||||||||||||||||
|
|
|
|
|
|
|
|||||||||||||||
The rights, privileges, and restrictions of Series A, Series B, Series C, Series D, Series E and Series F redeemable convertible preferred stock are set forth in the Company’s Amended and Restated Certificate of Incorporation and are summarized as follows:
Voting rights—Holders of Series A, Series B, Series C, Series D, Series E and Series F redeemable convertible preferred stock are entitled to one vote for each share of common stock into which such share of redeemable preferred stock is convertible.
Dividends—Holders of Series A, Series B, Series C, Series D, Series E and Series F redeemable convertible preferred stock are entitled to a dividend at a rate of $0.1038, $0.1957, $0.1957, $0.25, $0.3622 and $0.3741, respectively. Such dividends are noncumulative and are payable when and if declared by the board of directors. The holders of Series A, Series B, Series C, Series D, Series E and Series F redeemable convertible preferred stock will also be entitled to participate in dividends on common stock, when and if declared by the board of directors, based on the number of shares of common stock held on an as-if-converted basis. No dividends on redeemable convertible preferred stock or common stock have been declared from October 25, 2006 (date of inception) through March 31, 2013.
Liquidation—In the event of any liquidation, dissolution, or winding up of the Company, either voluntary or involuntary, including a merger, sale, or disposition of all or substantially all the assets of the Company or any other transaction or series of transactions involving the transfer of control of the Company, where persons other than the holders of the Company’s capital stock prior to the transaction become the beneficial owners of 50% or more of the voting power of the surviving entity, the holders of Series A, Series B, Series C, Series D, Series E and Series F redeemable convertible preferred stock are each entitled to receive an amount of $1.2981, $2.4463, $2.4463, $3.1256, $4.5271 and $4.6761
F-20
Table of Contents
per share, respectively, plus any declared but unpaid dividends prior to and in preference to any distribution to the holders of common stock. If the assets distributed among the holders of Series A, Series B, Series C, Series D, Series E and Series F redeemable convertible preferred stock are insufficient to permit the payment to the holders of Series A, Series B, Series C, Series D, Series E and Series F redeemable convertible preferred stock of the preferential amounts, the assets will be distributed ratably to the holders of Series A, Series B, Series C, Series D, Series E and Series F in proportion to the preferential amounts each holder would otherwise be entitled to receive. The remaining assets, if any, will be distributed ratably to the holders of common stock.
Because the timing of any such liquidation event is uncertain, the Company has elected not to adjust the carrying values of its redeemable convertible preferred stock to their respective liquidation values until it becomes probable that redemption will occur.
Conversion—Each share of Series A, Series B, Series C, Series D, Series E and Series F redeemable convertible preferred stock is convertible, at the option of the holder, according to a conversion ratio, subject to adjustment for dilution. The number of fully paid and nonassessable shares of common stock is determined by dividing the original issue price by the conversion price, which is currently equal to the original issue price.
Each share of Series A, Series B, Series C, Series D, Series E and Series F redeemable convertible preferred stock automatically converts into the number of shares of common stock into which such shares are convertible at the then-effective conversion ratio upon (1) the closing of a public offering of common stock with proceeds to the Company of at least $50,000,000 and in which the pre-money valuation of the Company is not less than $300,000,000; or (2) the date or time specified by vote, written consent, or agreement of the holders of the majority of the then-outstanding shares of redeemable convertible preferred stock, voting together as a class.
Contingent Redemption—The holders of redeemable convertible preferred stock have no voluntary rights to redeem shares. A liquidation or winding up of the Company, a greater than 50% change in control, or a sale of substantially all of its assets would constitute a redemption event. Although the redeemable convertible preferred stock is not mandatorily or currently redeemable, a liquidation or winding up of the Company would constitute a redemption event outside its control. Therefore, all shares of redeemable convertible preferred stock have been presented outside of permanent equity.
Convertible Preferred Stock Warrants
Significant terms and fair value estimates of warrants to purchase redeemable convertible preferred stock are as follows:
| Series |
Expiration Date(1) |
Exercise Price |
Number of Shares |
Fair Value as of | ||||||||||||||||||
| December 31, | March 31, 2013 |
|||||||||||||||||||||
| 2011 | 2012 | |||||||||||||||||||||
| (in thousands) |
||||||||||||||||||||||
| (unaudited) | ||||||||||||||||||||||
| A |
Various dates between November 21, 2013 and August 9, 2015 |
$ | 1.2981 | 89,839 | $ | 95 | $ | 630 | $ | 815 | ||||||||||||
| B |
Various dates between November 15, 2015 and February 23, 2016 |
2.4463 | 102,195 | 80 | 616 |
|
820 |
| ||||||||||||||
| C |
Various dates between June 8, 2016 and June 26, 2016 |
2.4463 | 817,563 | 725 | 5,008 |
|
6,617 |
| ||||||||||||||
|
|
|
|
|
|
|
|
|
|||||||||||||||
| 1,009,597 | $ | 900 | $ | 6,254 | $ | 8,252 | ||||||||||||||||
|
|
|
|
|
|
|
|
|
|||||||||||||||
F-21
Table of Contents
| (1) | Warrants to purchase an aggregate of 77,033 shares of Series A redeemable convertible preferred stock and 817,563 shares of Series C redeemable convertible preferred stock terminate upon the consummation of an initial public offering or sale of the Company if not exercised earlier. |
The Company estimated the fair value of these warrants at the respective balance sheet dates using the Black-Scholes option-pricing model, based on the market value of the underlying redeemable convertible preferred stock at the valuation measurement date, the remaining contractual terms of the warrants, risk-free rates, expected dividends, and expected volatility of the price of the underlying redeemable convertible preferred stock. These estimates are highly judgmental and could differ materially in the future.
The following table includes the assumptions used:
| December 31, | March 31, 2013 |
|||||||||||
| 2011 | 2012 | |||||||||||
| (unaudited) | ||||||||||||
| Remaining contractual term (in years) |
1.89 – 4.49 | 0.89 – 3.49 | 0.64 – 3.24 | |||||||||
| Volatility |
55% | 55% | 55% | |||||||||
| Dividend yield |
— | — | — | |||||||||
| Risk-free interest rate |
0.25 – 0.83% | 0.25 – 0.36% | 0.27 – 0.42% | |||||||||
| 8. | Common Stock |
Reserved Shares of Common Stock
At December 31, 2012 and March 31, 2013, the Company had reserved shares of common stock for future issuance as follows:
| December 31, 2012 |
March 31, 2013 |
|||||||
| (unaudited) | ||||||||
| Series A redeemable convertible preferred stock |
6,740,614 | 6,740,614 | ||||||
| Series B redeemable convertible preferred stock |
7,154,171 | 7,154,171 | ||||||
| Series C redeemable convertible preferred stock |
4,087,815 | 4,087,815 | ||||||
| Series D redeemable convertible preferred stock |
7,038,659 | 7,038,659 | ||||||
| Series E redeemable convertible preferred stock |
6,737,211 | 6,737,211 | ||||||
| Series F redeemable convertible preferred stock |
2,138,535 | 2,138,535 | ||||||
| Stock options outstanding |
10,212,760 | 11,184,817 | ||||||
| Stock options available for grant |
1,242,353 | 1,211,203 | ||||||
| Warrants outstanding |
1,009,597 | 1,009,597 | ||||||
|
|
|
|
|
|||||
| Total shares reserved |
46,361,715 | 47,302,622 | ||||||
|
|
|
|
|
|||||
Employee Stock Options
In 2006, the board of directors adopted the 2006 Stock Incentive Plan (the 2006 Plan). The 2006 Plan provides for the granting of incentive stock options and nonstatutory options to employees, officers, directors, and consultants of the Company. Stock options may be granted with an exercise price of not less than 100% of the fair value of the Company’s common stock on the date of grant. Stock options granted to stockholders owning more than 10% of the voting stock of the Company must have an exercise price of not less than 110% of the fair value of the common stock on the date of grant. The board of directors determines the fair value of the common stock. Generally, stock options are granted with terms of up to 10 years and vest over a period of four years.
F-22
Table of Contents
Stock options may include an early exercise provision. In the event of termination of the purchaser’s continuous service status, any unvested shares are subject to repurchase by the Company at the original purchase price, adjusted for any stock splits, stock dividends, and the like. This right of repurchase lapses with respect to the option shares in accordance with the vesting schedule set forth on the optionee’s notice of stock option grant. At December 31, 2011 and 2012 and March 31, 2013, there were no shares of common stock acquired for cash through the early exercise of options.
F-23
Table of Contents
A summary of the activity under the 2006 Plan and changes during the reporting periods and a summary of information related to options exercisable, vested, and expected to vest are presented below:
| Shares Available for Grant |
Number of Shares Outstanding |
Weighted- Average Exercise Price |
Weighted- Average Remaining Contractual Life (Years) |
Aggregate Intrinsic Value |
||||||||||||||||
| (in thousands) | ||||||||||||||||||||
| Balance at December 31, 2010 |
1,601,833 | 3,184,959 | 0.98 | 8.1 | 4,360 | |||||||||||||||
| Options reserved |
2,900,000 | — | — | |||||||||||||||||
| Options granted |
(1,554,935 | ) | 1,554,935 | 2.42 | ||||||||||||||||
| Options exercised |
— | (124,730 | ) | 0.31 | ||||||||||||||||
| Options forfeited |
169,190 | (169,190 | ) | 1.45 | ||||||||||||||||
|
|
|
|
|
|
|
|
|
|
|
|||||||||||
| Balance at December 31, 2011 |
3,116,088 | 4,445,974 | 1.49 | 7.8 | 4,063 | |||||||||||||||
| Options reserved |
4,027,500 | — | — | |||||||||||||||||
| Options granted |
(6,202,781 | ) | 6,202,781 | 3.17 | ||||||||||||||||
| Options exercised |
— | (134,449 | ) | 0.87 | ||||||||||||||||
| Options forfeited |
301,546 | (301,546 | ) | 2.52 | ||||||||||||||||
|
|
|
|
|
|
|
|
|
|
|
|||||||||||
| Balance at December 31, 2012 |
1,242,353 | 10,212,760 | $ | 2.49 | 8.4 | 59,456 | ||||||||||||||
| Options reserved (unaudited) |
1,000,000 | — | — | |||||||||||||||||
| Options granted (unaudited) |
(1,374,997 | ) | 1,374,997 | $ | 8.31 | |||||||||||||||
| Options exercised (unaudited) |
— | (59,093 | ) | $ | 1.06 | |||||||||||||||
| Options forfeited (unaudited) |
343,847 | (343,847 | ) | $ | 3.40 | |||||||||||||||
|
|
|
|
|
|
|
|
|
|
|
|||||||||||
| Balance at March 31, 2013 (unaudited) |
1,211,203 | 11,184,817 | $ | 3.18 | 8.3 | $ | 80,379 | |||||||||||||
|
|
|
|
|
|
|
|
|
|
|
|||||||||||
| Options vested and expected to vest—December 31, 2012 |
8,845,923 | $ | 2.45 | 8.3 | $ | 51,844 | ||||||||||||||
|
|
|
|
|
|
|
|
|
|||||||||||||
| Options exercisable—December 31, 2012 |
2,910,643 | $ | 1.21 | 6.4 | $ | 20,655 | ||||||||||||||
|
|
|
|
|
|
|
|
|
|||||||||||||
| Options vested and expected to vest—March 31, 2013 (unaudited) |
9,756,726 | $ | 3.14 | 8.3 | $ | 70,501 | ||||||||||||||
|
|
|
|
|
|
|
|
|
|||||||||||||
| Options exercisable—March 31, 2013 (unaudited) |
3,221,155 | $ | 1.37 | 6.5 | $ | 28,993 | ||||||||||||||
|
|
|
|
|
|
|
|
|
|||||||||||||
The following table summarizes information about stock options outstanding under the 2006 Plan at December 31, 2012:
| Options Outstanding | Options Exercisable | |||||||||||||||||||
| Range of Exercise Prices |
Number Outstanding |
Weighted- Average Exercise Price |
Number Exercisable |
Weighted- Average Exercise Price |
Weighted- Average Life (in Years) |
|||||||||||||||
| $0.01 – $0.87 |
1,566,031 | $ | 0.28 | 1,551,396 | $ | 0.27 | 4.9 | |||||||||||||
| $0.88 – $1.45 |
497,900 | 1.44 | 331,128 | 1.44 | 7.2 | |||||||||||||||
| $1.46 – $2.68 |
4,900,322 | 2.53 | 834,627 | 2.42 | 8.3 | |||||||||||||||
| $2.69 – $3.62 |
2,886,279 | 3.22 | 193,492 | 3.20 | 9.7 | |||||||||||||||
| $3.63 – $7.18 |
362,228 | 7.18 | — | — | — | |||||||||||||||
|
|
|
|
|
|
|
|
|
|
|
|||||||||||
| 10,212,760 | $ | 2.49 | 2,910,643 | $ | 1.21 | 6.4 | ||||||||||||||
|
|
|
|
|
|
|
|
|
|
|
|||||||||||
F-24
Table of Contents
The fair value of options granted to employees during the years ended December 31, 2010, 2011 and 2012, and the three month periods ended March 31, 2012 and 2013 was approximately $1.5 million, $2.0 million, $13.3 million, $1.5 million and $7.2 million, respectively.
The Company’s board of directors determined the fair value of each option grant on the date of grant using the Black-Scholes option-pricing model using the following factors:
| Year Ended December 31, | Three Months Ended March 31, |
|||||||||||||||||||
| 2010 | 2011 | 2012 | 2012 | 2013 | ||||||||||||||||
| (unaudited) | ||||||||||||||||||||
| Expected term (years) |
6.08 | 6.08 | 6.08 | 6.08 | 6.08 | |||||||||||||||
| Volatility |
56.7-59.5% | 55.0-56.7% | 55.0 | 55.0 | 55.0 | |||||||||||||||
| Risk-free interest rate |
1.40-2.60% | 0.97-2.25% | 0.62-1.02% | 0.83-1.02% | 0.78-0.9% | |||||||||||||||
| Dividend yield |
— | — | — | — | — | |||||||||||||||
The expected term of stock options was estimated based on the simplified method that takes into consideration the vesting and contractual terms. Volatility is estimated based on the average of the historical volatilities of the common stock of the Company’s peer group in the industry in which the Company does business, with characteristics similar to those of the Company. The Company uses the U.S. Treasury yield for its risk-free interest rate and a dividend yield of zero, as it does not issue dividends.
The estimated forfeiture rate is based on an analysis of actual forfeitures and will continue to be evaluated based on actual forfeiture experience, analysis of employee turnover behavior, and other factors. Further, to the extent the Company’s actual forfeiture rate is different from this estimate, stock-based compensation is adjusted accordingly.
The following table summarizes the allocation of stock-based compensation in the accompanying consolidated statements of operations (in thousands):
| Year Ended December 31, | Three Months Ended March 31, |
|||||||||||||||||||
| 2010 | 2011 | 2012 | 2012 | 2013 | ||||||||||||||||
| (unaudited) | ||||||||||||||||||||
| Cost of revenue |
$ | — | $ | 73 | $ | 57 | $ | 8 | $ | 29 | ||||||||||
| Research and development |
57 | 338 | 745 | 105 | 401 | |||||||||||||||
| Sales and marketing |
66 | 229 | 656 | 90 | 313 | |||||||||||||||
| General and administrative |
72 | 125 | 639 | 49 | 319 | |||||||||||||||
|
|
|
|
|
|
|
|
|
|
|
|||||||||||
| Total employee stock-based compensation |
$ | 195 | $ | 765 | $ | 2,097 | $ | 252 | $ | 1,062 | ||||||||||
|
|
|
|
|
|
|
|
|
|
|
|||||||||||
The weighted-average fair value per share of options granted was $1.05, $1.28 and $2.15, $1.32 and $5.22 for the years ended December 31, 2010, 2011 and 2012, and the three month periods ended March 31, 2012 and 2013, respectively. The intrinsic value of employee options exercised for the years ended December 31, 2010, 2011 and 2012, and the three month periods ended March 31, 2012 and 2013, was $0.3 million, $0.3 million, $0.3 million, $0 million and $0.5 million, respectively. At December 31, 2011 and 2012 and March 31, 2013, the total unamortized stock-based compensation expense of approximately $2.2 million, $11.7 million and $16.5 million, respectively, is to be recognized over the stock options’ remaining vesting term of approximately 3.26 years, 3.22 years and 3.12 years, respectively.
F-25
Table of Contents
Change in Authorized Stock
In March 2013, the Company’s board of directors and stockholders approved an amended and restated certificate of incorporation and amended and restated bylaws that will increase the authorized common stock to 1,000,000,000 shares and authorize 20,000,000 shares of undesignated preferred stock which will become effective in connection with the completion of the initial public offering of the Company’s common stock.
2013 Equity Incentive Plan
In March 2013, the Company’s board of directors and stockholders approved the 2013 Equity Incentive Plan. A total of 3,600,000 shares of common stock were initially reserved for future issuance under the 2013 Equity Incentive Plan plus any shares of common stock reserved for issuance under the 2006 Stock Plan at the time of completion of the initial public offering of the Company’s common stock and any shares of common stock which are forfeited, cancelled or terminated (other than by exercise) under the Company’s 2006 Stock Plan subsequent to the completion of the initial public offering of the Company’s common stock.
| 9. | Net Loss Per Share |
The following table presents the calculation of basic and diluted net loss per share (in thousands, except per share data):
| Year Ended December 31, | Three Months Ended March 31, |
|||||||||||||||||||
| 2010 | 2011 | 2012 | 2012 | 2013 | ||||||||||||||||
| (unaudited) | ||||||||||||||||||||
| Net loss |
$ | (16,344 | ) | $ | (15,885 | ) | $ | (16,601 | ) | $ | (3,900 | ) | $ | (9,350 | ) | |||||
|
|
|
|
|
|
|
|
|
|
|
|||||||||||
| Weighted-average shares used to compute basic and diluted net loss per share |
2,167 | 2,396 | 2,515 | 2,441 | 2,593 | |||||||||||||||
|
|
|
|
|
|
|
|
|
|
|
|||||||||||
| Basic and diluted net loss per share |
$ | (7.54 | ) | $ | (6.63 | ) | $ | (6.60 | ) | $ | (1.60 | ) | $ | (3.61 | ) | |||||
|
|
|
|
|
|
|
|
|
|
|
|||||||||||
The following securities were excluded from the calculation of diluted net loss per share attributable to common stockholders because their effect would have been anti-dilutive for the periods presented (in thousands):
| Year Ended December 31, | Three Months Ended March 31, |
|||||||||||||||||||
| 2010 | 2011 | 2012 | 2012 | 2013 | ||||||||||||||||
| (unaudited) | ||||||||||||||||||||
| Redeemable convertible preferred stock |
31,648 | 33,897 | 33,897 | 33,897 | 33,897 | |||||||||||||||
| Employee stock options |
3,185 | 4,446 | 10,213 | 5,533 | 11,185 | |||||||||||||||
| Convertible preferred stock warrants |
1,010 | 1,010 | 1,010 | 1,010 | 1,010 | |||||||||||||||
|
|
|
|
|
|
|
|
|
|
|
|||||||||||
| 35,843 | 39,353 | 45,120 | 40,440 | 46,092 | ||||||||||||||||
|
|
|
|
|
|
|
|
|
|
|
|||||||||||
Unaudited Pro Forma Net Loss per Share
Pro forma basic and diluted net loss per share were computed to give effect to the conversion of the Series A, Series B, Series C, Series D, Series E and Series F redeemable convertible preferred stock using the as-if converted method into common shares and the reclassification of the preferred stock warrant liability to additional paid-in-capital as though the conversion and reclassification had occurred as of the beginning of the first period presented or the original date of issuance, if later.
F-26
Table of Contents
The following table presents the calculation of basic and diluted pro forma net loss per share (in thousands, except per share data):
| Year Ended December 31, |
Three Months Ended March 31, |
|||||||
| 2012 | 2013 | |||||||
| Net loss |
$ | (16,601 | ) | $ | (9,350 | ) | ||
| Pro forma adjustment to reflect change in fair value of preferred stock warrant liability |
5,354 |
|
1,998 |
| ||||
|
|
|
|
|
|||||
| $ | (11,247 | ) | $ | (7,352 | ) | |||
|
|
|
|
|
|||||
| Shares: |
||||||||
| Weighted-average shares used to compute basic net loss per share |
2,515 |
|
2,593 |
| ||||
| Pro forma adjustment to reflect assumed conversion of redeemable convertible preferred stock to occur upon consummation of the Company’s expected initial public offering |
33,897 | |
33,897 |
| ||||
|
|
|
|
|
|||||
| Weighted-average shares used to compute basic and diluted pro forma net loss per share |
36,412 | 36,490 | ||||||
|
|
|
|
|
|||||
| Pro forma basic and diluted net loss per share |
$ | (0.31 | ) | $ | (0.20 | ) | ||
|
|
|
|
|
|||||
| 10. | Income Taxes |
The following table presents domestic and foreign components of loss before provision for income taxes (in thousands):
| Year Ended December 31, | ||||||||||||
| 2010 | 2011 | 2012 | ||||||||||
| United States |
$ | (16,343 | ) | $ | (15,939 | ) | $ | (16,725 | ) | |||
| Foreign |
— | 68 | 164 | |||||||||
|
|
|
|
|
|
|
|||||||
| Total |
$ | (16,343 | ) | $ | (15,871 | ) | $ | (16,561 | ) | |||
|
|
|
|
|
|
|
|||||||
The components of the provision for income taxes are as follows (in thousands):
| Year Ended December 31, | ||||||||||||
| 2010 | 2011 | 2012 | ||||||||||
| Current: |
||||||||||||
| Federal |
$ | — | $ | — | $ | — | ||||||
| State |
1 | 1 | 6 | |||||||||
| Foreign |
— | 13 | 34 | |||||||||
|
|
|
|
|
|
|
|||||||
| Total |
$ | 1 | $ | 14 | $ | 40 | ||||||
|
|
|
|
|
|
|
|||||||
| Deferred: |
||||||||||||
| Federal |
$ | — | $ | — | $ | — | ||||||
| State |
— | — | — | |||||||||
| Foreign |
— | — | — | |||||||||
|
|
|
|
|
|
|
|||||||
| Total |
— | — | — | |||||||||
|
|
|
|
|
|
|
|||||||
| Total provision |
$ | 1 | $ | 14 | $ | 40 | ||||||
|
|
|
|
|
|
|
|||||||
F-27
Table of Contents
The following table presents a reconciliation of the statutory federal rate and the Company’s effective tax rate for the periods presented:
| Year Ended December 31, | ||||||||||||
| 2010 | 2011 | 2012 | ||||||||||
| Federal income tax at statutory rate |
34.0 | % | 34.0 | % | 34.0 | % | ||||||
| State income tax, net of federal benefit |
5.4 | 5.4 | 4.5 | |||||||||
| Foreign taxes at less than statutory rate |
— | 0.1 | 0.1 | |||||||||
| Nondeductible stock based compensation |
(1.1 | ) | (1.4 | ) | (3.4 | ) | ||||||
| Nondeductible warrant fair value adjustment |
(0.9 | ) | 0.7 | (12.4 | ) | |||||||
| Other permanent differences |
0.3 | (0.4 | ) | (1.0 | ) | |||||||
| Tax credits generated in current year |
3.9 | 4.9 | 2.8 | |||||||||
| Other |
0.1 | — | 0.7 | |||||||||
| Valuation allowance change |
(41.7 | ) | (43.3 | ) | (25.5 | ) | ||||||
|
|
|
|
|
|
|
|||||||
| Total |
— | % | — | % | (0.2 | )% | ||||||
|
|
|
|
|
|
|
|||||||
Deferred income taxes reflect the net tax effects of temporary differences between the carrying amounts of assets and liabilities for financial reporting purposes and the amounts used for income tax purposes. The following table presents significant components of the Company’s deferred tax assets as of December 31 (in thousands):
| December 31, | ||||||||
| 2011 | 2012 | |||||||
| Deferred revenue |
$ | 8 | $ | 206 | ||||
| Depreciation and amortization |
(106 | ) | (241 | ) | ||||
| Accrued expenses and reserves |
871 | 1,485 | ||||||
| Loss carryforwards |
26,063 | 29,149 | ||||||
| Tax credit carryforwards |
3,002 | 3,462 | ||||||
| Contribution carryforwards |
1 | 1 | ||||||
|
|
|
|
|
|||||
| 29,839 | 34,062 | |||||||
| Valuation allowance |
(29,839 | ) | (34,062 | ) | ||||
|
|
|
|
|
|||||
| Net deferred tax assets |
$ | — | $ | — | ||||
|
|
|
|
|
|||||
A valuation allowance is provided when it is more likely than not that the deferred tax assets will not be realized. The Company established a full valuation allowance to offset net deferred tax assets as of December 31, 2010, 2011 and 2012 due to the uncertainty of realizing future tax benefits from its net operating loss (“NOL”) carryforwards and other deferred tax assets. The valuation allowance increased by approximately $6.8 million, $6.9 million and $4.2 million during the years ended December 31, 2010, 2011 and 2012, respectively.
At December 31, 2012, the Company had NOL carryforwards of $73.7 million, $61.0 million, and $13.0 million available to reduce future taxable income for federal, California, and other state income tax purposes, respectively. The NOL carryforwards begin to expire in 2026 for federal and 2016 for state tax purposes. At December 31, 2012, the Company had research credit carryforwards of $2.4 million and $3.4 million available to offset future taxable income for federal and California state income tax purposes, respectively. The federal tax credits begin to expire in 2027. The state tax credit does not expire.
F-28
Table of Contents
Under Section 382 of the Tax Reform Act of 1986 and similar state provisions, the amounts of benefits from NOL and tax credit carryforwards may be impaired or limited on an annual basis in the event that the Company has a cumulative ownership change of more than 50%, as defined, over a three-year period. The annual limitation may result in the expiration of the NOL and tax credit carryforwards before utilization. The impact of any limitation that may be imposed due to current or future issuances of equity securities, including issuances with respect to acquisitions, has not been determined.
As of December 31, 2012, the Company had an unrecognized tax benefit balance of $1.2 million related to research and development credits. No amount of the unrecognized tax benefits of $1.2 million at December 31, 2012, if recognized, would reduce the Company’s annual effective tax rate because the benefits would be in the form of tax credit carryforwards for which a full valuation allowance has been recorded. The Company does not anticipate a significant change to its unrecognized tax benefits over the next twelve months. The unrecognized tax benefits may change during the next year for items that arise in the ordinary course of business. The following table reflects changes in the unrecognized tax benefits (in thousands):
| Year Ended December 31, |
||||||||
| 2011 | 2012 | |||||||
| Unrecognized tax benefits as of the beginning of the year |
$ | 743 | $ | 1,001 | ||||
| Increase related to prior year tax provisions |
— | — | ||||||
| Decrease related to prior year tax provisions |
— | — | ||||||
| Increase related to current year tax provisions |
258 | 153 | ||||||
|
|
|
|
|
|||||
| Unrecognized tax benefits as of the end of the year |
$ | 1,001 | $ | 1,154 | ||||
|
|
|
|
|
|||||
The Company’s policy is to recognize interest and penalties accrued on any unrecognized tax benefits as a component of income tax expense. Total interest and penalties included in the statements of operations for the years ended December 31, 2010, 2011 and 2012, are each zero. The Company files income tax returns in the United States, various states and certain foreign jurisdictions. The tax periods 2006 through 2012 remain open in most jurisdictions. The Company is not currently under examination by income tax authorities in federal, state or other foreign jurisdiction.
| 11. | Employee Benefit Plan |
The Company provides a defined contribution savings plan under Section 401(k) of the Internal Revenue Code. This plan covers substantially all employees who meet minimum age and service requirements and allows participants to defer a portion of their annual compensation on a pre-tax basis. Company contributions to the plan may be made at the discretion of the board of directors. There were no employer contributions under this plan for the years ended December 31, 2010, 2011 or 2012 or the three months ended March 31, 2013.
F-29
Table of Contents
| 12. | Concentration |
Customers with an accounts receivable balance of 10% or greater of the total accounts receivable and customers with net revenue of 10% or greater of the total revenue are as follows:
| As of or for the Year Ended December 31, | As of or for the Three Months Ended March 31, |
|||||||||||||||||||||||||||||||
| 2010 | 2011 | 2012 | 2012 | 2013 | ||||||||||||||||||||||||||||
| (unaudited) | ||||||||||||||||||||||||||||||||
| Percentage of Revenue |
Percentage of Accounts Receivable |
Percentage of Revenue |
Percentage of Accounts Receivable |
Percentage of Revenue |
Percentage of Revenue |
Percentage of Accounts Receivable |
Percentage of Revenue |
|||||||||||||||||||||||||
| Customer A |
23 | % | 26 | % | 37 | % | 22 | % | 45 | % | 39 | % | 38 | % | 47 | % | ||||||||||||||||
| Customer B |
* | 13 | * | * | * | * | * | * | ||||||||||||||||||||||||
| Customer C |
11 | * | * | * | * | * | * | * | ||||||||||||||||||||||||
* Represents less than 10%
| 13. | Segment Information |
The Company considers operating segments to be components of the Company in which separate financial information is available that is evaluated regularly by the Company’s chief operating decision maker in deciding how to allocate resources and in assessing performance. The chief operating decision maker for the Company is the chief executive officer. The Chief Executive Officer reviews financial information presented on a consolidated basis, accompanied by information about revenue by product line for purposes of allocating resources and evaluating financial performance. The Company has one business activity and there are no segment managers who are held accountable for operations, operating results or plans for levels or components below the consolidated unit level. Accordingly, the Company has determined that it has a single operating and reporting segment.
Substantially all of the revenue and assets were attributable to U.S. operations as of December 31, 2011 and 2012 and March 31, 2013, and for the years ended December 31, 2010, 2011 and 2012, and the three months ended March 31, 2012 and 2013.
| 14. | Subsequent Events |
For the consolidated financial statements as of December 31, 2011 and 2012 and for each of the three years in the period ended December 31, 2012, the Company evaluated subsequent events through February 19, 2013, the date these consolidated financial statements were available to be issued. For the consolidated financial statements as of March 31, 2013 and the three months then ended, the Company evaluated subsequent events through April 19, 2013, the date the consolidated financial statements were available to be issued.
F-30
Table of Contents
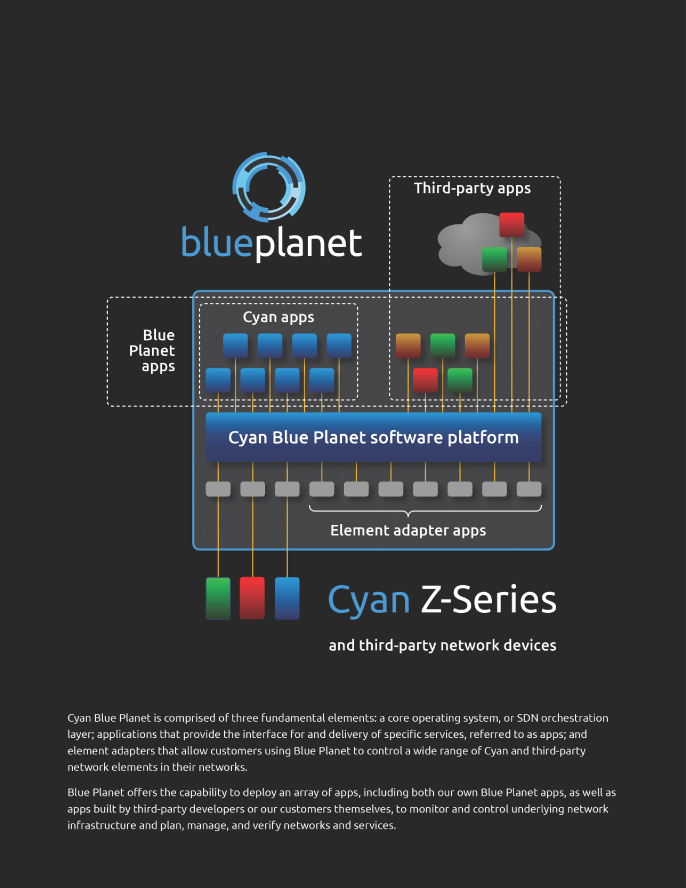
Table of Contents
8,000,000 Shares
Cyan, Inc.
Common Stock

| Goldman, Sachs & Co. | J.P. Morgan | |
| Jefferies | ||
| Pacific Crest Securities | ||
Through and including , 2013 (the 25th day after the date of this prospectus), all dealers effecting transactions in these securities, whether or not participating in this offering, may be required to deliver a prospectus. This is in addition to a dealer’s obligation to deliver a prospectus when acting as an underwriter and with respect to an unsold allotment or subscription.
Table of Contents
PART II
INFORMATION NOT REQUIRED IN THE PROSPECTUS
Item 13. Other Expenses of Issuance and Distribution.
The following table sets forth all expenses to be paid by the Registrant, other than underwriting discounts and commissions, in connection with this offering. All amounts shown are estimates except for the SEC registration fee and the FINRA filing fee.
| SEC registration fee |
$ | 15,059 | ||
| FINRA filing fee |
17,060 | |||
| NYSE listing fee |
150,000 | |||
| Printing and engraving expenses |
350,000 | |||
| Legal fees and expenses |
1,500,000 | |||
| Accounting fees and expenses |
1,300,000 | |||
| Blue Sky fees and expenses (including legal fees) |
25,000 | |||
| Transfer agent and registrar fees and expenses |
10,000 | |||
| Miscellaneous |
200,000 | |||
|
|
|
|||
| Total |
$ | 3,567,119 | ||
|
|
|
Item 14. Indemnification of Directors and Officers.
On completion of this offering, the Registrant’s amended and restated certificate of incorporation will contain provisions that eliminate, to the maximum extent permitted by the General Corporation Law of the State of Delaware, the personal liability of the Registrant’s directors and executive officers for monetary damages for breach of their fiduciary duties as directors or officers. The Registrant’s amended and restated certificate of incorporation and bylaws will provide that the Registrant must indemnify its directors and executive officers and may indemnify its employees and other agents to the fullest extent permitted by the General Corporation Law of the State of Delaware.
Sections 145 and 102(b)(7) of the General Corporation Law of the State of Delaware provide that a corporation may indemnify any person made a party to an action by reason of the fact that he or she was a director, executive officer, employee or agent of the corporation or is or was serving at the request of a corporation against expenses (including attorneys’ fees), judgments, fines and amounts paid in settlement actually and reasonably incurred by him or her in connection with such action if he or she acted in good faith and in a manner he or she reasonably believed to be in, or not opposed to, the best interests of the corporation and, with respect to any criminal action or proceeding, had no reasonable cause to believe his or her conduct was unlawful, except that, in the case of an action by or in right of the corporation, no indemnification may generally be made in respect of any claim as to which such person is adjudged to be liable to the corporation.
The Registrant has entered into indemnification agreements with its directors and executive officers, in addition to the indemnification provided for in its amended and restated certificate of incorporation and bylaws, and intends to enter into indemnification agreements with any new directors and executive officers in the future.
The Registrant has purchased and intends to maintain insurance on behalf of each and any person who is or was a director or officer of the Registrant against any loss arising from any claim asserted against him or her and incurred by him or her in any such capacity, subject to certain exclusions.
II-1
Table of Contents
The Underwriting Agreement (Exhibit 1.1 hereto) provides for indemnification by the underwriters of the Registrant and its executive officers and directors, and by the Registrant of the underwriters, for certain liabilities, including liabilities arising under the Securities Act.
See also the undertakings set out in response to Item 17 herein.
Item 15. Recent Sales of Unregistered Securities.
Since January 1, 2011, we have issued the following securities that were not registered under the Securities Act:
(1) Sales of capital stock
| Ÿ | On May 6, 2011, we issued 110,446 shares of Series E redeemable convertible preferred stock in connection with our Series E Financing to two accredited investors at a price of $4.53 per share for aggregate gross proceeds of approximately $500,000; and |
| Ÿ | On December 9, 2011, and at an additional closing on December 12, 2011, we issued 2,138,535 shares of Series F redeemable convertible preferred stock to 17 accredited investors at a price of $4.68 per share for aggregate gross proceeds of approximately $10.0 million. |
(2) Options issuances
| Ÿ | From January 1, 2011 through March 31, 2013, we issued and sold an aggregate of 318,272 shares of common stock upon the exercise of options issued to certain officers, directors, employees and consultants of the registrant under our 2006 Plan at exercise prices per share ranging from $0.10 to $2.54, for an aggregate consideration of approximately $224,896. |
| Ÿ | From January 1, 2011 through March 31, 2013, we granted stock options to purchase an aggregate of 9,132,713 shares of our common stock at exercise prices per share ranging from $2.35 to $8.31 to employees, consultants, directors and other service providers under our 2006 Plan. |
None of the foregoing transactions involved any underwriters, underwriting discounts or commissions, or any public offering, and the registrant believes the transactions were exempt from the registration requirements of the Securities Act in reliance on Section 4(2) thereof, with respect to the items (1) and (2) above, and/or Rule 701 thereunder, with respect to the item (2) above, as transactions by an issuer not involving a public offering or transactions pursuant to compensatory benefit plans and contracts relating to compensation as provided under such Rule 701.
Item 16. Exhibits and Financial Statement Schedules.
(1) Exhibits
See Exhibit Index immediately following the Signature Pages.
(2) Financial Statement Schedules.
All other schedules have been omitted because the information required to be presented in them is not applicable or is shown in the consolidated financials statements or related notes.
II-2
Table of Contents
Item 17. Undertakings.
The undersigned Registrant hereby undertakes to provide to the underwriters at the closing as specified in the underwriting agreement certificates in such denominations and registered in such names as required by the underwriters to permit prompt delivery to each purchaser.
Insofar as indemnification for liabilities arising under the Securities Act of 1933, as amended, may be permitted to directors, officers and controlling persons of the Registrant pursuant to the foregoing provisions, or otherwise, the Registrant has been advised that in the opinion of the Securities and Exchange Commission such indemnification is against public policy as expressed in the Securities Act of 1933, as amended, and is, therefore, unenforceable. In the event that a claim for indemnification against such liabilities (other than the payment by the Registrant of expenses incurred or paid by a director, officer or controlling person of the Registrant in the successful defense of any action, suit or proceeding) is asserted by such director, officer or controlling person in connection with the securities being registered, the Registrant will, unless in the opinion of its counsel the matter has been settled by controlling precedent, submit to a court of appropriate jurisdiction the question whether such indemnification by it is against public policy as expressed in the Securities Act of 1933, as amended, and will be governed by the final adjudication of such issue.
The Registrant hereby undertakes that:
(1) For purposes of determining any liability under the Securities Act of 1933, as amended, the information omitted from a form of prospectus filed as part of this registration statement in reliance upon Rule 430A and contained in the form of prospectus filed by the Registrant pursuant to Rule 424(b)(1) or (4) or 497(h) under the Securities Act of 1933, as amended, shall be deemed to be part of this registration statement as of the time it was declared effective.
(2) For the purpose of determining any liability under the Securities Act of 1933, as amended, each post-effective amendment that contains a form of prospectus shall be deemed to be a new registration statement relating to the securities offered therein, and the offering of such securities at that time shall be deemed to be the initial bona fide offering thereof.
II-3
Table of Contents
SIGNATURES
Pursuant to the requirements of the Securities Act of 1933, the registrant has duly caused this registration statement to be signed on its behalf by the undersigned, thereunto duly authorized, in the City of Petaluma, State of California, on May 6, 2013.
| CYAN, INC. | ||
| By: |
/s/ Mark A. Floyd | |
| Mark A. Floyd Chief Executive Officer | ||
Pursuant to the requirements of the Securities Act of 1933, this registration statement has been signed by the following persons in the capacities indicated below:
| Signature |
Title |
Date | ||
| /s/ Mark A. Floyd Mark A. Floyd |
Chief Executive Officer and Chairman of the Board of Directors (Principal Executive Officer) |
May 6, 2013 | ||
| /s/ Michael W. Zellner Michael W. Zellner |
Vice President and Chief Financial Officer (Principal Accounting and Financial Officer) |
May 6, 2013 | ||
| * Michael L. Hatfield |
President and Director | May 6, 2013 | ||
| * Paul A. Ferris |
Director | May 6, 2013 | ||
| * Promod Haque |
Director | May 6, 2013 | ||
| * M. Niel Ransom |
Director | May 6, 2013 | ||
| * Michael J. Boustridge |
Director | May 6, 2013 | ||
| * Robert E. Switz |
Director | May 6, 2013 | ||
| *By: | /s/ Michael W. Zellner |
|||
| Michael W. Zellner | ||||
| Attorney-in-fact | ||||
II-4
Table of Contents
EXHIBIT INDEX
| Exhibit Number |
Description | |
| 1.1** | Form of Underwriting Agreement. | |
| 3.1** | Amended and Restated Certificate of Incorporation of the Registrant, as currently in effect. | |
| 3.2** | Certificate of Amendment to the Amended and Restated Certificate of Incorporation of the Registrant, as currently in effect. | |
| 3.3** | Form of Amended and Restated Certificate of Incorporation of the Registrant, to be in effect upon the completion of this offering. | |
| 3.4** | Bylaws of the Registrant, as currently in effect. | |
| 3.5** | Form of Amended and Restated Bylaws of the Registrant, to be in effect upon the completion of this offering. | |
| 4.1** | Amended and Restated Investors’ Rights Agreement, dated December 9, 2011, by and among the Registrant and certain of its stockholders. | |
| 5.1** | Opinion of Wilson Sonsini Goodrich & Rosati, Professional Corporation. | |
| 10.1+** | Form of Indemnification Agreement between the Registrant and each of its directors and executive officers. | |
| 10.2.1+** | 2006 Stock Plan. | |
| 10.2.2+** | Form of Option Grant Notice and Option Agreement for 2006 Stock Plan: New Hire U.S. Executive. | |
| 10.2.3+** | Form of Option Grant Notice and Option Agreement for 2006 Stock Plan: New Hire U.S. Non-Executive. | |
| 10.2.4+** | Form of Option Grant Notice and Option Agreement for 2006 Stock Plan: U.S. Director. | |
| 10.2.5+** | Form of Option Grant Notice and Option Agreement for 2006 Stock Plan: Refresh Grant U.S. Executive. | |
| 10.2.6+** | Form of Option Grant Notice and Option Agreement for 2006 Stock Plan: Refresh Grant U.S. Non-Executive. | |
| 10.2.7+** | Form of Option Grant Notice and Option Agreement for 2006 Stock Plan: New Hire Non-U.S. Non-Executive. | |
| 10.3.1+** | 2013 Equity Incentive Plan. | |
| 10.3.2+** | Form of U.S. Stock Option Award Agreement for 2013 Equity Incentive Plan. | |
| 10.3.3+** | Form of U.S. Restricted Stock Unit Agreement for 2013 Equity Incentive Plan. | |
| 10.3.4+** | Form of Non-U.S. Stock Option Award Agreement for 2013 Equity Incentive Plan. | |
| 10.3.5+** | Form of Non-U.S. Restricted Stock Unit Agreement for 2013 Equity Incentive Plan. | |
| 10.4+** | Offer Letter by and between the Registrant and Mark Floyd, dated May 4, 2012. | |
| 10.5+** | Offer Letter by and between the Registrant and Scott Bauer, dated January 28, 2011. | |
| 10.6+** | Offer Letter by and between the Registrant and Norm Foust, dated January 8, 2007. | |
| 10.7+** | Offer Letter by and between the Registrant and James Hamilton, dated February 18, 2013. | |
| 10.8+** | Offer Letter by and between the Registrant and Scott Pradels, dated November 2, 2006. | |
| 10.9+** | Offer Letter by and between the Registrant and Kenneth Siegel, dated August 23, 2012. | |
| 10.10+** | Offer Letter by and between the Registrant and Michael Zellner, dated February 15, 2013. | |
| 10.11+** | Form of Severance and Change in Control Agreement between the Registrant and each of its executive officers. | |
Table of Contents
| Exhibit Number |
Description | |
| 10.12†** | Flextronics Manufacturing Services Agreement by and between the Registrant and Flextronics Telecom Systems Ltd., dated June 22, 2007, as amended. | |
| 10.13** | Full Service Lease by and between the Registrant and Redwood Technology Center, LLC, and Redwood Business Center 1, LLC as successor in interest, dated April 25, 2007, as amended September 4, 2012. | |
| 10.14** | Loan and Security Agreement by and between the Registrant and Silicon Valley Bank, dated December 21, 2012. | |
| 23.1 | Consent of Ernst & Young LLP, Independent Registered Public Accounting Firm. | |
| 23.2** | Consent of Wilson Sonsini Goodrich & Rosati, Professional Corporation (included in Exhibit 5.1). | |
| 24.1** | Power of Attorney (attached to the signature page of this Registration Statement on Form S-1). | |
| ** | Previously filed. |
| + | Indicates a management contract or compensatory plan. |
| † | Confidential treatment has been requested for portions of this exhibit. These portions have been omitted from the registration statement and submitted separately to the Securities and Exchange Commission. |