Attached files
| file | filename |
|---|---|
| EX-99.1 - EX-99.1 - TEXAS CAPITAL BANCSHARES INC/TX | d526891dex991.htm |
| 8-K - FORM 8-K - TEXAS CAPITAL BANCSHARES INC/TX | d526891d8k.htm |
 TCBI Q1 2013
Earnings |
 2
Certain matters discussed on this call may contain forward-looking
statements, which are subject to risks and uncertainties and are
based on Texas Capital’s current estimates or expectations of future events or future results. Texas Capital is under no
obligation, and expressly disclaims such obligation, to update, alter
or revise its forward-looking statements, whether as a result
of new information, future events or otherwise. A number of factors,
many of which are beyond Texas Capital’s control, could
cause actual results to differ materially from future results expressed
or implied by such forward-looking statements. These risks
and uncertainties include the risk of adverse impacts from general
economic conditions, competition, interest rate sensitivity and
exposure to regulatory and legislative changes. These and other factors
that could cause results to differ materially from those
described in the forward-looking statements can be found in the
prospectus supplements, the Annual Report on Form 10-K and
other filings made by Texas Capital with the Securities and Exchange
Commission (SEC). |
 Opening Remarks
•
Strong profitability in Q1-2013 with ROA of 1.38% and ROE
15.8% •
Continued reduction in credit costs and improvement in NPAs
•
Strong growth in LHI and deposits in Q1-2013 despite seasonality;
continued growth in DDAs
•
LHS levels seasonally lower, as expected, on a linked quarter basis;
continuing to take advantage of market demand and expect modest
growth for 2013
3 |
 Financial Review
Net Income and EPS
–
Growth in net income and EPS compared to Q4-2012 and
Q1-2012 Operating Leverage, Core Earnings Power & NIM
–
Net Revenue
•
12% growth from Q1-2012
•
4% decrease from Q4-2012 due to seasonal factors for LHS and
reduction in days –
Good growth in LHI average balances
•
Growth of 3% from Q4-2012 despite seasonal weakness
•
Growth of 21% from Q1-2012
–
Margin remained at 4.27%
•
Strong LHI levels with favorable spreads; yields down only
slightly •
Improved funding profile at reduced cost from growth in DDA and total
deposits •
Lower levels in LHS, but strong growth from Q1-2012 and above 2012
average –
Reduced credit costs with reduction in NPAs and low level of
NCOs Capital
–
Capital position enhanced with successful addition of $150 million of
preferred stock 4 |
 Financial Review
Loan Growth
–
•
Averages increased 3% from Q4-2012 and 21% from Q1-2012
–
•
Balances
affected
by
seasonal
factors
but
not
indicative
of
full
year
•
Results remained well above industry trends in mortgage origination
and warehouse Funding
–
Funding profile improved with exceptional DDA and total deposit
growth •
Average DDA increased 7% from Q4-2012 and 49% from
Q1-2012 •
DDA quarter-end balance $98.5 million above Q1-13
average •
Total average deposits increased 7% from Q4-2012 and 29% from
Q1-2012 –
LHS match funded with borrowings and deposits, producing excellent
spreads for highly liquid, short- duration earning
assets Credit Costs
–
Total credit costs of $2.1 million for Q1-2013
•
Provision of $2.0 million compared to $4.5 million in
Q4-2012 •
OREO valuation cost of $71,000 compared to $955,000 in Q4-2012 and
$2.7 million in Q1-2012 •
NCOs of $1.2 million (7 bps) compared to $3.5 million (21 bps) in
Q4-2012 and 6 bps for Q1-2012 –
Favorable trend in NPA ratio with $14.0 million (19%) decrease from
Q4-12, including OREO reduction of $1.6 million (10%)
5
Broad-based growth in LHI
Average LHS balances down 11% from Q4-2012 and up 16% from
Q1-2012 |
 Income Statement -
Quarterly
6
Q1-13
Q4-12
Q3-12
Q2-12
Q1-12
Net interest income
$ 98,042
$ 101,155
$ 96,855
$ 90,640
$ 88,229
Non-interest income
11,281
12,836
10,552
10,462
9,190
Net revenue
109,323
113,991
107,407
101,102
97,419
Provision for credit losses
2,000
4,500
3,000
1,000
3,000
OREO valuation and write-down expense
71
955
64
3,123
2,741
Total provision and OREO valuation
2,071
5,455
3,064
4,123
5,741
Non-interest expense
55,629
59,119
53,457
50,850
49,535
Income before income taxes
51,623
49,417
50,886
46,129
42,143
Income tax expense
18,479
17,982
18,316
16,506
15,062
Net income
33,144
31,435
32,570
29,623
27,081
Preferred stock dividends
81
–
–
–
–
Net income available to common shareholders
$ 33,062
$ 31,435
$ 32,570
$ 29,623
$ 27,081
Diluted EPS
$ .80
$ .76
$ .80
$ .76
$ .70
Net interest margin
4.27%
4.27%
4.36%
4.49%
4.54%
ROA
1.38%
1.27%
1.40%
1.40%
1.33%
ROE
15.82%
15.35%
17.27%
18.08%
17.36%
Efficiency
(1)
50.9%
48.4%
49.8%
50.3%
50.8%
(1) Excludes OREO valuation charge and $4 million litigation
settlement in Q4-12 |
 QTD Average Balances, Yields and Rates
7
(in thousands)
Q1 2013
Q4 2012
Q1 2012
Avg. Bal.
Yield Rate
Avg. Bal.
Yield Rate
Avg. Bal.
Yield Rate
Assets
Securities
$ 93,394
4.57%
$ 103,483
4.55%
$137,509
4.24%
Fed funds sold & liquidity investments
103,503
.23%
91,503
.27%
56,318
.36%
Loans held for sale
2,362,646
3.89%
2,658,092
3.96%
2,036,622
4.21%
Loans held for investment
6,842,766
4.77%
6,662,817
4.79%
5,660,993
5.01%
Total loans, net of reserve
9,130,970
4.58%
9,246,997
4.59%
7,627,354
4.84%
Total earning assets
9,327,867
4.53%
9,441,983
4.55%
7,821,181
4.80%
Total assets
$9,729,559
$9,869,282
$8,209,190
Total interest bearing deposits
$4,988,788
.26%
$4,662,116
.28%
$4,134,976
.34%
Other borrowings
1,041,573
.17%
1,725,129
.19%
1,554,716
.19%
Subordinated notes
111,000
6.68%
111,000
6.56%
–
–
Long-term debt
113,406
2.27%
113,406
2.33%
113,406
2.52%
Total interest bearing liabilities
6,254,767
.40%
6,611,651
.40%
5,803,098
.34%
Demand deposits
2,529,927
2,356,758
1,700,390
Stockholders’
equity
854,327
814,565
627,594
$9,729,559
.26%
$9,869,282
.27%
$8,209,190
.26%
Net interest margin
4.27%
4.27%
4.54%
Liabilities
and
Stockholders’
Equity
Total
liabilities
and
stockholders’
equity |
 Financial Summary
8
(in thousands)
QTD Averages
Q1 2013
Q4 2012
Q1 2012
Q1/Q4 %
Change
YOY %
Change
Total assets
$9,729,559
$9,869,282
$8,209,190
(1)%
19%
Loans held for investment
6,842,766
6,662,817
5,660,993
3%
21%
Loans held for sale
2,362,646
2,658,092
2,036,622
(11)%
16%
Total loans
9,205,412
9,320,909
7,697,615
(1)%
20%
Securities
93,394
103,483
137,509
(10)%
(32)%
Demand deposits
2,529,927
2,356,758
1,700,390
7%
49%
Total deposits
7,518,715
7,018,874
5,835,366
7%
29%
Stockholders’
equity
854,327
814,565
627,594
5%
36% |
 Financial Summary
9
(in thousands)
Period End
Q1 2013
Q4 2012
Q1 2012
Q1/Q4 %
Change
YOY %
Change
Total assets
$10,020,565
$10,540,542
$8,559,917
(5)%
17%
Loans held for investment
6,920,011
6,785,535
5,792,349
2%
19%
Loans held for sale
2,577,830
3,175,272
2,255,281
(19)%
14%
Total loans
9,497,841
9,960,807
8,047,630
(5)%
18%
Securities
87,527
100,195
123,828
(13)%
(29)%
Demand deposits
2,628,446
2,535,375
1,751,443
4%
50%
Total deposits
7,745,831
7,440,804
6,063,558
4%
28%
Stockholders’
equity
1,013,195
836,242
647,341
21%
57% |
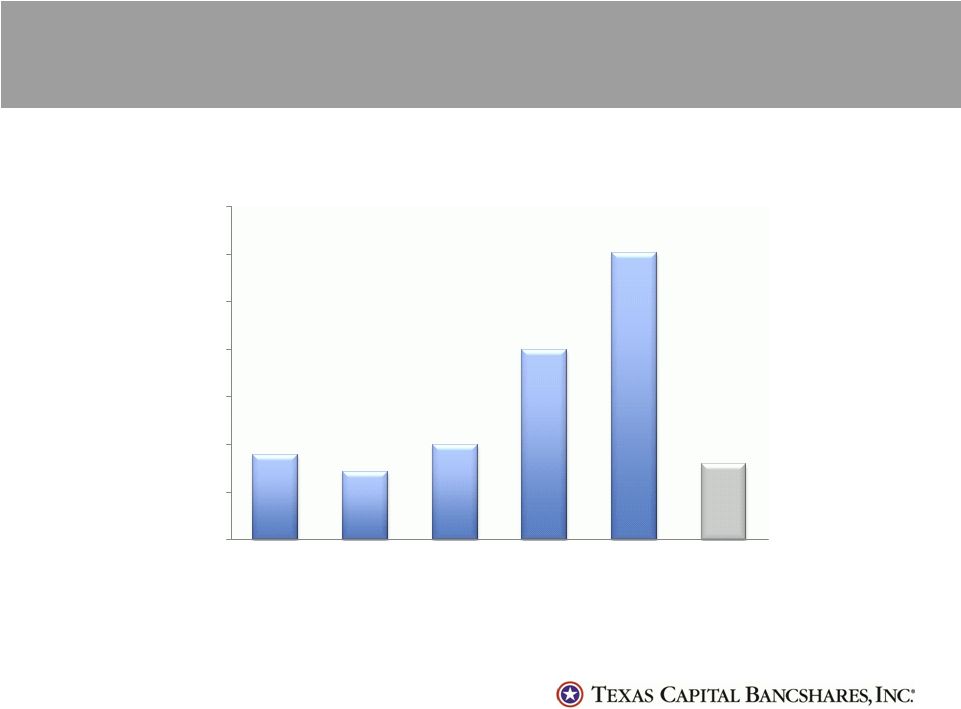
 Revenue and Income Growth
Operating Revenue CAGR: 24%
Net Interest
Income CAGR:
25%
Non-interest Income CAGR: 18%
Non-interest Expense CAGR: 18%
Net Income CAGR: 48%
($ in thousands)
Non-Interest Income
10
(1) Excludes OREO valuation charge for 2012, 2011 and 2010.
0
50,000
100,000
150,000
200,000
250,000
300,000
350,000
400,000
450,000
500,000
2008
2009
2010
2011
2012
Q1
2013
Non
-Interest Expense
Net Interest Income
109,651
137,733
154,985
181,403
212,961
222,516
174,207
225,951
273,937
335,169
419,919
437,292 |
 11
EPS Growth
2008
2009^
2010
2011
2012
5 Year EPS CAGR: 35%
Q1-2013
^Excludes $.15 effect of preferred TARP dividend during 2009. Reported
EPS was $0.56. $0.89
$0.71
$1.00
$1.99
3.01
$0.80
$0.00
$0.50
$1.00
$1.50
$2.00
$2.50
$3.00
$3.50 |
 Demand Deposit CAGR: 42%
Total Deposit CAGR: 22%
Loans Held for Investment CAGR: 14%
Deposit and Loan Growth
($ in millions)
Demand Deposits
12
4028
4457
4711
5572
6786
6920
3333
4121
5455
5557
7441
7746
0
1000
2000
3000
4000
5000
6000
7000
8000
9000
2008
2009
2010
2011
2012
Q1-2013
Loans HFI
Interest Bearing Deposits |
 Loan Portfolio Statistics
13
Non-accrual loans
Commercial
$ 20,814
Construction
–
Real estate
22,504
Consumer
37
Equipment leases
69
Total non-accrual loans
$ 43,424
Non-accrual loans as % of
loans held for investment
.63%
Non-accrual loans as % of
total loans
.46%
OREO
14,426
Total Non-accruals +
OREO
$ 57,850
Non-accrual loans + OREO
as % of loans held for
investment + OREO
.83%
Total Loans $9,497,841
All numbers in thousands.
Loan Collateral by Type 3/31/13 |
 Credit Quality
Improved Credit Trends
–
Total credit cost of $2.1 million for Q1-2013, compared to $5.5
million in Q4-2012 and $5.7 million in Q1-2012
•
Provision of $2.0 million for Q1-2013 compared to $4.5 million for
Q4-2012 and $3.0 million in Q1-2012, reflecting better
credit trends •
NCOs $1.2 million (7 bps) in Q1-2013 compared to 21 bps in
Q4-2012 and 6 bps in Q1- 2012
•
OREO valuation charge of $71,000 compared to $955,000 in Q4-2012
and $2.7 million in Q1-2012
–
NPA ratio continues to decline
•
Reduction of $14.0 million (19%) from Q4-2012 and $24.9 million
(30%) from Q1-2012 •
NPA ratio of .83% compared to 1.06% in Q4-2012 and 1.42% in
Q1-2012 •
NPLs at $43.4 million, down $12.4 million from Q4-2012 and down
$6.7 million from Q1-2012
•
NPL ratio at .46% of total loans and .63% of LHI
•
OREO reduction of $1.6 million (10%) from Q4-2012 and $18.2
million (56%) from Q1- 2012
–
Achieved reduction in credit costs consistent with improvement in
credit metrics 14 |
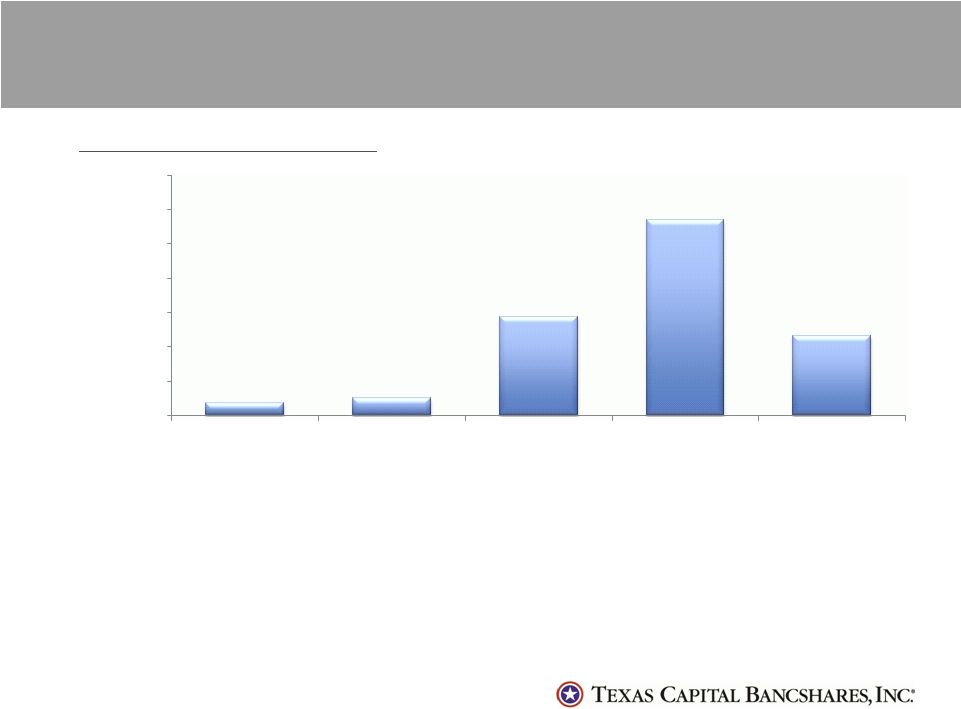 15
Credit Quality
Net Charge-offs / Average Loans
* Excludes loans held for sale.
Combined reserve /
Loans
*
1.14%
1.15%
1.31%
1.56%
1.59%
Non-accrual loans +
OREO to loans
*
+
OREO
.83%
1.06%
1.58%
3.25%
2.74%
Combined reserve to
non-accruals
1.7x
1.3x
1.3x
.6x
.7x
0.07%
0.10%
0.58%
1.14%
0.46%
0.00%
0.20%
0.40%
0.60%
0.80%
1.00%
1.20%
1.40%
2013
2012
2011
2010
2009 |
 Closing Comments
•
Strong
core
earnings
power,
profitability
and
growth
to
continue
in
2013
•
Credit costs continue positive trend
•
Strong LHI pipeline and new commitments present opportunity for growth
potential
•
LHS average balances to remain high with potential for modest growth
with increased market share and participation program
16 |
 Q&A
17 |