Attached files
| file | filename |
|---|---|
| 8-K - REPUBLIC BANCORP, INC. 8-K - REPUBLIC BANCORP INC /KY/ | a50617259.htm |
EXHIBIT 99.1

Slide: 1 Annual Meeting of ShareholdersThursday, April 25, 2013 REPUBLIC BANCORP TM
Slide: 2 Safe Harbor During the course of this presentation, we will be providing you with a discussion of some of the factors we currently anticipate may influence the future results of Republic Bancorp, Inc. (“Republic” or the “Company”), as well as certain financial projections. We want to emphasize that these forward-looking statements involve judgment, and that individual judgments may vary. Moreover, these statements are based on limited information available to us now, which is subject to change. Actual results may differ substantially from what we say today and no one should assume later that the comments we provide today are still valid. They speak only as of today. Specific risk factors that could change causing our projections not to be achieved are discussed in the “Risk Factors” section of our Form 10-K filed with the Securities and Exchange Commission (“SEC”) on March 14, 2013, and other reports filed with the SEC from time to time.

Slide: 3 Steve TragerChairman and Chief Executive Officer

Slide: 4 Highlights Year ended December 31, 2012
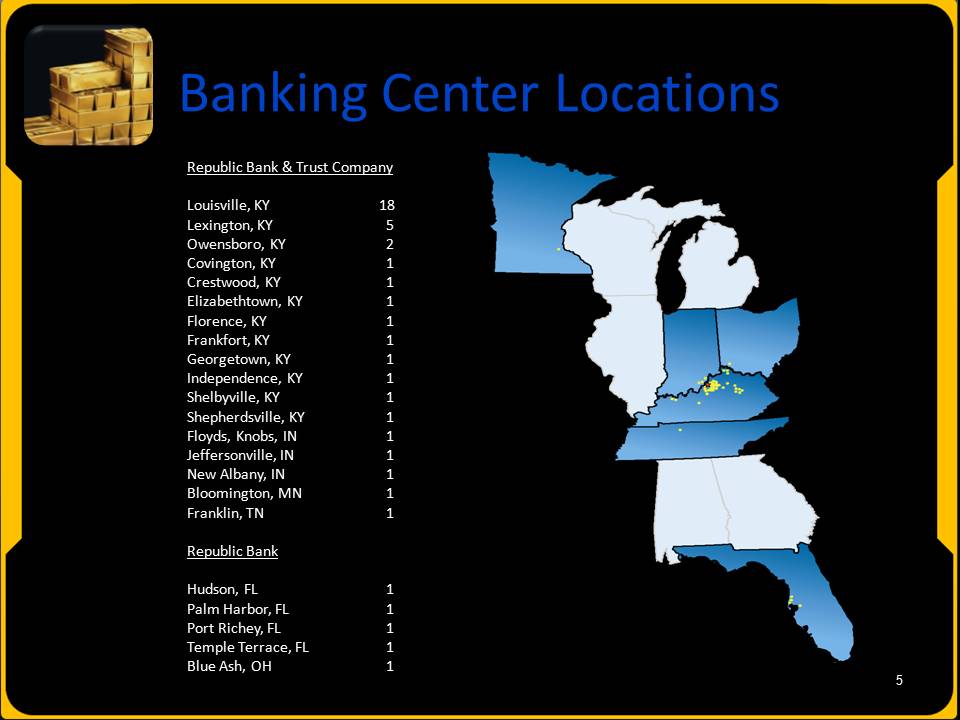
Slide: 5 Republic Bank & Trust Company Louisville, KY 18 Lexington, KY 5 Owensboro, KY 2 Covington, KY 1 Crestwood, KY 1 Elizabethtown, KY 1 Florence, KY 1 Frankfort, KY 1 Georgetown, KY 1 Independence, KY 1 Shelbyville, KY 1 Shepherdsville, KY 1 Floyds, Knobs, IN 1 Jeffersonville, IN 1 New Albany, IN 1 Bloomington, MN 1 Franklin, TN 1 Republic BankHudson, FL 1 Palm Harbor, FL 1 Port Richey, FL 1 Temple Terrace, FL 1 Blue Ash, OH 1 Banking Center Locations
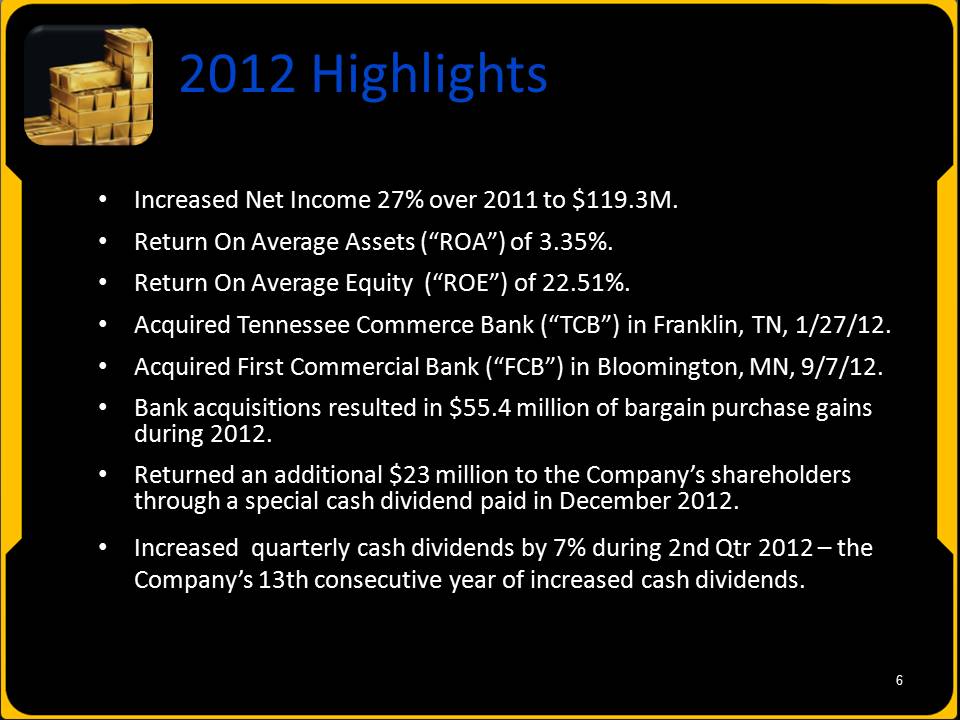
Slide: 6 2012 Highlights Increased Net Income 27% over 2011 to $119.3M.Return On Average Assets (“ROA”) of 3.35%.Return On Average Equity (“ROE”) of 22.51%.Acquired Tennessee Commerce Bank (“TCB”) in Franklin, TN, 1/27/12. Acquired First Commercial Bank (“FCB”) in Bloomington, MN, 9/7/12.Bank acquisitions resulted in $55.4 million of bargain purchase gains during 2012.Returned an additional $23 million to the Company’s shareholders through a special cash dividend paid in December 2012.Increased quarterly cash dividends by 7% during 2nd Qtr 2012 – the Company’s 13th consecutive year of increased cash dividends.
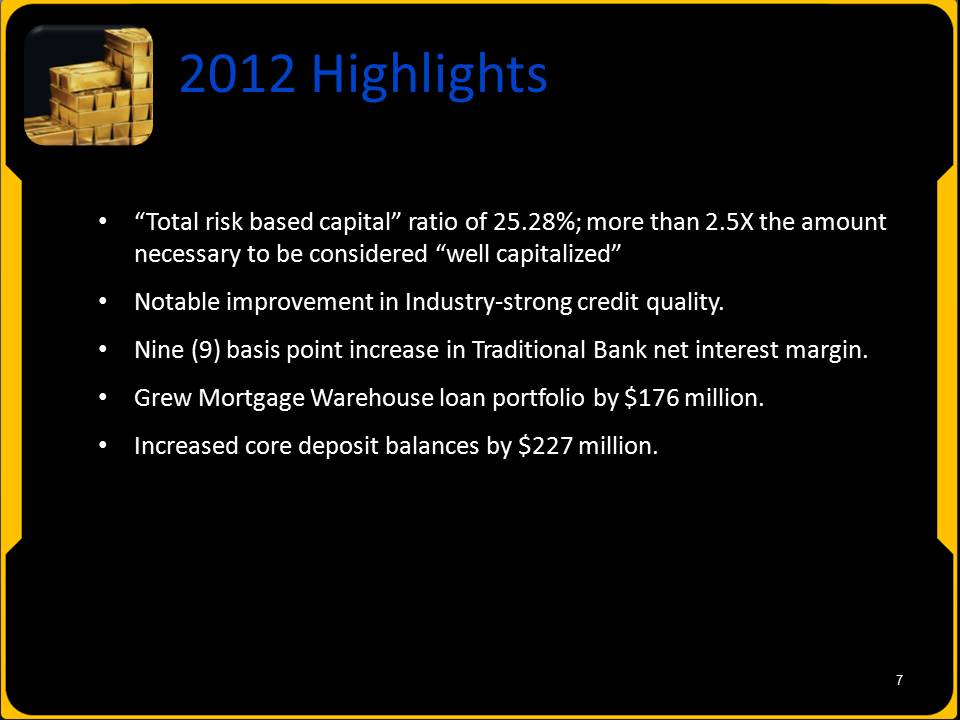
Slide: 7 2012 Highlights “Total risk based capital” ratio of 25.28%; more than 2.5X the amount necessary to be considered “well capitalized”Notable improvement in Industry-strong credit quality.Nine (9) basis point increase in Traditional Bank net interest margin.Grew Mortgage Warehouse loan portfolio by $176 million.Increased core deposit balances by $227 million.
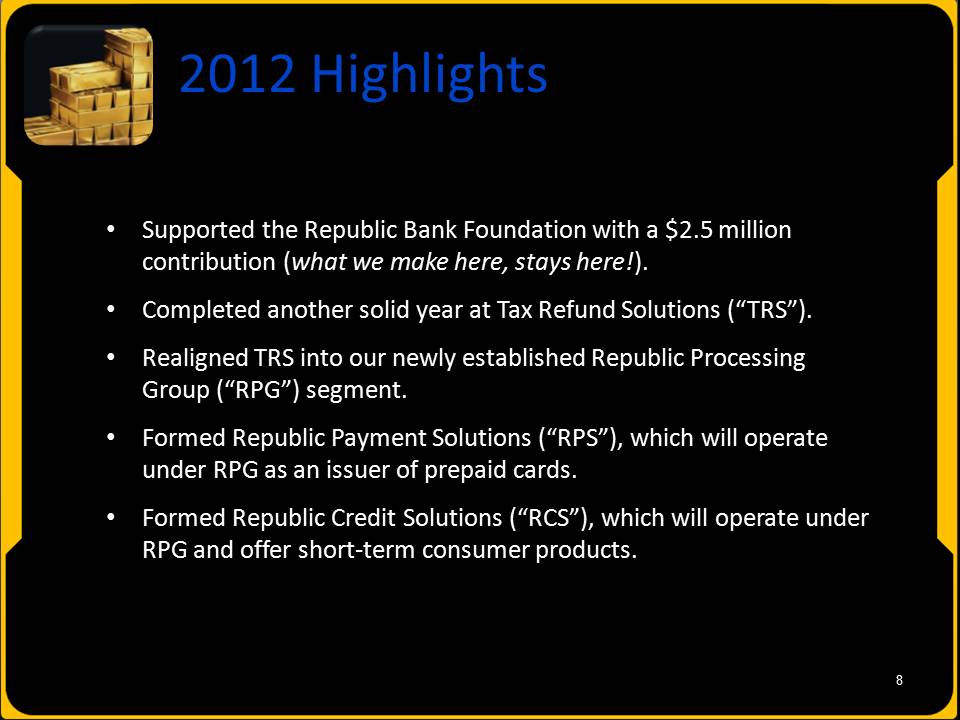
Slide: 8 2012 Highlights Supported the Republic Bank Foundation with a $2.5 million contribution (what we make here, stays here!).Completed another solid year at Tax Refund Solutions (“TRS”). Realigned TRS into our newly established Republic Processing Group (“RPG”) segment.Formed Republic Payment Solutions (“RPS”), which will operate under RPG as an issuer of prepaid cards.Formed Republic Credit Solutions (“RCS”), which will operate under RPG and offer short-term consumer products.
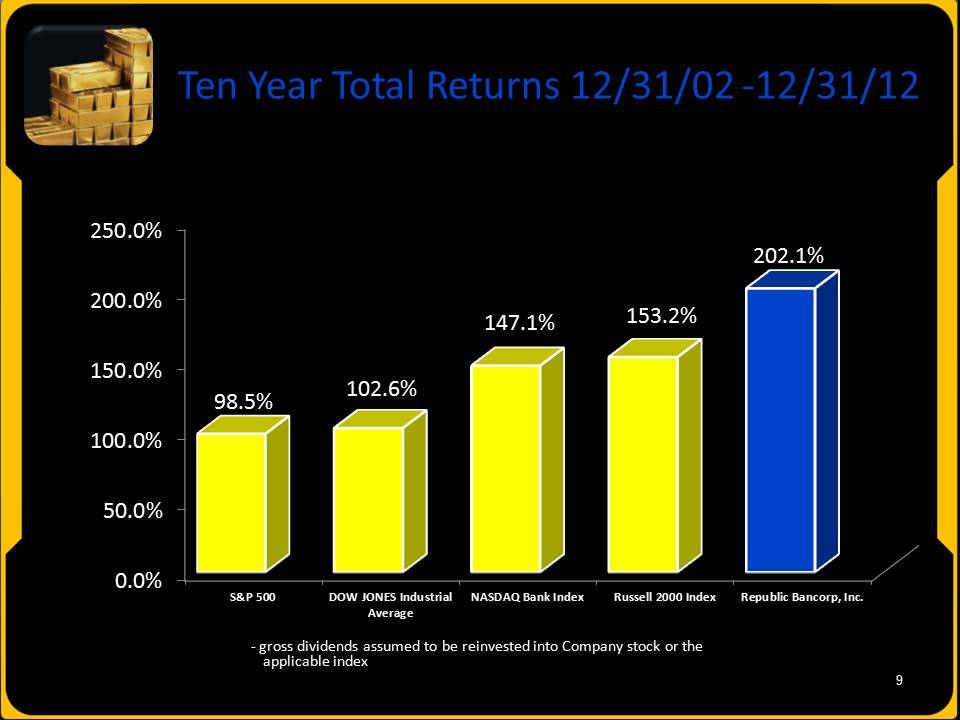
Slide: 9 Ten Year Total Returns 12/31/02 -12/31/12 - gross dividends assumed to be reinvested into Company stock or the applicable index
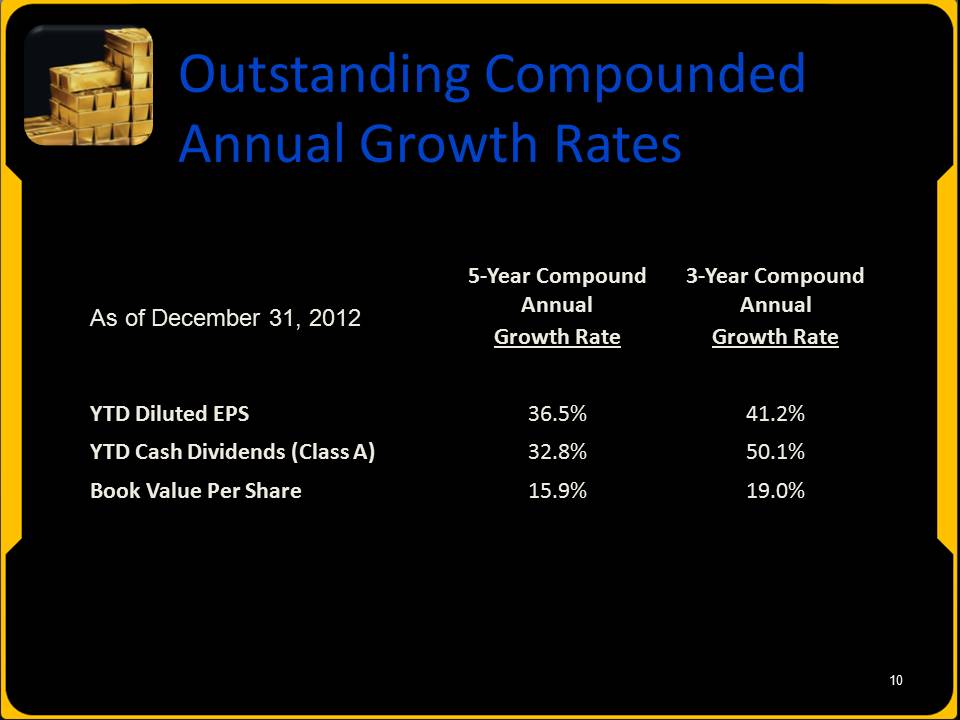
Slide 10: Outstanding Compounded Annual Growth Rates As of December 31, 2012 5‐Year Compound Annual Growth Rate 3‐Year Compound Annual Growth Rate YTD Diluted EPS 36.5% 41.2% YTD Cash Dividends (Class A) 32.8% 50.1% Book Value Per Share 15.9% 19.0%
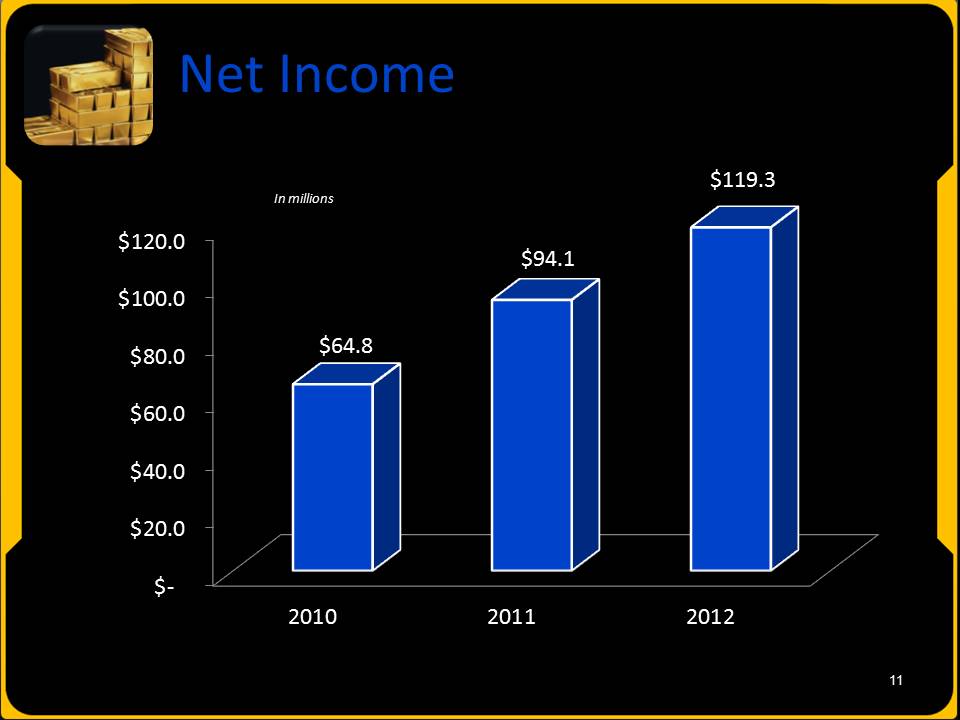
Slide: 11Net Income
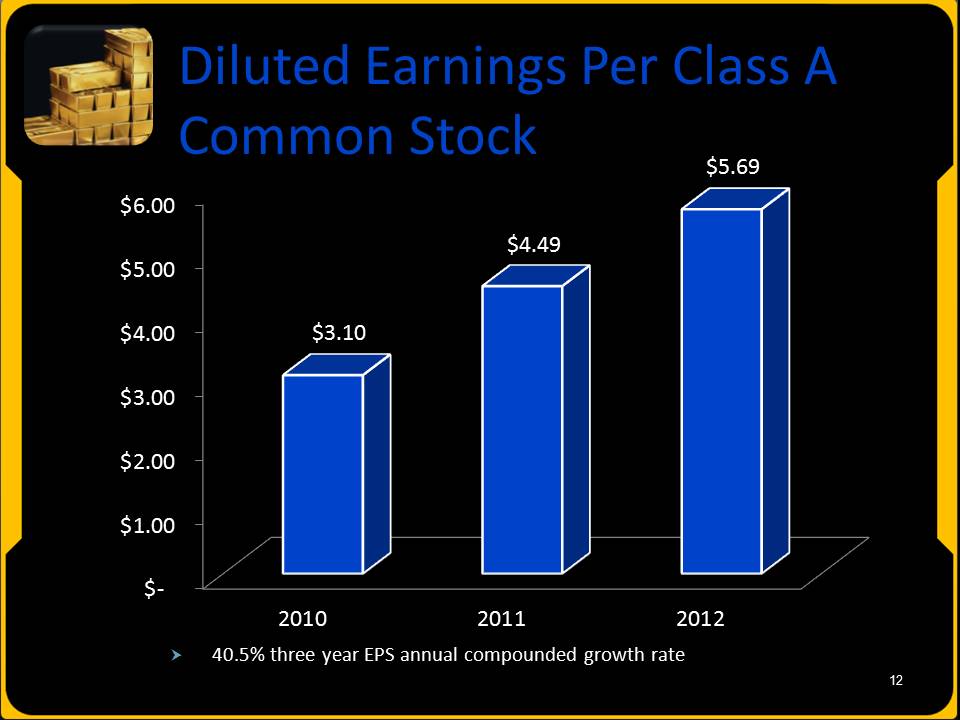
Slide: 12 Diluted Earnings Per Class A Common Stock 40.5% three year EPS annual compounded growth rate

Slide: 13 Balance Sheet
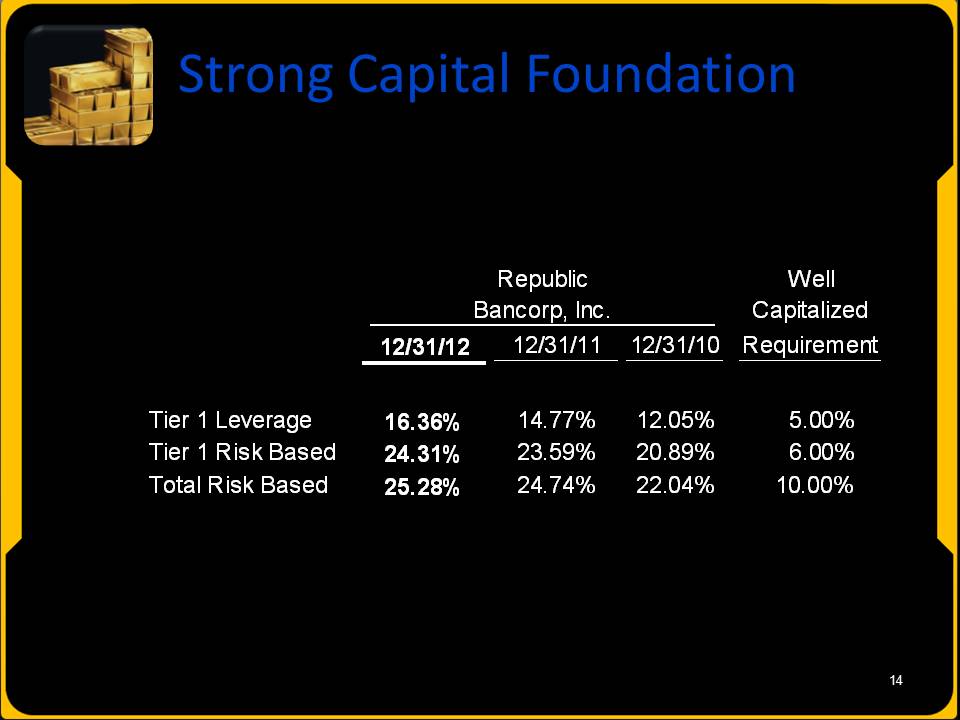
Slide 14: Strong Capital Foundation Republic Well Bancorp, Inc. Capitalized 12/31/12 12/31/11 12/31/10 Requirement Tier 1 Leverage 16.36% 14.77% 12.05% 5.00% Tier 1 Risk Based 24.31% 23.59% 20.89% 6.00% Total Risk Based 25.28% 24.74% 22.04% 10.00%
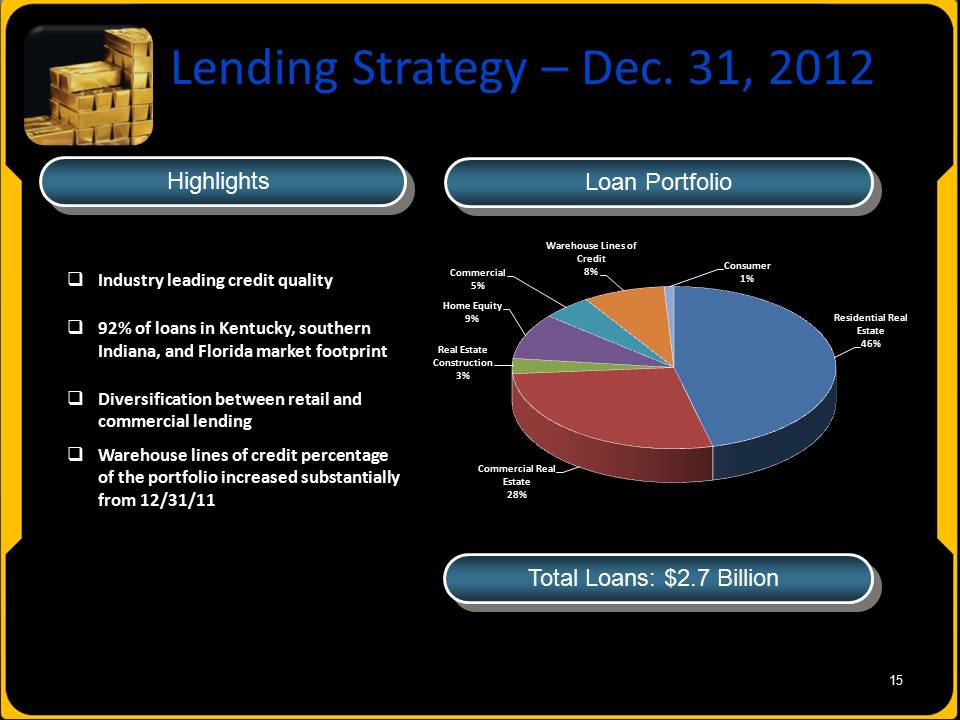
Slide 15: Highlights Loan Portfolio Total Loans: $2.7 Billion Industry leading credit quality 92% of loans in Kentucky, southern Indiana, and Florida market footprint Diversification between retail and commercial lending Warehouse lines of credit percentage of the portfolio increased substantially from 12/31/11 Lending Warehouse Lines of Credit 8% Consumer 1% Real Estate Construction 3% Home Equity 9% Commercial Commercial Real Estate 28% Residential Real Estate 46%
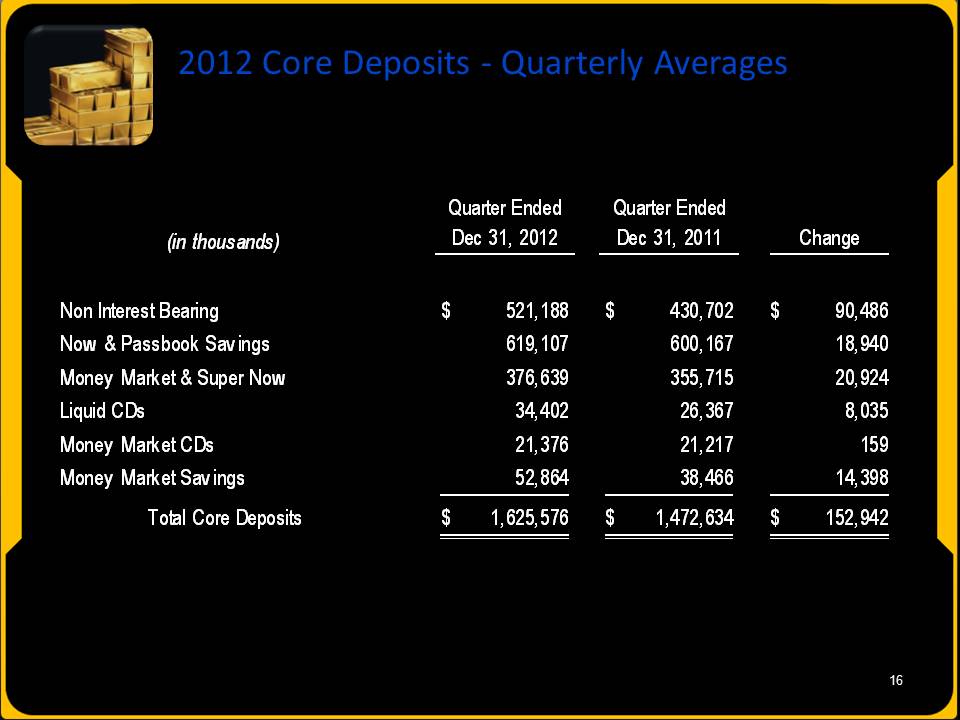
Slide 16: Quarter Ended Quarter Ended (in thousands) Dec 31, 2012 Dec 31, 2011 Change Non Interest Bearing 521,188 $ 430,702 $ 90,486 $ Now & Passbook Sav ings 619,107 600,167 18,940 Money Market & Super Now 376,639 355,715 20,924 Liquid CDs 34,402 26,367 8,035 Money Market CDs 21,376 21,217 159 Money Market Sav ings 52,864 38,466 14,398 Total Core Deposits 1,625,576 $ 1,472,634 $ 152,942 $ 2012 Core Deposits ‐ Quarterly Averages
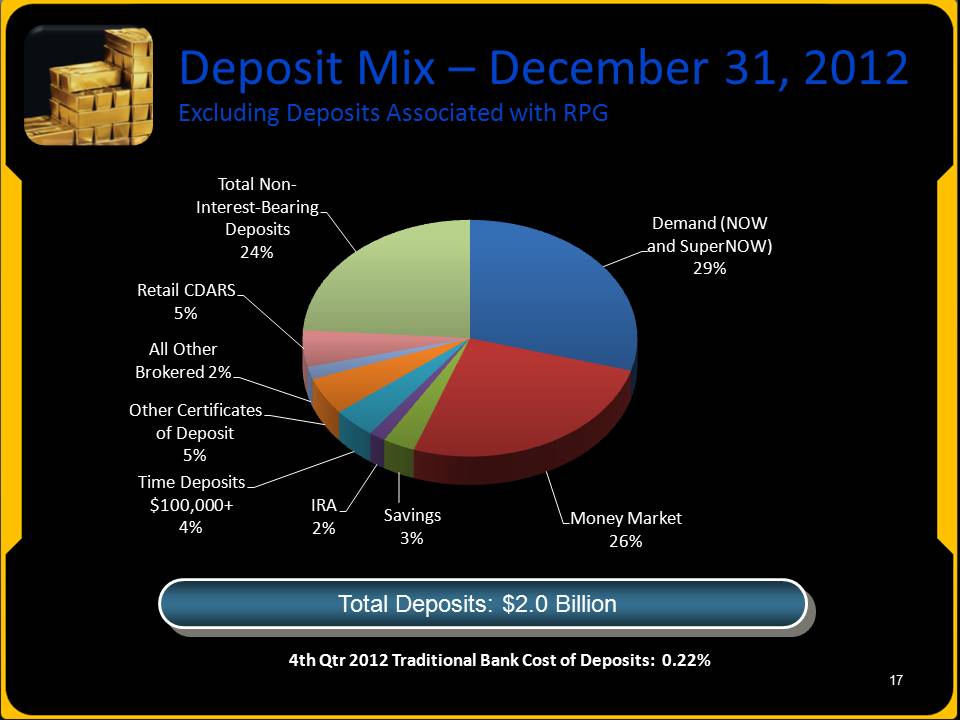
Slide 17: 4th Qtr 2012 Traditional Bank Cost of Deposits: 0.22% Deposit Mix – December 31, 2012 Excluding Deposits Associated with RPG Total Deposits: $2.0 Billion Demand (NOW and SuperNOW) 29% Money Market 26% Savings 3% IRA 2% Time Deposits 100,000+ 4% Other Certificates of Deposit 5% All Other Brokered 2% Retail CDARS 5% Total Non‐ Interest‐Bearing Deposits 24%
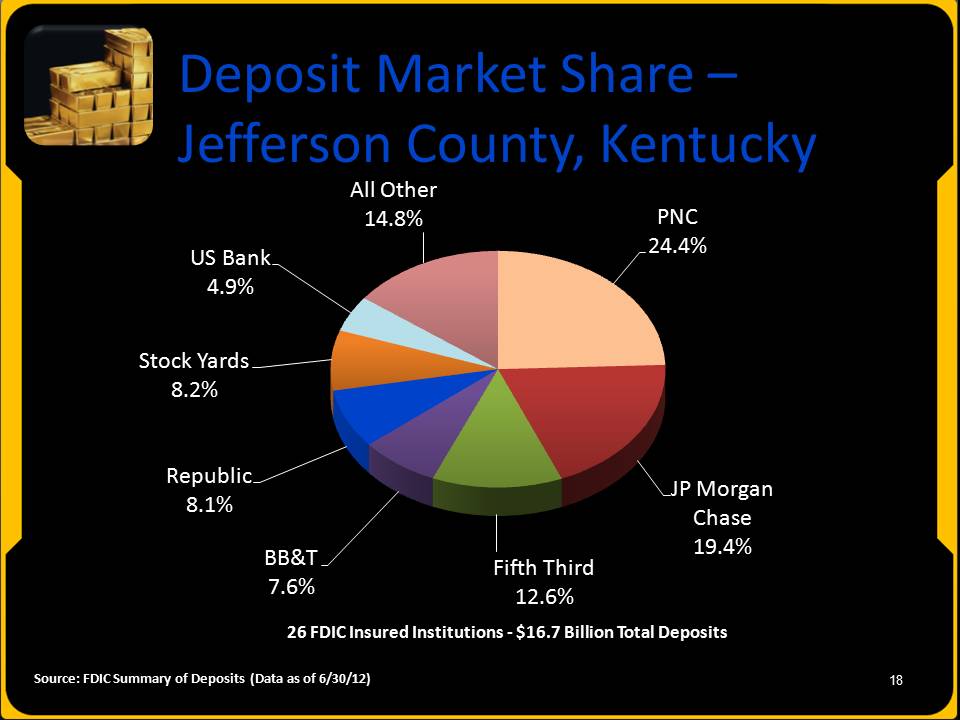
Slide 18: Deposit Market Share – Jefferson County, Kentucky Source: FDIC Summary of Deposits (Data as of 6/30/12) 26 FDIC Insured Institutions ‐ $16.7 Billion Total Deposits PNC 24.4% JP Morgan Chase 19.4% Fifth Third 12.6% BB&T 7.6% Republic 8.1% Stock Yards 8.2% US Bank 4.9% All Other 14.8%

Slide: 19 Industry Strong Credit Quality
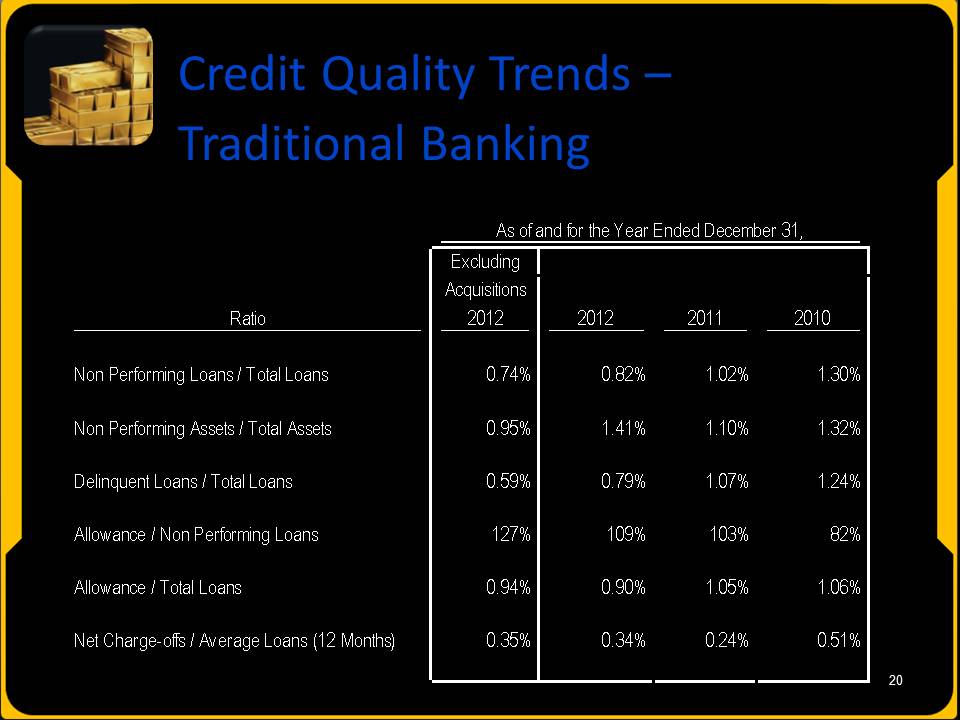
Slide 20: Credit Quality Trends – Traditional Banking Excluding Acquisitions Ratio 2012 2012 2011 2010 Non Performing Loans / Total Loans 0.74% 0.82% 1.02% 1.30% Non Performing Assets / Total Assets 0.95% 1.41% 1.10% 1.32% Delinquent Loans / Total Loans 0.59% 0.79% 1.07% 1.24% Allowance / Non Performing Loans 127% 109% 103% 82% Allowance / Total Loans 0.94% 0.90% 1.05% 1.06% Net Charge-offs / Average Loans (12 Months) 0.35% 0.34% 0.24% 0.51% As of and for the Year Ended December 31,
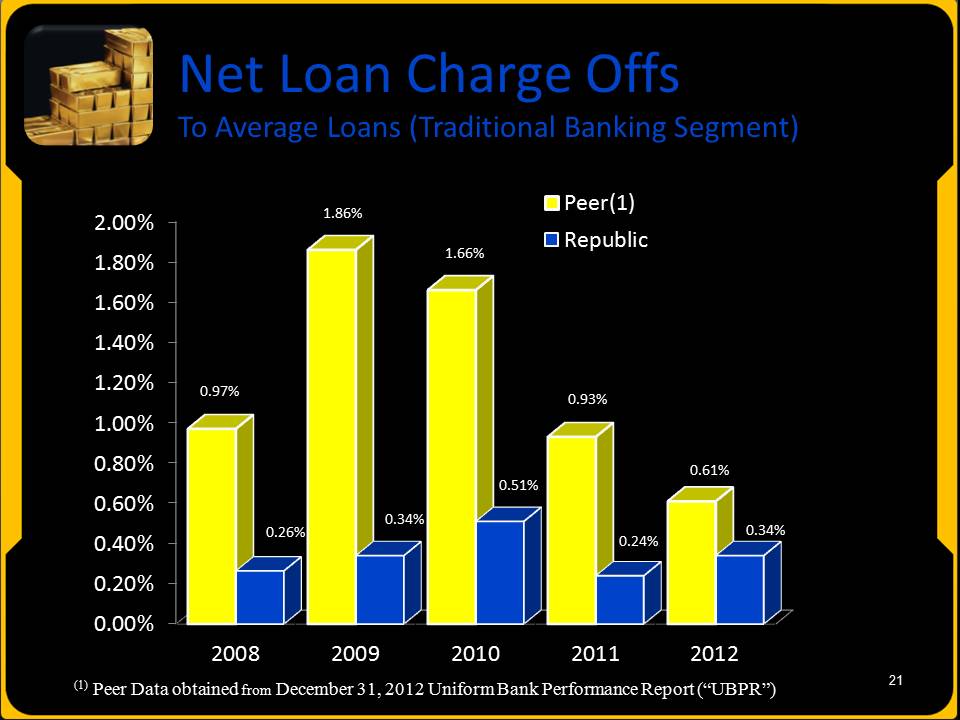
Slide: 21 Net Loan Charge Offs To Average Loans (Traditional Banking Segment) (1) Peer Data obtained from December 31, 2012 Uniform Bank Performance Report (“UBPR”)
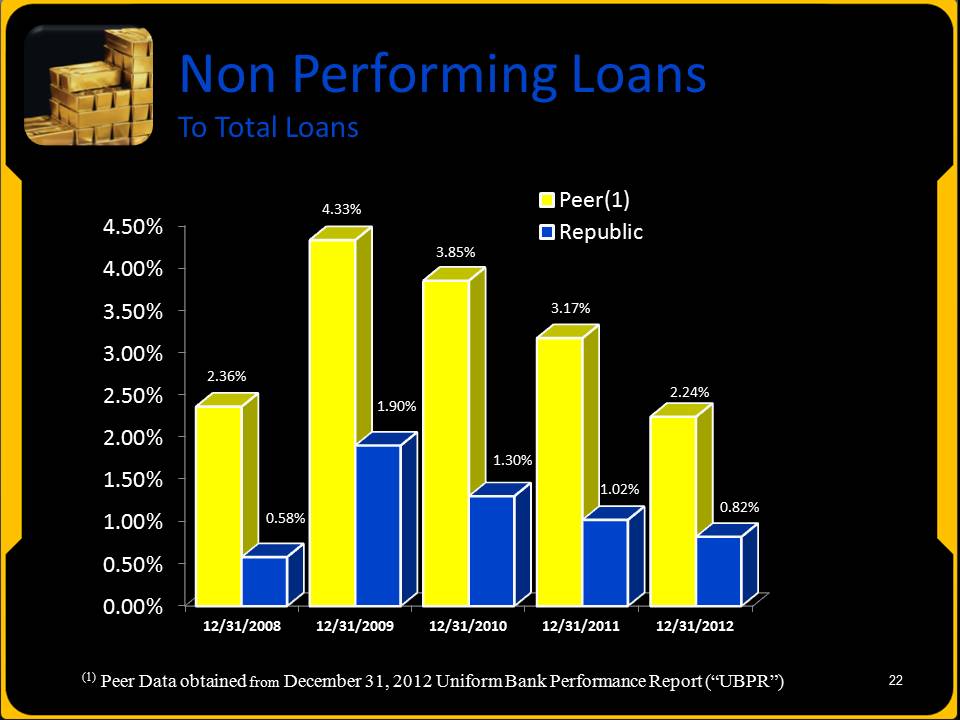
Slide: 22 Non Performing Loans To Total Loans (1) Peer Data obtained from December 31, 2012 Uniform Bank Performance Report (“UBPR”)
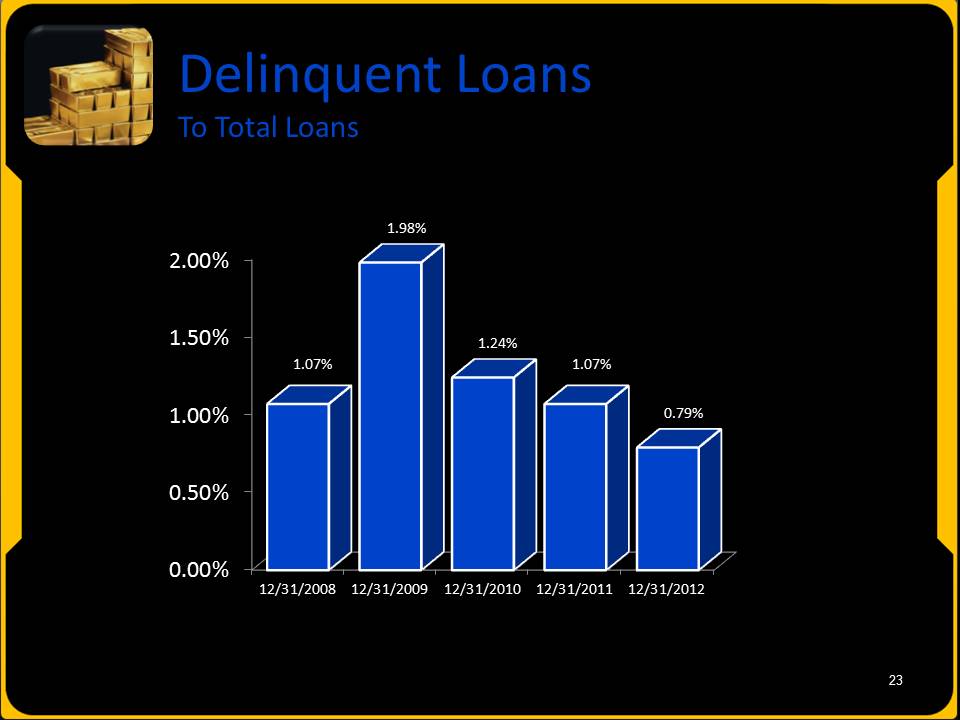
Slide: 23 Delinquent Loans To Total Loans

Slide: 24 Results of Operations
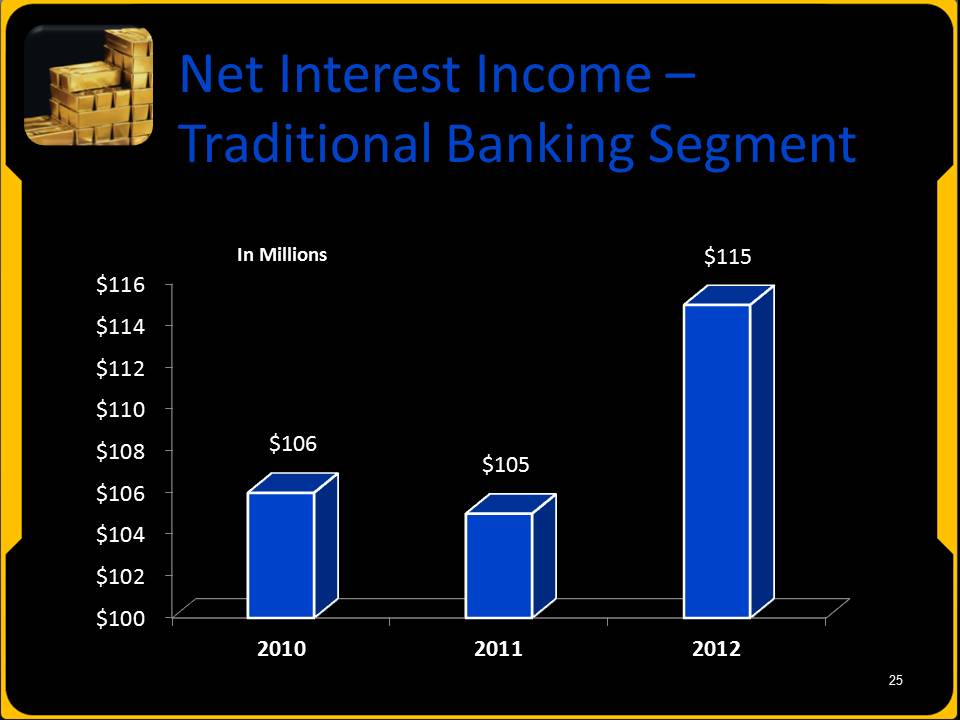
Slide: 25 Net Interest Income – Traditional Banking Segment
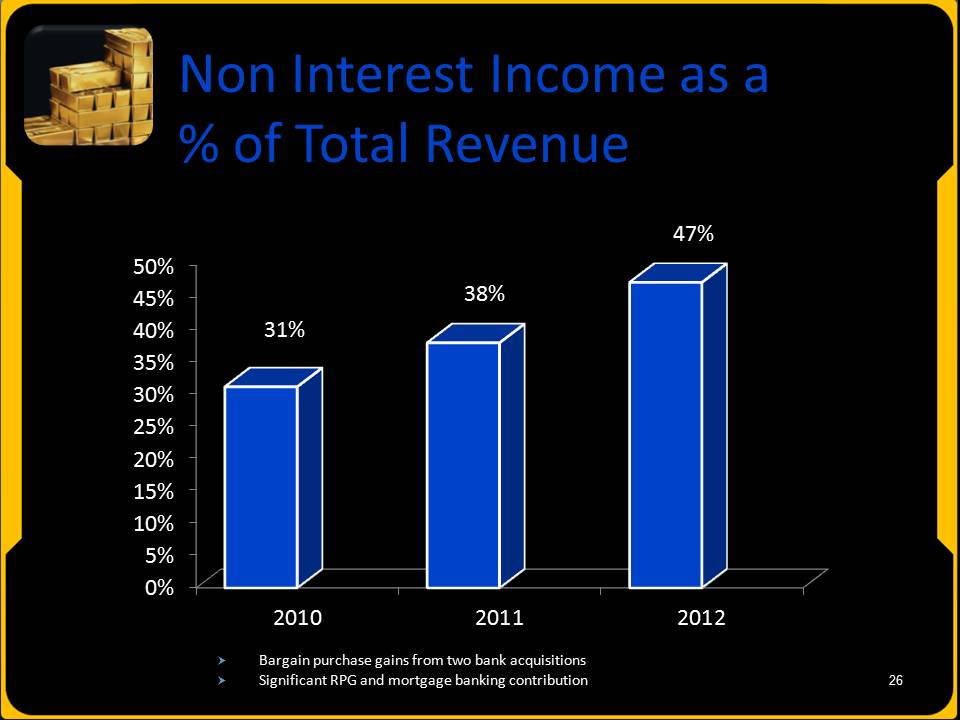
Slide: 26 Non Interest Income as a % of Total Revenue Bargain purchase gains from two bank acquisitions Significant RPG and mortgage banking contribution
Slide: 27 Highlights First Quarter 2013
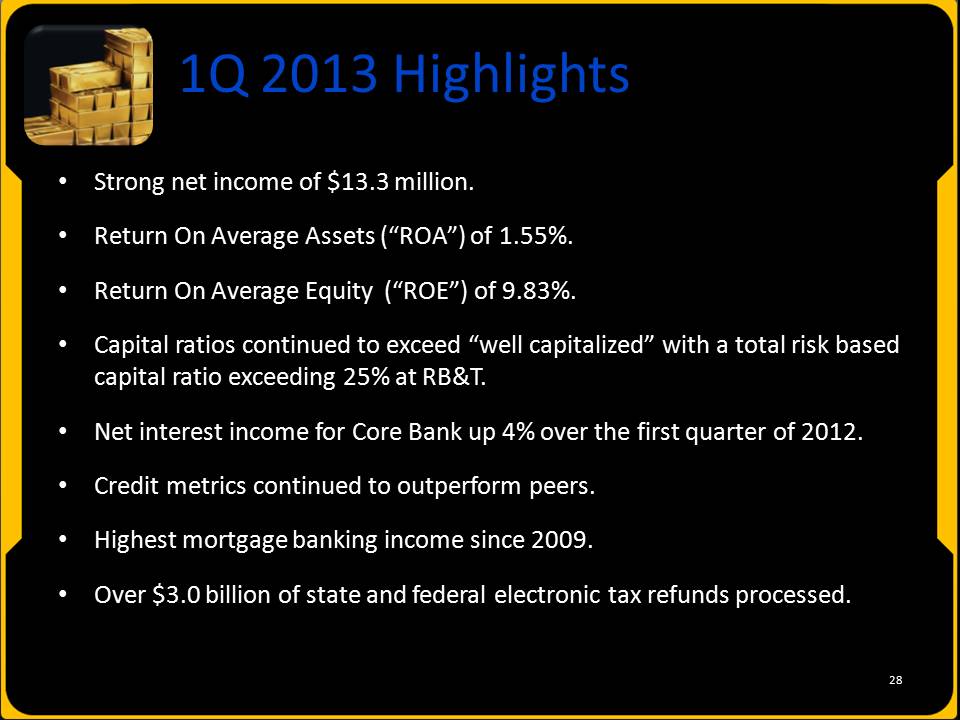
Slide: 28 1Q 2013 Highlights Strong net income of $13.3 million. Return On Average Assets (“ROA”) of 1.55%. Return On Average Equity (“ROE”) of 9.83%. Capital ratios continued to exceed “well capitalized” with a total risk based capital ratio exceeding 25% at RB&T. Net interest income for Core Bank up 4% over the first quarter of 2012. Credit metrics continued to outperform peers.Highest mortgage banking income since 2009. Over $3.0 billion of state and federal electronic tax refunds processed.
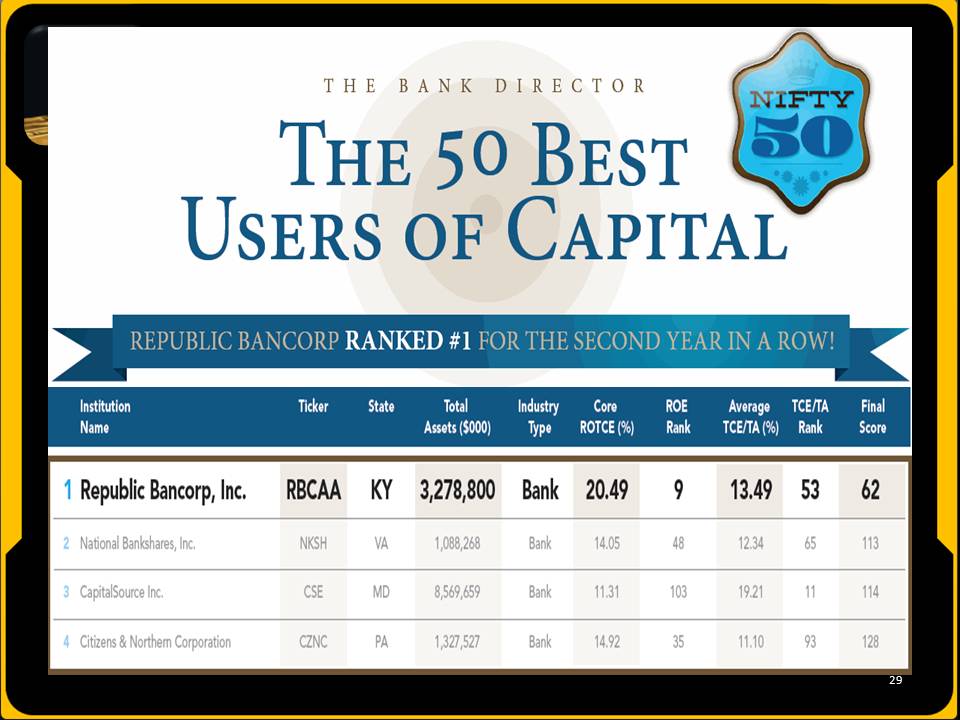
Slide: 29
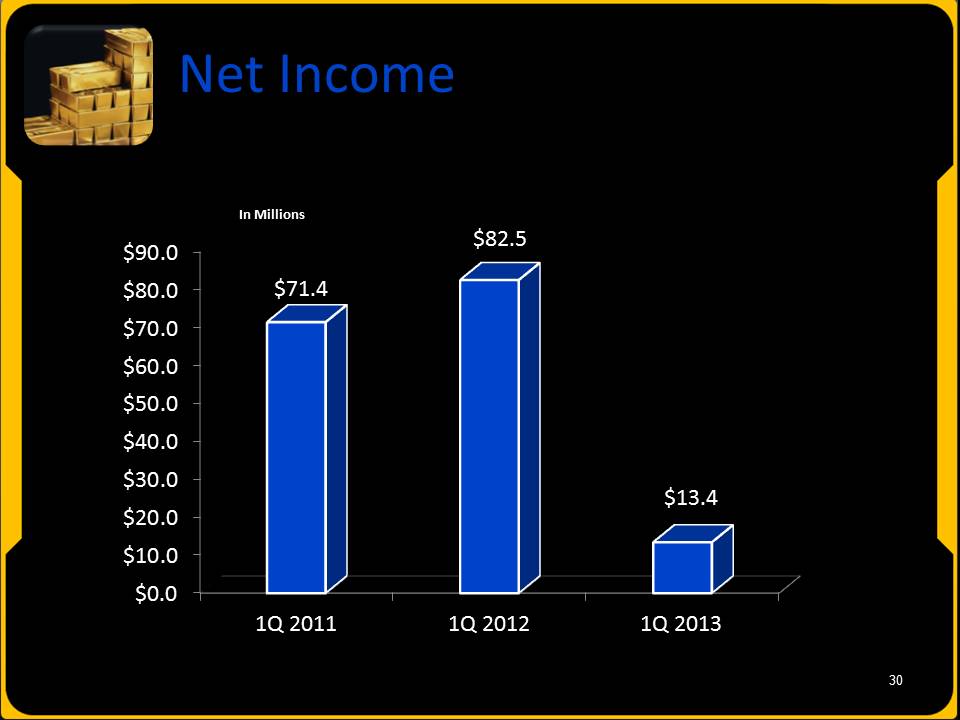
Slide: 30 Net Income
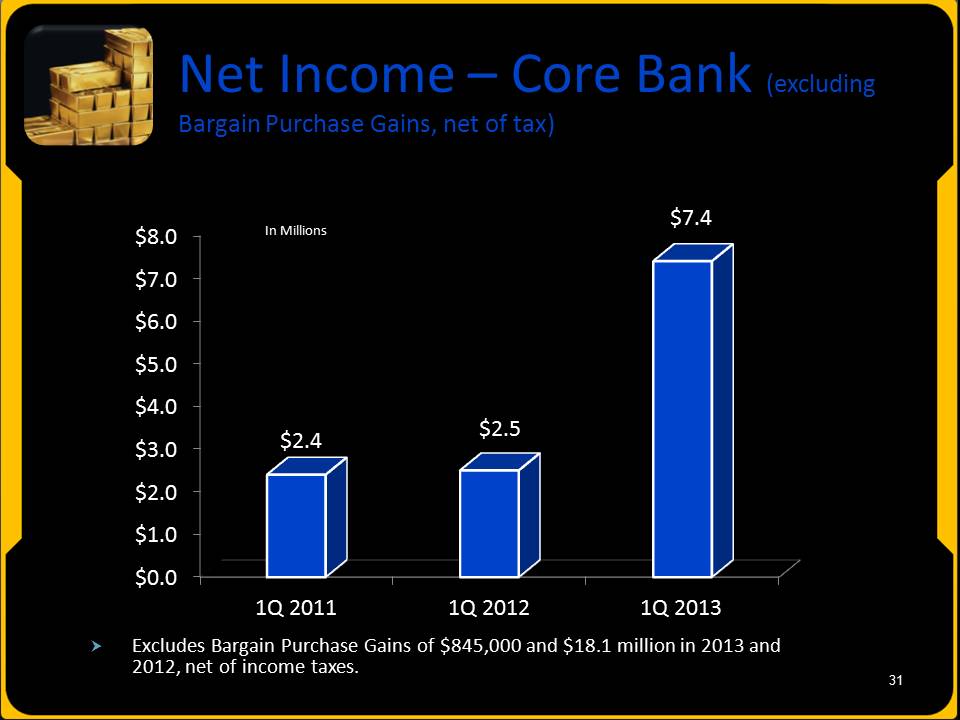
Slide: 31 Net Income – Core Bank (excluding Bargain Purchase Gains, net of tax) Excludes Bargain Purchase Gains of $845,000 and $18.1 million in 2013 and 2012, net of income taxes.
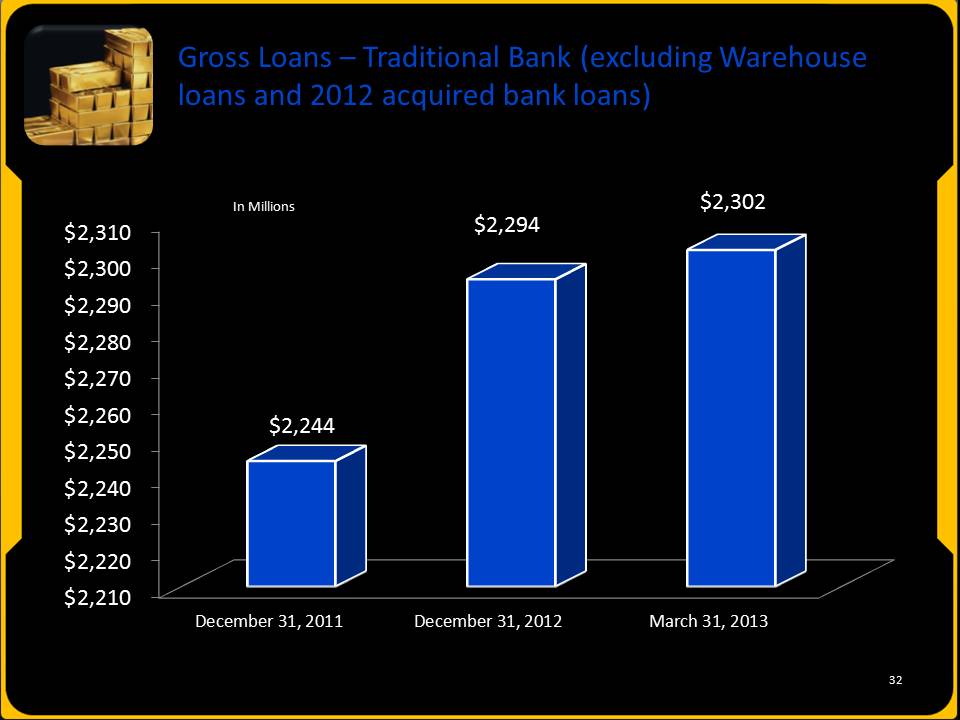
Slide: 32 Gross Loans – Traditional Bank (excluding Warehouse loans and 2012 acquired bank loans)
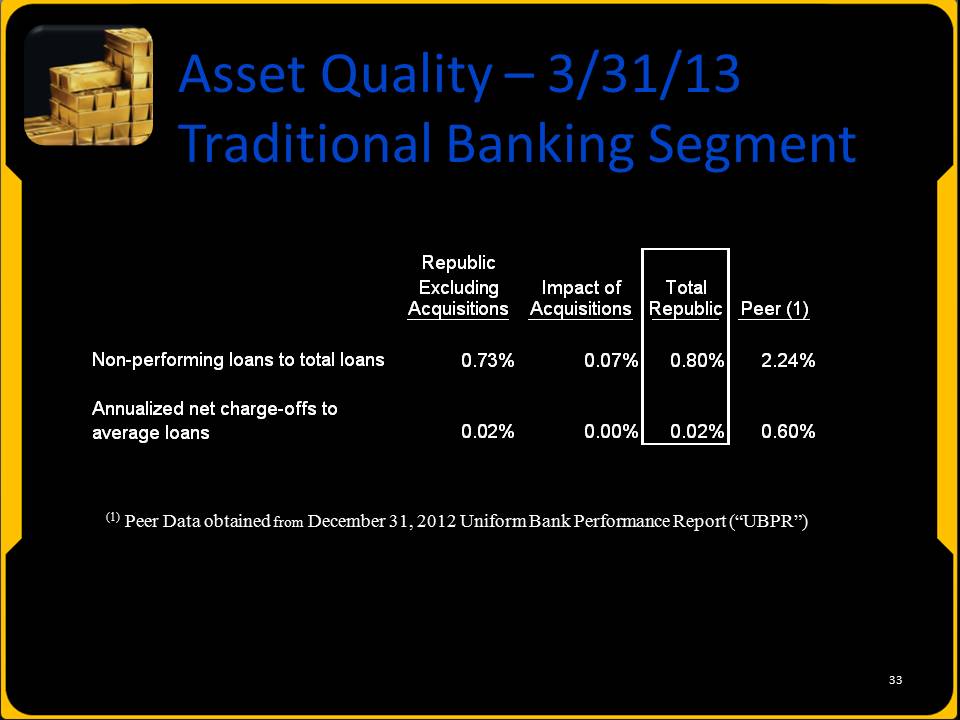
Slide 33: Asset Quality – 3/31/13 Traditional Banking Segment 33 (1) Peer Data obtained from December 31, 2012 Uniform Bank Performance Report (“UBPR”) Republic Excluding Impact of Total Acquisitions Acquisitions Republic Peer (1) Non-performing loans to total loans 0.73% 0.07% 0.80% 2.24% Annualized net charge-offs to average loans 0.02% 0.00% 0.02% 0.60%
Slide: 34 Ongoing Initiatives Make additional acquisitions with a focus in the near-term toward FDIC-assisted deals. Grow traditional loan portfolios – commercial and retail loans. Grow product lines – Warehouse Lending, Credit Card, and Debit Card income. Expand new lines of business – Prepaid Cards, Short-term credit products. Increase secondary market loan production. Add strategically located banking centers in Nashville and Minneapolis.Continue to outperform peer financial performance. Focus on core deposit growth initiatives.Continue to improve on already solid loan quality metrics. Reposition tax business.
Slide: 35 Future Challenges Growing net interest margin for all banks in current rate environment. Secondary market demand makes growing portfolio difficult. Extensive competition for A+ loan credits. Political uncertainty causing many customers to sit on the sideline. Consumer Financial Protection Bureau (“CFPB”) begins to issue regulations.

Slide: 36 We were here for you yesterday.We are here for you today.We will be here for you tomorrow.

Slide: 37 THANK YOU