Attached files
| file | filename |
|---|---|
| EX-99.1 - PRESS RELEASE AND TABLES - PARKER HANNIFIN CORP | exhibit9913qfy13.htm |
| 8-K - 8-K - PARKER HANNIFIN CORP | form8-k3qfy13.htm |

3rd Quarter FY2013 Earnings Release Parker Hannifin Corporation April 25, 2013 Exhibit 99.2

Forward-Looking Statements Forward-looking statements contained in this and other written and oral reports are made based on known events and circumstances at the time of release, and as such, are subject in the future to unforeseen uncertainties and risks. All statements regarding future performance, earnings projections, events or developments are forward-looking statements. It is possible that the future performance and earnings projections of the company, including its individual segments, may differ materially from current expectations, depending on economic conditions within its mobile, industrial and aerospace markets, and the company's ability to maintain and achieve anticipated benefits associated with announced realignment activities, strategic initiatives to improve operating margins, actions taken to combat the effects of the current economic environment, and growth, innovation and global diversification initiatives. A change in the economic conditions in individual markets may have a particularly volatile effect on segment performance. Among other factors which may affect future performance are: changes in business relationships with and purchases by or from major customers, suppliers or distributors, including delays or cancellations in shipments, disputes regarding contract terms or significant changes in financial condition, changes in contract cost and revenue estimates for new development programs and changes in product mix; ability to identify acceptable strategic acquisition targets; uncertainties surrounding timing, successful completion or integration of acquisitions; ability to realize anticipated cost savings from business realignment activities; threats associated with and efforts to combat terrorism; uncertainties surrounding the ultimate resolution of outstanding legal proceedings, including the outcome of any appeals; competitive market conditions and resulting effects on sales and pricing; increases in raw material costs that cannot be recovered in product pricing; the company’s ability to manage costs related to insurance and employee retirement and health care benefits; and global economic factors, including manufacturing activity, air travel trends, currency exchange rates, difficulties entering new markets and general economic conditions such as inflation, deflation, interest rates and credit availability. The company makes these statements as of the date of this disclosure, and undertakes no obligation to update them unless otherwise required by law. 2
Non-GAAP Financial Measures This presentation reconciles sales amounts reported in accordance with U.S. GAAP to sales amounts adjusted to remove the effects of acquisitions made within the prior four quarters and the effects of currency exchange rates. This presentation also reconciles cash flow from operating activities as a percent of sales in accordance with U.S. GAAP to cash flow from operating activities as a percent of sales without the effect of a discretionary pension plan contribution. The effects of acquisitions, currency exchange rates and the discretionary pension plan contribution are removed to allow investors and the company to meaningfully evaluate changes in sales and cash flow from operating activities as a percent of sales on a comparable basis from period to period. 3
Agenda 4 • CEO 3rd Quarter FY2013 Highlights • Key Performance Measures & Outlook • CEO Closing Comments • Questions and Answers

Highlights 3rd Quarter FY2013 Sales • Slightly down year over year • Organic revenues decreased 6% • Acquisitions contributed 4% • Signs global economy bottoming out Earnings & Margins • Achieved $257m or $1.68 per diluted share • Decreased International volume • Acquisition, divestiture & integration expenses • Strong operating margins of 14.0% Cash Flow • Generated $371m or 11.2% of sales • 5% dividend increase 5

Diluted Earnings Per Share 3rd Quarter FY2013 6 $1.68 $2.01 $4.46 $5.49 0.00 1.00 2.00 3.00 4.00 5.00 6.00 Q3 FY13 Q3 FY12 YTD FY13 YTD FY12

2.01 0.03 0.02 0.05 0.05 0.24 1.68 1 2 2 FY12 Q3 Actual Share Impact Corp G&A Other Expense Tax Segment Operating Income * FY13 Q3 ActualInfluences on Earnings 3rd Quarter FY2013 vs. 3rd Quarter FY2012 * Segment Operating Income decline mainly due to Industrial International 7

Sales & Operating Margin 3rd Quarter FY2013 - Total Parker 8 $ in millions FY2013 % Change FY2012 FY2013 % Change FY2012 Sales As reported 3,307$ (2.5)% 3,394$ 9,588$ (1.5)% 9,734$ Acquisitions 134 3.9 % 344 3.5 % Currency (24) (0.7)% (134) (1.4)% Adjusted Sales 3,197$ (5.7)% 9,378$ (3.6)% Operating Margin As reported 463$ 511$ 1,293$ 1,473$ % of Sales 14.0 % 15.1 % 13.5 % 15.1 % 3rd Quarter Total Year

Sales & Operating Margin 3rd Quarter FY2013 - Industrial North America 9 $ in millions FY2013 % Change FY2012 FY2013 % Change FY2012 Sales As reported 1,284$ (2.4)% 1,315$ 3,748$ 1.2 % 3,703$ Acquisitions 72 5.5 % 170 4.6 % Currency (1) (0.1)% 1 0.0 % Adjusted Sales 1,213$ (7.8)% 3,577$ (3.4)% Operating Margin As reported 209$ 227$ 620$ 646$ % of Sales 16.3 % 17.3 % 16.5 % 17.4 % Total Year3rd Quarter
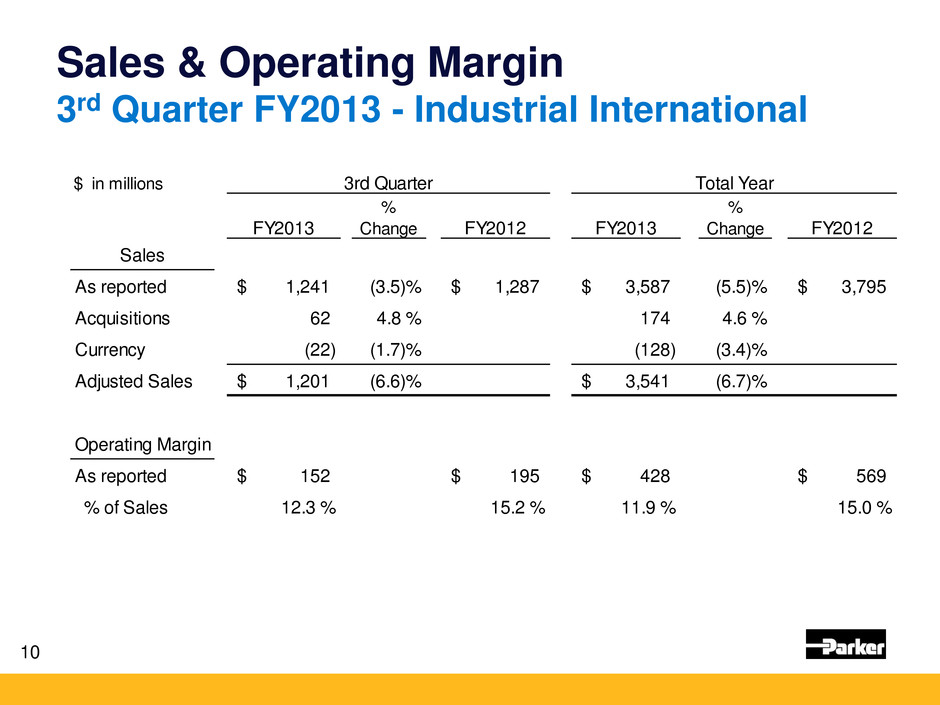
Sales & Operating Margin 3rd Quarter FY2013 - Industrial International 10 $ in millions FY2013 % Change FY2012 FY2013 % Change FY2012 Sales As reported 1,241$ (3.5)% 1,287$ 3,587$ (5.5)% 3,795$ Acquisitions 62 4.8 % 174 4.6 % Currency (22) (1.7)% (128) (3.4)% Adjusted Sales 1,201$ (6.6)% 3,541$ (6.7)% Operating Margin As reported 152$ 195$ 428$ 569$ % of Sales 12.3 % 15.2 % 11.9 % 15.0 % 3rd Quarter Total Year

Sales & Operating Margin 3rd Quarter FY2013 - Aerospace 11 $ in millions FY2013 % Change FY2012 FY2013 % Change FY2012 Sales As reported 578$ 6.5 % 543$ 1,648$ 7.2 % 1,537$ Acquisitions - - % - - % Currency - - % (3) (0.1)% Adjusted Sales 578$ 6.5 % 1,651$ 7.3 % Operating Margin As reported 80$ 66$ 194$ 205$ % of Sales 13.9 % 12.1 % 11.8 % 13.3 % 3rd Quarter Total Year

Sales & Operating Margin 3rd Quarter FY2013 - Climate & Industrial Controls 12 $ in millions FY2013 % Change FY2012 FY2013 % Change FY2012 Sales As reported 204$ (18.0)% 249$ 605$ (13.5)% 699$ Acquisitions - - % - - % Currency (1) (0.3)% (4) (0.6)% Adjusted Sales 205$ (17.7)% 609$ (12.9)% Operating Margin As reported 21$ 23$ 51$ 53$ % of Sales 10.5 % 9.3 % 8.5 % 7.6 % 3rd Quarter Total Year

Order Rates 13 Excludes Acquisitions, Divestitures & Currency 3-month year-over-year comparisons of total dollars, except Aerospace Aerospace is calculated using a 12-month rolling average Mar 2013 Dec 2012 Mar 2012 Dec 2011 Total Parker 7 %- 2 %- 2 %+ 3 %+ Industrial North America 10 %- 6 %- 7 %+ 8 %+ Industrial International 7 %- 5 %- 1 %- 1 %+ Aerospace 0 %+ 14 %+ 4 %+ 0 %+ Climate & Industrial Controls 1 %- 1 %+ 6 %- 5 %-

Balance Sheet Summary • Cash • Working capital • Accounts receivable • Inventory • Accounts payable 14
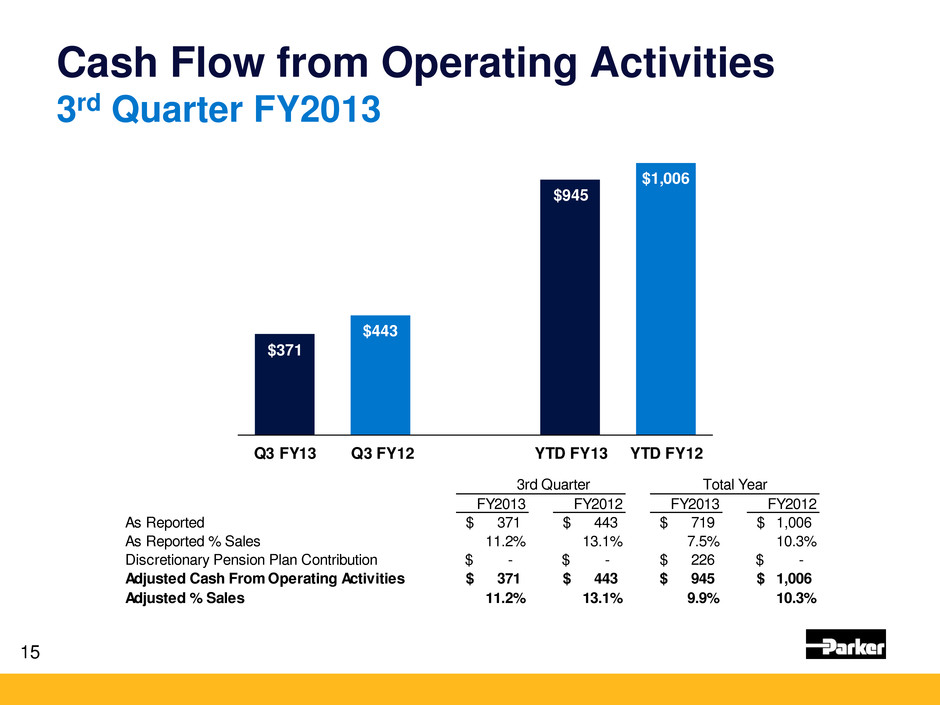
Cash Flow from Operating Activities 3rd Quarter FY2013 15 3rd Quarter Total Year FY2013 FY2012 FY2013 FY2012 As Reported 371$ 443$ 719$ 1,006$ As Reported % Sales 11.2% 13.1% 7.5% 10.3% Discretionary Pension Plan Contribution -$ -$ 226$ -$ Adjusted Cash From Operating Activities 371$ 443$ 945$ 1,006$ Adjusted % Sales 11.2% 13.1% 9.9% 10.3% $371 $443 $945 $1,006 Q3 FY13 Q3 FY12 YTD FY13 YTD FY12

Guidance Assumptions Sales & Segment Operating Margins 16 FY 2013 Sales Change versus FY 2012 Total Parker (1.7)% -- 0.7% Industrial North America (0.1)% -- 1.9 % Industrial International (4.3)% -- (1.5)% Aerospace 7.1 % -- 9.1 % Climate & Industrial Controls (14.8)% -- (12.4)% FY 2013 Segment Operating Margin Percentages Total Parker 13.9 % -- 14.1 % Industrial North America 16.8 % -- 17.0 % Industrial International 12.4 % -- 12.8 % Aerospace 12.3 % -- 12.5 % Climate & Industrial Controls 9.6 % -- 10.0 %

Guidance Assumptions Below Segment Operating Income Items (+/- 1.3%) • Corporate Admin, Interest and Other Expense (Income) • $471M at Midpoint • Tax Rate • 28.0% • Shares Outstanding • 152.2M 17

6.45 0.03 0.03 6.45 FY13 Full Year Guidance @Q2 Segment Operating Income Other Items (Below the Line) FY13 Full Year Guidance @Q3 Maintained Midpoint of FY2013 Guidance Range Narrowed 18 Low Midpoint High Diluted Earnings Per Share 6.25$ 6.45$ 6.65$

19

Appendix • Consolidated Statement of Income • Business Segment Information By Industry • Consolidated Balance Sheet • Consolidated Statement of Cash Flows

Consolidated Statement of Income 21 (Unaudited) Three Months Ended March 31, Nine Months Ended March 31, (Dollars in thousands except per share amounts) 2013 2012 2013 2012 Net sales 3,307,041$ 3,393,563$ 9,587,471$ 9,734,276$ Cost of sales 2,569,189 2,590,315 7,468,608 7,386,079 Gross profit 737,852 803,248 2,118,863 2,348,197 Selling, general and administrative expenses 379,690 377,479 1,141,912 1,132,635 Interest expense 23,050 22,313 70,775 69,303 Other (income) expense, net (3,439) 2,629 (31,062) (5,100) Income before income taxes 338,551 400,827 937,238 1,151,359 Income taxes 81,959 88,138 259,584 298,169 Net income 256,592 312,689 677,654 853,190 Less: Noncontrolling interests 32 615 391 3,332 Net inco e attributable to common shareholders 256,560$ 312,074$ 677,263$ 849,858$ Earnings per share attributable to common shareholders: Basic earnings per share 1.72$ 2.07$ 4.54$ 5.61$ Diluted earnings per share 1.68$ 2.01$ 4.46$ 5.49$ Average shares outstanding during period - Basic 149,287,628 151,017,910 149,191,583 151,472,380 Average shares outstanding during period - Diluted 152,360,612 154,944,246 151,853,522 154,904,549
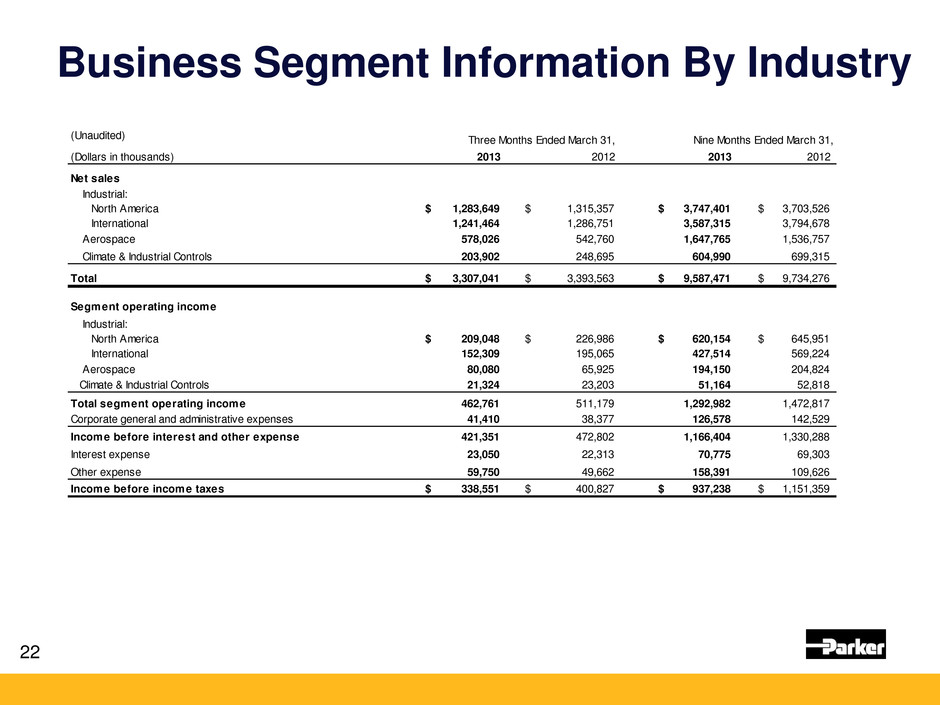
Business Segment Information By Industry 22 (Unaudited) Three Months Ended March 31, Nine Months Ended March 31, (Dollars in thousands) 2013 2012 2013 2012 Net sales Industrial: North America 1,283,649$ 1,315,357$ 3,747,401$ 3,703,526$ International 1,241,464 1,286,751 3,587,315 3,794,678 Aerospace 578,026 542,760 1,647,765 1,536,757 Climate & Industrial Controls 203,902 248,695 604,990 699,315 Total 3,307,041$ 3,393,563$ 9,587,471$ 9,734,276$ Segment operating income Industrial: North America 209,048$ 226,986$ 620,154$ 645,951$ International 152,309 195,065 427,514 569,224 Aerospace 80,080 65,925 194,150 204,824 Climate & Industrial Controls 21,324 23,203 51,164 52,818 Total segment operating income 462,761 511,179 1,292,982 1,472,817 Corporate general and administrative expenses 41,410 38,377 126,578 142,529 Income before interest and other expense 421,351 472,802 1,166,404 1,330,288 Interest expense 23,050 22,313 70,775 69,303 Other expense 59,750 49,662 158,391 109,626 Income before income taxes 338,551$ 400,827$ 937,238$ 1,151,359$

Consolidated Balance Sheet 23 (Unaudited) March 31, June, 30 March 31, (Dollars in thousands) 2013 2012 2012 Assets Current assets: Cash and cash equivalents 1,677,319$ 838,317$ 773,459$ Accounts receivable, net 2,017,126 1,992,284 2,061,501 Inventories 1,473,072 1,400,732 1,429,014 Prepaid expenses 136,268 137,429 100,336 Deferred income taxes 134,724 129,352 132,991 Total current assets 5,438,509 4,498,114 4,497,301 Plant and equipment, net 1,829,715 1,719,968 1,721,970 Goodw ill 3,229,827 2,925,856 2,926,311 Intangible assets, net 1,313,990 1,095,218 1,096,306 Other assets 859,731 931,126 647,236 Total assets 12,671,772$ 11,170,282$ 10,889,124$ Liabilities and equity Current liabilities: Notes payable 1,527,696$ 225,589$ 273,907$ Accounts payable 1,162,125 1,194,684 1,148,939 Accrued liabilities 838,376 911,931 872,547 Accrued domestic and foreign taxes 120,352 153,809 193,907 Total current liabilities 3,648,549 2,486,013 2,489,300 Long-term debt 1,496,026 1,503,946 1,515,217 Pensions and other postretirement benefits 1,693,048 1,909,755 848,521 Deferred income taxes 127,159 88,091 141,467 Other liabilities 294,582 276,747 308,151 Shareholders' equity 5,409,058 4,896,515 5,577,592 Noncontrolling interests 3,350 9,215 8,876 Total liabilities and equity 12,671,772$ 11,170,282$ 10,889,124$

Consolidated Statement of Cash Flows 24 (Unaudited) Nine Months Ended March 31, (Dollars in thousands) 2013 2012 Cash flows from operating activities: Net income 677,654$ 853,190$ Depreciation and amortization 250,574 244,403 Stock incentive plan compensation 65,516 64,102 Net change in receivables, inventories, and trade payables (13,743) (191,071) Net change in other assets and liabilities (258,332) 85,060 Other, net (2,870) (49,223) Net cash provided by operating activities 718,799 1,006,461 Cash flows from investing activities: Acquisitions (net of cash of $33,932 in 2013 and $6,802 in 2012) (620,647) (31,004) Capital expenditures (214,061) (154,097) Proceeds from sale of plant and equipment 24,321 15,560 Proceeds from sale of business 72,190 - Other, net (9,375) (16,381) Net cash (used in) investing activities (747,572) (185,922) Cash flows from financing activities: Net payments for common stock activity (125,325) (312,545) Acquisition of noncontrolling interests (1,072) (147,441) Net proceeds from debt 1,186,679 47,763 Dividends (187,705) (178,606) Net cash provided by (used in) financing activities 872,577 (590,829) Effect of exchange rate changes on cash (4,802) (113,717) Net increase in cash and cash equivalents 839,002 115,993 Cash and cash equivalents at beginning of period 838,317 657,466 Cash and cash equivalents at end of period 1,677,319$ 773,459$
