Attached files
| file | filename |
|---|---|
| EX-99.1 - EXHIBIT 99.1 - OCCIDENTAL PETROLEUM CORP /DE/ | ex99_1-20130425.htm |
| EX-99.3 - EXHIBIT 99.3 - OCCIDENTAL PETROLEUM CORP /DE/ | ex99_3-20130425.htm |
| EX-99.5 - EXHIBIT 99.5 - OCCIDENTAL PETROLEUM CORP /DE/ | ex99_5-20130425.htm |
| 8-K - FORM 8-K - OCCIDENTAL PETROLEUM CORP /DE/ | form8k-20130425.htm |
| EX-99.2 - EXHIBIT 99.2 - OCCIDENTAL PETROLEUM CORP /DE/ | ex99_2-20130425.htm |
EXHIBIT 99.4

Occidental Petroleum Corporation
First Quarter 2013 Earnings Conference Call
April 25, 2013
1

First Quarter 2013 Earnings - Highlights
• Core Income - $1.4 billion in 1Q13 vs. $1.6 billion in
1Q12 or $1.5 billion in 4Q12.
1Q12 or $1.5 billion in 4Q12.
– EPS $1.69 (diluted) vs. $1.92 (diluted) in 1Q12 or $1.83 in 4Q12.
– Compared to 4Q12, current quarter results reflected higher
realized oil prices, reduced operating expenses in the oil and
gas business and higher earnings in the midstream segment,
which were offset by lower volumes in the Middle East/North
Africa, as a result of planned maintenance turnarounds, and
higher DD&A rates.
realized oil prices, reduced operating expenses in the oil and
gas business and higher earnings in the midstream segment,
which were offset by lower volumes in the Middle East/North
Africa, as a result of planned maintenance turnarounds, and
higher DD&A rates.
2
See Significant Items Affecting Earnings in the Investor Relations Supplemental Schedules
2

Variance Analysis - 1Q13 vs. 4Q12
• Higher realized oil prices and
lower operating expenses offset
by lower Middle East/North Africa
volumes and higher DD&A rates.
lower operating expenses offset
by lower Middle East/North Africa
volumes and higher DD&A rates.
• Lower sales volumes in Middle
East / North Africa, mostly due to
timing of liftings, as well as the
effects of the maintenance
turnarounds in Qatar and full cost
recovery under a contract in
Oman, reduced 1Q13 earnings by
~$200 million after tax, compared
to 4Q12.
East / North Africa, mostly due to
timing of liftings, as well as the
effects of the maintenance
turnarounds in Qatar and full cost
recovery under a contract in
Oman, reduced 1Q13 earnings by
~$200 million after tax, compared
to 4Q12.
• Costs associated with the
turnarounds, pipeline disruptions
in Colombia and other factors
further reduced our earnings by
about $30 million after tax.
turnarounds, pipeline disruptions
in Colombia and other factors
further reduced our earnings by
about $30 million after tax.
• These lower volumes and costs
reduced the oil and gas earnings
by ~$450 million on pre-tax basis.
reduced the oil and gas earnings
by ~$450 million on pre-tax basis.
($ in millions)
Core Results for
1Q13 of $1.9 B vs.
$2.5 B in 1Q12 or
$2.3 B in 4Q12.
1Q13 of $1.9 B vs.
$2.5 B in 1Q12 or
$2.3 B in 4Q12.
First Quarter 2013 Earnings - Oil & Gas Segment
3

4
• 1Q13 production costs were $13.93 per barrel,
compared with $14.99 per barrel for FY 2012.
compared with $14.99 per barrel for FY 2012.
– Lower costs were attributable to our domestic operations
where production costs were $3.37 per barrel lower in the first
quarter of 2013 from the full year of 2012, already beating our
previous guidance.
where production costs were $3.37 per barrel lower in the first
quarter of 2013 from the full year of 2012, already beating our
previous guidance.
– In our Middle East/North Africa operations, operating costs
increased about $2.50 per barrel on a sequential quarterly
basis. This increase was due to the planned maintenance
turnaround in our Qatar North Dome and South Dome fields
and to a lesser extent, the planned turnaround in Dolphin.
increased about $2.50 per barrel on a sequential quarterly
basis. This increase was due to the planned maintenance
turnaround in our Qatar North Dome and South Dome fields
and to a lesser extent, the planned turnaround in Dolphin.
First Quarter 2013 Earnings - Oil & Gas Segment
Production Costs
Production Costs
4

5
1Q13 1Q12 4Q12
• Oil and Gas Production (mboe/d) 763 755 779
• Approximately 13,000 barrels of the total sequential decrease in quarterly production
came from Qatar and Dolphin where the planned maintenance impacted production.
came from Qatar and Dolphin where the planned maintenance impacted production.
• The turnarounds were executed successfully and production has returned to normal
levels
levels
• Domestic production was 478 mboe/d, an increase of 3 mboe/d from 4Q12 and the
tenth consecutive quarterly domestic volume record for the company.
tenth consecutive quarterly domestic volume record for the company.
– Production was 5% higher than 1Q12.
– Almost all of the net sequential quarterly increase came from production in the
Permian.
Permian.
– Liquids production was flat compared to 4Q12, reflecting a drop in production in
our Long Beach operations resulting from the effect of lower spending on our
production sharing contract there, slightly lower production elsewhere in
California in the steam flood operations, offset by higher production in other
areas, mainly in the Permian and Williston.
our Long Beach operations resulting from the effect of lower spending on our
production sharing contract there, slightly lower production elsewhere in
California in the steam flood operations, offset by higher production in other
areas, mainly in the Permian and Williston.
First Quarter 2013 Earnings - Oil & Gas Segment
Production Volumes
Production Volumes
Details regarding country-specific production levels available in the IR Supplemental Schedules
5

6
• Latin America volumes were 31 mboe/d, which was 1 mboe/d
lower compared to 4Q12 and 5 mboe/d higher than 1Q12.
lower compared to 4Q12 and 5 mboe/d higher than 1Q12.
– The reduction from 4Q12 was due to a heightened level of insurgent
activity impacting production.
activity impacting production.
• In the Middle East / North Africa, volumes were 254 mboe/d,
a decrease of 18 mboe/d from 4Q12 and 20 mboe/d from 1Q12.
a decrease of 18 mboe/d from 4Q12 and 20 mboe/d from 1Q12.
– A planned maintenance turnaround in Qatar reduced production
13 mboe/d.
13 mboe/d.
– The impact of full cost recovery and other factors affecting production
sharing and similar contracts reduced 1Q13 production volumes by an
additional 5 mboe/d compared to 4Q12.
sharing and similar contracts reduced 1Q13 production volumes by an
additional 5 mboe/d compared to 4Q12.
• Middle East/North Africa sales volumes were further lower
than production volumes in the first quarter of 2013 due to
the timing of liftings.
than production volumes in the first quarter of 2013 due to
the timing of liftings.
First Quarter 2013 Earnings - Oil & Gas Segment
Production Volumes
Production Volumes
Details regarding country specific production levels available in the IR Supplemental Schedules
6

7
First Quarter 2013 Earnings - Oil & Gas Segment
1Q13 1Q12
Reported Segment Income ($mm) $1,920 $2,504
WTI Oil Price ($/bbl) $94.37 $102.93
Brent Oil Price ($/bbl) $112.64 $118.35
NYMEX Gas Price ($/mcf) $3.37 $2.83
Oxy’s Realized Prices
Worldwide Oil ($/bbl) $98.07 $107.98
-9% year-over-year
Worldwide NGLs ($/bbl) $40.27 $52.51
-23% year-over-year
US Natural Gas ($/mcf) $3.08 $2.84
+8% year-over-year
7

8
• Realized oil prices for 1Q13 represented 104% of the
average WTI price and 87% of the average Brent price.
average WTI price and 87% of the average Brent price.
• Realized NGL prices were 43% of the average WTI price
and realized domestic gas prices were 91% of the average
NYMEX price.
and realized domestic gas prices were 91% of the average
NYMEX price.
• At current global prices, a $1 per bbl change in oil prices
affects our quarterly earnings before income taxes by
$37 mm and $7 mm for a $1 per bbl change in NGL prices.
affects our quarterly earnings before income taxes by
$37 mm and $7 mm for a $1 per bbl change in NGL prices.
• A change in domestic gas prices of 50 cents per mmBTUs
affects quarterly pre-tax earnings by about $30 mm.
affects quarterly pre-tax earnings by about $30 mm.
• These price change sensitivities include the impact of
production-sharing and similar contract volume changes.
production-sharing and similar contract volume changes.
First Quarter 2013 Earnings - Oil & Gas Segment
Realized Prices
Realized Prices
8

9
• Taxes other than on income, which are generally related to
product prices, were $2.63 per boe for 1Q13, compared with
$2.39 per boe for the full year of 2012.
product prices, were $2.63 per boe for 1Q13, compared with
$2.39 per boe for the full year of 2012.
– The 2013 amount includes California greenhouse gas expense of
$0.05 per barrel.
$0.05 per barrel.
• 1Q13 exploration expense was $50 mm.
– We expect 1Q13 exploration expense to be about $100 mm for seismic
and drilling in our exploration programs.
and drilling in our exploration programs.
First Quarter 2013 Earnings - Oil & Gas Segment
Taxes, Exploration Expense and DD&A
Taxes, Exploration Expense and DD&A
9

10
* Higher energy and feedstock costs
Guidance
Variance Analysis - 1Q13 vs. 4Q12
• The sequential quarterly
decrease was due to higher
ethylene costs and increased
competitive activity, particularly
in the domestic caustic soda
markets, partially offset by
higher VCM and PVC prices.
decrease was due to higher
ethylene costs and increased
competitive activity, particularly
in the domestic caustic soda
markets, partially offset by
higher VCM and PVC prices.
• Chemical segment earnings
in 2Q13 is expected to be
~$170 mm, benefiting from
higher seasonal demand in
the construction and
agricultural market segments.
in 2Q13 is expected to be
~$170 mm, benefiting from
higher seasonal demand in
the construction and
agricultural market segments.
($ in millions)
Results in 1Q13 of $159 mm
vs. $180 mm in 4Q12 and
$184 mm in 1Q12
vs. $180 mm in 4Q12 and
$184 mm in 1Q12
First Quarter 2013 Earnings - Chemical Segment
10

11
Variance Analysis - 1Q13 vs. 4Q12
• Over 70 % of the
sequential quarterly
increase resulted from
improved marketing and
trading performance.
sequential quarterly
increase resulted from
improved marketing and
trading performance.
• The remainder of the
increase came from
improved margins in the
gas processing and power
generation businesses
and higher earnings from
foreign pipelines.
increase came from
improved margins in the
gas processing and power
generation businesses
and higher earnings from
foreign pipelines.
($ in millions)
First Quarter 2013 Earnings - Midstream Segment
Results for 1Q13 were
$215 mm vs. $75 mm
in 4Q12 and $131 mm
in 1Q12.
$215 mm vs. $75 mm
in 4Q12 and $131 mm
in 1Q12.
11

12
• The worldwide effective tax rate on core income was 38% for
the 1Q13.
the 1Q13.
– included a benefit resulting from the relinquishment of an international
exploration block.
exploration block.
• Our 4Q12 U.S. and foreign tax rates are included in the
Investor Relations Supplemental Schedules.
Investor Relations Supplemental Schedules.
• We expect our combined worldwide tax rate in 2Q13 to
increase to about 41%.
increase to about 41%.
First Quarter 2013 Earnings - Income Taxes
12
13
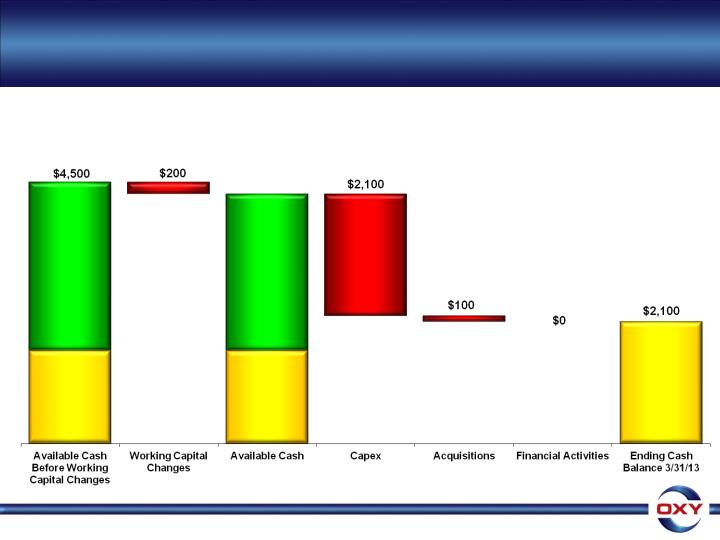
First Quarter 2013 Earnings - 2013 Cash Flow
• In 1Q13, we generated $2.9 billion of cash flow from operations before changes in
working capital. Working capital changes reduced our cash flow from operations by
approximately $200 million to $2.7 billion.
working capital. Working capital changes reduced our cash flow from operations by
approximately $200 million to $2.7 billion.
($ in millions)
Cash Flow
From
Operations
before
Working
Capital
changes
From
Operations
before
Working
Capital
changes
$2,900
Beginning
Cash $1,600
12/31/12
Cash $1,600
12/31/12
Cash Flow
From
Operations
$2,700
From
Operations
$2,700
$4,300
Beginning
Cash $1,600
12/31/12
Cash $1,600
12/31/12
13

14
• Capital expenditures for 1Q13 were $2.1 billion.
– 1Q13 capital spend was $440 million lower than 4Q12, with about half of the
decrease in the oil and gas business .
decrease in the oil and gas business .
• 1Q13 capital expenditures by segment were 80% in oil and gas,
15% in midstream and the remainder in chemicals.
15% in midstream and the remainder in chemicals.
• These and other net cash flows resulted in a $2.1 billion cash
balance at 3/31/13.
balance at 3/31/13.
First Quarter 2013 Earnings - 2013 Cash Flow
14

15
First Quarter 2013 Earnings -
Shares Outstanding, Debt/Capital, ROE & ROCE
Shares Outstanding, Debt/Capital, ROE & ROCE
Shares Outstanding (mm) 1Q13 3/31/13
Weighted Average Basic 804.7
Weighted Average Diluted 805.2
Shares Outstanding 805.6
1Q13 3/31/13
Debt / Capital 16%
Return on Equity* 13.4%
Return on Capital Employed* 11.4%
Note: Annualized; See attached GAAP reconciliation
15

16
First Quarter 2013 Earnings -
Key Performance Metrics - Production
Key Performance Metrics - Production
• Occidental’s domestic oil and gas segment produced record
volumes for the tenth consecutive quarter and continued to
execute on our liquids production growth strategy.
volumes for the tenth consecutive quarter and continued to
execute on our liquids production growth strategy.
• 1Q13 domestic production of 478 mboe/d, consisting of 342 mboe/d of liquids
and 817 mmcf/d of gas, an increase of 3 mboe/d vs. 4Q12.
and 817 mmcf/d of gas, an increase of 3 mboe/d vs. 4Q12.
Total Domestic
+23 mboe/d
production
growth
production
growth
Total Domestic Oil
Total Domestic Liquids
+20 mboe/d
production
growth
production
growth
+26 mboe/d
production
growth
production
growth
16

17
First Quarter 2013 Earnings - Capital Efficiency &
Operating Cost Reduction Program
Operating Cost Reduction Program
• We are executing a focused drilling program in our core
areas and to date we are running ahead of our full-year
objectives in our program to improve domestic operational
and capital efficiencies.
areas and to date we are running ahead of our full-year
objectives in our program to improve domestic operational
and capital efficiencies.
− For example, we have reduced both our domestic well and operating costs by
~19% relative to 2012.
~19% relative to 2012.
− This is ahead of our previously stated targets of 15% well cost improvement and
total oil and gas operating costs below $14/boe for 2013.
total oil and gas operating costs below $14/boe for 2013.
• While we are still in the early stages of this process and
making a longer-term projection is difficult, our goal is to
sustain the benefits realized to date, achieve additional
savings in our drilling costs and reach our 2011 operating
cost levels without a loss in production or sacrificing safety.
making a longer-term projection is difficult, our goal is to
sustain the benefits realized to date, achieve additional
savings in our drilling costs and reach our 2011 operating
cost levels without a loss in production or sacrificing safety.
• The purpose of these initiatives is to improve our return on
capital.
capital.
17

18
First Quarter 2013 Earnings - Capital Efficiency &
Operating Cost Reduction Program
Operating Cost Reduction Program
Production Costs ($/boe)
18

19
First Quarter 2013 Earnings - 2013 Domestic
Program
Program
• Three main objectives of 2013 domestic program.
• Delineate our core drilling areas in the Permian Basin
− Accumulated more than 1.7 million net acres covering both established
and emerging plays.
and emerging plays.
− Focused on delineating incremental opportunities in established plays
and testing potential of many emerging plays.
and testing potential of many emerging plays.
• Drive capital efficiency, particularly in our core drilling
programs.
programs.
− We believe the results of our capital efficiency improvement program are
not only scalable across our core programs but also sustainable.
not only scalable across our core programs but also sustainable.
• Enhance our cash margins through operating expense
reductions.
reductions.
19

20
First Quarter 2013 Earnings - 2013 Domestic
Program - Permian Basin
Program - Permian Basin
• Delineate our core areas in the Permian Basin
− $1.9 billion capital program to deliver growth from oil production
− ~2/3 of capital will be spent in non-CO2 business
• Expect to drill ~300 wells, 90% of which will be focused in four
plays: the Wolfberry, Yeso, Delaware sands and Wolfbone.
plays: the Wolfberry, Yeso, Delaware sands and Wolfbone.
• In addition to these four core programs, have opportunities in
several other emerging plays.
several other emerging plays.
− Plan to drill 20-25 wells in the Bone Spring, Wolfcamp and Cline across
our acreage position
our acreage position
20

21
First Quarter 2013 Earnings - 2013 Domestic
Program - Permian Basin
Program - Permian Basin
Acreage in Select Permian Plays
(Thousands of Acres)
(Thousands of Acres)
|
Delaware Basin
|
Gross
|
Oxy Share
|
|
Avalon
|
340
|
120
|
|
Bone Spring 1 Sand
|
560
|
220
|
|
Bone Spring 2 Sand
|
530
|
210
|
|
Bone Spring 3 Sand
|
420
|
140
|
|
Wolfbone
|
180
|
55
|
|
Wolfcamp Shale
|
570
|
200
|
|
Delaware Shale
|
420
|
160
|
|
Penn Shale
|
320
|
120
|
|
Wabo
|
190
|
50
|
|
Yeso
|
230
|
60
|
|
Midland Basin
|
|
|
|
Cline Shale
|
390
|
160
|
|
Wolfcamp Shale
|
425
|
150
|
|
Wolfberry
|
280
|
100
|
|
Totals
|
4,855
|
1,745
|
21

22
First Quarter 2013 Earnings - 2013 Domestic
Program - Permian Basin
Program - Permian Basin
• Wolfberry
− Solid, core play for many years and represents the largest proportion of activity.
− Mix of infill wells in already established core areas, and step out wells in emerging
play areas.
play areas.
− Expect step out wells in these emerging areas to mirror the solid results we have
seen in drilling hundreds of Wolfberry wells in the last several years.
seen in drilling hundreds of Wolfberry wells in the last several years.
• Delaware sands
− ~25% of activity in 2013; Increased opportunity to enhance economics utilizing
horizontal drilling and completions to develop established tight-sand reservoirs.
horizontal drilling and completions to develop established tight-sand reservoirs.
− Expect to drill 12 horizontal wells this year.
• Emerging Yeso play in New Mexico
− Demonstrated encouraging results; expect to increase drilling activity by 30% from
2012 levels.
2012 levels.
22

23
First Quarter 2013 Earnings - 2013 Domestic
Program - Permian Basin
Program - Permian Basin
• Emerging Wolfbone play in Reeves County, Texas
− Throughout 2012, we were able to acquire a meaningful, contiguous acreage
position. We drilled a handful of wells in 2012 and will increase our activity this
year as we further delineate our acreage position.
position. We drilled a handful of wells in 2012 and will increase our activity this
year as we further delineate our acreage position.
− Multi-pay nature, mostly vertical wells, with several horizontal wells planned in
sweet spots of the multi-pay interval.
sweet spots of the multi-pay interval.
− Early results are encouraging; 30 day IP rates average 170 - 235 boepd.
− The key to success is a low cost structure.
− Drilling for less than a year in the Wolfbone and have already seen substantial
improvements in well costs.
improvements in well costs.
− As we build infrastructure and establish a steady program, we expect to see
further progress in our costs.
further progress in our costs.
23

24
First Quarter 2013 Earnings - 2013 Domestic
Program - Drive Capital Efficiency
Program - Drive Capital Efficiency
• Drive capital efficiency, particularly in core drilling programs.
• Four elements to our overall capital efficiency strategy.
− Locking in drilling programs.
− Modifying well objectives and design.
− Improving operational execution.
− Improving our contracting strategies.
• Achieved more than a 19 percent reduction in our well costs
relative to 2012 benchmark across our domestic assets.
relative to 2012 benchmark across our domestic assets.
•
− The most important improvements were achieved in the Williston, the
Wolfberry, and shale drilling at Elk Hills where costs have dropped by
32%, 20% and 22%, respectively.
Wolfberry, and shale drilling at Elk Hills where costs have dropped by
32%, 20% and 22%, respectively.
24

25
First Quarter 2013 Earnings - 2013 Domestic
Program - Capital Efficiency
Program - Capital Efficiency
• Locking in drilling programs.
• Results in significant efficiencies.
− Fit-for-purpose drilling rigs in each core area.
− Minimize the number of drill site contractors.
− Minimize drilling and mobilization times and rig move distances.
• Reduced rig-down times by 20%.
• In the Williston, our optimized drilling schedule designed to
minimize rig mobilizations has reduced move costs by 33%.
minimize rig mobilizations has reduced move costs by 33%.
25

26
First Quarter 2013 Earnings - 2013 Domestic
Program - Capital Efficiency
Program - Capital Efficiency
• Modification of well objectives and designs.
• In our Wolfberry program:
• Two casing strings instead of three, which has saved ~$250,000 per well.
• Reduced costs by 47% per frac stage per Wolfberry well, without any
degradation in production.
degradation in production.
• At the Elk Hills shale program, running mostly slotted liners instead
of cemented liners, saving $1.5 million per well with no degradation
in production.
of cemented liners, saving $1.5 million per well with no degradation
in production.
• Reduced the amount of gel loading and resin coated sand thus
reducing completion costs.
reducing completion costs.
• Reduced drilling and completion times, and reduced and more
efficient use of materials and supplies.
efficient use of materials and supplies.
26

27
First Quarter 2013 Earnings - 2013 Domestic
Program - Capital Efficiency
Program - Capital Efficiency
• Improving operational execution.
• Numerous incremental changes in all businesses and significant
improvements in the Permian and Williston business units.
improvements in the Permian and Williston business units.
− Optimizing use of water in completion operations by using flowback and/or
produced water in stimulations, which is generating substantial savings.
produced water in stimulations, which is generating substantial savings.
• In the Williston, more of the wells we are drilling have been trouble
free, particularly due to improved directional tool reliability.
free, particularly due to improved directional tool reliability.
• Fundamental change in the way and the extent to which we use
contractors and outside consultants to manage and supervise our
drilling programs.
contractors and outside consultants to manage and supervise our
drilling programs.
− Heavier reliance on our own personnel for these tasks has already resulted in
efficiencies.
efficiencies.
27

28
First Quarter 2013 Earnings - 2013 Domestic
Program - Capital Efficiency
Program - Capital Efficiency
• Progress in the Williston, Permian and Elk Hills.
• Reduction in stimulation contract pricing and fluid hauling costs.
• Williston
− Reduced well costs from $10 million to $8.2 million currently, in the top quartile
in the play; Goal is $7.5 million per well.
in the play; Goal is $7.5 million per well.
− Focus on continuing development of our Russian Creek acreage where we plan
to drill 46 wells in 2013 concentrating on the “sweet spot” of our acreage.
to drill 46 wells in 2013 concentrating on the “sweet spot” of our acreage.
− Development will be mainly in the Middle Bakken, with other wells testing both
the Pronghorn and Three Forks formations.
the Pronghorn and Three Forks formations.
• Permian
− Wolfberry average well costs are down from $3.5 million to $2.6 million.
28

29
First Quarter 2013 Earnings - 2013 Domestic
Program - Operating Cost Reductions
Program - Operating Cost Reductions
• Enhancing cash margins through reductions in operating
costs
costs
• Additional steps specific to reducing our operating costs, especially
in the areas of downhole maintenance and workovers.
in the areas of downhole maintenance and workovers.
• Workover activity
− Eliminating inefficient workover rigs.
− Through better planning and scheduling, we are able to perform a similar number
of well servicing jobs as we did with a larger fleet.
of well servicing jobs as we did with a larger fleet.
− No production decline from these reductions.
• Repair and Maintenance activity
− More rigorous review of well repair candidates, subject to ongoing evaluations
based on market conditions.
based on market conditions.
29

30
First Quarter 2013 Earnings - 2013 Domestic
Program - Operating Cost Reductions
Program - Operating Cost Reductions
• Enhancing cash margins through reductions in operating
costs
costs
• Maintenance crews
− Evaluating and prioritizing most efficient crews.
− More direct on-location supervision, optimized scheduling and tighter controls over
spending limits and job approvals.
spending limits and job approvals.
− Reduced well intervention times and maintenance and workover costs.
• Surface operations
– Achieved efficiencies in use of chemicals, water handling and disposal
activities.
activities.
− Recycle more produced water, reducing sourcing and disposal costs and
handling water in a more environmentally conscious manner.
handling water in a more environmentally conscious manner.
− Working with suppliers to addressing the costs of supplies and services.
− Optimizing use of injectants and energy.
30

31
First Quarter 2013 Earnings - 2013 Domestic
Program - Operating Cost Reductions
Program - Operating Cost Reductions
• Enhancing cash margins through reductions in operating
costs
costs
– Compared to the 2012 levels, downhole maintenance and workover costs have
dropped 36% and surface operations by ~16%, contributing to a 19% reduction of
operating costs, on a BOE basis, across all domestic assets.
dropped 36% and surface operations by ~16%, contributing to a 19% reduction of
operating costs, on a BOE basis, across all domestic assets.
– Total domestic operating cost per barrel dropped from $17.43 per barrel in 2012 to
$14.06 per barrel in 1Q13.
$14.06 per barrel in 1Q13.
– Expect on-going efforts will yield additional improvements going forward.
– The great success we have had to date in achieving capital efficiency and operating
expense reduction goals is the result of implementing literally thousands of ideas,
suggestions and decisions being made every day mainly at the field level.
expense reduction goals is the result of implementing literally thousands of ideas,
suggestions and decisions being made every day mainly at the field level.
– Personnel at every level have stepped up to achieve previously stated goals of
achieving 15% capital efficiency gains, and so far exceeding this goal, and reducing
our annualized operating expenses by a minimum of $450MM.
achieving 15% capital efficiency gains, and so far exceeding this goal, and reducing
our annualized operating expenses by a minimum of $450MM.
31

32
First Quarter 2013 Earnings - 2013 Domestic
Program - Summary
Program - Summary
• We are still in the early stages of this process and, therefore,
our data is based on a relatively small portion of our overall
program.
our data is based on a relatively small portion of our overall
program.
• In addition, we executed a relatively trouble-free drilling
program in the first quarter.
program in the first quarter.
• Given our results to date and our people's efforts in this
endeavor, we are cautiously optimistic we can sustain and
even further improve upon the results achieved to date.
endeavor, we are cautiously optimistic we can sustain and
even further improve upon the results achieved to date.
• Overarching goal is to make sure we achieve these
improvements without in any way compromising the safety
of our operations and of our people, and without impacting
our growth plans.
improvements without in any way compromising the safety
of our operations and of our people, and without impacting
our growth plans.
32

33
First Quarter 2013 Earnings - Dividends
• In February we increased our dividend 18.5% to an annual
rate of $2.56 per share, from the previous annual rate of
$2.16 per share.
rate of $2.56 per share, from the previous annual rate of
$2.16 per share.
• We have now increased our dividend every year for 11
consecutive years, and a total of 12 times during that
period.
consecutive years, and a total of 12 times during that
period.
• This 18.5% increase brings the 11-year compounded
dividend growth rate to 16% per year.
dividend growth rate to 16% per year.
33

34
First Quarter 2013 Earnings -
2013 Production Outlook
2013 Production Outlook
• Domestically, we continue to expect solid growth in our oil
production for the year.
production for the year.
− As a result of the nature and timing of our drilling program, such as
steam flood drilling in California, we expect 2Q13 liquids growth to be
modest with higher growth rates coming in the second half of the year.
steam flood drilling in California, we expect 2Q13 liquids growth to be
modest with higher growth rates coming in the second half of the year.
− Our base gas production did not decline as much as we had initially
expected in 1Q13. Estimating the production for the rest of the year
still remains challenging.
expected in 1Q13. Estimating the production for the rest of the year
still remains challenging.
− We expect to see modest declines in our gas production as a result
of our lower drilling on gas properties and natural decline, as well as
a number of gas plant turnarounds scheduled in our Permian business
the rest of the year.
of our lower drilling on gas properties and natural decline, as well as
a number of gas plant turnarounds scheduled in our Permian business
the rest of the year.
34

35
First Quarter 2013 Earnings -
2013 Production Outlook
2013 Production Outlook
• Internationally, excluding Iraq, at current prices we expect
production to be higher in 2Q13, back to around the 4Q12
levels, with the increase coming mainly from the resumption
of production in Qatar.
production to be higher in 2Q13, back to around the 4Q12
levels, with the increase coming mainly from the resumption
of production in Qatar.
− Iraq's production is directly correlated to quarterly spending levels,
which continue to be volatile.
which continue to be volatile.
− We expect international sales volumes also to get back to around the
4Q12 levels based on our current lifting schedule.
4Q12 levels based on our current lifting schedule.
35

• 1Q13 capital spending was $2.1 billion.
• We expect the second quarter rate to be higher.
• Our annual spending levels are unchanged and
expected to be in line with the $9.6 billion program
discussed on the 4Q12 conference call.
expected to be in line with the $9.6 billion program
discussed on the 4Q12 conference call.
First Quarter 2013 Earnings -
2013 Capital Outlook
36
36

First Quarter 2013 Earnings Conference Call
Q&A
37