Attached files
| file | filename |
|---|---|
| 8-K - 8-K - CBRE GROUP, INC. | a13-10701_18k.htm |
| EX-99.1 - EX-99.1 - CBRE GROUP, INC. | a13-10701_1ex99d1.htm |
Exhibit 99.2
|
|
CBRE GROUP, INC. First Quarter 2013: Earnings Conference Call April 25, 2013 |

|
|
This presentation contains statements that are forward looking within the meaning of the Private Securities Litigation Reform Act of 1995, including statements regarding our future growth momentum, operations, financial performance and business outlook. These statements should be considered as estimates only and actual results may ultimately differ from these estimates. Except to the extent required by applicable securities laws, we undertake no obligation to update or publicly revise any of the forward-looking statements that you may hear today. Please refer to our first quarter earnings report, filed on Form 8-K and our current annual report on Form 10-K, in particular any discussion of risk factors or forward-looking statements, which are filed with the SEC and available at the SEC’s website (www.sec.gov), for a full discussion of the risks and other factors that may impact any estimates that you may hear today. We may make certain statements during the course of this presentation, which include references to “non-GAAP financial measures,” as defined by SEC regulations. As required by these regulations, we have provided reconciliations of these measures to what we believe are the most directly comparable GAAP measures, which are attached hereto within the appendix. FORWARD-LOOKING STATEMENTS |
|
|
CONFERENCE CALL PARTICIPANTS Bob Sulentic PRESIDENT AND CHIEF EXECUTIVE OFFICER Gil Borok CHIEF FINANCIAL OFFICER Jack Durburg GLOBAL PRESIDENT TRANSACTION SERVICES Nick Kormeluk INVESTOR RELATIONS |

|
|
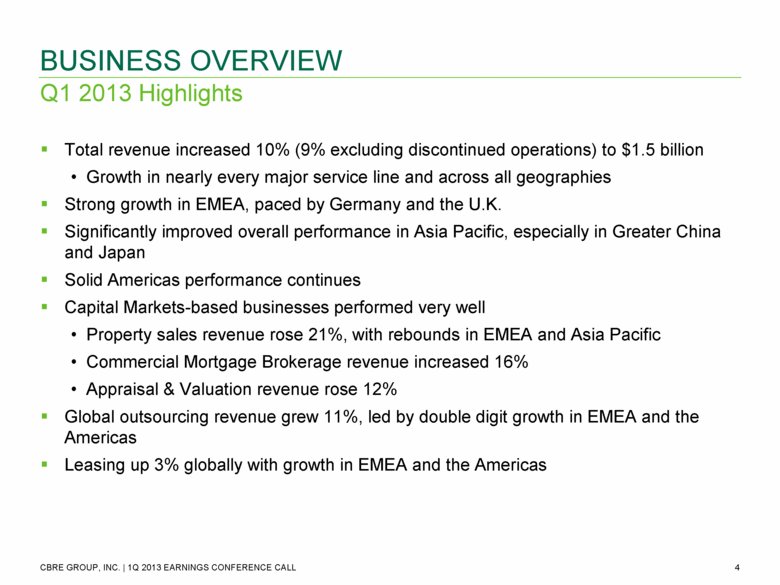
Total revenue increased 10% (9% excluding discontinued operations) to $1.5 billion Growth in nearly every major service line and across all geographies Strong growth in EMEA, paced by Germany and the U.K. Significantly improved overall performance in Asia Pacific, especially in Greater China and Japan Solid Americas performance continues Capital Markets-based businesses performed very well Property sales revenue rose 21%, with rebounds in EMEA and Asia Pacific Commercial Mortgage Brokerage revenue increased 16% Appraisal & Valuation revenue rose 12% Global outsourcing revenue grew 11%, led by double digit growth in EMEA and the Americas Leasing up 3% globally with growth in EMEA and the Americas Q1 2013 Highlights BUSINESS OVERVIEW |
|
|
LEASING BOSTON Quest Diagnostics 200,000 SF lease Marlborough, MA NEW YORK HarperCollins Publishers 180,700 SF lease 195 Broadway GLOBAL TRANSACTION SERVICES OVERVIEW SALES SÃO PAULO Eztec Empreendimentos e Participações S.A. US $275 million sale EZ Towers, Tower A HONG KONG Manulife Financial Corp. US $580 million purchase One Bay East office building MORTGAGE BROKERAGE MULTIMARKET Goldman Sachs / Greystar $1 billion multifamily property portfolio financing MULTIMARKET Brookdale Senior Living Acquisition financing of $173 million 2012 GLOBAL TRANSACTION VALUE PERCENT OF Q1 2013 GLOBAL REVENUE 25% 14% 5% Source: National Real Estate Investor, April 2013 Excluding Networks 189.8 108.9 88.4 71.2 69.8 57.4 56.0 25.8 24.2 22.0 0 20 40 60 80 100 120 140 160 180 200 CBRE JLL C&W Colliers Newmark Grubb Knight Frank Leasing Sales Mortgage Brokerage Studley Eastdil Secured DTZ Cassidy Turley Marcus & Millichap $ Billions |

|
|
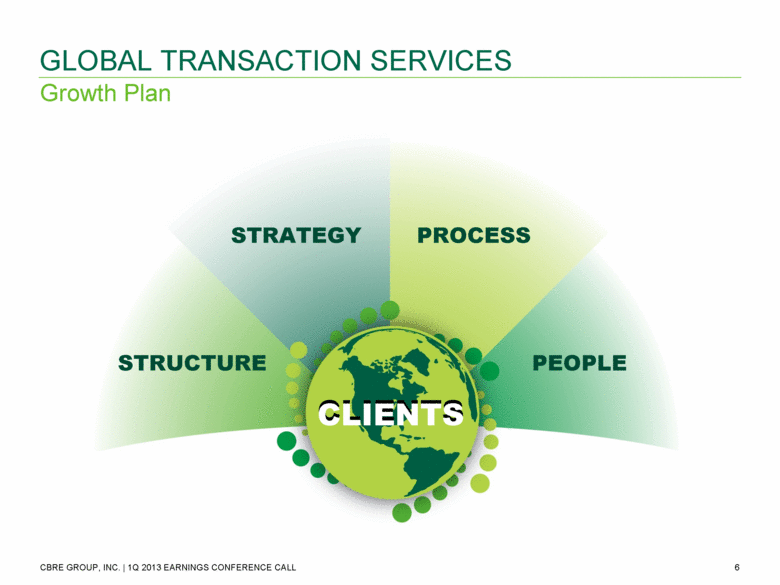
Growth Plan GLOBAL TRANSACTION SERVICES STRATEGY PROCESS STRUCTURE PEOPLE CLIENTS |
|
|
Q1 2013 PERFORMANCE OVERVIEW Revenue1 Net Income2 EPS2,3 EBITDA4 Normalized EBITDA4,5 Normalized EBITDA Margin5,6 Q1 2013 $1,479.0 M GAAP $37.5 M Adjusted $51.5 M GAAP $0.11 Adjusted $0.16 $159.8 M $161.3 M 10.9% Q1 2012 $1,350.0 M GAAP $27.0 M Adjusted $45.9 M GAAP $0.08 Adjusted $0.14 $140.5 M $150.5 M 11.1% CHANGE FROM Q1 2012 Includes revenue from discontinued operations of $4.0 million for the three months ended March 31, 2013. Adjusted net income and adjusted EPS exclude amortization expense related to customer relationships and incentive fees resulting from the ING REIM and TCC acquisitions, integration and other costs related to acquisitions and the write-off of financing costs. All EPS information is based upon diluted shares. Includes EBITDA from discontinued operations of $4.4 million for the three months ended March 31, 2013. Normalized EBITDA excludes integration and other costs related to acquisitions. Calculation includes revenue and EBITDA from discontinued operations for the three months ended March 31, 2013. 1. 2. 3. 4. 5. 6. |

|
|
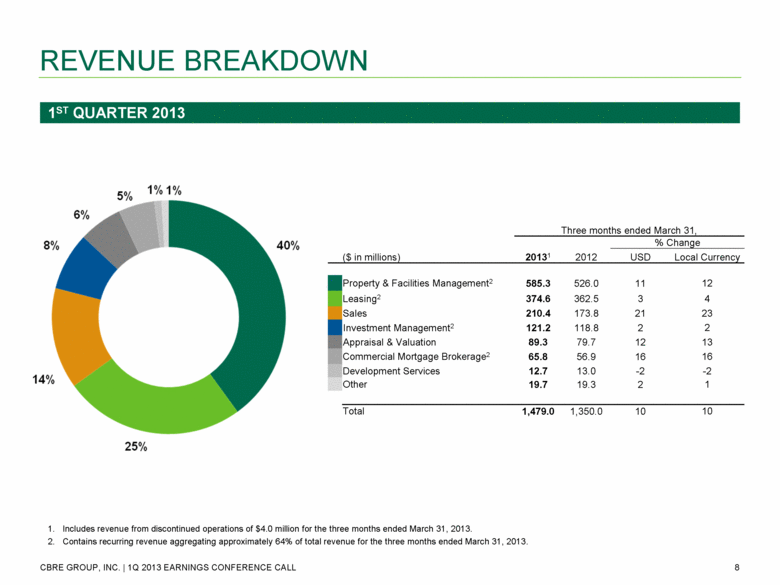
REVENUE BREAKDOWN Includes revenue from discontinued operations of $4.0 million for the three months ended March 31, 2013. Contains recurring revenue aggregating approximately 64% of total revenue for the three months ended March 31, 2013. 1ST QUARTER 2013 Three months ended March 31, % Change ($ in millions) 20131 2012 USD Local Currency Property & Facilities Management2 585.3 526.0 11 12 Leasing2 374.6 362.5 3 4 Sales 210.4 173.8 21 23 Investment Management2 121.2 118.8 2 2 Appraisal & Valuation 89.3 79.7 12 13 Commercial Mortgage Brokerage2 65.8 56.9 16 16 Development Services 12.7 13.0 -2 -2 Other 19.7 19.3 2 1 Total 1,479.0 1,350.0 10 10 1. 2. 1% 1% 5% 6% 8% 14% 25% 40% |
|
|
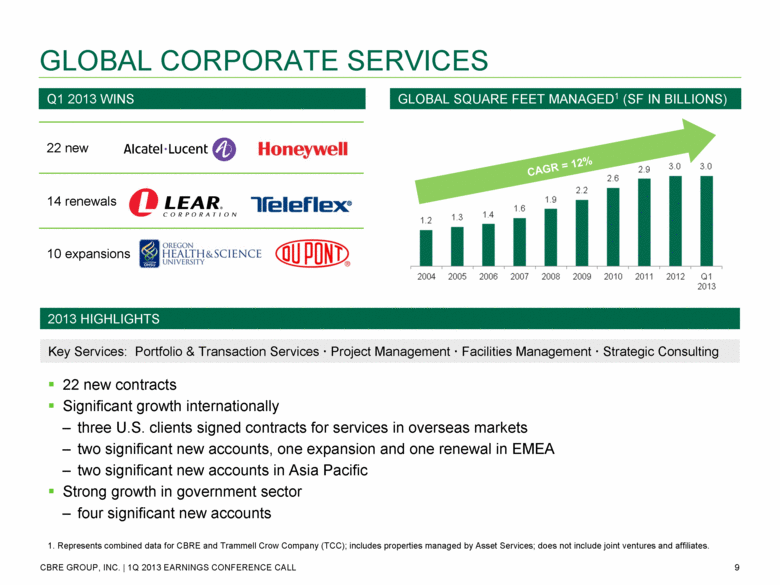
22 new 14 renewals 10 expansions GLOBAL CORPORATE SERVICES 1. Represents combined data for CBRE and Trammell Crow Company (TCC); includes properties managed by Asset Services; does not include joint ventures and affiliates. 22 new contracts Significant growth internationally three U.S. clients signed contracts for services in overseas markets two significant new accounts, one expansion and one renewal in EMEA two significant new accounts in Asia Pacific Strong growth in government sector four significant new accounts CAGR = 12% Q1 2013 WINS GLOBAL SQUARE FEET MANAGED1 (SF IN BILLIONS) 2013 HIGHLIGHTS Key Services: Portfolio & Transaction Services Project Management Facilities Management Strategic Consulting 1.2 1.3 1.4 1.6 1.9 2.2 2.6 2.9 3.0 3.0 2004 2005 2006 2007 2008 2009 2010 2011 2012 q1 2013 Key Services: Portfolio & Transaction Services . Project Management . Facilities Management . Strategic Consulting |
|
|
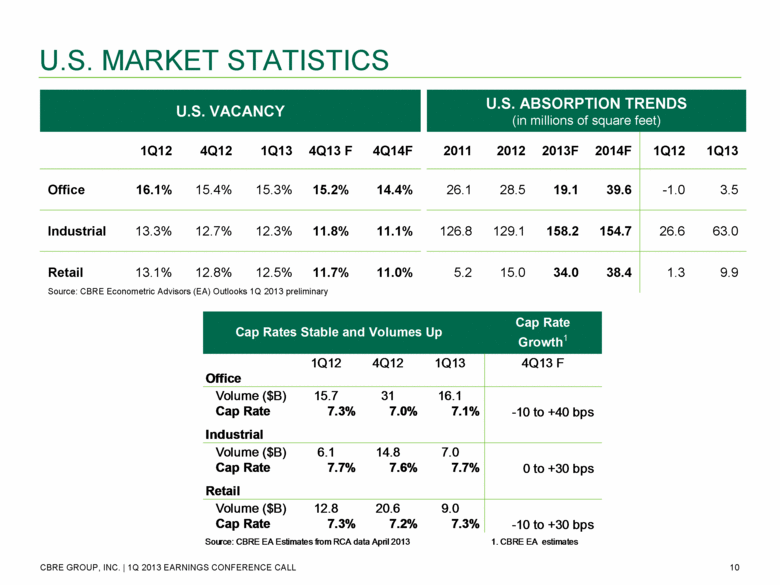
U.S. VACANCY U.S. ABSORPTION TRENDS (in millions of square feet) 1Q12 4Q12 1Q13 4Q13 F 4Q14F 2011 2012 2013F 2014F 1Q12 1Q13 Office 16.1% 15.4% 15.3% 15.2% 14.4% 26.1 28.5 19.1 39.6 -1.0 3.5 Industrial 13.3% 12.7% 12.3% 11.8% 11.1% 126.8 129.1 158.2 154.7 26.6 63.0 Retail 13.1% 12.8% 12.5% 11.7% 11.0% 5.2 15.0 34.0 38.4 1.3 9.9 U.S. MARKET STATISTICS Source: CBRE Econometric Advisors (EA) Outlooks 1Q 2013 preliminary Cap Rates Stable and Volumes Up Cap Rate Growth 1 1Q12 4Q12 1Q13 4Q13 F Office Volume ($B) 15.7 31 16.1 Cap Rate 7.3% 7.0% 7.1% -10 to +40 bps Industrial Volume ($B) 6.1 14.8 7.0 Cap Rate 7.7% 7.6% 7.7% 0 to +30 bps Retail Volume ($B) 12.8 20.6 9.0 Cap Rate 7.3% 7.2% 7.3% -10 to +30 bps Source: CBRE EA Estimates from RCA data April 2013 1. CBRE EA estimates |
|
|
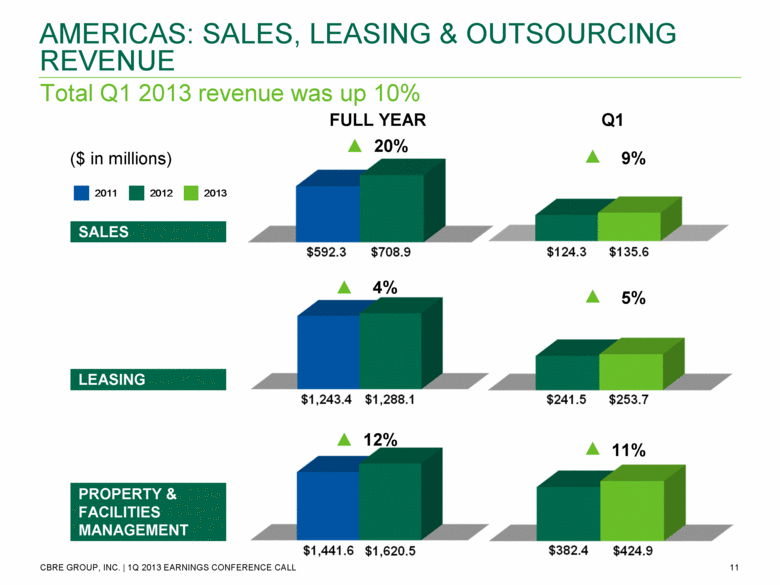
Total Q1 2013 revenue was up 10% AMERICAS: SALES, LEASING & OUTSOURCING REVENUE SALES LEASING PROPERTY & FACILITIES MANAGEMENT ($ in millions) 9% Q1 FULL YEAR 20% 5% 4% 11% 12% 2011 2012 2013 $1,243.4 $1,288.1 $241.5 $253.7 $1,441.6 $1,620.5 $382.4 $424.9 |
|
|
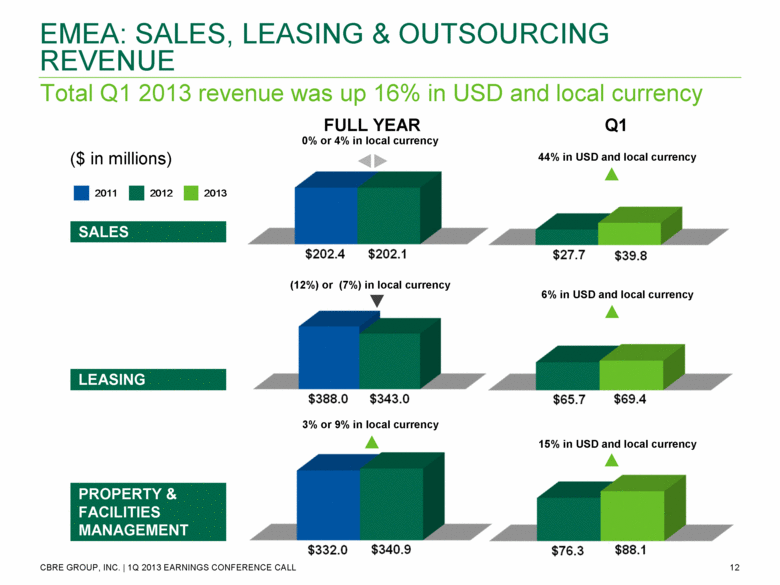
Total Q1 2013 revenue was up 16% in USD and local currency EMEA: SALES, LEASING & OUTSOURCING REVENUE SALES LEASING ($ in millions) 0% or 4% in local currency (12%) or (7%) in local currency 44% in USD and local currency 3% or 9% in local currency 6% in USD and local currency 15% in USD and local currency Q1 FULL YEAR PROPERTY & FACILITIES MANAGEMENT 2011 2012 2013 |
|
|
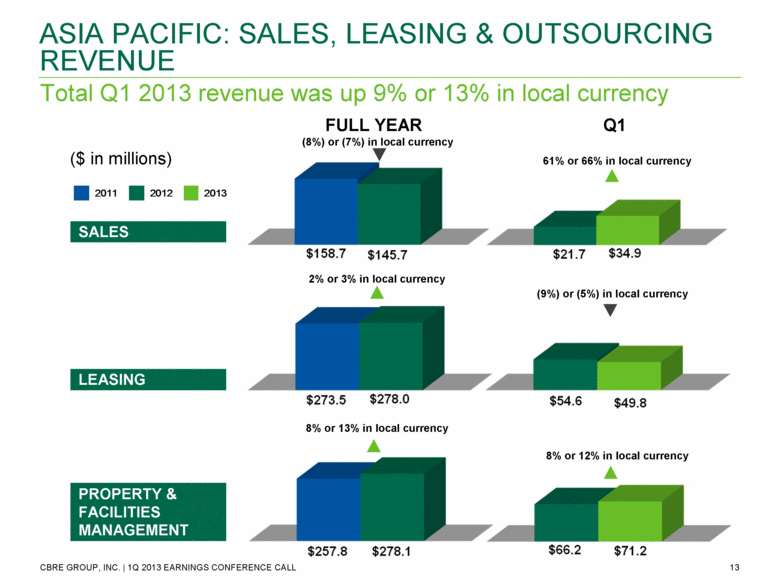
Total Q1 2013 revenue was up 9% or 13% in local currency ASIA PACIFIC: SALES, LEASING & OUTSOURCING REVENUE (8%) or (7%) in local currency 2% or 3% in local currency 8% or 13% in local currency 61% or 66% in local currency (9%) or (5%) in local currency 8% or 12% in local currency Q1 FULL YEAR SALES LEASING ($ in millions) PROPERTY & FACILITIES MANAGEMENT 2011 2012 2013 |
|
|
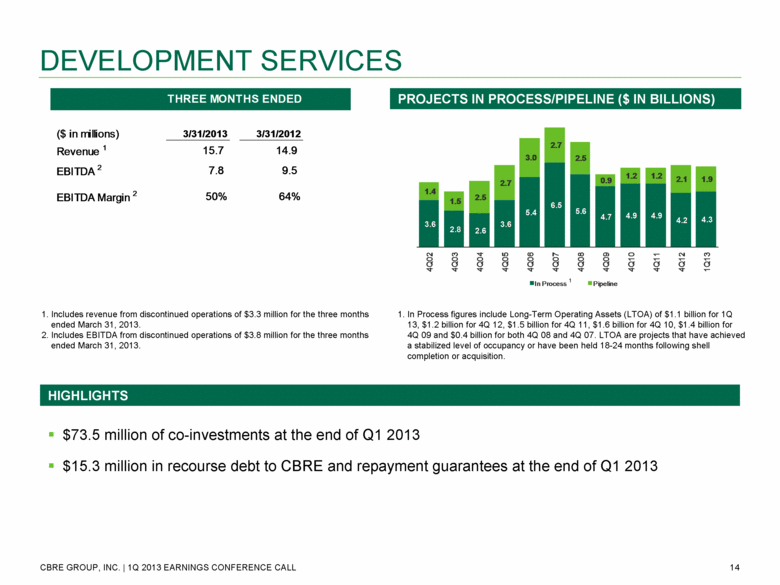
DEVELOPMENT SERVICES In Process figures include Long-Term Operating Assets (LTOA) of $1.1 billion for 1Q 13, $1.2 billion for 4Q 12, $1.5 billion for 4Q 11, $1.6 billion for 4Q 10, $1.4 billion for 4Q 09 and $0.4 billion for both 4Q 08 and 4Q 07. LTOA are projects that have achieved a stabilized level of occupancy or have been held 18-24 months following shell completion or acquisition. 1 Includes revenue from discontinued operations of $3.3 million for the three months ended March 31, 2013. Includes EBITDA from discontinued operations of $3.8 million for the three months ended March 31, 2013. $73.5 million of co-investments at the end of Q1 2013 $15.3 million in recourse debt to CBRE and repayment guarantees at the end of Q1 2013 PROJECTS IN PROCESS/PIPELINE ($ IN BILLIONS) HIGHLIGHTS 3.6 2.8 2.6 3.6 5.4 6.5 5.6 4.7 4.9 4.9 4.2 4.3 1.4 1.5 2.5 2.7 3.0 2.7 2.5 0.9 1.2 1.2 2.1 1.9 4Q02 4Q03 4Q04 4Q05 4Q06 4Q07 4Q08 4Q09 4Q10 4Q11 4Q12 1Q13 In Process Pipeline ($ in millions) 3/31/2013 3/31/2012 Revenue 1 15.7 14.9 EBITDA 2 7.8 9.5 EBITDA Margin 2 50% 64% THREE MONTHS ENDED |
|
|
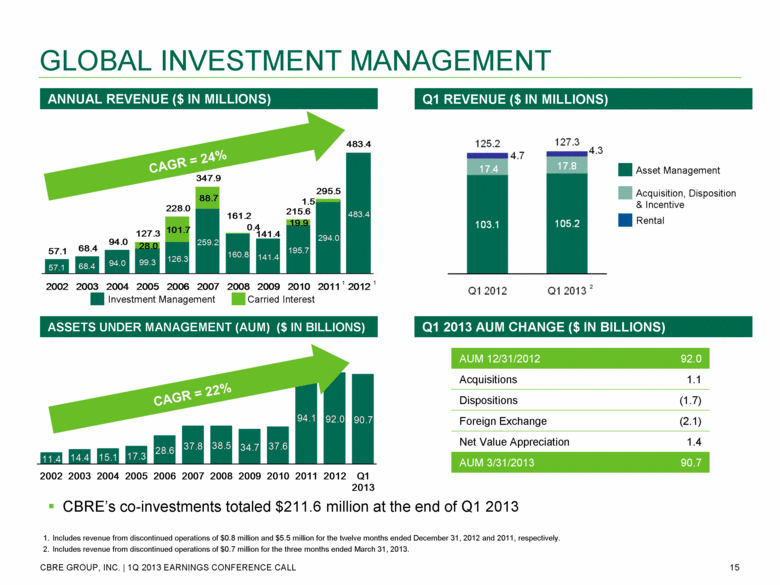
GLOBAL INVESTMENT MANAGEMENT Includes revenue from discontinued operations of $0.8 million and $5.5 million for the twelve months ended December 31, 2012 and 2011, respectively. Includes revenue from discontinued operations of $0.7 million for the three months ended March 31, 2013. Investment Management Carried Interest 1 1 CAGR = 24% Asset Management Acquisition, Disposition & Incentive Rental ANNUAL REVENUE ($ IN MILLIONS) Q1 REVENUE ($ IN MILLIONS) 2 CAGR = 22% ASSETS UNDER MANAGEMENT (AUM) ($ IN BILLIONS) CBRE’s co-investments totaled $211.6 million at the end of Q1 2013 Q1 2013 AUM CHANGE ($ IN BILLIONS) AUM 12/31/2012 92.0 Acquisitions 1.1 Dispositions (1.7) Foreign Exchange (2.1) Net Value Appreciation 1.4 AUM 3/31/2013 90.7 57.1 68.4 94.0 99.3 126.3 259.2 160.8 141.4 195.7 294.0 483.4 28.0 101.7 88.7 0.4 19.9 1.5 57.1 68.4 94.0 127.3 228.0 347.9 161.2 141.4 215.6 295.5 483.4 2002 2003 2004 2005 2006 2007 2008 2009 2010 2011 2012 11.4 14.4 15.1 17.3 28.6 37.8 38.5 34.7 37.6 94.1 92.0 90.7 2002 2003 2004 2005 2006 2007 2008 2009 2010 2011 2012 Q1 2013 |
|
|
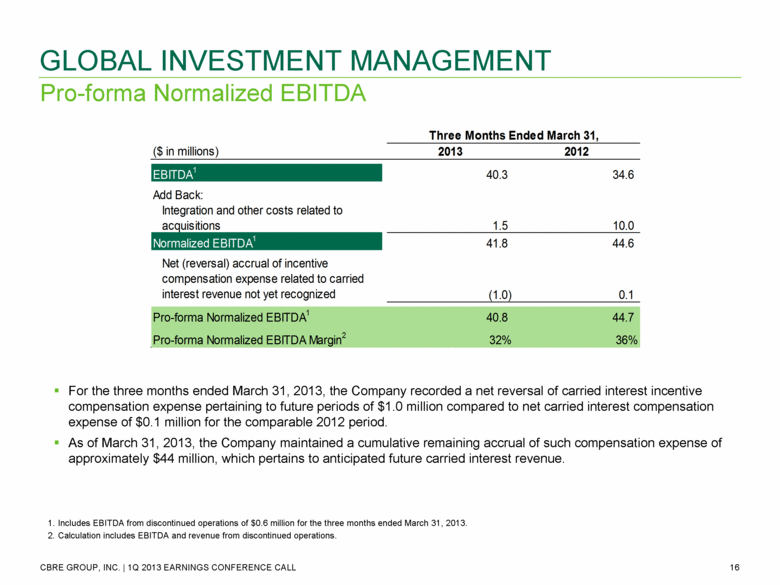
Pro-forma Normalized EBITDA GLOBAL INVESTMENT MANAGEMENT For the three months ended March 31, 2013, the Company recorded a net reversal of carried interest incentive compensation expense pertaining to future periods of $1.0 million compared to net carried interest compensation expense of $0.1 million for the comparable 2012 period. As of March 31, 2013, the Company maintained a cumulative remaining accrual of such compensation expense of approximately $44 million, which pertains to anticipated future carried interest revenue. Includes EBITDA from discontinued operations of $0.6 million for the three months ended March 31, 2013. Calculation includes EBITDA and revenue from discontinued operations. Three Months Ended March 31, Twelve Months Ended December 31, ($ in millions) 2013 2012 EBITDA 1 40.3 34.6 Add Back: Integration and other costs related to acquisitions 1.5 10.0 Normalized EBITDA 1 41.8 44.6 Net (reversal) accrual of incentive compensation expense related to carried interest revenue not yet recognized (1.0) 0.1 Pro-forma Normalized EBITDA 1 40.8 44.7 Pro-forma Normalized EBITDA Margin 2 32% 36% |
|
|
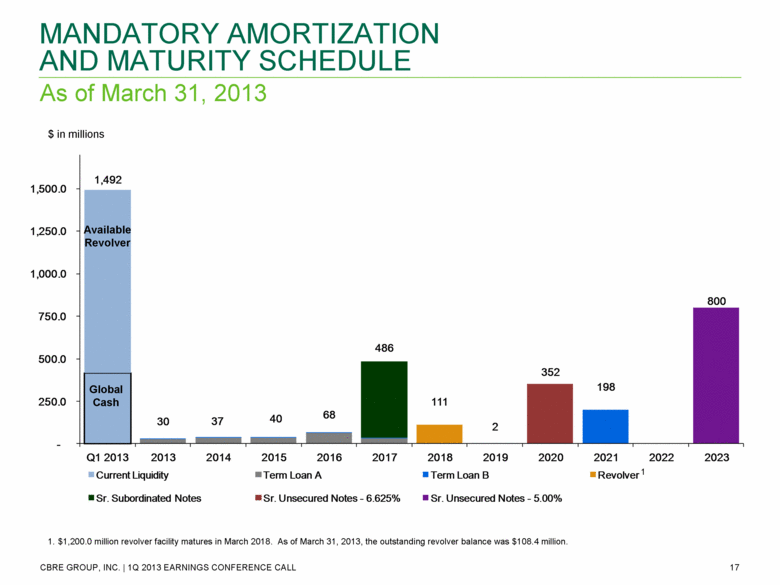
As of March 31, 2013 MANDATORY AMORTIZATION AND MATURITY SCHEDULE $ in millions $1,200.0 million revolver facility matures in March 2018. As of March 31, 2013, the outstanding revolver balance was $108.4 million. 1 Global Cash Available Revolver 1,492 30 37 40 68 486 111 2 352 198 800 - 250.0 500.0 750.0 1,000.0 1,250.0 1,500.0 Q1 2013 2013 2014 2015 2016 2017 2018 2019 2020 2021 2022 2023 Current Liquidity Term Loan A Term Loan B Revolver Sr. Subordinated Notes Sr. Unsecured Notes - 6.625% Sr. Unsecured Notes - 5.00% |
|
|
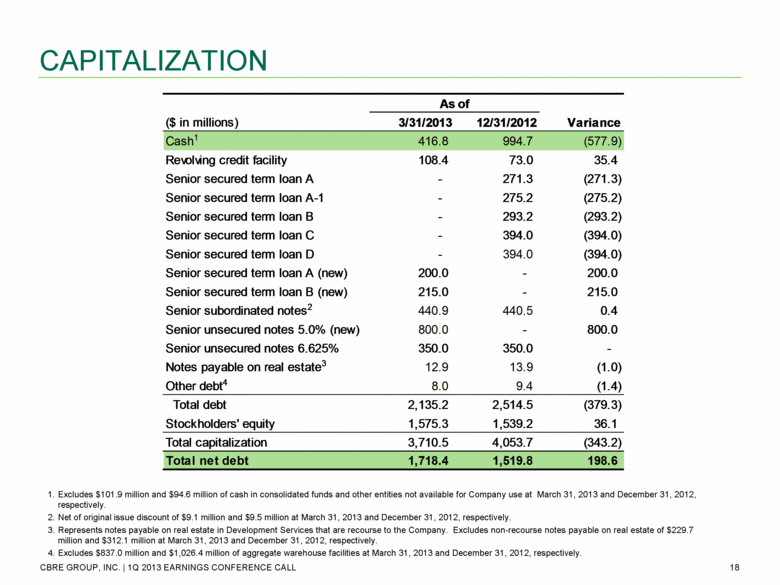
CAPITALIZATION Excludes $101.9 million and $94.6 million of cash in consolidated funds and other entities not available for Company use at March 31, 2013 and December 31, 2012, respectively. Net of original issue discount of $9.1 million and $9.5 million at March 31, 2013 and December 31, 2012, respectively. Represents notes payable on real estate in Development Services that are recourse to the Company. Excludes non-recourse notes payable on real estate of $229.7 million and $312.1 million at March 31, 2013 and December 31, 2012, respectively. Excludes $837.0 million and $1,026.4 million of aggregate warehouse facilities at March 31, 2013 and December 31, 2012, respectively. ($ in millions) 3/31/2013 12/31/2012 Variance Cash 1 416.8 994.7 (577.9) Revolving credit facility 108.4 73.0 35.4 Senior secured term loan A - 271.3 (271.3) Senior secured term loan A-1 - 275.2 (275.2) Senior secured term loan B - 293.2 (293.2) Senior secured term loan C - 394.0 (394.0) Senior secured term loan D - 394.0 (394.0) Senior secured term loan A (new) 200.0 - 200.0 Senior secured term loan B (new) 215.0 - 215.0 Senior subordinated notes 2 440.9 440.5 0.4 Senior unsecured notes 5.0% (new) 800.0 - 800.0 Senior unsecured notes 6.625% 350.0 350.0 - Notes payable on real estate 3 12.9 13.9 (1.0) Other debt 4 8.0 9.4 (1.4) Total debt 2,135.2 2,514.5 (379.3) Stockholders' equity 1,575.3 1,539.2 36.1 Total capitalization 3,710.5 4,053.7 (343.2) Total net debt 1,718.4 1,519.8 198.6 As of |
|
|
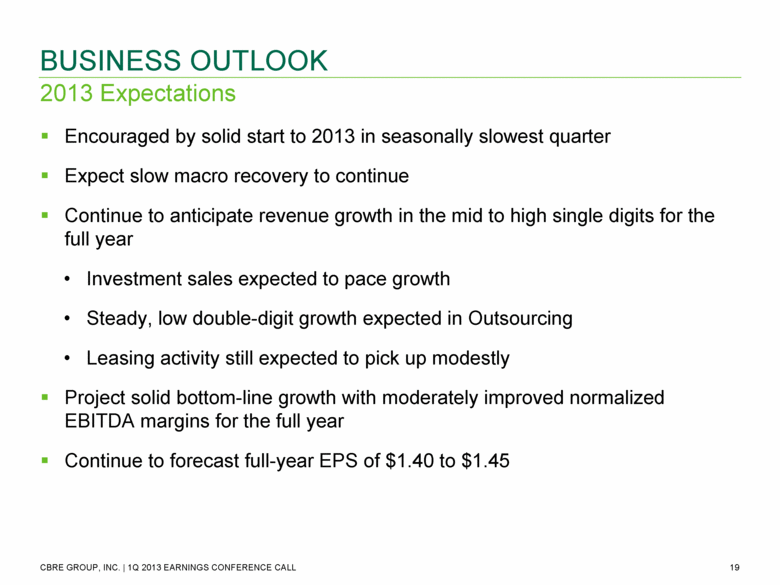
Encouraged by solid start to 2013 in seasonally slowest quarter Expect slow macro recovery to continue Continue to anticipate revenue growth in the mid to high single digits for the full year Investment sales expected to pace growth Steady, low double-digit growth expected in Outsourcing Leasing activity still expected to pick up modestly Project solid bottom-line growth with moderately improved normalized EBITDA margins for the full year Continue to forecast full-year EPS of $1.40 to $1.45 2013 Expectations BUSINESS OUTLOOK |
|
|
GAAP RECONCILIATION TABLES |

|
|
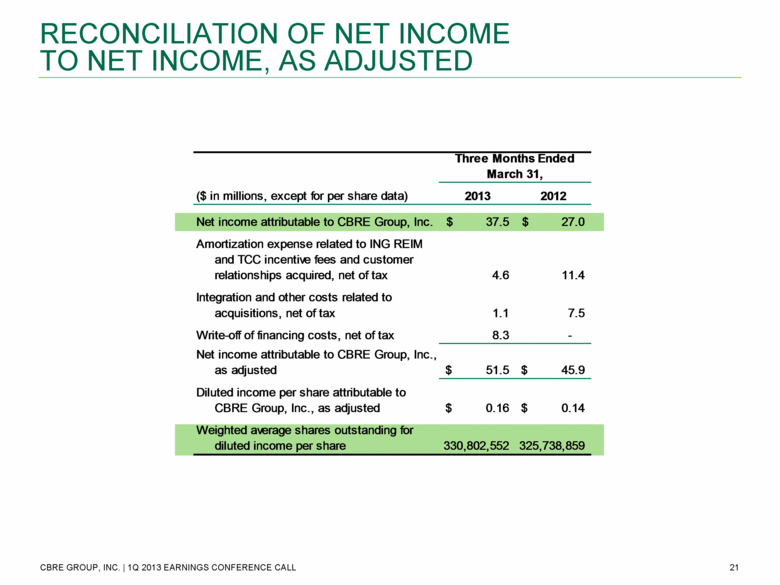
RECONCILIATION OF NET INCOME TO NET INCOME, AS ADJUSTED ($ in millions, except for per share data) 2013 2012 Net income attributable to CBRE Group, Inc. 37.5 $ 27.0 $ Amortization expense related to ING REIM and TCC incentive fees and customer relationships acquired, net of tax 4.6 11.4 Integration and other costs related to acquisitions, net of tax 1.1 7.5 Write-off of financing costs, net of tax 8.3 - Net income attributable to CBRE Group, Inc., as adjusted 51.5 $ 45.9 $ Diluted income per share attributable to CBRE Group, Inc., as adjusted 0.16 $ 0.14 $ Weighted average shares outstanding for diluted income per share 330,802,552 325,738,859 Three Months Ended March 31, |
|
|
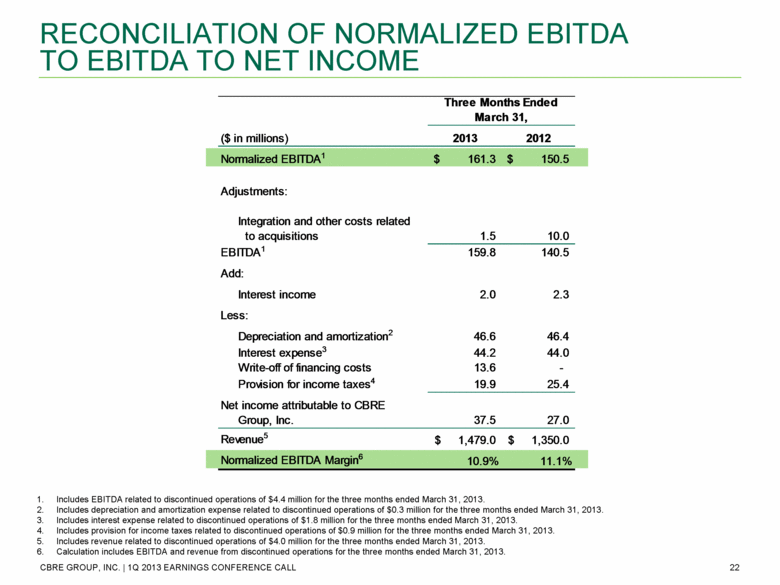
RECONCILIATION OF NORMALIZED EBITDA TO EBITDA TO NET INCOME Includes EBITDA related to discontinued operations of $4.4 million for the three months ended March 31, 2013. Includes depreciation and amortization expense related to discontinued operations of $0.3 million for the three months ended March 31, 2013. Includes interest expense related to discontinued operations of $1.8 million for the three months ended March 31, 2013. Includes provision for income taxes related to discontinued operations of $0.9 million for the three months ended March 31, 2013. Includes revenue related to discontinued operations of $4.0 million for the three months ended March 31, 2013. Calculation includes EBITDA and revenue from discontinued operations for the three months ended March 31, 2013. ($ in millions) 2013 2012 Normalized EBITDA 1 161.3 $ 150.5 $ Adjustments: Integration and other costs related to acquisitions 1.5 10.0 EBITDA 1 159.8 140.5 Add: Interest income 2.0 2.3 Less: Depreciation and amortization 2 46.6 46.4 Interest expense 3 44.2 44.0 Write-off of financing costs 13.6 - Provision for income taxes 4 19.9 25.4 Net income attributable to CBRE Group, Inc. 37.5 27.0 Revenue 5 1,479.0 $ 1,350.0 $ Normalized EBITDA Margin 6 10.9% 11.1% Three Months Ended March 31, |