Attached files
| file | filename |
|---|---|
| 8-K - FORM 8-K - Catalent Pharma Solutions, Inc. | d526340d8k.htm |
Exhibit 99.1

Lender Presentation
MATTHEW WALSH SVP FINANCE & CFO
April 2013
Forward Looking Statements
This presentation contains both historical and forward-looking statements. All statements other than statements of historical fact are, or may be deemed to be, forward-looking statements within the meaning of Section 27A of the Securities Act of 1933, as amended, and Section 21E of the Securities Exchange Act of 1934, as amended. These forward-looking statements generally can be identified by the use of statements that include phrases such as “believe,” “expect,” “anticipate”, “intend”, “estimate”, “plan”, “project”, “foresee”, “likely”, “may”, “will”, “would”or other words or phrases with similar meanings. Similarly, statements that describe our objectives, plans or goals, particularly regarding our future financial performance and prospects are, or may be, forward-looking statements.
These statements are based on current expectations of future events. If underlying assumptions prove inaccurate or unknown risks or uncertainties materialize, actual results could vary materially from Catalent Pharma Solutions’ expectations and projections. Some of the factors that could cause actual results to differ include, but are not limited to, the following: general industry conditions and competition; product or other liability risk inherent in the design, development, manufacture and marketing of our offerings; inability to enhance our existing or introduce new technology or services in a timely manner; conditions in the credit markets and economic conditions generally, such as interest rate and currency exchange rate fluctuations; technological advances and patents attained by competitors; our substantial debt and debt service requirements that restrict our operating and financial flexibility and impose significant interest and financial costs; and our ability to successfully integrate acquired businesses and realize any anticipated synergies and cost reductions. For a more detailed discussion of these and other factors, see the information under the caption “Risk Factors” in our most recent Annual Report on Form 10-K filed with the Securities and Exchange Commission. All forward-looking statements speak only as of the date of this release or as of the date they are made, and Catalent Pharma Solutions does not undertake any obligation to update any forward-looking statements as a result of new information or future events or developments unless required by law.
The selected preliminary financial data for the Company’s three and twelve months ended March 31, 2013 included in this presentation has been prepared by, and is the responsibility of, the management of the Company. The information and estimates have not been compiled or examined by the Company’s independent auditors and are subject to revision as the Company prepares its financial statements as of and for the three and nine months ended March 31, 2013. Because the Company has not completed its normal quarterly closing and review procedures for the three months ended March 31, 2013, and subsequent events may occur that require adjustments to these results, there can be no assurance that the final results for the three and twelve months ended March 31, 2013 included in this presentation will not differ materially from these estimates. These estimates should not be viewed as a substitute for financial statements prepared in accordance with U.S. GAAP or as a measure of performance. In addition, these estimated results for the three and twelve months ended March 31, 2013 are not necessarily indicative of the results to be achieved for any future period.
1
Non-GAAP Financial Measures
Management measures operating performance based on consolidated earnings from continuing operations before interest expense, expense/ (benefit) for income taxes and depreciation and amortization and adjusted for the income or loss attributable to non-controlling interest (“EBITDA from continuing operations”). EBITDA from continuing operations is not defined under U.S. GAAP and is not a measure of operating income, operating performance or liquidity presented in accordance with U.S. GAAP and is subject to important limitations.
We believe that the presentation of EBITDA from continuing operations enhances an investor’s understanding of our financial performance. We believe this measure is a useful financial metric to assess our operating performance from period to period by excluding certain items that we believe are not representative of our core business and use this measure for business planning purposes. In addition, given the significant investments that we have made in the past in property, plant and equipment, depreciation and amortization expenses represent a meaningful portion of our cost structure. We believe that EBITDA from continuing operations will provide investors with a useful tool for assessing the comparability between periods of our ability to generate cash from operations sufficient to pay taxes, to service debt and to undertake capital expenditures because it eliminates depreciation and amortization expense. We present EBITDA from continuing operations in order to provide supplemental information that we consider relevant for the readers of the financial statements, and such information is not meant to replace or supersede U.S. GAAP measures. Our definition of EBITDA from continuing operations may not be the same as similarly titled measures used by other companies.
In addition, the Company evaluates the performance of its segments based on segment earnings before minority interest, other (income) expense, impairments, restructuring costs, interest expense, income tax (benefit)/expense, and depreciation and amortization (“Segment EBITDA”).
Under the indentures governing our outstanding notes, our ability to engage in certain activities such as incurring certain additional indebtedness, making certain investments and paying certain dividends is tied to ratios based on Adjusted EBITDA (which is defined as “EBITDA” in the indentures). Adjusted EBITDA is based on the definitions in our indentures, is not defined under U.S. GAAP and is subject to important limitations. We have included the calculations of Adjusted EBITDA for the periods presented.
Adjusted EBITDA is the covenant compliance measure used in certain covenants under the indentures governing our notes, particularly those governing debt incurrence and restricted payments. Because not all companies use identical calculations, our presentation of Adjusted EBITDA may not be comparable to other similarly titled measures of other companies.
The most directly comparable GAAP measure to EBITDA from continuing operations and Adjusted EBITDA is earnings / (loss) from continuing operations. A reconciliation of earnings / (loss) from continuing operations to EBITDA from continuing operations to Adjusted EBITDA is included as an appendix to this presentation.
2
Capitalization
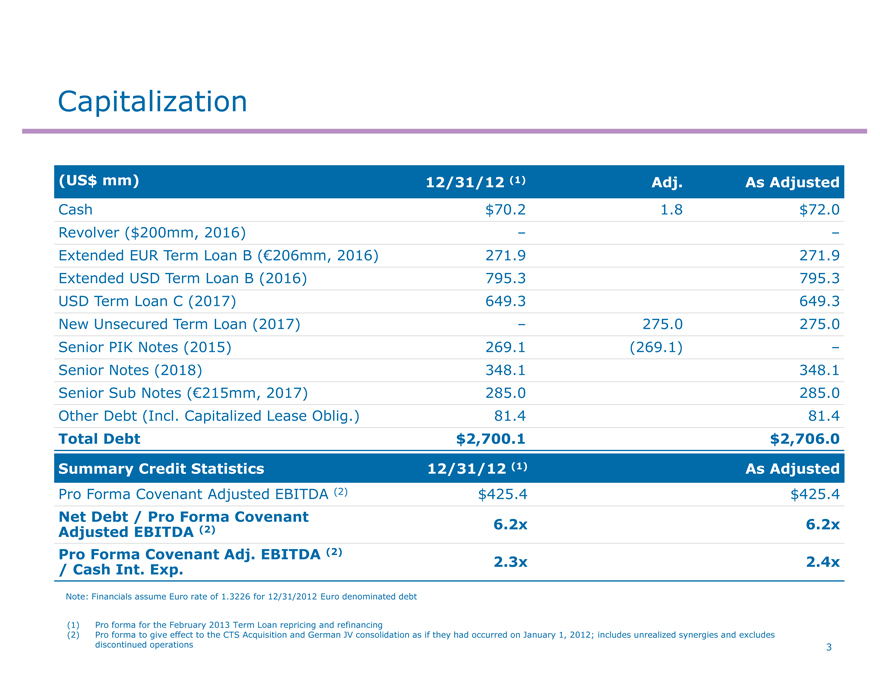
(US$ mm) 12/31/12 (1) Adj. As Adjusted
Cash $70.2 1.8 $72.0
Revolver ($200mm, 2016) – –
Extended EUR Term Loan B (€206mm, 2016) 271.9 271.9
Extended USD Term Loan B (2016) 795.3 795.3
USD Term Loan C (2017) 649.3 649.3
New Unsecured Term Loan (2017) – 275.0 275.0
Senior PIK Notes (2015) 269.1 (269.1) –
Senior Notes (2018) 348.1 348.1
Senior Sub Notes (€215mm, 2017) 285.0 285.0
Other Debt (Incl. Capitalized Lease Oblig.) 81.4 81.4
Total Debt $2,700.1 $2,706.0
Summary Credit Statistics 12/31/12 (1) As Adjusted
Pro Forma Covenant Adjusted EBITDA (2) $425.4 $425.4
Net Debt / Pro Forma Covenant
Adjusted EBITDA (2) 6.2x 6.2x
Pro Forma Covenant Adj. EBITDA (2) 2.3x 2.4x
/ Cash Int. Exp.
Note: Financials assume Euro rate of 1.3226 for 12/31/2012 Euro denominated debt
(1) Pro forma for the February 2013 Term Loan repricing and refinancing
(2) Pro forma to give effect to the CTS Acquisition and German JV consolidation as if they had occurred on January 1, 2012; includes unrealized synergies and excludes
discontinued operations
The Global Leader in Development Solutions & Advanced Delivery Technologies
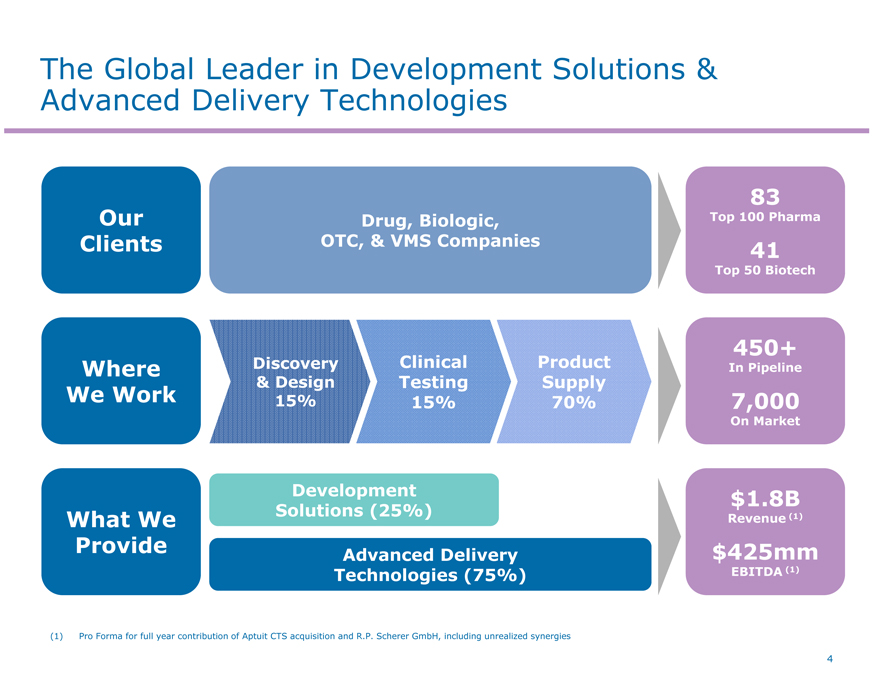
Our Clients
Where We Work
What We Provide
Discovery
& Design 15%
Clinical Testing 15%
Product Supply 70%
83
Top 100 Pharma
41
Top 50 Biotech
(1) Pro Forma for full year contribution of Aptuit CTS acquisition and R.P. Scherer GmbH, including unrealized synergies
4
450+
In Pipeline
7,000
On Market
Development Solutions (25%)
Advanced Delivery Technologies (75%)
$1.8B
Revenue (1)
$425mm
EBITDA (1)
Drug, Biologic, OTC, & VMS Companies
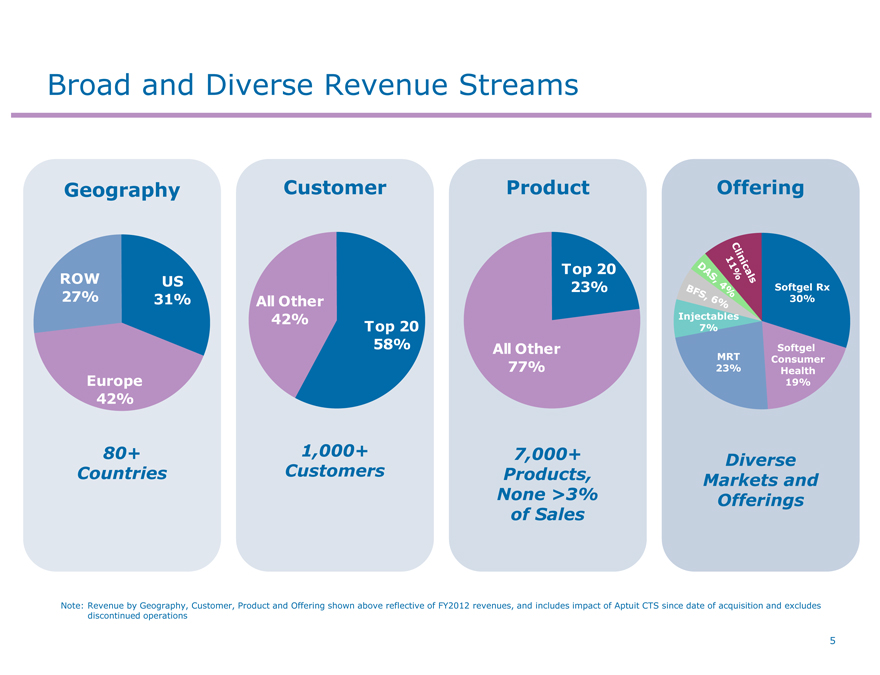
Broad and Diverse Revenue Streams
Geography
Customer
Product
Offering
ROW 27%
US 31%
Europe 42%
80+ Countries
All Other 42%
Top 20 58%
1,000+ Customers
Top 20 23%
All Other 77%
7,000+ Products, None >3% of Sales
Diverse Markets and Offerings
Note: Revenue by Geography, Customer, Product and Offering shown above reflective of FY2012 revenues, and includes impact of Aptuit CTS since date of acquisition and excludes discontinued operations
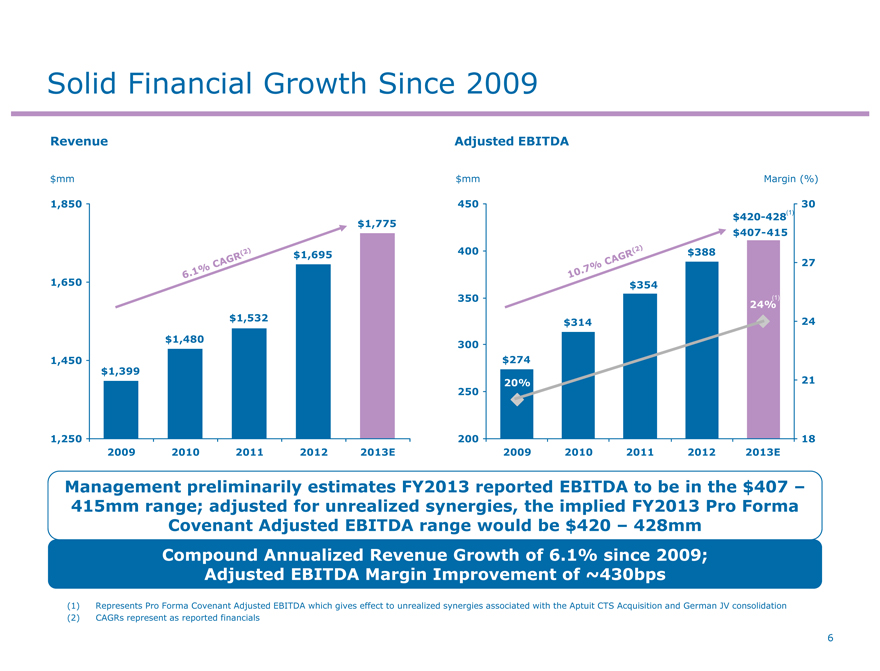
Solid Financial Growth Since 2009
Revenue Adjusted EBITDA
$mm
1,850
1,650
1,450
1,250
2009 2010 2011 2012 2013E
$mm
450 400 350 300 250 200
2009 2010 2011 2012 2013E
Margin (%)
$ 420-428(1)
$407-415
Management preliminarily estimates FY2013 reported EBITDA to be in the $407 –415mm range; adjusted for unrealized synergies, the implied FY2013 Pro Forma Covenant Adjusted EBITDA range would be $420 – 428mm
Compound Annualized Revenue Growth of 6.1% since 2009; Adjusted EBITDA Margin Improvement of ~430bps
(1) Represents Pro Forma Covenant Adjusted EBITDA which gives effect to unrealized synergies associated with the Aptuit CTS Acquisition and German JV consolidation (2) CAGRs represent as reported financials
6
Financial Momentum at Catalent
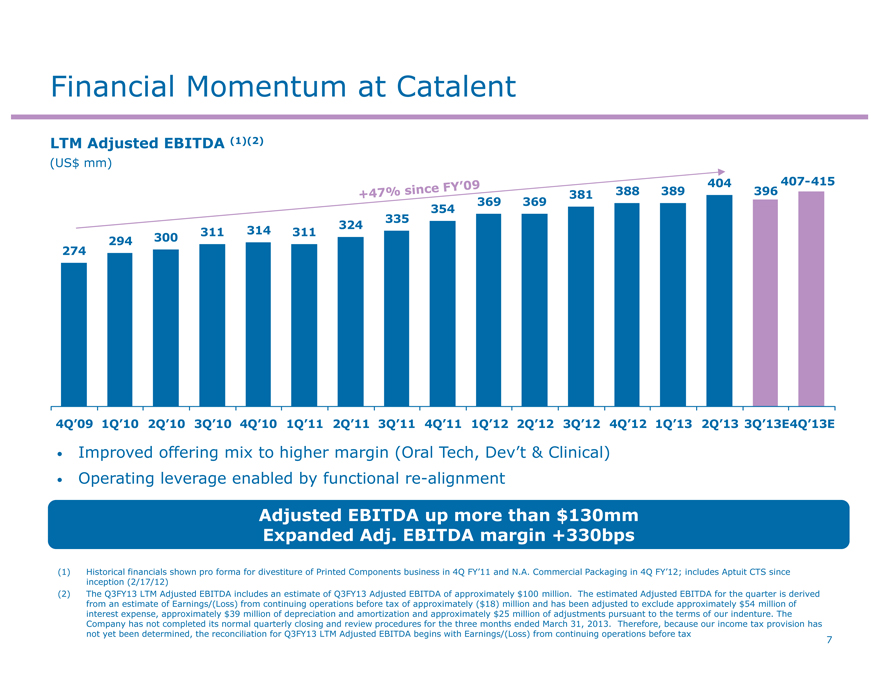
LTM Adjusted EBITDA (1)(2)
(US$ mm)
369
4Q’09 1Q’10 2Q’10 3Q’10 4Q’10 1Q’11 2Q’11 3Q’11 4Q’11 1Q’12 2Q’12 3Q’12 4Q’12 1Q’13 2Q’13 3Q’13E4Q’13E
Improved offering mix to higher margin (Oral Tech, Dev’t & Clinical)
Operating leverage enabled by functional re-alignment
Adjusted EBITDA up more than $130mm Expanded Adj. EBITDA margin +330bps
(1) Historical financials shown pro forma for divestiture of Printed Components business in 4Q FY’11 and N.A. Commercial Packaging in 4Q FY’12; includes Aptuit CTS since inception (2/17/12) (2) The Q3FY13 LTM Adjusted EBITDA includes an estimate of Q3FY13 Adjusted EBITDA of approximately $100 million. The estimated Adjusted EBITDA for the quarter is derived from an estimate of Earnings/(Loss) from continuing operations before tax of approximately ($18) million and has been adjusted to exclude approximately $54 million of interest expense, approximately $39 million of depreciation and amortization and approximately $25 million of adjustments pursuant to the terms of our indenture. The Company has not completed its normal quarterly closing and review procedures for the three months ended March 31, 2013. Therefore, because our income tax provision has not yet been determined, the reconciliation for Q3FY13 LTM Adjusted EBITDA begins with Earnings/(Loss) from continuing operations before tax
7

Q&A
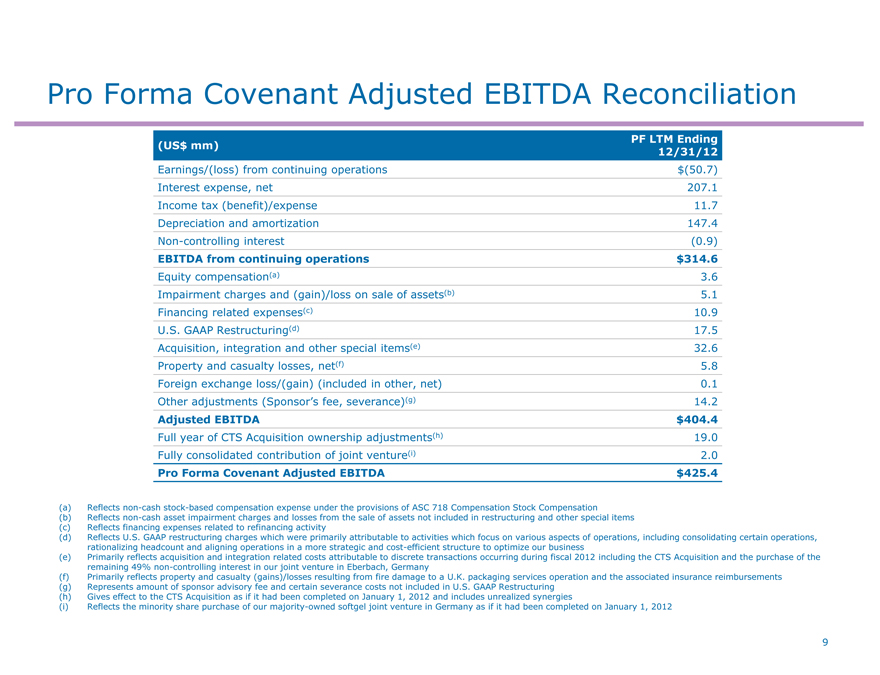
Pro Forma Covenant Adjusted EBITDA Reconciliation
PF LTM Ending
(US$ mm)
12/31/12
Earnings/(loss) from continuing operations $(50.7)
Interest expense, net 207.1
Income tax (benefit)/expense 11.7
Depreciation and amortization 147.4
Non-controlling interest (0.9)
EBITDA from continuing operations $ 314.6
Equity compensation(a) 3.6
Impairment charges and (gain)/loss on sale of assets(b) 5.1
Financing related expenses(c) 10.9
U.S. GAAP Restructuring(d) 17.5
Acquisition, integration and other special items(e) 32.6
Property and casualty losses, net(f) 5.8
Foreign exchange loss/(gain) (included in other, net) 0.1
Other adjustments (Sponsor’s fee, severance)(g) 14.2
Adjusted EBITDA $ 404.4
Full year of CTS Acquisition ownership adjustments(h) 19.0
Fully consolidated contribution of joint venture(i) 2.0
Pro Forma Covenant Adjusted EBITDA $ 425.4
(a) Reflects non-cash stock-based compensation expense under the provisions of ASC 718 Compensation Stock Compensation
(b) Reflects non-cash asset impairment charges and losses from the sale of assets not included in restructuring and other special items (c) Reflects financing expenses related to refinancing activity
(d) Reflects U.S. GAAP restructuring charges which were primarily attributable to activities which focus on various aspects of operations, including consolidating certain operations, rationalizing headcount and aligning operations in a more strategic and cost-efficient structure to optimize our business (e) Primarily reflects acquisition and integration related costs attributable to discrete transactions occurring during fiscal 2012 including the CTS Acquisition and the purchase of the remaining 49% non-controlling interest in our joint venture in Eberbach, Germany (f) Primarily reflects property and casualty (gains)/losses resulting from fire damage to a U.K. packaging services operation and the associated insurance reimbursements (g) Represents amount of sponsor advisory fee and certain severance costs not included in U.S. GAAP Restructuring (h) Gives effect to the CTS Acquisition as if it had been completed on January 1, 2012 and includes unrealized synergies (i) Reflects the minority share purchase of our majority-owned softgel joint venture in Germany as if it had been completed on January 1, 2012
9
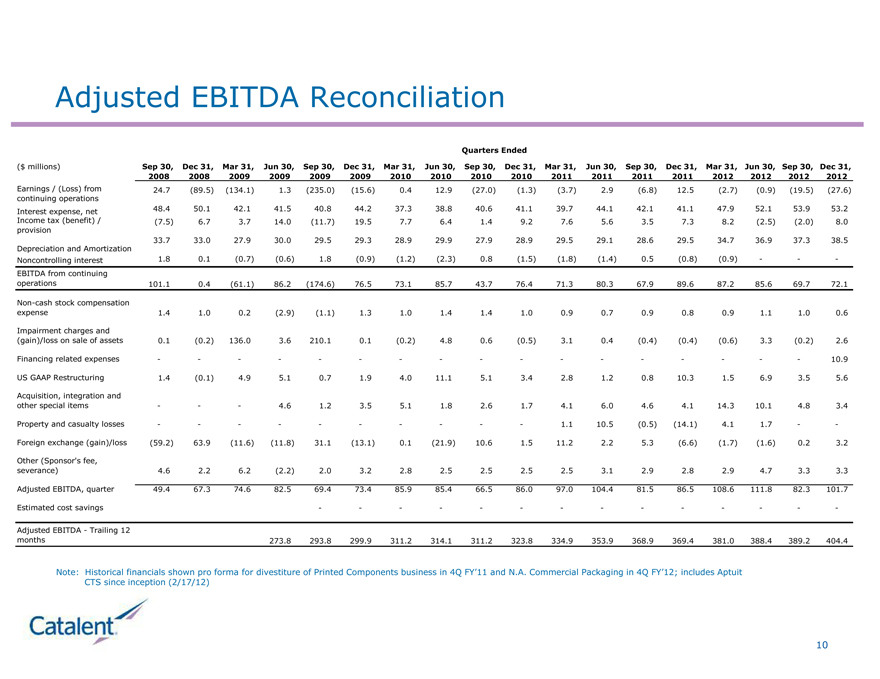
Adjusted EBITDA Reconciliation
Quarters Ended
($ millions) Sep 30, Dec 31, Mar 31, Jun 30, Sep 30, Dec 31, Mar 31, Jun 30, Sep 30, Dec 31, Mar 31, Jun 30, Sep 30, Dec 31, Mar 31, Jun 30, Sep 30, Dec 31,
2008 2008 2009 2009 2009 2009 2010 2010 2010 2010 2011 2011 2011 2011 2012 2012 2012 2012
Earnings / (Loss) from 24.7 (89.5) (134.1) 1.3 (235.0) (15.6) 0.4 12.9 (27.0) (1.3) (3.7) 2.9 (6.8) 12.5 (2.7) (0.9) (19.5) (27.6)
continuing operations
Interest expense, net 48.4 50.1 42.1 41.5 40.8 44.2 37.3 38.8 40.6 41.1 39.7 44.1 42.1 41.1 47.9 52.1 53.9 53.2
Income tax (benefit) / (7.5) 6.7 3.7 14.0 (11.7) 19.5 7.7 6.4 1.4 9.2 7.6 5.6 3.5 7.3 8.2 (2.5) (2.0) 8.0
provision
33.7 33.0 27.9 30.0 29.5 29.3 28.9 29.9 27.9 28.9 29.5 29.1 28.6 29.5 34.7 36.9 37.3 38.5
Depreciation and Amortization
Noncontrolling interest 1.8 0.1 (0.7) (0.6) 1.8 (0.9) (1.2) (2.3) 0.8 (1.5) (1.8) (1.4) 0.5 (0.8) (0.9) ---
EBITDA from continuing
operations 101.1 0.4 (61.1) 86.2 (174.6) 76.5 73.1 85.7 43.7 76.4 71.3 80.3 67.9 89.6 87.2 85.6 69.7 72.1
Non-cash stock compensation
expense 1.4 1.0 0.2 (2.9) (1.1) 1.3 1.0 1.4 1.4 1.0 0.9 0.7 0.9 0.8 0.9 1.1 1.0 0.6
Impairment charges and
(gain)/loss on sale of assets 0.1 (0.2) 136.0 3.6 210.1 0.1 (0.2) 4.8 0.6 (0.5) 3.1 0.4 (0.4) (0.4) (0.6) 3.3 (0.2) 2.6
Financing related expenses ---- ----------- - - 10.9
US GAAP Restructuring 1.4 (0.1) 4.9 5.1 0.7 1.9 4.0 11.1 5.1 3.4 2.8 1.2 0.8 10.3 1.5 6.9 3.5 5.6
Acquisition, integration and
other special items - - - 4.6 1.2 3.5 5.1 1.8 2.6 1.7 4.1 6.0 4.6 4.1 14.3 10.1 4.8 3.4
Property and casualty losses ---------- 1.1 10.5 (0.5) (14.1) 4.1 1.7 - -
Foreign exchange (gain)/loss (59.2) 63.9 (11.6) (11.8) 31.1 (13.1) 0.1 (21.9) 10.6 1.5 11.2 2.2 5.3 (6.6) (1.7) (1.6) 0.2 3.2
Other (Sponsor’s fee,
severance) 4.6 2.2 6.2 (2.2) 2.0 3.2 2.8 2.5 2.5 2.5 2.5 3.1 2.9 2.8 2.9 4.7 3.3 3.3
Adjusted EBITDA, quarter 49.4 67.3 74.6 82.5 69.4 73.4 85.9 85.4 66.5 86.0 97.0 104.4 81.5 86.5 108.6 111.8 82.3 101.7
Estimated cost savings ----------- - - -
Adjusted EBITDA - Trailing 12
months 273.8 293.8 299.9 311.2 314.1 311.2 323.8 334.9 353.9 368.9 369.4 381.0 388.4 389.2 404.4
Note: Historical financials shown pro forma for divestiture of Printed Components business in 4Q FY’11 and N.A. Commercial Packaging in 4Q FY’12; includes Aptuit
CTS since inception (2/17/12)
10
