Attached files
| file | filename |
|---|---|
| EX-99.1 - EX-99.1 - MOLEX INC | d524090dex991.htm |
| 8-K - 8-K - MOLEX INC | d524090d8k.htm |
 April 23,
2013 Exhibit 99.2
FY13 Q3 Conference Call
|
 Page
1 Page 1
Statements in this release that are not historical are forward-looking and are subject to various
risks and uncertainties that could cause actual results to vary materially from those
stated. Words such as “expect,” “anticipate,” “outlook,”
“forecast,” “could,” “project,” “intend,” “plan,” “continue,” “believe,” “seek,”
“estimate,” “should,” “may,” “assume,” “potential,”
variations of such words and similar expressions are intended to identify such
forward-looking statements. Forward-looking statements are based on currently
available information and include, among others, the discussion under “Outlook.” These
statements are not guarantees of future performance and involve certain risks, uncertainties and
assumptions that are difficult to predict. Respective risks, uncertainties, and assumptions
that could affect the outcome or results of operations are described in Part 1, Item 1A of our
Annual Report on Form 10-K for the year ended June 30, 2012, and the Form 10-Q for the
quarters ended September 30, 2012 and December 31, 2012 which is incorporated by reference and
in other reports that Molex files or furnishes with the Securities and Exchange
Commission.
We have based our forward-looking statements on our management’s beliefs and assumptions
based on information available to management at the time the statements are made. We caution
you that actual outcomes and results may differ materially from what is expressed, implied, or
forecasted by our forward-looking statements. Reference is made in particular to
forward-looking statements regarding growth strategies, industry trends, global economic
conditions, success of customers, cost of raw materials, value of inventory, foreign currency
exchange rates, labor costs, protection of intellectual property, cost reduction initiatives,
acquisition synergies, manufacturing strategies, product development introduction and sales,
regulatory changes, competitive strengths, income tax fluctuations, natural disasters,
unauthorized access to data, government investigations and outcomes of legal proceedings.
Except as required under the federal securities laws, we do not have any intention or obligation to
update publicly any forward-looking statements after the distribution of this report,
whether as a result of new information, future events, changes in assumptions, or
otherwise.
Forward-Looking Statement |
 Page
2 Page 2
In Molex Incorporated’s (“Molex” or the “Company”) conference call on
April 23, 2013 regarding the Company’s financial results for the third fiscal
quarter ended March 31, 2013 and the following slides, Molex may refer to non-GAAP
financial measures to describe earnings for such periods excluding the items
referenced in the relevant slides used during this conference call. This is in
addition to disclosing the most directly comparable measure for such periods
determined in accordance with generally accepted accounting principles, or
GAAP. Molex believes that these non-GAAP financial measures provide useful
information to investors because they provide information about the estimated
financial performance of Molex’s ongoing business and provide for greater
transparency of supplemental information used by management in its financial
and operational decision-making. These non-GAAP financial measures may be
different from non-GAAP financial measures used by other companies. Non-
GAAP financial measures should not be considered as a substitute for, or
superior to, measures of financial performance prepared in accordance with
GAAP.
Investors are encouraged to review the relevant slides reconciling the non-
GAAP financial measures intended to be used in the conference call to the most
comparable GAAP
measure.
Non-GAAP Financial Measures |
 FY13 Q3
Summary Page 3
Page 3
Settled litigation with Mizuho Bank
Weaker than expected revenue from
mobile phones / tablets
Strong execution despite poor
operating environment
Solid balance sheet, liquidity and
cash flow potential supports
dividend increase |
 Page
4 Page 4
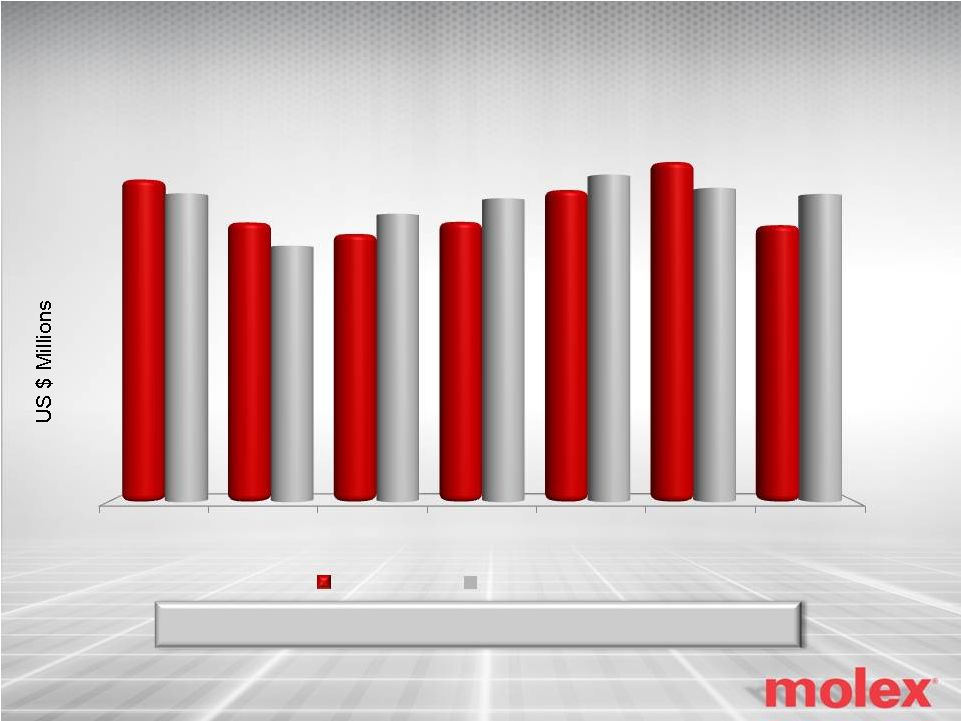
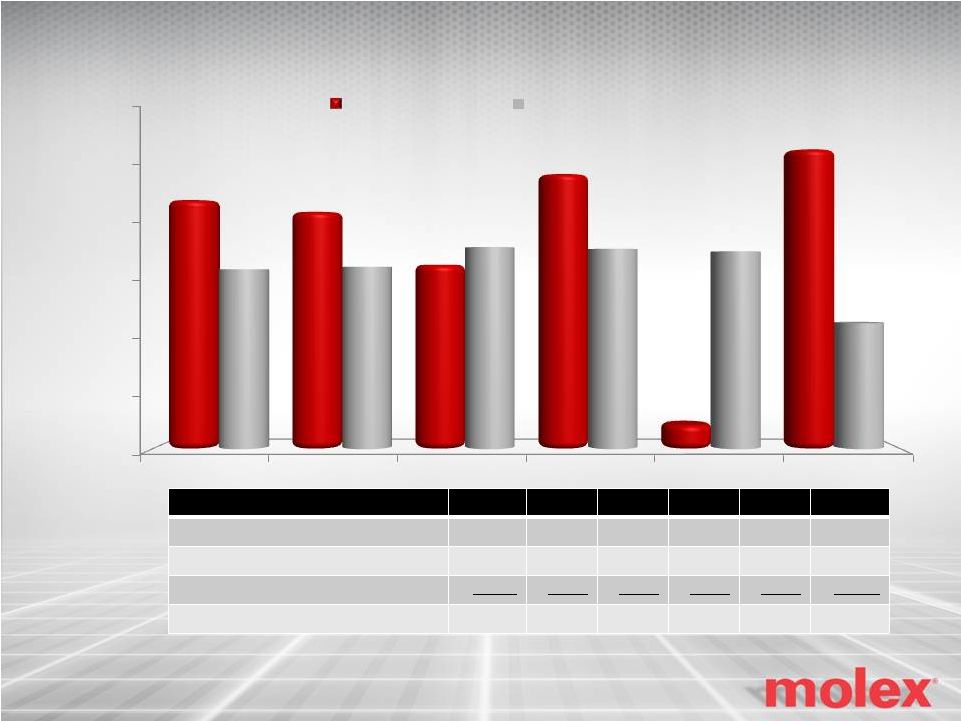
Revenue / Order Trend
Q1 12
Q2 12
Q3 12
Q4 12
Q1 13
Q2 13
Q3 13
$910
$815
$873
$901
$944
$920
$909
Revenue
Orders
$936
$858
$837
$859
$917
$968
$853
Q3 Book-to-Bill 1.07 to 1 |
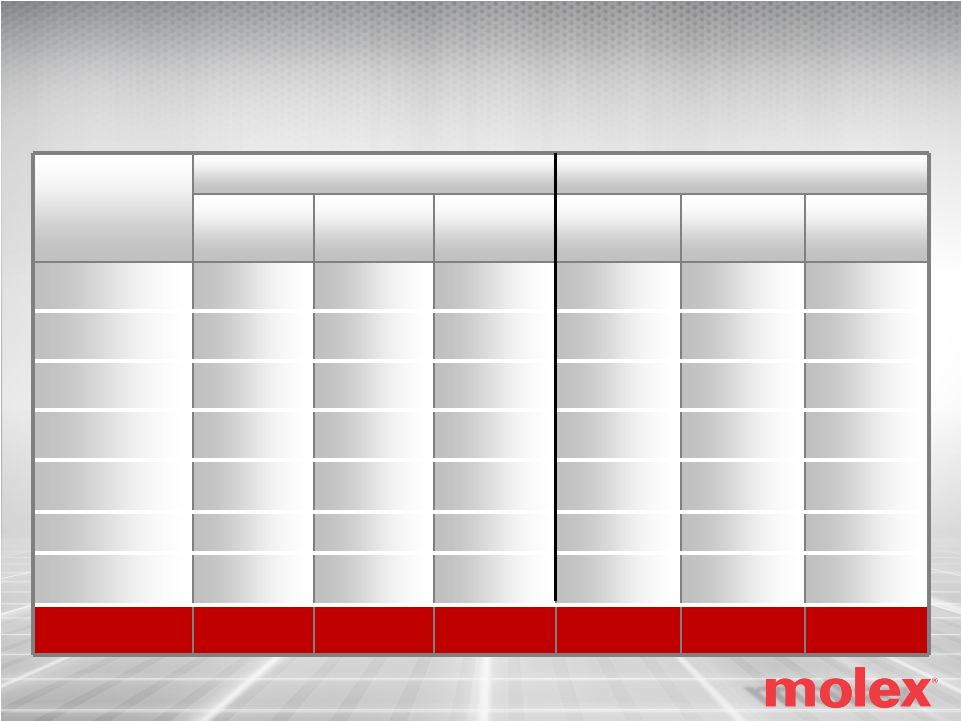 REVENUE
ORDERS
Sequential
Change
YOY
Change
%
Total
Sequential
Change
YOY
Change
%
Total
Automotive
10%
13%
20%
13%
14%
19%
Infotech
(6)%
(10)%
17%
2%
(7)%
17%
Telecom
(7)%
(9)%
13%
3%
(17)%
12%
Mobile Devices
(37)%
35%
19%
(19)%
56%
21%
Consumer
Elect.
(17)%
(19)%
13%
(6)%
(18)%
13%
Industrial
6%
(5)%
13%
18%
1%
14%
Medical /
Military
2%
35%
5%
(8)%
20%
4%
TOTAL
(12)%
2%
100%
(1)%
4%
100%
Page 5
Page 5
Change in Revenue / Orders
By Industry –
March Quarter |
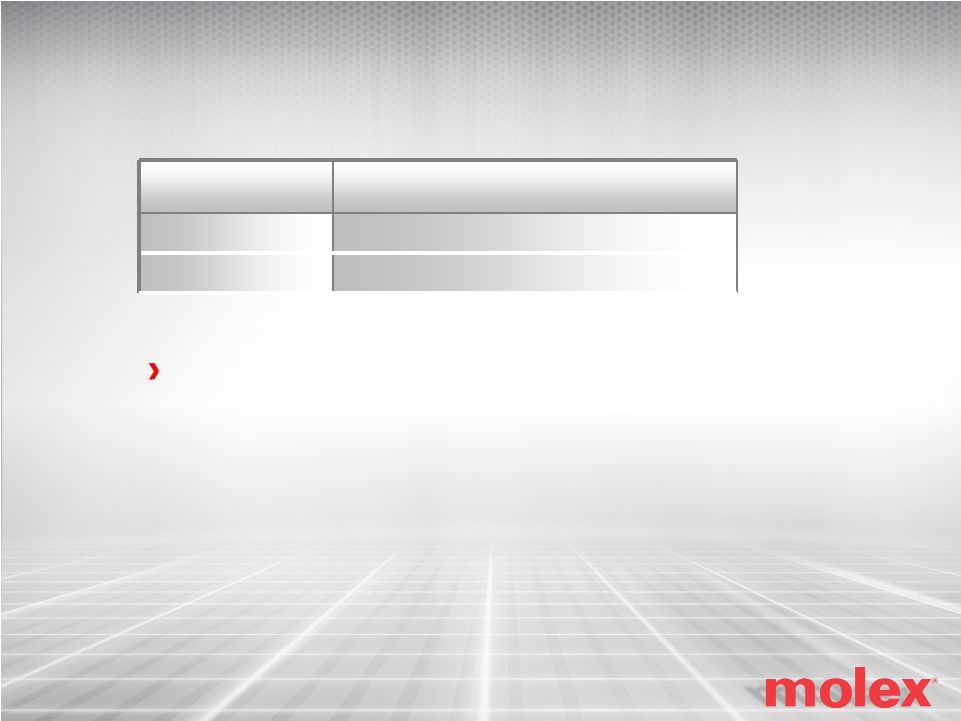
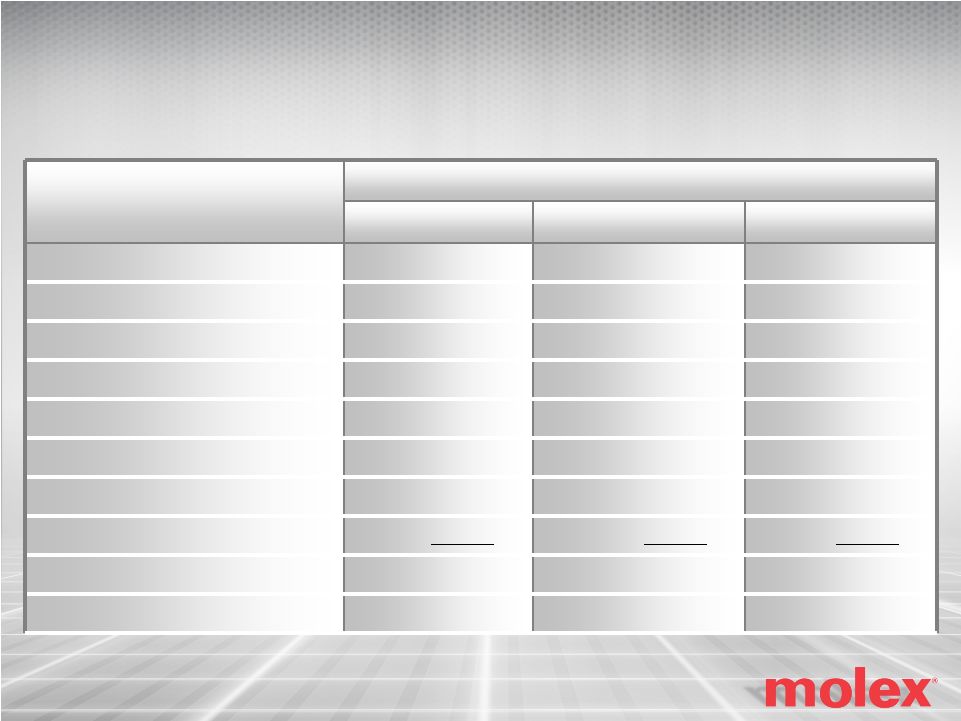 Quarter
Ended Mar 2013
Dec 2012
Mar 2012
Net revenue
$852.9
$967.7
$837.1
Gross margin
29.1%
29.9%
30.5%
SG&A
$167.4
$181.0
$163.9
Unauthorized activities in Japan
$21.2
$1.6
$2.5
Income from operations
$59.9
$106.5
$88.8
Interest (expense) net
$(1.6)
$(1.1)
$(1.2)
Other (expense) income
$0.3
$(3.2)
$1.6
Effective tax rate
23.6%
31.1%
27.2%
Net income
$44.8
$70.4
$64.9
Earnings per diluted share
$0.25
$0.39
$0.36
(US$ in millions, except per-share data)
Page 6
Page 6
Financial Summary |
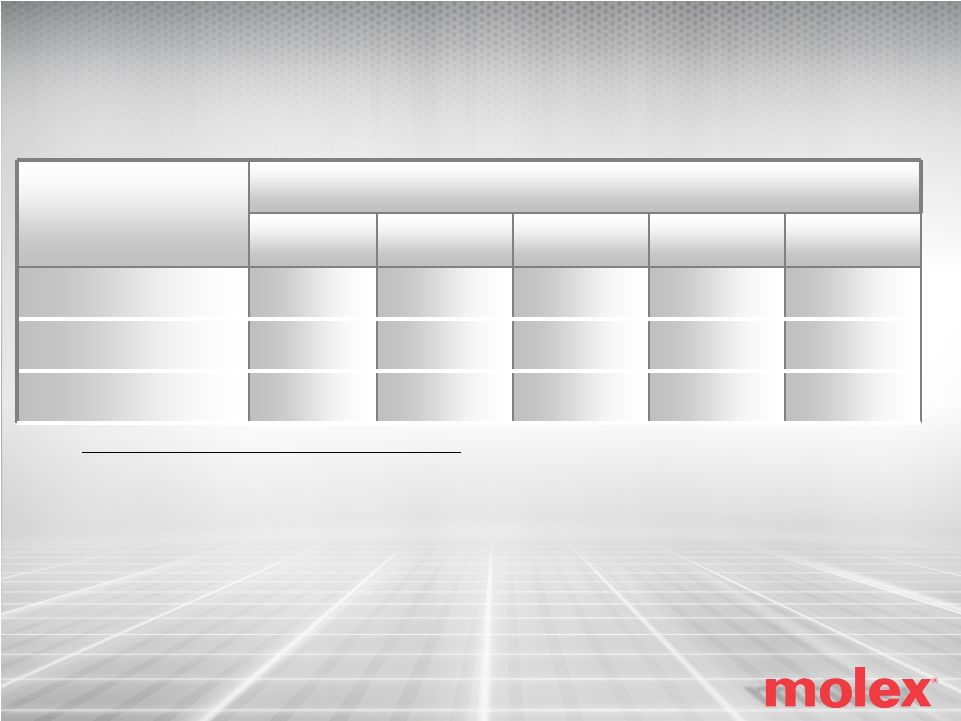
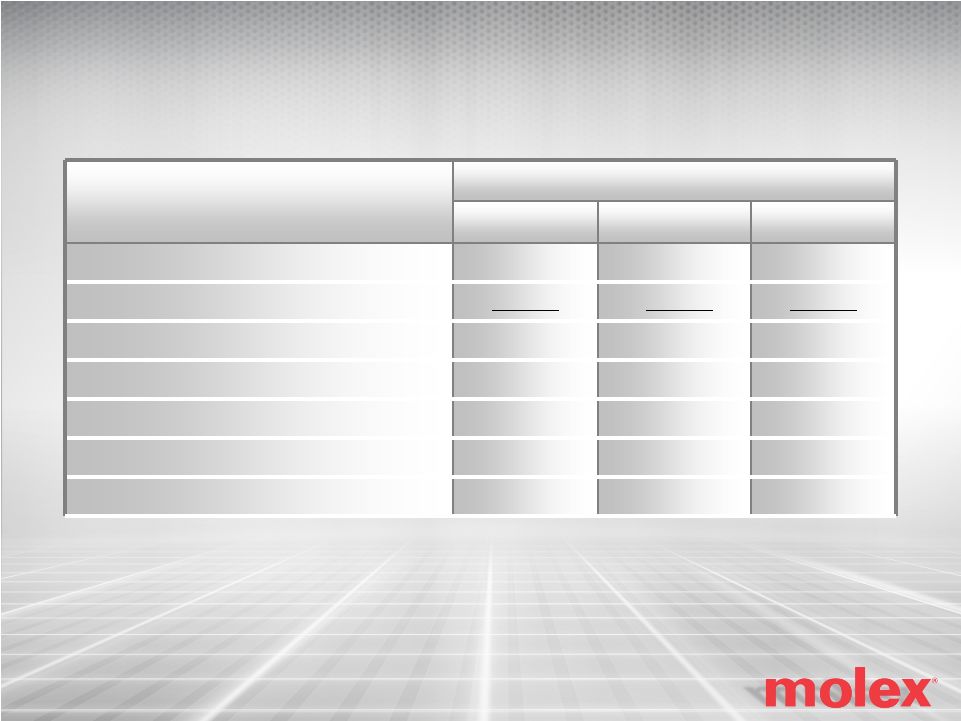 Quarter
Ended Mar 2013
Dec 2012
Mar 2012
Cash and marketable securities
$712.9
$716.8
$622.5
Total debt*
$399.8
$341.9
$252.2
Net cash
$313.1
$374.9
$370.3
Receivable days outstanding
70 Days
67 days
72 Days
Inventory days outstanding
89 Days
83 days
93 Days
Return on net assets**
18.6%
19.1%
20.1%
Research and development
$46.2
$47.9
$45.7
(US$ in millions)
*Total debt equals long-term debt plus current portion of long-term
debt and short-term loans, less current portion of capital leases
Page 7
Page 7
**See GAAP to non-GAAP reconciliation
Balance Sheet and Operating Metrics |
 Page
8 Page 8
Q2 12
Q3 12
Q4 12
Q1 13
Q2 13
Q3 13
$141.0
$138.9
$143.3
$167.4
$87.2
$(20.1)
$(52.3)
$(54.4)
$(77.7)
$(69.4)
$(78.6)
$(55.9)
-
-
-
-
-
$182.8
Free Cash Flow (non-GAAP measure)
$88.7
$84.5
$65.6
$98.0
$8.6
$106.8
US $ in millions
*See unauthorized activities in Japan section
of our press release dated April 23, 2013
Free Cash Flow Trend
0
20
40
60
80
100
120
Q2 12
Q3 12
Q4 12
Q1 13
Q2 13
Q3 13
Free Cash Flow
Net Income
Cash Flow From Operations
Less: Capital Expenditures
Add: Japan Litigation Settlement* |
 June Fiscal
Quarter Revenue
$870 to $910 million
EPS
$0.33 to $0.37
Assumes
–
30% to 32% effective tax rate
–
Constant foreign exchange rates and
commodity prices
Page 9
Page 9
Outlook
Outlook |
 |
 Quarter
Ended Mar
2013
Dec
2012
Sep
2012
Jun
2012
Mar
2012
Income from
operations
$59,938
$106,515
$102,735
$92,948
$88,802
Unauthorized
activities in Japan
21,210
1,627
2,561
3,093
2,521
Non-GAAP income
from operations
$81,148
$108,142
$105,296
$96,041
$91,323
(US$ in thousands)
Non-GAAP income from operations is a non-GAAP financial measure. We refer to
non-GAAP income from operations to describe income from operations excluding the
items referenced above. We believe that non- GAAP income from operations
provides useful information to investors because it provides information about the
estimated financial performance of Molex’s ongoing business. Non-GAAP income from operations is used
by management in its financial and operational decision-making and evaluation of overall
operating performance and segment level core operating performance. Non-GAAP
income from operations may be different from similar measures used by other
companies. Operating
income
excluding
restructuring
and
special
charges
Fixed
assets
+
Inventory
+
A/R
–
A/P
RONA =
Non-GAAP Measure |
   (US$ in
millions) Revenue
Q4 FY11
Q1 FY12
Q2 FY12
Q3 FY12
Q4 FY12
Q1 FY13
Q2 FY13
Q3 FY13
Automotive
$143.2
$143.9
$135.3
$151.0
$150.0
$150.9
$155.5
$171.3
Infotech
168.4
163.1
159.9
156.5
162.0
154.9
150.8
141.5
Telecom
138.9
129.5
134.2
119.6
127.7
132.0
116.7
108.4
Mobile Devices
144.8
168.9
138.1
122.2
117.4
182.5
262.4
165.3
Consumer Elect.
155.3
177.8
154.6
140.6
149.6
149.9
137.2
114.1
Industrial
134.6
126.1
109.5
117.0
121.0
116.1
105.0
111.6
Medical/Military
28.5
26.7
26.0
30.2
30.8
30.6
40.1
40.7
Total
$913.7
$936.0
$857.6
$837.1
$858.5
$916.9
$967.7
$852.9
Orders
Q4 FY11
Q1 FY12
Q2 FY12
Q3 FY12
Q4 FY12
Q1 FY13
Q2 FY13
Q3 FY13
Automotive
$134.9
$148.5
$133.1
$153.9
$149.1
$151.6
$155.8
$176.1
Infotech
172.2
155.7
151.9
163.5
158.4
149.9
149.3
151.7
Telecom
137.2
121.0
120.6
134.3
122.3
129.1
108.6
111.4
Mobile Devices
145.0
169.3
127.3
120.5
170.9
221.6
231.0
187.4
Consumer Elect.
155.4
175.5
146.8
146.1
149.9
150.6
127.4
119.9
Industrial
133.7
114.4
109.5
121.1
119.7
109.9
104.4
122.8
Medical/Military
27.6
25.6
26.1
33.2
30.7
31.2
43.2
39.9
Total
$906.0
$910.0
$815.3
$872.6
$901.0
$943.9
$919.7
$909.2
End Market Trend |