Attached files
| file | filename |
|---|---|
| EX-31.2 - EX-31.2 - FREEPORT-MCMORAN INC | d523624dex312.htm |
| EX-31.1 - EX-31.1 - FREEPORT-MCMORAN INC | d523624dex311.htm |
Table of Contents
UNITED STATES
SECURITIES AND EXCHANGE COMMISSION
Washington, D.C. 20549
FORM 10-K/A
Amendment No. 1
(Mark One)
| x | ANNUAL REPORT PURSUANT TO SECTION 13 OR 15(d) OF THE SECURITIES EXCHANGE ACT OF 1934 |
For the fiscal year ended December 31, 2012
OR
| ¨ | TRANSITION REPORT PURSUANT TO SECTION 13 OR 15(d) OF THE SECURITIES EXCHANGE ACT OF 1934 |
For the transition period from to
Commission File Number: 001-11307-01

Freeport-McMoRan Copper & Gold Inc.
(Exact name of registrant as specified in its charter)
| Delaware | 74-2480931 | |
| (State or other jurisdiction of incorporation or organization) | (I.R.S. Employer Identification No.) | |
| 333 North Central Avenue Phoenix, Arizona |
85004-2189 | |
| (Address of principal executive offices) | (Zip Code) | |
(602) 366-8100
(Registrant’s telephone number, including area code)
Securities registered pursuant to Section 12(b) of the Act:
| Title of each class |
Name of each exchange on which registered | |
| Common Stock, par value $0.10 per share | New York Stock Exchange |
Securities registered pursuant to Section 12(g) of the Act: None
Indicate by check mark if the registrant is a well-known seasoned issuer, as defined in Rule 405 of the Securities Act. x Yes ¨ No
Indicate by check mark if the registrant is not required to file reports pursuant to Section 13 or Section 15(d) of the Act. ¨ Yes x No
Indicate by check mark whether the registrant (1) has filed all reports required to be filed by Section 13 or 15(d) of the Securities Exchange Act of 1934 during the preceding 12 months (or for such shorter period that the registrant was required to file such reports), and (2) has been subject to such filing requirements for the past 90 days. x Yes ¨ No
Indicate by check mark whether the registrant has submitted electronically and posted on its corporate Website, if any, every Interactive Data File required to be submitted and posted pursuant to Rule 405 of Regulation S-T during the preceding 12 months (or for such shorter period than the registrant was required to submit and post such files). x Yes ¨ No
Indicate by check mark if disclosure of delinquent filers pursuant to Item 405 of Regulation S-K is not contained herein, and will not be contained, to the best of the registrant’s knowledge, in definitive proxy or information statements incorporated by reference in Part III of this Form 10-K or any amendment to this Form 10-K. x
Indicate by check mark whether the registrant is a large accelerated filer, an accelerated filer, a non-accelerated filer, or a smaller reporting company. See the definitions of “large accelerated filer,” “accelerated filer” and “smaller reporting company” in Rule 12b-2 of the Exchange Act (Check one):
| x | Large accelerated filer | ¨ | Accelerated filer | |||
| ¨ | Non-accelerated filer | ¨ | Smaller reporting company |
Indicate by check mark whether the registrant is a shell company (as defined in Rule 12b-2 of the Act). ¨ Yes x No
The aggregate market value of common stock held by non-affiliates of the registrant was $31.1 billion on March 22, 2013, and $32.1 billion on June 29, 2012.
Common stock issued and outstanding was 949,739,265 shares on March 22, 2013, and 949,186,881 shares on June 29, 2012.
DOCUMENTS INCORPORATED BY REFERENCE
None
Table of Contents
EXPLANATORY NOTE
Freeport-McMoRan Copper & Gold Inc. (the Company or FCX) is filing this Amendment No. 1 (this Amendment) to its Annual Report on Form 10-K for the fiscal year ended December 31, 2012 (the Form 10-K) previously filed with the Securities and Exchange Commission (SEC) on February 22, 2013 for the purpose of amending Part III of the Form 10-K to include the information that was to be incorporated by reference to its definitive proxy statement relating to its 2013 Annual Meeting. There are no other changes to the Registrant’s Form 10-K. As a result of this Amendment, Part IV of the Form 10-K is being amended solely to add as exhibits certain new certifications in accordance with Rule 13a-14(a) promulgated by the SEC under the Securities Exchange Act of 1934, as amended, with paragraphs 3, 4 and 5 omitted since no financial statements are contained within this Amendment. Because no financial statements are contained within this Amendment, the Company also is not including certifications pursuant to Section 906 of the Sarbanes-Oxley Act of 2002 nor any disclosure with respect to Items 307 or 308 of Regulation S-K.
Except as otherwise expressly stated herein, this Amendment does not reflect events occurring after the date of the Form 10-K nor does it modify or update the disclosure contained in the Form 10-K in any way other than as required to reflect the amendments to Part III discussed above and reflected below. Accordingly, this Amendment should be read in conjunction with our Form 10-K and our other filings made with the SEC subsequent to the filing of the Form 10-K.
As used in this Amendment, when the Company refers to “us”, “we”, “our”, “ours”, “the company”, or “FCX”, the Company is describing Freeport-McMoRan Copper & Gold Inc. and/or its consolidated subsidiaries.
Table of Contents
| Page | ||||||
| Part III | ||||||
| Item 10. |
Directors, Executive Officers and Corporate Governance | 1 | ||||
| Item 11. |
Executive Compensation | 9 | ||||
| Item 12. |
Security Ownership of Certain Beneficial Owners and Management and Related Stockholder Matters | 43 | ||||
| Item 13. |
Certain Relationships and Related Transactions, and Director Independence | 46 | ||||
| Item 14. |
Principal Accounting Fees and Services | 47 | ||||
| Part IV | ||||||
| Item 15. |
Exhibits, Financial Statement Schedules | 49 | ||||
| S-1 | ||||||
| E-1 | ||||||
Table of Contents
Item 10. Directors, Executive Officers and Corporate Governance.
The information required by Item 10 regarding our executive officers appeared in a separately captioned heading after Item 4 in Part I of our Annual Report on Form 10-K for the fiscal year ended December 31, 2012 filed with the SEC on February 22, 2013, which information is incorporated herein by reference.
Information About Directors
The following table provides certain information as of March 1, 2013, with respect to each director, including information regarding the person’s business experience, director positions with other public companies held currently or at any time during the last five years, and the experiences, qualifications, attributes or skills that caused our nominating and corporate governance committee and the board to determine that the person should be nominated to serve as a director of the company. Unless otherwise indicated, each person has been engaged in the principal occupation shown for the past five years. Each director was elected to serve a one-year term at our 2012 annual meeting of stockholders held on June 14, 2012.
| Name of Director |
Age |
Principal Occupation, Business Experience, and Other Public Company Directorships |
Year First | |||
| Richard C. Adkerson |
66 | Chief Executive Officer of the company since December 2003. President of the company since January 2008 and from April 1997 to March 2007. Chief Financial Officer of the company from October 2000 to December 2003. Current Co-Chairman of the Board of McMoRan Exploration Co. (McMoRan). President and Chief Executive Officer of McMoRan from 1998 to 2004. Vice Chairman of Freeport-McMoRan Inc. from 1995 to 1997. Chairman, Chief Executive Officer & President of Stratus Properties Inc. from 1992 to 1998. Partner in Arthur Andersen & Co. where he served as a Managing Director and head of the firm’s global oil and gas industry services from 1978 to 1989. Professional Accounting Fellow with the Securities and Exchange Commission and Presidential Exchange Executive from 1976 to 1978. Holds B.S. in Accounting with highest honors and M.B.A. from Mississippi State University and completed Advanced Management Program at Harvard Business School. |
2006 | |||
| Mr. Adkerson is an experienced business leader making him highly qualified to serve as a member of the board of directors. As Chief Executive Officer and President, he is responsible for the executive management of the company. He has demonstrated exceptional leadership abilities in developing and executing a financial strategy that has benefited our stockholders, and in building an operational, financial and administrative organization that efficiently supports our business. Mr. Adkerson is recognized as a mining industry leader, having served as past Chairman of the International Council on Mining and Metals and on the Executive Board of the International Copper Association. |
||||||
1
Table of Contents
| Name of Director |
Age |
Principal Occupation, Business Experience, and Other Public Company Directorships |
Year First | |||
| Robert J. Allison, Jr. |
74 | Retired Chairman of the Board and Chief Executive Officer of Anadarko Petroleum Corporation. Chairman of the Board of Anadarko Petroleum Corporation from 1986 to 2005. President and Chief Executive Officer of Anadarko Petroleum Corporation from 1979 to 2002 and March 2003 to December 2003. Holds B.S. in Petroleum Engineering from The University of Kansas. Former director of Anadarko Petroleum Corporation. |
2001 | |||
| Mr. Allison’s experience serving as the former President and Chief Executive Officer and Chairman of the Board of one of the largest independent oil and gas exploration and production companies in the world provides him with a wealth of knowledge in dealing with operational, strategic, financial, regulatory and international matters at the board level. His business and board experience make him highly qualified to serve as the chairman of our nominating and corporate governance committee. |
||||||
| Robert A. Day |
69 | Chairman of the Board and founder of Trust Company of the West, an investment management company and one of the largest independent trust companies in the U.S. Chairman of Oakmont Corporation, a registered investment advisor. Chairman and Chief Executive Officer of W. M. Keck Foundation, a national philanthropic organization. Holds B.S. in Economics from Claremont McKenna College. Current director of McMoRan. Former director of Société Générale. |
1995 | |||
| Mr. Day is an experienced entrepreneur and financial leader with the skills necessary to serve on the board of directors and to lead our audit committee. With his background in economics and extensive experience in the financial services industry, Mr. Day is well-versed in accounting standards and regulations, and is equipped to evaluate financial results and generally oversee the financial reporting process of a large corporation. Mr. Day brings significant business and finance experience to the board and provides insight into strategies and solutions to address an increasingly complex business environment. |
||||||
2
Table of Contents
| Name of Director |
Age |
Principal Occupation, Business Experience, and Other Public Company Directorships |
Year First | |||
| Gerald J. Ford |
68 | Principal Shareholder and Chairman of the Board of Hilltop Holdings Inc. since August 2007, and a director of Hilltop Holdings Inc. since June 2005. General Partner of Ford Financial Fund, L.P., a private equity firm, from January 2010 to present. Chairman of the Board and Chief Executive Officer of Golden State Bancorp, Inc. and its wholly owned subsidiary, California Federal Bank, FSB, a Federal Savings Bank, from 1998 through its 2002 merger with Citigroup Inc. Chairman of the Board of First Acceptance Corporation from 1996 to 2010 and Chief Executive Officer of First Acceptance Corporation from 1996 to 2002. Holds B.A. in Economics and J.D. from Southern Methodist University. Current director of McMoRan, Hilltop Holdings Inc., SWS Group, Inc. and Scientific Games Corporation. Former director of First Acceptance Corporation, Liberté Investors, Inc., Americredit Corp., Affordable Residential Communities, Inc. and Pacific Capital Bancorp. |
2000 | |||
| Mr. Ford is a banking and financial institutions entrepreneur who has been involved in numerous mergers and acquisitions of private and public sector financial institutions, primarily in the Southwestern United States, over the past 30 years. In that capacity, he acquired and consolidated 30 commercial banks from 1975 to 1993, forming First United Bank Group, Inc., a multi-bank holding company for which he functioned as Chairman of the Board and Chief Executive Officer until its sale in 1994. During this period, he also led investment consortiums that acquired numerous financial institutions, forming in succession, First Gibraltar Bank, FSB, First Madison Bank, FSB and First Nationwide Bank. His extensive banking industry experience and educational background provide him with significant knowledge in dealing with financial, accounting and regulatory matters, making him a valuable member of the board of directors. In addition, his service on the board of directors and audit and corporate governance committees of a variety of public companies gives him a deep understanding of the role of the board and positions him well to serve as a member of our nominating and corporate governance and our audit committees. |
||||||
3
Table of Contents
| Name of Director |
Age |
Principal Occupation, Business Experience, and Other Public Company Directorships |
Year First | |||
| H. Devon Graham, Jr. |
78 | President of R. E. Smith Interests, an asset management company, from 1997 to present. U.S. Regional Managing Partner, Arthur Andersen from 1985 to 1997. Chairman of the Board of Partners of Arthur Andersen from 1984 to 1986. Holds B.S. in Accounting from Mississippi State University. Current director of McMoRan. |
2000 | |||
| Mr. Graham has over 40 years of experience in public accounting and has served in various leadership positions with an international accounting firm, including Chairman of the Board of Partners, member of the Worldwide Executive Committee, U.S. Regional Managing Partner, member of the U.S. Leadership Committee and Chairman of the Industry Steering Committee, making him a valuable member of the board of directors and our audit committee as well as chair of our compensation committee. In addition, Mr. Graham brings invaluable management and administrative experience as President of an asset management company. His experience provides him with the necessary skills to lead our compensation committee. |
||||||
| Charles C. Krulak |
70 | President of Birmingham-Southern College from March 2011 to present. Former Commandant, United States Marine Corps, the Marine Corps’ highest-ranking officer. Retired from United States Marine Corps in 1999 after serving 35 years. Executive Vice Chairman and Head of Mergers and Acquisitions of MBNA Corp., a financial services company, from March 2004 to June 2005. Chief Executive Officer of MBNA Europe Bank, Ltd. from January 2001 to March 2004, and Senior Vice Chairman of MBNA America Bank, N.A. from 1999 to 2001. Holds B.S. in Engineering from U.S. Naval Academy and M.S. in Labor Relations from George Washington University. Current director of Union Pacific Corporation and the Aston Villa Football Club, U.K. Former director of ConocoPhillips and Phelps Dodge Corporation. |
2007 | |||
| As a retired Commandant of the United States Marine Corps, General Krulak brings a unique perspective to the board. His successful record of leadership and military service makes him highly suited to understand and oversee the complex managerial, strategic and international considerations addressed by the board. In addition, General Krulak’s service on the boards of other public companies allows him to provide the board with a variety of insights. |
||||||
4
Table of Contents
| Name of Director |
Age |
Principal Occupation, Business Experience, and Other Public Company Directorships |
Year First | |||
| Bobby Lee Lackey |
75 | Consultant. President and Chief Executive Officer of McManus-Wyatt-Hidalgo Produce Marketing Co., shipper of fruits and vegetables from 1998 to 2000. Chairman of the Board and Chief Executive Officer of McManus Produce Co., Inc., McManus Cotton Gin, Inc. and McManus Ice Co., Inc. from 1968 to 1998. Former President of Texas Citrus and Vegetable Growers & Shippers Association. Attended The University of Texas at Austin. |
1995 | |||
| Mr. Lackey’s over 40 years of experience in the agricultural business, where he served in various leadership positions, including President and Chief Executive Officer, makes him a valuable member of the board of directors. This experience provides him with a broad understanding of the operational, financial and strategic issues facing the company. |
||||||
| Jon C. Madonna |
69 | Retired Chairman and Chief Executive Officer of KPMG, an international accounting and consulting firm. Retired from KPMG in 1996 having held numerous senior leadership positions throughout his career spanning over 25 years. Chairman of DigitalThink, Inc. from April 2002 to May 2004 and Chief Executive Officer of DigitalThink, Inc. from 2001 to 2002. President and Chief Executive Officer of Carlson Wagonlit Corporate Travel, Inc. from 1999 to 2000 and Vice Chairman of Travelers Group, Inc. from 1997 to 1998. Holds B.S. in Accounting from The University of San Francisco. Current director of AT&T Inc. and Tidewater Inc. Former director of Albertson’s, Inc., Visa Inc., Jazz Technologies, Inc. and Phelps Dodge Corporation. |
2007 | |||
| Mr. Madonna’s long career in public accounting with an international accounting firm and his service as an executive and a director for several publicly traded companies provides him with extensive experience in dealing with financial, accounting and regulatory matters at the board level and gives him a deep understanding of the role of the board and expectations of our directors. In addition, his service on the audit and nominating committees of public companies in a variety of industries positions him well to serve as a member of our audit committee and to provide insights into strategies and solutions to address the challenges of our business. |
||||||
5
Table of Contents
| Name of Director |
Age |
Principal Occupation, Business Experience, and Other Public Company Directorships |
Year First | |||
| Dustan E. McCoy |
63 | Chairman and Chief Executive Officer since December 2005 of Brunswick Corporation, a leading, publicly traded, global manufacturer and marketer of recreation products including marine engines, boats, fitness equipment and bowling and billiards equipment. President of the Brunswick Boat Group from 2000 until 2005. Joined Brunswick in 1999 as Vice President, General Counsel and Corporate Secretary. Prior to joining Brunswick, served as Executive Vice President for Witco Corporation, a publicly traded specialty chemical products company, with operating responsibility for a variety of global businesses and functions and served as Senior Vice President, General Counsel and Corporate Secretary. Holds B.S. in Political Science from Eastern Kentucky University and J.D. in Law from Salmon P. Chase College of Law. Current director of Louisiana-Pacific Corporation and Brunswick Corporation. Former director of Phelps Dodge Corporation. |
2007 | |||
| Mr. McCoy’s experience serving as Chairman and Chief Executive Officer of a large, global publicly traded company provides him with a broad understanding of the operational, financial and strategic issues facing the company. In addition, his experience and qualifications as a general counsel enable him to provide insight in addressing legal and regulatory matters. |
||||||
| James R. Moffett |
74 | Chairman of the board from 1992 to present. Chief Executive Officer of the company from 1995 to 2003. Co-Chairman of the Board, President and Chief Executive Officer of McMoRan. Received Horatio Alger Association of Distinguished Americans Award in 1990. Received Norman Vincent Peale Award in 2000 for exceptional humanitarian contributions to society. Holds B.S. with special honors in Geology from The University of Texas at Austin and M.S. in Geology from Tulane University. |
1992 | |||
| Mr. Moffett, one of the founders of the company, has extensive expertise as a practicing geologist and with respect to our business operations, making him uniquely qualified to lead the board. In 1969, he and two associates founded McMoRan Oil & Gas Co., which developed into one of America’s leading independent oil and gas companies. In 1981, Mr. Moffett led the effort to merge McMoRan Oil & Gas Co. and Freeport Minerals Company. The merger resulted in the establishment of a new company, Freeport-McMoRan Inc., our former parent company, which became one of the world’s leading natural resource companies of which he served as Chairman and Chief Executive Officer from 1984 until 1997 when it was acquired. Through his leadership and skill as a geologist, Mr. Moffett has guided our growth through significant discoveries of metal reserves and the development of our mines, milling facilities and infrastructure. As executive chairman, he continues to further our business strategy by applying his exceptional talents and experience as a geologist. He directs our global exploration programs and continues to be instrumental in fostering our relationships with host governments, including the government of Indonesia, the location of our Grasberg mine. |
||||||
6
Table of Contents
| Name of Director |
Age |
Principal Occupation, Business Experience, and Other Public Company Directorships |
Year First | |||
| B. M. Rankin, Jr. |
83 | Private investor. Vice Chairman of the board from 2001 to present. Current Vice Chairman of the Board of McMoRan. Director and member of the Executive Committee of U.S. Oil and Gas Association, serving as Chairman from 2008 to 2010. McCombs School of Business, The University of Texas at Austin Hall of Fame, 2006. Hunt Oil Company from 1955 to 1967. Director of Texas Oil and Gas Association. Holds B.B.A. from The University of Texas at Austin. |
1995 | |||
| Mr. Rankin is one of the founders of the company and has more than 50 years of experience in the natural resources industry. In 1969, along with Mr. Moffett and another associate, he founded McMoRan Oil & Gas Co., which developed into one of America’s leading independent oil and gas companies. In 1981, McMoRan Oil & Gas Co. and Freeport Minerals Company merged, resulting in the establishment of one of the world’s leading natural resource companies, Freeport-McMoRan Inc., our former parent company. As a founder, he has a comprehensive understanding of the company and its management, operations and financial requirements. With his detailed knowledge of our business and his perspectives regarding strategic and operational opportunities and challenges facing us, he continues to provide valuable insight to the board of directors. |
||||||
| Stephen H. Siegele |
52 | Private investor. Founder and Chief Executive of Advanced Delivery & Chemical Systems, Inc. (ADCS), a worldwide leader in advanced chemicals and delivery hardware serving markets in Asia, Europe and the U.S., from 1988 to 1997. In 1997, ADCS merged with Advanced Technology Materials, Inc., a public company, where Mr. Siegele became a divisional president and Vice Chairman of the Board of Directors until his retirement in 2000. He then founded and served as Chairman of Fluorine On Call, Ltd., a private company that designs and manufactures high purity fluorine generators. Mr. Siegele retired from Fluorine On Call, Ltd. in April 2006. Holds B.S. in Chemical Engineering from the University of Wisconsin-Madison and is an inventor of numerous U.S. patents. |
2006 | |||
| Mr. Siegele has extensive experience as an entrepreneur and inventor within the semiconductor, microelectronics and chemical industries, and as a director and senior manager of public and private companies. These experiences provide him with a strong background in addressing the strategic, operational, financial and technical matters presented to the board, and make him highly qualified to serve as chairman of our corporate responsibility committee. |
||||||
Board Committees
The board has four standing committees: an audit committee, a compensation committee (formerly the corporate personnel committee), a nominating and corporate governance committee and a corporate responsibility committee (formerly the public policy committee). Each of our audit, compensation and nominating and corporate governance committees are composed entirely of independent directors. Each committee operates under a written charter adopted by the board. All of the committee charters are available on our web site at www.fcx.com under
7
Table of Contents
Investor Center – Corporate Governance and are available in print upon request. The members and primary functions of each board committee are described below.
| Audit Committee Members |
Primary Functions of the Audit Committee | |
| Robert A. Day, Chairman Gerald J. Ford H. Devon Graham, Jr. Jon C. Madonna Stephen H. Siegele |
• monitors the Company’s continuing development and effectiveness of its system of financial reporting and internal controls • monitors the operation and integrity of the system of financial reporting and the integrity of the financial statements • monitors the Company’s compliance with legal and regulatory requirements • monitors the qualifications and independence of the Company’s independent registered public accounting firm • monitors the performance of the Company’s independent registered public accounting firm and internal auditors | |
| Compensation Committee Members |
Primary Functions of the Compensation Committee | |
| H. Devon Graham, Jr., Chairman Robert J. Allison, Jr. Charles C. Krulak Bobby Lee Lackey |
• oversees the discharge of the board’s responsibilities relating to compensation of our executive officers • administers our cash-based and equity-based incentive compensation plans | |
| Nominating and Corporate Governance Committee Members |
Primary Functions of the Nominating and Corporate Governance Committee | |
| Robert J. Allison, Jr., Chairman Robert A. Day Gerald J. Ford |
• identifies individuals qualified to serve as directors and recommends to the board director nominees for election at the next annual meeting of stockholders consistent with criteria approved by the board • monitors the composition of the board and its committees • maintains our corporate governance guidelines and recommends to the board any desirable changes • evaluates the effectiveness of the board, its committees and management • oversees the form and amount of director compensation | |
| Corporate Responsibility Committee Members |
Primary Functions of the Corporate Responsibility Committee | |
| Stephen H. Siegele, Chairman Robert J. Allison, Jr. Charles C. Krulak Bobby Lee Lackey Dustan E. McCoy B. M. Rankin, Jr. |
• oversees our environmental policy and implementation programs • oversees our human rights policy and practices • oversees our safety and health policies and programs • oversees our community health programs and related public health and medical matters • oversees our community policy and practices, governmental and stakeholder relations, and social investment and sustainable development programs • oversees our charitable contributions • oversees our political activity and spending practices | |
8
Table of Contents
On May 24, 2012, the board of directors authorized a special committee of independent directors, comprised of Messrs. Allison, Krulak, Lackey, Madonna and McCoy, with the power and authority to oversee the company’s efforts to evaluate potential merger transactions with McMoRan Exploration Co. (McMoRan) and Plains Exploration & Production Company (PXP). As previously disclosed, on December 5, 2012, we entered into: (1) an agreement and plan of merger, by and among PXP, the company and IMONC LLC, our wholly-owned subsidiary (PXP Merger Sub), pursuant to which PXP will merge with and into PXP Merger Sub, with PXP Merger Sub surviving the merger as a wholly owned subsidiary of the company; and (2) an agreement and plan of merger, by and among McMoRan, the company and INAVN Corp., our wholly owned subsidiary (MMR Merger Sub), pursuant to which MMR Merger Sub will merge with and into McMoRan, with McMoRan surviving the merger as a wholly-owned subsidiary of the company. Each of the merger agreements has been approved by the board of directors of each of FCX and PXP and FCX and McMoRan, respectively.
Corporate Governance Guidelines; Principles of Business Conduct
Our corporate governance guidelines and our principles of business conduct are available at www.fcx.com under Investor Center – Corporate Governance. Both are available in print upon request. Amendments to or waivers of our principles of business conduct granted to any of our directors or executive officers will be published promptly on our web site.
Section 16(a) Beneficial Ownership Reporting Compliance
Section 16(a) of the Securities Exchange Act of 1934, as amended, requires our directors and executive officers and persons who own more than 10% of our common stock to file reports of ownership and changes in ownership with the SEC. Based solely upon our review of the Forms 3, 4 and 5 filed during 2012, and written representations from certain reporting persons that no Forms 5 were required, we believe that all required reports were timely filed.
Audit Committee Independence and Financial Experts
The board has determined that each of the members of the audit committee has no material relationship with the company and satisfies the independence criteria (including the enhanced criteria with respect to members of the audit committee) set forth in the applicable NYSE listing standards and SEC rules. In addition, the board has determined that each of the following members of the audit committee – Messrs. Day, Ford, Graham and Madonna – qualifies as an “audit committee financial expert,” as such term is defined by the rules of the SEC.
Item 11. Executive Compensation.
Executive Officer Compensation
Compensation Discussion and Analysis
This Compensation Discussion and Analysis, or CD&A, describes and analyzes our executive compensation philosophy and program in the context of the compensation paid during the last fiscal year to our chief executive officer, our chief financial officer, and each of our two other executive officers (referred to as our named executive officers or NEOs). For fiscal year 2012, our named executive officers are:
| • | James R. Moffett, our chairman of the board; |
| • | Richard C. Adkerson, our president and chief executive officer; |
| • | Kathleen L. Quirk, our executive vice president, chief financial officer and treasurer; and |
| • | Michael J. Arnold, our executive vice president and chief administrative officer. |
In this CD&A, we provide an Executive Summary of our actions and highlights from 2012. We explain the principles that guide our compensation committee’s (our committee’s) executive compensation decisions and discuss in detail each component of executive compensation, including the actual results yielded for each named executive officer for 2012. We also explain the process we follow when setting executive compensation.
9
Table of Contents
Executive Summary
Our committee has implemented an executive compensation program that links our performance (as measured by key financial and business objectives) to incentive compensation. Specifically, our committee believes that a significant portion of the named executive officers’ compensation corresponds to the key measures that our stockholders use in assessing company value. The primary quantitative measures are operating cash flow, return on investment (ROI), and total shareholder return (TSR). Our committee further believes in maintaining a straightforward executive compensation program using cash (short-term), performance-based restricted stock units (long-term), and stock options (long-term). Our stockholder-approved annual incentive plan (AIP) uses operating cash flow and ROI as performance measures in awarding annual cash incentives and performance-based restricted stock units (RSUs). Stock options are annually awarded and vest over four years.
Revisions to our Executive Compensation Program
During the last few years, we have conducted an extensive effort to engage our investors in conversations to identify areas of our program that could be improved, in part in an effort to respond to stockholder concerns evidenced by a negative say-on-pay vote at our 2011 annual meeting. We have held conversations with over 25 of our largest institutional investors and two of the largest proxy advisory firms, and received comments on our executive compensation program. During the discussions, we reviewed our committee’s long-standing pay for performance philosophy and the company’s entrepreneurial culture, the history of our executive compensation programs, including modifications in response to changes in market practices as well as changes following the Phelps Dodge transaction in 2007, and our long track record of being responsive to the concerns of our stockholders. After our committee worked to develop proposed changes to our executive compensation program, we also sought input from these stockholders and advisory firms in December 2011 and January 2012 on the proposed changes. The Chairman of our committee participated in many of these discussions.
During our discussions, many of our investors noted that the company is well managed and recognized (1) the company’s strong performance over the years and (2) that the company’s executive compensation has been linked to performance. Investors who voted against say-on-pay and the proxy advisory firms cited pay magnitude as the primary concern. Many of our stockholders also noted that our AIP had a ROI performance metric that they believed lacked sufficient rigor and expressed interest in seeing more information on the qualitative factors that the committee considers in determining the AIP awards.
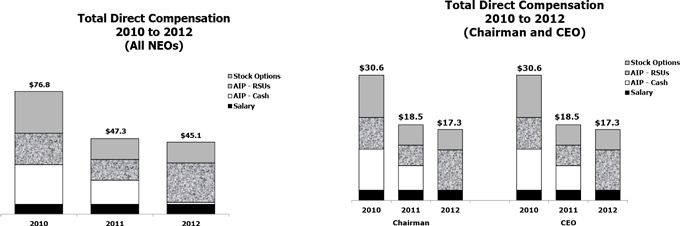
During 2011 and continuing into 2012, our committee worked with its independent consultant to revise our executive compensation program to respond to these concerns. In response to stockholder feedback, we implemented significant changes to the executive compensation program, including adding new caps and increasing the rigor of the ROI performance metric in the AIP beginning for awards under the AIP for 2011, and incorporating a TSR element into our performance-based restricted stock unit grants. As a result of these changes, as shown below, the total direct compensation awarded to each of the Chairman and the CEO for performance in each of 2011 and 2012 was approximately 40% less than the amount awarded for 2010 In addition, the AIP awards for 2012 were approximately 20% below the plan funding amount.
At our 2012 annual meeting, we were encouraged by the increase in stockholder support for our program from the prior year, with approximately 68% of the total votes cast approving our say-on-pay proposal. While this result indicates that there are still some concerns about our program, our committee continues to believe that the core elements of the program, including the revisions made to the AIP during 2012, support our business strategy by encouraging high performance. We also believe that the implementation of our revised program during the course of the past year and a half demonstrates our commitment to be responsive to the views of our stockholders.
In addition to the changes made to our program in early 2012 that began impacting pay for 2011 (with respect to the AIP payments for 2011 and the option awards in 2012 that related to 2011 performance), the following highlights additional actions taken during 2012 and early 2013 that impact our executives’ compensation and use of company securities:
| • | Annual Incentive Awards Based on Performance. Awards earned under the AIP are based on our ROI performance and are funded based on our operating cash flow, with downward adjustments related to |
10
Table of Contents
| copper prices and the committee’s subjective evaluation of other financial and non-financial achievements. Following the evaluation of our performance under these metrics and goals during 2012, the committee concluded that although awards under the AIP were earned by our executive officers, the payouts should be reduced in the aggregate by approximately 20% of the plan funding amount. |
| • | Payout of 2012 AIP in Performance-Based RSUs. The committee elected to deliver the 2012 AIP payment to our Chairman, CEO and CFO solely in performance-based RSUs, with only Mr. Arnold receiving a portion of his AIP in cash. No cash incentive awards were paid to our Chairman, CEO and CFO for 2012. Accordingly, the entire 2012 AIP award for these executives was made contingent on future performance. |
| • | Adoption of Anti-Hedging Policy. We recently amended our insider trading policy to prohibit our executives and directors from entering into hedging arrangements with respect to our securities. This new policy will apply prospectively. |
| • | Revisions to Policy on Pledging. We recognize that in certain circumstances an insider’s pledge of company securities could have potential negative impacts. We believe, however, that pledging can be done in a responsible manner and that given the significant level of ownership of our securities by our executives and many of our directors and the significant trading volume of our shares, we should not adopt a blanket prohibition of these transactions. Alternatively, to address some of the concerns surrounding insider pledging of company securities, we recently amended our policies to provide the following limits on the ability of our executives and directors to pledge our securities: |
| • | our securities may not be pledged as collateral for a margin loan, |
| • | the executive or director must notify the company prior to execution of the pledge, |
| • | the executive or director must establish that he or she has the financial capacity to repay the loan without resort to the pledged securities, and |
| • | any shares pledged will not be considered as owned for purposes of the stock ownership guidelines applicable to the executive or director. |
Our committee recognizes that executive compensation is an evolving area and will continue to monitor market developments. We are still awaiting rules to be adopted to implement provisions of the Dodd-Frank Wall Street Reform and Consumer Protection Act of 2010 (Dodd Frank) relating to compensation clawbacks, hedging transactions, and pay ratio and pay for performance disclosures. Our committee expects to consider adopting new, or modifying current, policies and practices relating to these matters as these new rules are implemented.
Highlights of our Executive Compensation Program
What We Do:
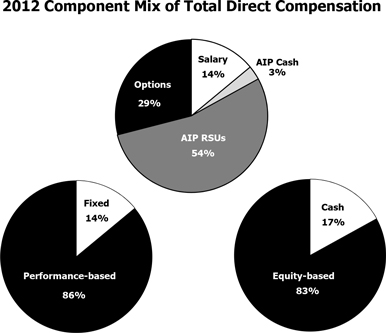
| • | Pay for Performance – a significant portion of executive pay (86% for our chairman and chief executive officer) is tied to performance of our company and increases in our stock price. |
| • | Cap Total Incentive Compensation – total incentive awards under our AIP, both the cash and equity components, and stock option grants that may be received in any one year by each of our chairman and chief executive officer, may not exceed $20 million. |
| • | Limit Awards under our AIP – the total value of annual awards under the AIP (cash and equity) may not exceed six times each executive’s base salary, and while the committee has discretion to determine the form of payment, cash awards may not exceed three times the executive’s base salary. |
| • | Clawback Pay – we may recover incentive awards paid based on restated financial statements under certain circumstances. |
11
Table of Contents
What We Don’t Do:
| • | No Excise Tax Gross-Ups – we have eliminated all excise tax gross-up provisions from our change in control arrangements. |
| • | No Single Trigger Vesting of Equity since 2012 – stock option and RSU awards granted since February 2012 will not accelerate upon a change in control, and will only accelerate upon the recipient’s actual or constructive termination of employment within one year of the change of control. |
2012 Total Direct Compensation for Chairman and CEO drops over 40% from 2010
Our committee views each executive’s “total direct compensation” for a given year as the sum of the executive’s base salary, awards under the AIP for that year (both cash and performance-based RSUs), and the value of other long-term incentives granted in recognition of our performance for that year. As indicated in the following graphs (dollars in millions), the revisions to the executive compensation program in early 2012 had a significant impact on each executive’s total direct compensation for performance in 2011 and 2012, with the total direct compensation awarded to each of the Chairman and the CEO for 2011 being 40% less than the amounts awarded for 2010, and dropping another 6% in 2012 as compared to 2011. In addition, no cash incentive awards were paid to our Chairman, CEO or CFO for 2012. See “Summary of 2012 Total Direct Compensation” below for more information on how we calculate total direct compensation and how these amounts differ from the information contained in the 2012 Summary Compensation Table.
2012 Company Performance Highlights
The following highlights certain of our accomplishments during 2012, many of which are also discussed under “Overview of Principal Components of Executive Compensation – Annual Incentive Awards – Factors Considered in Determination of 2012 AIP Awards”:
| • | Solid operational performance and cost management |
| • | Operating cash flow for 2012 of $5.2 billion (as adjusted for working capital changes) |
| • | Production growth in North America and Africa |
| • | Achievement of important milestones in the development of financially attractive projects to increase copper and molybdenum production |
| • | Continued active exploration program, with results focused on generating future reserve growth |
| • | Strong management of environmental and social programs with positive international recognition for corporate social responsibility |
12
Table of Contents
| • | Completed debt refinancing, issuing $3 billion in new debt at 3% average cost, resulting in a $160 million annual interest savings |
| • | Maintained strong balance sheet and increased regular annual common stock dividend rate by 25% to $1.25 per year |
During 2012, we also faced a number of challenges, including:
| • | Labor and security issues, as well as regulatory uncertainty, in Indonesia |
| • | Six fatalities worldwide |
| • | A 7% decrease in our share price, including a 14% decrease in the 2012 fourth quarter |
Executive Compensation Philosophy
The fundamental tenets of our company’s executive compensation philosophy are to:
| • | pay for performance by emphasizing performance-based compensation that balances rewards for both short- and long-term results and provides our executives with high reward opportunities for high corporate performance, |
| • | tie compensation to the interests of stockholders, and |
| • | provide a competitive level of compensation. |
Our committee believes that its pay for performance philosophy complements the company’s entrepreneurial culture. In order to achieve these goals, our committee believes that not only should a significant portion of the named executive officers’ compensation be performance-based, such compensation should also correspond to the key measures used by our stockholders in assessing our company’s value. The primary elements of the performance-based pay under our program are the awards under our stockholder-approved AIP, which focus on operating cash flow and ROI, and also include a TSR requirement.
As described below, our annual incentive plan contains both a quantitative component pursuant to which the plan is funded based on our achievement of certain financial measures, and a qualitative component pursuant to which our committee exercises its discretion in determining the ultimate awards. If our company achieves the required ROI threshold, our annual incentive plan is funded by a percentage of operating cash flow (excluding working capital changes), which we believe is a key measure of our company’s performance. Our executive compensation program also contains certain caps on the awards payable to individual executives. Our committee then uses its discretion to determine individual awards within this framework, based on its evaluation of metrics that our committee believes are critical to our success and indicative of management’s performance during the year. Our committee believes that this dual approach appropriately awards our executives if the company performs well, but also gives the members of our committee the ability to exercise their judgment and consider qualitative factors that may not be easily measurable but that also impact our success. Our stockholders have indicated an interest in learning more about the other measures our committee considers, and we have included disclosure in this CD&A describing our committee’s discretionary assessment.
13
Table of Contents
Overview of Principal Components of Executive Compensation
The principal components of executive officer compensation for 2012 were base salaries, annual incentive awards, and long-term incentive awards, the sum of which our committee views as the executives’ “total direct compensation.” In addition, we provide our executives with certain personal benefits and perquisites, as well as post-employment compensation, which our committee considers separately from total direct compensation and which are further described below. The following charts illustrate the component mix of the aggregate total direct compensation paid to our named executive officers for 2012:
The following is an explanation of each principal component of our executive compensation program, including a description of our committee’s compensation decisions for 2012.
Base Salaries
| How base salaries support our compensation philosophy and objectives: |
• Base salaries help us meet the objective of attracting and retaining the executive officers needed to manage our business successfully.
• Fixed compensation in the form of base salary represents an average of 14% of our executive officers’ compensation, reflecting our goal to allocate more compensation to the performance-dependent elements of the total compensation package. |
Individual base salary amounts reflect our committee’s judgment with respect to each executive officer’s responsibility, performance, work experience and the individual’s historical salary level. We have not increased the base salaries of our executive officers since May 2007, when increases to the base salaries of certain executive officers were approved to address the increased responsibilities of these executives following the acquisition of Phelps Dodge. The base salaries of Messrs. Moffett and Adkerson and Ms. Quirk are contractually set pursuant to their employment agreements.
14
Table of Contents
Annual Incentive Awards
Our annual incentive plan, or AIP, is designed to provide performance-based awards to our executive officers, each of whose performance has a significant impact on our financial stability, profitability and future growth.
| How the overall design of the AIP supports our compensation philosophy and objectives: | • It encourages the entrepreneurial spirit of the organization and the alignment of executive management with stockholder objectives.
• Its focus on operating cash flow and returns on invested capital, the underlying metrics of the plan, reflects our goal to maximize cash flows and long-term returns for our stockholders.
• The variability of cash flows associated with changes in commodity prices, changes in production volumes, cost management and other changes in business conditions closely aligns management and stockholder interests.
• Its revised cap on overall awards to six times the executive’s base salary limits the value of cash and equity awards while providing significant compensation opportunities if the company’s performance warrants high payouts.
• Mandating that all payments over three times the executive’s base salary be made in performance-based RSUs having an equivalent value converts a portion of the annual award to a long-term incentive dependent upon the company’s continued performance. |
General Structure of the AIP. The current AIP was approved by our stockholders in 2009, and its design is intended to provide compensation opportunities that reflect the performance of our business, which may vary significantly from year to year, and that are consistent with observed market pay levels. As noted above, the financial measure used to fund the AIP pool is operating cash flow, excluding working capital changes, reflecting our committee’s belief that operating cash flow is a meaningful indicator of overall performance for our company.
Our committee allocates a percentage of the plan funding amount to each participant at the beginning of the year. If our five-year ROI (as defined in the AIP) is 6% or greater, our executive officers would share in a plan funding amount equal to 0.625% of our operating cash flow, as adjusted. After the end of the year, our committee then uses its discretion to determine the payouts under the plan for the year, subject to the limits on the payouts depending on ROI and other factors set forth in the plan and described below. The plan also specifically enumerates a non-exclusive list of qualitative factors that our committee may consider in exercising this discretion.
Additional Requirements under the AIP. Beginning with the AIP awards for fiscal year 2011, our committee implemented the following guidelines that will be used in the exercise of the committee’s discretion to reduce awards when determining awards under the AIP:
| • | Reduced Individual Caps Under the AIP – No participant in the AIP may receive an award under the plan having an aggregate value in excess of six times his or her salary (reduced from the eight times limit in the plan). In addition, the total value of the cash award under the AIP may not exceed three times the executive’s salary (reduced from the four times in the plan). These changes reduce the magnitude of each executive’s potential awards under the plan. |
15
Table of Contents
| • | Increased the Rigor of the AIP Performance Measure – The company’s operating cash flows are significantly impacted by changes in copper prices. Accordingly, as an additional overlay to the AIP metrics and the individual award caps, our committee adopted a matrix of potential awards, expressed as a multiple of salary, designed to increase the rigor of the ROI performance metric as copper prices increase. The matrix is used as a guideline and our committee considers various additional factors, as more fully described below, to determine the ultimate payouts under the AIP. Under this matrix, as copper prices increase (determined by the average consolidated realized copper price reported by the company), the company’s annual ROI must also increase in order for an increased salary multiple to apply (up to the six times cap). If ROI does not increase, the individual cap will be reduced as set forth in the table below. The matrix is only applicable if the average consolidated realized copper price reported by the company for the year is above $2.50 per pound. In developing the matrix, our committee and its consultants reviewed the company’s projections with an objective of establishing the upper end of the salary multiple opportunity as a stretch target. The annual ROI calculation will exclude costs of major projects until the project is operational. |
| Salary Multiples – Annual ROI Thresholds | ||||||||||||||||||||
| Average Copper Price per Pound |
2x | 3x | 4x | 5x | 6x | |||||||||||||||
| $2.51-$3.00 |
6 | % | 7 | % | 10 | % | 13 | % | 16 | % | ||||||||||
| $3.01-$3.50 |
9 | % | 10 | % | 13 | % | 16 | % | 19 | % | ||||||||||
| $3.51-$4.00 |
12 | % | 13 | % | 16 | % | 19 | % | 23 | % | ||||||||||
| >$4.01 |
15 | % | 17 | % | 20 | % | 23 | % | 27 | % | ||||||||||
The following example illustrates the application of these guidelines. For this example, we are assuming that the five-year ROI measure is met for the plan year, and that the company’s operating cash flow is sufficient to generate a plan funding amount in excess of six times the executives’ aggregate salaries (the revised cap). Under these guidelines, if the average copper price per pound for the year is $3.00, in order for the executives to be eligible for an aggregate payout under the AIP of six times his or her salary (the revised cap), the company’s annual ROI must be at least 16%. If the average copper price per pound for the year is $4.20, in order for the executives to be eligible for an aggregate payout under the AIP of six times his or her salary, the company’s annual ROI must be at least 27%.
| • | Additional TSR Conditions Applicable to AIP Awards Delivered as Performance-Based RSUs – Any RSUs granted as part of the AIP will cliff vest after three years if the ROI measure has been achieved, with 20% of the award subject to forfeiture if our TSR for the three-year period ending on the December 31st prior to the vesting date is below the median TSR of our peer group (the Peer Group). For purposes of the performance-based RSUs, TSR, as applied to the company or any company in the Peer Group, means stock price appreciation from the beginning to the end of the performance period, including dividends and distributions made or declared (assuming such dividends or distributions are reinvested in the common stock of the applicable company) during the performance period, expressed as a percentage return. In addition, the Peer Group against which we will measure our TSR for these performance-based RSUs is comprised of the following companies: |
| Alcoa Inc. | Rio Tinto plc | |
| Anglo American plc | Southern Copper Corporation | |
| Antofagasta plc | Teck Resources Limited | |
| Barrick Gold Corporation | United States Steel Corporation | |
| BHP Billiton plc | Vale S.A. | |
| Newmont Mining Corp. | Xstrata plc |
16
Table of Contents
In selecting the Peer Group for these performance-based RSUs, we selected metals and mining companies that the investment community generally tracks as an industry group, many of which are based outside the U.S. Because there are limited U.S.-based metals and mining companies, we expanded our selection of U.S. companies to include two industrial metal companies, which resulted in a group of 12 companies, with one-third being comprised of U.S.-based companies.
Factors Considered in Determination of 2012 AIP Awards. In February 2012, we assigned each of our executive officers a percentage of the aggregate plan funding amount under the stockholder-approved AIP for 2012: 40% to each of Messrs. Moffett and Adkerson, 11% to Ms. Quirk and 9% to Mr. Arnold. These allocations were based on each officer’s position and were consistent with the prior year’s allocations.
Quantitative Measures. For 2012, operating cash flow as adjusted for working capital changes as reflected in our consolidated statements of cash flows was $5.2 billion, thus producing a maximum plan funding amount of $32.5 million. During the five-year period ending in 2012, the average ROI was 17.1%. In addition, under our new guidelines, the average recorded copper price per pound was $3.60 and the 2012 ROI was 21.7%, allowing for a guideline maximum payout opportunity of 5.7 times base salary for each executive, subject to the maximum plan funding amount and the committee’s discretion to reduce the awards after review of the qualitative measures.
Qualitative Measures. In addition to reviewing the quantitative results discussed above, our committee evaluated and considered the company’s and our management group’s performance relative to other factors in determining payouts under the AIP. Specifically, our committee evaluated performance relative to safety results, environmental and social factors, certain operational metrics, results of growth initiatives, the company’s relative TSR and ROI compared to peer companies, exploration results, financial management and management’s response to labor and governmental challenges that the company continued to face during 2012. The following is a summary of the information relative to these matters reviewed and considered by our committee when determining the 2012 AIP awards.
Safety. Our committee assessed the company’s safety performance for 2012 based in part on pre-established targets for the total reportable rates in each area of operation and the company as a whole. Although the company’s total reportable rate in 2012 met the 2012 performance target, the company regrettably had six reportable fatalities in 2012. Our committee also recognized a number of significant safety initiatives that management completed in 2012, including the following:
| • | Completion of OHSAS 18001 accredited certification for all sites |
| • | Enhancements to the company’s fatality prevention program |
| • | Enhancements to industrial hygiene processes at sites |
| • | Successful rollout of crisis management initiative to all FM Americas and Climax sites |
| • | Receipt of Chilean National Mining Society Award for Chilean operations |
| • | Receipt of U.S. National Institute for Occupational Safety and Health award for implementation of practices to prevent accidents in the surface mining environment |
Environmental and Social. Our committee recognized management’s continued efforts during 2012 to conduct business in an environmentally and socially responsible manner for the benefit of its stakeholders. Specifically, our operations in North and South America incurred no significant environmental events. We maintained ISO 14001 Environmental Management System certifications at all major operations with Tenke being recommended for certification in December 2012. We also completed internal, external and government compliance audits, which confirmed that PT Freeport Indonesia is in full compliance with applicable environmental
17
Table of Contents
laws and regulations. In addition, we received approval from the Peruvian Government of the environmental impact statement for the Cerro Verde expansion. During 2012, the company had several sustainability accomplishments, including:
| • | Maintained the company’s Working Toward Sustainable Development Report at the A+ level of the Global Reporting Initiative, including third-party assurance |
| • | Completed a three-year cycle to conduct site-level external assurance of the International Council on Mining and Metals Sustainable Development Framework at all major operations |
| • | Named to the Civic 50, a list of the most community-minded companies in America and a national initiative to survey and rank America’s S&P 500 corporations on how they engage with the communities they serve and institutionalize practices in their corporate culture |
| • | Completed the Cerro Verde water treatment plant for Arequipa, Peru and inaugurated the plant in partnership with President Humala |
| • | Awarded ISO 50001 certification for Atlantic Copper’s energy management system |
| • | Honored by the New Mexico Mining and Minerals Division with the Excellence in Reclamation Award for large scale and innovative reclamation at the Tyrone Mine and successfully implementing tailings and stockpile reclamation projects at Chino |
| • | Provided funding to State of Colorado Inactive Mine Reclamation Program and to Trout Unlimited to clean-up abandoned mine sites that are not associated with the company or our historic operations |
| • | Continued to strategically advance community development and investment programs in key regions where we operate: |
| • | In Africa, we continued to invest in community infrastructure projects, resettled 70 households in Tenke for the Phase II expansion project and received the Workplace/Workforce Engagement Award in the Special Focus HIV/AIDS, Tuberculosis or Malaria category from GBCHealth |
| • | In Indonesia, we launched new community infrastructure investment projects in and around Timika and received an award from the Government for Best HIV/AIDS Program in the Work Place |
| • | In the United States, we established a new community investment fund in Arizona, implemented a Native American Scholarship Program and cultivated partners to support an effort to recruit and retain new STEM (science, technology, engineering and math) teachers in the U.S. (specifically Arizona, Colorado and New Mexico) |
Operational Metrics. Our committee also evaluated the company’s achievement of production and sales targets, operational efficiencies and cost management.
Sales. The company’s consolidated sales were slightly below plan, primarily because of the labor disputes in Indonesia during the first half of 2012. Following is a summary of the company’s 2012 sales results:
| • | North America sales exceeded forecast, reflecting the successful initiatives to increase mining and milling activities at Morenci and the ramp up of production from restarts at Miami and Chino. |
| • | South America sales were slightly below forecast and were impacted by lower recoveries at the El Abra mine, which were successfully addressed in the second half of 2012. |
| • | Tenke sales exceeded forecast and were nearly 20% higher than 2011 sales as a result of successful initiatives to increase mining rates and optimize mill performance. |
| • | Grasberg sales were below forecast because of labor disruptions in the first half of 2012 and a slower ramp-up of the underground DOZ mine following the prolonged labor strike in 2011. |
Costs. During 2012, management continued to aggressively manage costs despite inflationary pressures in a number of areas. As anticipated, unit costs in 2012 were higher than in 2011, primarily because of lower copper sales volumes in Indonesia and higher mining costs in North and South America. Consolidated unit site production and delivery costs were slightly below the unit costs estimated at the start of the year.
Growth Initiatives. Our committee recognized the significant efforts of management to grow our business and enhance returns for stockholders. Some of the projects involve restarting idled production or replacing
18
Table of Contents
production from depleting reserves and others involve major expansions. Through exploration and technical evaluations, management is pursuing three major projects that have the potential to increase production by nearly 1 billion pounds of copper over the next three years. Our committee noted the following major accomplishments on growth initiatives during 2012:
| • | Successful completion of the construction of the Climax molybdenum mine, which commenced production in 2012 |
| • | Achievement of significant milestones in the development of Grasberg Underground to prepare for transition from open pit operations in 2016 |
| • | Received Peruvian government approval for the environmental impact statement for Cerro Verde expansion to triple concentrator rates |
| • | Obtained key permits and commenced construction of projects at Morenci to increase production by 40% by 2014 |
| • | Completed construction of Phase II expansion at Tenke to increase production by 50% (the project was completed on time and within budget in a challenging environment) |
TSR & ROI Compared to Peers. Our committee noted that the company’s one-year TSR was -4.0% compared to the median of 3.3% for the Peer Group; the company’s three-year TSR of -7.5% compared to the median of -1.0%; and the company’s five-year TSR was -25.5% compared to the median of -22.3%. The company’s ROI for the first nine months of 2012, which was the data available at the time of our committee’s review, was 17.1%, which was above the 75th percentile of 16.3%. Our three-year ROI of 31.5% was above the 75th percentile and our five-year ROI of 16.2% was the median. Thus, despite the stock price volatility we have experienced, management has effectively managed the business to deliver strong operational results.
Exploration Results. Our committee noted the company’s aggressive exploration program to define the size of our resources, identify new resources, and develop expansion plans and growth initiatives, all with the view of generating long-term values for our shareholders. In particular, through recent exploration drilling activities, including the 2012 program, the company has identified potential new future copper reserve additions over the next few years. In addition, our committee noted the addition since 2007 of 46 billion pounds of copper reserves, replacing production by more than two times.
Financial Management. The company has maintained a strong balance sheet, which provides financial strength to pursue aggressively its growth objectives, manage volatile market conditions and provide strong cash returns to shareholders. Following completion of the pending acquisitions, the company plans to reduce debt incurred in the transactions through operating cash flows and disciplined management of capital expenditures. For 2012, our committee noted the following items:
| • | Completed a highly successful refinancing of its debt in February 2012, through $3 billion in bond financings at an average cost of 3% (the proceeds were used to refinance higher cost debt resulting in annual interest cost savings of approximately $160 million) |
| • | Year-end 2012 net cash position of $0.2 billion, compared with $17.6 billion in debt ($14.2 billion net of cash) at the time of the Phelps Dodge transaction in 2007; interest cost savings from debt repayments and refinancings since January 1, 2009 approximated $420 million per year |
| • | Maintained investment grade ratings with three credit rating agencies |
| • | Paid $1.1 billion in common stock dividends during 2012, and increased the annual common dividend rate from $1.00 to $1.25 per share |
| • | Obtained financing commitments for low cost debt financing for the pending acquisitions |
Other Factors. Our committee also considered the continued labor and governmental relations challenges faced by the company during 2012. Specifically, the company continued to address challenges with changes in the regulatory environment and significant labor and security challenges at its Grasberg operations. Following a three month strike in late 2011, the company successfully re-integrated the work force and improved productivity. During 2012, management dedicated significant resources to improving relations with the company’s large Indonesian work force and addressing the challenging security situation and complex regulatory environment in Indonesia.
19
Table of Contents
Organizational changes at PT Freeport Indonesia were implemented in early 2012, including a change in the President Director and other senior management positions to address complex issues that had not been experienced in our 40-year operating history. Significant “quality of life” initiatives for our workforce and the local community were implemented, which are consistent with our objective of maintaining a productive and healthy work environment.
Executive management maintained active discussions with Indonesian government officials to address the labor and security issues. In addition, executive management continues to work proactively with local management and with Indonesian government officials to conclude the ongoing review of our Contract of Work in a mutually satisfactory manner. Substantial progress has been made in developing a framework for a mutually acceptable Contract of Work resolution.
We maintained good labor relations in South America and the 2011 Cerro Verde labor agreement was implemented without disruption. In addition, we were successful in reaching a new four-year labor agreement in late 2012 with the Candelaria labor union in advance of the 2013 expiration. A new labor agreement was also reached at Tenke Fungurume during 2012.
Executive management also maintained positive relations with key governmental officials in the Democratic Republic of Congo, Peru, Chile and the U.S. Management committed significant resources, personal involvement, and leadership in communicating with key government stakeholders on the benefits of the company’s operations.
Long-Term Incentive Awards
Long-term incentives granted by the company may consist of a variety of incentives, but we have historically granted stock options, RSUs, or a combination of the two. Since 2009, our committee’s practice has been to make annual equity-based awards to the executives in the form of stock options.
20
Table of Contents
| How long-term incentive awards, specifically stock options, support our compensation philosophy and objectives: | • Long-term incentives are a variable component of compensation intended to reward our executives for the company’s success in achieving sustained, long-term profitability and increases in stock value.
• Stock options align the executives’ interests with those of our stockholders as their value is dependent on an increase in our stock price. We recognize that some institutional shareholders have expressed reservations about using stock options as performance-based compensation, but our committee strongly believes that stock options continue to be an excellent performance-based compensation vehicle that links compensation to shareholder return.
• We also provide long-term incentive awards in the form of performance-based RSUs in connection with the AIP, which strengthen focus on stock price performance and encourage executive ownership of our stock. |
2012 Executive Compensation
AIP Payout and Stock Option Awards for 2012
In determining the AIP payout and stock option awards for 2012, our committee considered (1) the company’s performance in 2012, including the quantitative and qualitative measures described above, (2) the umbrella cap adopted by our committee, which limits total incentive awards to $20 million for each of our chairman and chief executive office and (3) the grant date value of the stock option awards and how those awards related to total compensation and base salary.
Although the new ROI guideline provided a maximum payout opportunity of 5.7 times base salary for each executive, this would have exceeded the maximum plan funding amount ($32.5 million), thus the maximum plan funding amount set the upper limit of awards under the AIP for 2012. Our committee recognized that the company’s stock price had declined 7% in 2012, including a 14% decrease in the 2012 fourth quarter, and the company faced challenges during 2012 as described above. The committee also remained mindful of the views of our stockholders regarding pay magnitude. Based on these factors and pursuant to its discretionary authority to reduce awards, our committee made aggregate awards under the AIP for 2012 that were approximately 20% less than the plan funding amount. In addition, the committee elected to award only performance-based RSUs to three of the named executive officers under the AIP (no cash awards). Further, our committee awarded stock options valued at approximately 2.0 times base salary for each of our chairman and our chief executive officer and 2.5-2.7 times base salary for each of our two other named executive officers.
The table below reflects the value of the 2012 AIP and stock option awards (i.e. all of the 2012 incentive compensation awards), which were awarded in January 2013. As noted below, the value of the performance-based RSUs and the stock options reflected in the table below are not included in the 2012 Summary Compensation Table on page 30, as SEC regulations require that they be reflected in the 2013 Summary Compensation Table for 2013 because they were granted during 2013. The performance-based RSUs and stock options included as part of 2012 compensation in the Summary Compensation Table were granted as part of 2011 compensation.
21
Table of Contents
AIP and Stock Options Awards to the NEOs for 2012
($ millions)
| Actual 2012 AIP Awards | ||||||||||||||||||||||||||||||||
| Name |
Value Paid in Cash |
Salary Multiple |
Value Paid in Perf.- Based RSUs (1) |
Salary Multiple |
Aggregate Value Awarded |
Salary Multiple |
Black-Scholes Value of Options Granted for 2012(1) |
Salary Multiple |
||||||||||||||||||||||||
| Mr. Moffett |
$ | 0.0 | n/a | $ | 9.860 | 3.9 | $ | 9.860 | 3.9 | $ | 4.94 | 2.0 | ||||||||||||||||||||
| Mr. Adkerson |
0.0 | n/a | 9.860 | 3.9 | 9.860 | 3.9 | 4.94 | 2.0 | ||||||||||||||||||||||||
| Ms. Quirk |
0.0 | n/a | 3.287 | 5.1 | 3.287 | 5.1 | 1.65 | 2.5 | ||||||||||||||||||||||||
| Mr. Arnold |
1.2 | 2.2 | 1.643 | 3.0 | 2.843 | 5.2 | 1.48 | 2.7 | ||||||||||||||||||||||||
|
|
|
|
|
|
|
|
|
|||||||||||||||||||||||||
| Totals |
$ | 1.2 | $ | 24.650 | $ | 25.850 | $ | 13.01 | ||||||||||||||||||||||||
| (1) | Awards were granted on January 29, 2013, and the performance-based RSU values are calculated using the Monte Carlo valuation model. |
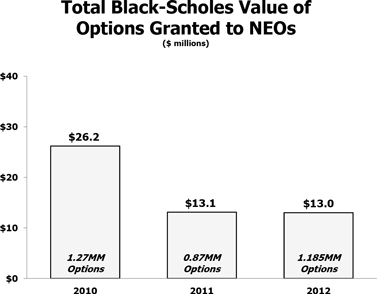
Our committee has always considered the value of the options on the grant date but did not historically use this to determine the appropriate grant level due to the significant changes in value that can occur from one year to the next. Beginning with awards made in February 2011, our committee considered both the number of options granted and the grant date values when approving awards. For awards made for 2012 (granted in January 2013), the committee approved awards with a grant date fair value that was consistent with the options awarded the prior year and approximately 50% less than the value of the options awarded for 2010. Although the awards made in February 2012 are viewed by our committee as part of 2011 total direct compensation, SEC regulations require that they be reflected in the 2012 Summary Compensation Table because they were granted during 2012.
The following chart shows the varying Black-Scholes values of the options granted to the named executive officers for each of the previous three fiscal years:
22
Table of Contents
Summary of 2012 Total Direct Compensation
As noted above, our committee views each executive’s “total direct compensation” for a given year as the sum of the executive’s base salary, aggregate awards under the AIP for that year, and the value of long-term incentives granted in recognition of our performance for that year. In making its decisions regarding the appropriate levels of annual incentive and long-term incentive awards, our committee evaluates the impact of its decisions on the amount of total direct compensation and the percentage of each component to total direct compensation of the executive team as a group. Our committee concluded that the award levels, the form of the awards and the resulting total direct compensation set forth below for the executive team were appropriate considering the company’s performance during 2012. See “Executive Compensation Market Assessment” below.
2012 Total Direct Compensation(1)
(in millions)
| 2012 AIP Awards | Black-Scholes | |||||||||||||||||||||||
| Executive |
Base Salary |
Value Paid in Cash |
Value Paid in RSUs |
Value of Stock Options Granted(2) |
Total
Incentive Compensation(3) |
Total Direct Compensation |
||||||||||||||||||
| James R. Moffett |
$ | 2.50 | $ | 0 | $ | 9.860 | $ | 4.94 | $ | 14.800 | $ | 17.300 | ||||||||||||
| Richard C. Adkerson |
2.50 | 0 | 9.860 | 4.94 | 14.800 | 17.300 | ||||||||||||||||||
| Kathleen L. Quirk |
0.65 | 0 | 3.287 | 1.65 | 4.937 | 5.587 | ||||||||||||||||||
| Michael J. Arnold |
0.55 | 1.2 | 1.643 | 1.48 | 4.323 | 4.873 | ||||||||||||||||||
| (1) | Does not include the value of perquisites and personal benefits, as well as commitments for post-employment compensation, which amounts are included in the 2012 Summary Compensation Table and supplementary tables below. |
| (2) | Although our committee granted these stock options in January 2013, our committee views these grants as part of the executives’ 2012 total direct compensation. See the description of these awards under “Overview of Principal Components of Executive Compensation — Long-Term Incentive Awards.” |
| (3) | Represents total of AIP awards (cash and performance-based RSUs) and stock option awards. |
The values of base salary and the non-equity incentive plan compensation reflected in the 2012 Summary Compensation Table are equivalent to the base salary and the cash portion of the annual incentive award reflected above. However, SEC regulations require that the Summary Compensation Table include the value of equity awards granted “in” a given year, and do not allow companies to treat equity awards granted subsequent to the applicable fiscal year as part of the total compensation for that fiscal year. As such, the equity awards included in the 2012 Summary Compensation Table reflect the value of stock options and performance-based RSUs granted in February 2012 for performance in 2011, and not the stock options and performance-based RSUs granted in 2013 for performance in 2012, which are reflected above.
23
Table of Contents
The table below shows the reduction in total direct compensation of our named executive officers from 2010 to 2012.
Total Direct Compensation – 2010 to 2012
(in millions)
| Total Direct Compensation | Percentage Change for 2012 from 2010 |
|||||||||||||||
| Executive |
2010 | 2011 | 2012 | |||||||||||||
| James R. Moffett |
$ | 30.57 | $ | 18.45 | $ | 17.30 | -43% | |||||||||
| Richard C. Adkerson |
30.57 | 18.45 | 17.30 | -43% | ||||||||||||
| Kathleen L. Quirk |
8.63 | 5.55 | 5.59 | -35% | ||||||||||||
| Michael J. Arnold |
7.02 | 4.80 | 4.87 | -31% | ||||||||||||
|
|
|
|
|
|
|
|||||||||||
| Total |
$ | 76.79 | $ | 47.25 | 45.06 | -41% | ||||||||||
Performance-Based Compensation v. Stock Performance
The following chart illustrates the link between the company’s performance-based compensation (total value of the AIP cash awards, performance-based RSU awards and stock option awards to our named executive officers) to the company’s stock performance over the previous four years.
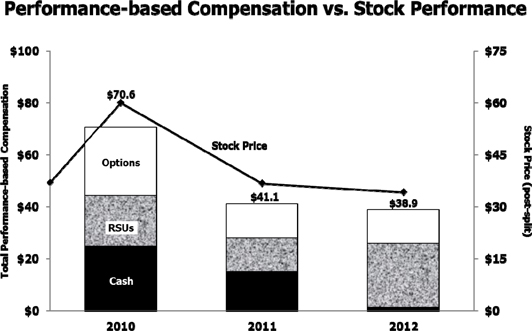
Realizable Pay
In addition to reviewing total direct compensation, the committee also believes that it is important to review and assess “realizable” compensation over the last three years for our Chairman and CEO. Realizable compensation is comprised of the following elements:
| • | base salary for the three-year period, |
| • | cash awards under the AIP for the three-year period, |
| • | for performance-based RSUs that were granted during the three-year period, the value of such awards at vesting or, if unvested, the value as of the end of the three year period, and |
24
Table of Contents
| • | for stock options that were granted during the three-year period, the value received upon exercise of such awards, or if unexercised, the value as of the end of the three year period (based on the Black-Scholes pricing model. |
As shown in the graph below, realizable compensation for each of our Chairman and CEO for the period was lower than his reported compensation in the Summary Compensation Table, primarily resulting from our actual stock price performance over the period. Specifically, the decline in our stock price during the period impacted both the actual value received by each of our Chairman and CEO in connection with vested RSUs and also the value of outstanding awards at the end of the period. In contrast, the values included in the Summary Compensation Table for these awards are the grant date values and thus do not reflect the impact of future stock price performance.
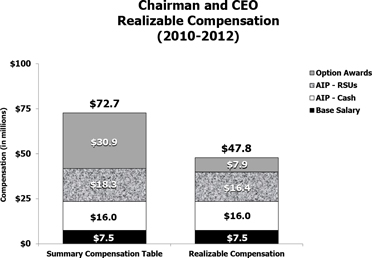
Personal Benefits and Perquisites
In addition to the primary elements of our compensation program discussed above, we also provide certain personal benefits and perquisites to our executive officers. In recent years we have revised this program to discontinue certain benefits, and we will continue to monitor this program and adjust it as we deem appropriate. The personal benefits and perquisites currently offered are reflected in the 2012 Summary Compensation Table. Many of these benefits are designed to provide an added level of security to our executives and increase travel efficiencies, thus ensuring the executives’ ready availability on short notice and enabling the executives to focus more time and energy on company matters. Our committee also recognizes the high degree of integration between the personal and professional lives of these executive officers, and that these benefits ensure the security of the company’s proprietary information by enabling our officers to conduct business while traveling without concern that company information will be compromised.
Post-Termination Compensation
In addition to the compensation received by the executive officers during 2012 and benefits under the company’s ECAP (our 401(k) plan), which we provide to all qualified employees, we also provide certain post-employment benefits to our executive officers, including a nonqualified defined contribution plan and a supplemental executive retirement plan, as well as certain change of control and severance benefits.
Nonqualified Defined Contribution Plan. We maintain an unfunded nonqualified defined contribution plan for the benefit of our executive officers, as well as others. The plan provides those employees whose earnings in a prior year were in excess of the dollar limit under Section 401(a)(17) of the Internal Revenue Code the ability to defer up to 20% of their base salary after deferrals to the ECAP have ceased due to qualified plan limits. The company makes a matching contribution equal to the participant’s deferrals in this plan and the ECAP limited to 5% of the participant’s base salary. In addition, the company also makes enhanced contributions equal to 4% of eligible compensation (base salary plus 50% of bonus) in excess of qualified plan limits for each eligible employee, with
25
Table of Contents
employees who met certain age and service requirements in 2000 (including Messrs. Moffett and Adkerson) receiving an additional 6% contribution. The purpose of the nonqualified plan is to make total retirement benefits for our employees who earn over the qualified plan limits commensurate with those available to other employees as a percentage of pay.
Supplemental Executive Retirement Plan. We established an unfunded supplemental executive retirement plan (SERP) for Messrs. Moffett and Adkerson in February 2004. Our committee, advised by Mercer, its independent compensation consultant at the time, approved the SERP, which was then recommended to and approved by our board. The SERP provides for benefits payable in the form of a 100% joint and survivor annuity, life annuity or an equivalent lump sum. The annuity will equal a percentage of the executive’s highest base pay for any three of the five years immediately preceding the executive’s retirement or the completion of 25 years of credited service, plus his average bonus for those years, provided that the average bonus cannot exceed 200% of average base pay. The percentage used in this calculation is equal to 2% for each year of credited service up to 25 years. Income associated with option exercises or the vesting of RSUs is not considered in determining the benefits payable under the SERP.
The SERP benefit will be reduced by the value of all benefits received under all other retirement plans (qualified and nonqualified), sponsored by the company, by FM Services Company, one of our wholly owned subsidiaries, or by any predecessor employer (including our former parent company, Freeport-McMoRan Inc.), except for benefits produced by accounts funded exclusively by deductions from the participant’s pay. Messrs. Moffett and Adkerson are both 100% vested under the SERP.
Change of Control and Severance Benefits. During 2012, we provided Messrs. Moffett and Adkerson and Ms. Quirk with contractual protections in the event of a change of control, and have also entered into employment agreements with each of these executives, which provide additional severance benefits. We believe that severance protections, particularly in the context of a change of control transaction, can play a valuable role in attracting and retaining key executive officers by providing protections commonly provided in the market. In addition, we believe these benefits also serve the company’s interest by promoting a continuity of management in the context of an actual or threatened change of control transaction. The existence of these arrangements does not impact our decisions regarding other components of our executive compensation program, although we consider these severance protections an important part of our executives’ compensation packages.
We also believe that the occurrence, or potential occurrence, of a change of control transaction will create uncertainty regarding the continued employment of our executive officers. This uncertainty results from the fact that many change of control transactions result in significant organizational changes, particularly at the senior executive level. In order to encourage certain executive officers to remain employed with the company during an important time when their prospects for continued employment following the transaction are often uncertain, we provide certain executive officers with enhanced severance benefits if their employment is terminated by the company without cause or, in certain cases, by the executive in connection with a change of control. Because we believe that a termination by the executive for good reason may be conceptually the same as a termination by the company without cause, and because we believe that in the context of a change of control, potential acquirors would otherwise have an incentive to constructively terminate the executive’s employment to avoid paying severance, we believe it is appropriate to provide severance benefits in these circumstances. We do not provide excise tax gross-up protections under any change of control arrangements.
We do not believe that our executive officers should be entitled to receive cash severance benefits merely because a change of control transaction occurs. The payment of cash severance benefits is only triggered by an actual or constructive termination of employment following a change of control (i.e. a “double trigger”). Under their respective incentive agreements for awards granted prior to 2012, however, our executive officers would be entitled to accelerated vesting of their outstanding equity awards automatically upon a change of control of the company, whether or not the officer’s employment is terminated. This treatment of the equity awards in connection with a change of control applies to all award recipients. As noted above, our committee revised this practice beginning with awards made in 2012. Thus, in connection with the grants of stock options and RSUs made in February 2012 and January 2013, the agreements provide for accelerated vesting of the award following a change of control only if the recipient also experiences an actual or constructive termination of employment within one year after the change of control.
26
Table of Contents
As described in more detail below under “Potential Payments Upon Termination or Change of Control,” Messrs. Moffett and Adkerson and Ms. Quirk would also be entitled under their employment agreements to severance benefits in the event of a termination of employment by the company without cause or by the executive for good reason. Our committee has determined that it is appropriate to provide these executives with severance benefits under these circumstances in light of their positions with the company and as part of their overall compensation package.
Compensation Processes and Policies
Role of Advisors. Our committee has engaged Pay Governance LLC as its independent executive compensation consultant since February 2010. Consistent with our committee’s longstanding policy, Pay Governance will not provide, and has not provided, any services to the company’s management. As required by SEC rules, the committee has assessed the independence of Pay Governance and concluded that Pay Governance’s work did not raise any conflicts of interest. A representative of Pay Governance attends meetings of our committee and communicates with our committee chair between meetings; however, our committee makes all decisions regarding the compensation of our executive officers. Pay Governance provides various executive compensation services to our committee, including advising our committee on the principal aspects of our executive compensation program and evolving industry practices and providing market information and analysis regarding the competitiveness of our program design, as discussed in more detail below.
The committee evaluates the information provided by Pay Governance, but does not apply “hard metrics” to decisions regarding executive compensation. We have a small group of executive officers, and our committee’s decisions regarding salary levels and grant amounts (in the form of equity awards and percentage allocations under the annual incentive plan) reflect our committee’s views as to the broad scope of responsibilities of our executive officers and our committee’s subjective assessment of their individual impact on the company’s overall success. The committee also consults with our executive chairman and our chief executive officer regarding compensation decisions affecting our other executive officers.
Executive Compensation Market Assessment. In February 2012, Pay Governance, presented the committee with a competitive market compensation assessment for the named executive officers. The committee requested this report in order to evaluate how the proposed total compensation to be paid to the company’s named executive officers compared to other publicly traded companies, but not with the intention of setting compensation levels based on the results. Pay Governance compared our executive compensation levels with those of the three groups noted below and a fourth general industry group using data from over 1,000 companies but focused on companies with similar revenues to the company ($19 billion). Although we do not believe that most of the companies in the Basic Materials group are relevant comparators for our company, we recognize that some of our institutional shareholders and some advisory groups may use this group or a similar group to evaluate our executive pay. As a result, the committee reviews this information to ensure that it understands this perspective on “the market,” despite its view that this group is not a relevant reference point.
| U.S Natural Resource Companies |
Non-U.S. Metals and Mining Companies |
Basic Materials Companies | ||
| Anadarko Petroleum Corporation | Anglo American plc | Air Products and Chemicals, Inc. | ||
| Apache Corp. | Barrick Gold Corporation | Alcoa Inc. | ||
| Chesapeake Energy Corporation | BHP Billiton plc | Cliffs Natural Resources Inc. | ||
| Devon Energy Corporation | Rio Tinto plc | E. I. du Pont de Nemours and Company | ||
| Hess Corporation | Teck Resources Limited | International Paper Company | ||
| Murphy Oil Corporation | Vedanta Resources plc | LyondellBasell Industries N.V. | ||
| Newmont Mining Corp. | Xstrata plc | Monsanto Company | ||
| Occidental Petroleum Corporation | Newmont Mining Corporation | |||
| Nucor Corporation | ||||
| PPG Industries, Inc. | ||||
| Praxair, Inc. | ||||
| Southern Copper Corporation | ||||
| The Dow Chemical Company | ||||
| The Mosaic Company |
27
Table of Contents
Based on a review of the information from Pay Governance, the committee recognizes that our 2011 executive compensation levels were consistent with or above the 90th percentile of each group. However, as compared to 2010, when our executive compensation levels were significantly in excess of the top of each group, these levels dropped by approximately 40% for our chairman and our chief executive officer after implementation of the changes discussed above. Pay Governance has not conducted a competitive market compensation assessment since February 2012, and we have not made changes to our program since the significant changes made in early 2012.
In light of the significant changes that will occur in our organization during 2013 as result of our proposed mergers with Plains Exploration & Production Company and McMoRan Exploration Co., Pay Governance will be performing a competitive market compensation assessment during 2013. The committee will be taking a fresh look at executive compensation and the structure of our program during 2013 following the closing of these transactions, and will use this assessment in making its executive compensation decisions.
Executive Chairman and Chief Executive Officer. We recognize that the level of compensation paid to our chairman and our chief executive officer is significantly greater than that paid to our other executive officers. The compensation levels of Messrs. Moffett and Adkerson reflect our view that their management of the organization provides the basis for the company to achieve success and reflects the value that we place on the quality of their leadership and capabilities. Messrs. Moffett and Adkerson each impart extraordinary value to our company, each bringing to their “partnership” a set of complementary skills. We believe their respective compensation arrangements recognize those skills and their contributions to the success of our company. As noted above, the total direct compensation awarded to each of Messrs. Moffett and Adkerson for 2012 was approximately 6% less than the amount awarded for 2011 and 43% less than the amount awarded for 2010.
Mr. Moffett has been at the helm of our company since its formation and has guided our growth through significant discoveries of metal reserves using his skill as a geologist. He also led the development of our Grasberg minerals district. As executive chairman, Mr. Moffett continues to further our business strategy by applying his exceptional talents, which has created substantial value for our company. He directs our global exploration programs and also continues to be instrumental in fostering our relationship with host governments, including the government of Indonesia, the location of our Grasberg mine.
Mr. Adkerson, as president and chief executive officer, is responsible for the executive management of our company. Mr. Adkerson has demonstrated outstanding leadership abilities in developing and executing a business and financial strategy that is positive for our stockholders, and in building an operational, financial and administrative organization that efficiently supports our business through various economic cycles. He led the combination and successful integration of our company and Phelps Dodge to become the world’s largest publicly traded copper company. In addition, Mr. Adkerson has provided strong leadership and sound judgment in our efforts to respond aggressively to changing economic circumstances. Mr. Adkerson, a recognized leader in various business and mining industry organizations, fosters strong relationships with business partners, key customers, suppliers and host governments.
Stock Ownership. We believe that it is important for our executive officers to align their interests with the long-term interests of our stockholders. With that philosophy in mind, we have structured our compensation programs to ensure that a portion of our executive officers’ compensation is delivered in a form of equity, such as stock options and RSUs. Under our program, our executive officers will receive annual grants of stock options and/or RSUs, and our annual incentive plan requires that award amounts in excess of three times an executive’s base salary be paid in an equivalent number of RSUs.
Under our stock ownership guidelines, each of Messrs. Moffett and Adkerson is required to maintain ownership of company stock valued at five times his base salary, and our other executive officers are required to maintain ownership of company stock valued at three times their base salaries. We recently revised the guidelines to exclude shares that have been pledged from the definition of “ownership” for purposes of the guidelines. As of December 31, 2012, all of our executive officers had exceeded their target ownership level. In particular, using the one year trailing average stock price under the guidelines, each of Messrs. Moffett and Adkerson owned shares
28
Table of Contents
under the guidelines valued at approximately 13 times his base salary (representing $33.8 million in value for Mr. Moffett and $31.2 million in value for Mr. Adkerson and more than twice each executive’s target ownership level). These levels reflect their individual commitments to aligning their interests with those of the stockholders and provide an incentive to maximize the value of our stock over the long term. For more information regarding the current stock holdings of our executive officers, please see “Stock Ownership of Directors and Executive Officers.”
Consideration of Stock Option Exercises and RSU Vestings. Our committee does not factor into its decisions regarding executive compensation the gains received by our executive officers in connection with exercises of stock options or the vesting of RSUs. The value an executive receives from a stock option exercise is directly related to the appreciation in value of our common stock, which in turn we believe is directly affected by the efforts of our executive officers in managing our company. Because RSUs are granted as performance compensation for the year awarded, we believe it would be inappropriate to allow the value of the award at vesting to affect future compensation decisions. Our annual incentive plan requires that any portion of our executive’s annual bonus paid in RSUs will continue to be subject to a performance condition for three years. Further, a key purpose behind granting equity awards to executives is to provide an incentive for them to increase stockholder value over time. Accordingly, our committee has not taken realized option gains into account when making decisions regarding future compensation, nor did it revise its compensation or grant practices during years when our executives did not exercise any stock options.
Compensation Clawback Policy. Our committee has adopted an incentive compensation clawback policy that would enable the company to clawback all or a portion of incentive compensation in the event an executive’s misconduct causes the company to have to issue a restatement of its financial statements, to the extent that such executive’s incentive compensation was based on the misstated financials. Our committee will amend the clawback policy, as needed, once the SEC adopts the final implementing rules regarding compensation clawbacks mandated by Dodd-Frank.
Risks Arising from Compensation Policies and Practices After reviewing the company’s significant compensation programs, management and our committee believe that the risks arising from our compensation policies and practices for our employees, including our executive officers, are not reasonably likely to have a material adverse effect on the company. In reaching this conclusion, we have taken into account the purpose and structure of these programs and the following design elements of our compensation programs and policies: our balance and amount of annual and long-term compensation elements at the executive and management levels; our use of operating cash flow as a performance metric for executives and management level employees, which we believe is a meaningful indicator of our performance; the multi-year vesting of equity awards that promotes focus on the long-term operational and financial performance of our company; and bonus arrangements for most employees that are not guaranteed and are ultimately at the discretion of either our committee (for our executive officers and senior management) or senior management (for other employees). These features, as well as the stock ownership requirements for our executive officers, result in a compensation program that aligns our executives’ interests with those of our stockholders and does not promote excessive risk-taking on the part of our executives or other employees.
Tax Considerations
Section 162(m). Section 162(m) of the Internal Revenue Code (the Code) limits to $1 million a public company’s annual tax deduction for compensation paid to certain highly compensated executive officers. Qualified performance-based compensation is excluded from this deduction limitation if certain requirements are met. The committee’s policy is to structure compensation awards that will be deductible where doing so will further the purposes of our executive compensation programs. The committee also considers it important to retain flexibility to design compensation programs that recognize a full range of criteria important to our success, even where compensation payable under the programs may not be fully deductible. As such, the committee may implement revised or additional compensation programs in the future as it deems appropriate or necessary to adequately compensate our executive team.
The AIP is designed to meet the requirements of Section 162(m) of the Code by setting an objective performance target and a maximum funding amount. Under the plan, once the performance target has been achieved, the committee retains the discretion to reduce or eliminate the award pool and the awards to specific officers. Accordingly, this plan design preserves the company’s tax treatment of these awards as “performance-based” under Section 162(m), but gives the committee flexibility in operating the plan.
29
Table of Contents
With respect to the compensation received by our named executive officers for 2012, the stock options and the awards under our AIP are designed to qualify for the exclusion from the deduction limitation under Section 162(m).
Sections 280G and 4999. Code Section 4999 imposes a 20% excise tax on the recipient of an “excess parachute payment” and Code Section 280G disallows the tax deduction to the payor of any amount of an excess parachute payment that is contingent on a change of control. We do not provide excise tax gross-up protections under any change of control arrangements.
Compensation Committee Report On Executive Compensation
The compensation committee of the board has reviewed and discussed with management the Compensation Discussion and Analysis required by Item 402(b) of Regulation S-K, and based on such review and discussion, the compensation committee recommended to the board that the Compensation Discussion and Analysis be included in this Amendment.
Submitted by the Compensation Committee on April 22, 2013:
| H. Devon Graham, Jr., Chairman |
| Robert J. Allison, Jr. |
| Charles C. Krulak |
| Bobby Lee Lackey |
Executive Compensation Tables
The table below shows the total compensation paid to or earned by our named executive officers. The amounts reflected in the Stock Awards and the Option Awards columns for 2012 were awarded in February 2012 for performance in 2011. For a more detailed discussion of our executive compensation program, see the section titled “Compensation Discussion and Analysis” beginning on page 9, and for the amounts awarded for performance in 2012 specifically, see pages 21-22.
2012 Summary Compensation Table
| Name and Principal Position |
Year | Salary (1) |
Stock Awards (2) |
Option Awards (3) |
Non-Equity Incentive Plan Compensation (4) |
Change in Pension Value and Nonqualified Deferred Compensation Earnings (5) |
All Other Compensation (6) |
Total | ||||||||||||||||||||||||
| James R. Moffett Chairman of the Board |
|
2012 2011 2010 |
|
$ |
2,500,000 2,500,000 2,500,000 |
|
$ |
4,746,016 7,768,290 5,818,492 |
|
$ |
5,190,900 10,300,000 15,420,000 |
|
$ |
— 6,000,000 10,000,000 |
|
$ |
1,490,722 1,357,042 1,241,272 |
|
$ |
1,771,778 2,160,511 1,773,225 |
|
$ |
15,699,416 30,085,843 36,752,989 |
| ||||||||
| Richard C. Adkerson President & Chief Executive Officer |
|
2012 2011 2010 |
|
|
2,500,000 2,500,000 2,500,000 |
|
|
4,746,016 7,768,290 5,818,492 |
|
|
5,190,900 10,300,000 15,420,000 |
|
|
— 6,000,000 10,000,000 |
|
|
— 2,188,032 4,241,511 |
|
|
1,574,460 1,867,544 1,555,531 |
|
|
14,011,376 30,623,866 39,535,534 |
| ||||||||
| Kathleen L. Quirk Executive Vice President, Chief Financial Officer & Treasurer |
|
2012 2011 2010 |
|
|
650,000 650,000 650,000 |
|
|
1,542,440 2,286,248 1,967,559 |
|
|
1,730,300 3,090,000 4,626,000 |
|
|
— 1,625,000 2,600,000 |
|
|
— — — |
|
|
132,756 192,440 149,239 |
|
|
4,055,496 7,843,688 9,992,798 |
| ||||||||
| Michael J. Arnold Executive Vice President & Chief Administrative Officer |
|
2012 2011 2010 |
|
|
550,000 550,000 550,000 |
|
|
1,305,134 1,797,840 1,721,677 |
|
|
1,573,000 2,472,000 3,700,800 |
|
|
1,200,000 1,375,000 2,200,000 |
|
|
— — — |
|
|
134,633 188,809 146,180 |
|
|
4,762,767 6,384,489 8,318,657 |
| ||||||||
| (1) | Messrs. Moffett and Adkerson and Ms. Quirk also provide services to and receive compensation from McMoRan Exploration Co. |
30
Table of Contents
| (2) | Reflects the aggregate grant date fair value of performance-based restricted stock units (RSUs). The grant date fair value of RSUs awarded in February 2012 was calculated using a Monte Carlo simulation model as described in Note 11 to our annual report on Form 10-K for the fiscal year ended December 31, 2012. Each RSU represents a contingent right to receive one share of our common stock on February 15, 2015, if our five-year return on investment is 6% or greater, with 20% of the award subject to forfeiture if our total shareholder return (TSR) for the three-year period ending on December 31, 2014 is below the median TSR of our peer group. The maximum aggregate grant date value of the 2012 stock awards for each of the named executive officers assuming maximum payout of the RSUs is as follows: for each of Messrs. Moffett and Adkerson - $5,000,017, for Ms. Quirk - $1,624,989 and for Mr. Arnold - $1,374,984. For more information regarding RSUs granted to the named executive officers in 2013 relating to 2012 compensation, see the section titled “Compensation Discussion and Analysis” beginning on page 9. |
| (3) | The amounts reported in the “Option Awards” column reflect the grant date fair value of the options granted to the named executive officers in the year reflected, determined using the Black-Scholes option valuation model. For information relating to the assumptions made by us in valuing the option awards made to our named executive officers in fiscal years 2010 through 2012, refer to Notes 1 and 11 of our financial statements in our annual report on Form 10-K for the year ended December 31, 2012. Our committee views options granted in a given year as part of the prior year’s compensation. For more information regarding options granted to the named executive officers in 2013 relating to 2012 compensation, see the section titled “Compensation Discussion and Analysis” beginning on page 9. |
| (4) | The amounts reported in the “Non-Equity Incentive Plan Compensation” column reflect the annual cash incentive payments received under our annual incentive plan. |
| (5) | The amounts reported in the “Change in Pension Value and Nonqualified Deferred Compensation Earnings” column include the change in actuarial value of our supplemental executive retirement plan for Messrs. Moffett and Adkerson in 2010, 2011 and 2012. See the section titled “Retirement Benefit Programs” beginning on page 35 for more information. Mr. Adkerson had a negative change in the actuarial present value of the supplemental executive retirement plan benefit in the amount of $394,993 during 2012 as a result of employer contributions made to his other benefits. |
| (6) | The amounts reported in the “All Other Compensation” column for 2012 reflect, for each named executive officer as applicable, the sum of the incremental cost to the company of all perquisites and other personal benefits and additional all other compensation required by SEC rules to be separately quantified, including (A) amounts contributed by the company to defined contribution plans, which includes both the ECAP and the nonqualified defined contribution plan (B) the dollar value of life insurance premiums paid by the company; and (C) the dollar value of interest credited on dividend equivalents on unvested RSUs during 2012. The perquisites and other personal benefits reported include (a) personal financial and tax advice under the company’s executive services program, (b) the aggregate incremental cost to the company of the executive’s personal use of fractionally owned company aircraft, which includes the hourly operating rate, fuel costs and excise taxes, (c) personal use of company facilities and personnel, (d) personal and business use of company cars and security services, which includes annual driver compensation and annual car lease and insurance costs, and (e) our premium payments for personal excess liability insurance, as reflected in the table below. The aggregate incremental cost to the company of Messrs. Moffett and Adkerson’s personal use of fractionally owned company aircraft does not include the lost tax deduction for expenses that exceeded the amounts reported as income for each executive, which for fiscal year 2012 was approximately $73,148 for Mr. Moffett and $73,947 for Mr. Adkerson. |
31
Table of Contents
| Perquisites and Other Personal Benefits (*) | Additional All Other Compensation | |||||||||||||||||||||||||||||||
| Name |
Financial and Tax Advice |
Aircraft Usage |
Facilities and Personnel |
Security and Cars |
Personal Excess Liability Insurance Premiums |
Plan Contributions |
Life Insurance Premiums |
Interest Credited on Dividend Equivalents |
||||||||||||||||||||||||
| Mr. Moffett |
$ | 20,000 | $ | 233,154 | $ | 218,507 | $ | 176,141 | $ | 4,791 | $ | 904,750 | $ | 201,124 | $ | 13,311 | ||||||||||||||||
| Mr. Adkerson |
12,596 | 325,160 | 52,763 | 214,712 | 4,791 | 913,750 | 37,377 | 13,311 | ||||||||||||||||||||||||
| Ms. Quirk |
2,352 | — | — | — | 1,575 | 122,360 | 2,250 | 4,219 | ||||||||||||||||||||||||
| Mr. Arnold |
17,022 | — | — | 779 | 1,575 | 103,420 | 8,316 | 3,521 | ||||||||||||||||||||||||
| (*) | Payments made under the matching gifts program are no longer reportable as a perquisite because effective January 1, 2012, the limit on the annual amount of our matching gifts was increased to $40,000 for all directors, officers, employees, full time consultants and certain retirees; therefore, matching gifts are no longer reflected in the “All Other Compensation” column for 2012 for any of our named executive officers. |
The amount reported in the “All Other Compensation” column for 2011 was adjusted to reflect payment of financial and tax advice fees incurred by Mr. Arnold in 2011 but paid in 2012.
Grants of Plan-Based Awards
in Fiscal Year 2012
| Name |
Grant Date |
Estimated Future Payouts Under Non-Equity Incentive Plan Awards: Target |
Estimated Future Payouts Under Equity Incentive Plan Awards: Target |
All Other Option Awards: Number of Securities Underlying Options |
Exercise or Base Price of Option Awards (2) |
Grant Date Fair Value of Stock and Option Awards |
||||||||||||||||||
| James R. Moffett |
||||||||||||||||||||||||
| AIP – Cash Award AIP – RSU Award Options |
|
— 02/06/12 02/06/12 |
|
$
|
7,500,000 — — |
(1)
|
|
— 106,998 — |
|
|
— — 330,000 |
|
$ |
— — 46.73 |
|
$
|
— 4,746,016 5,190,900 |
| ||||||
| Richard C. Adkerson |
||||||||||||||||||||||||
| AIP – Cash Award AIP – RSU Award Options |
|
— 02/06/12 02/06/12 |
|
|
7,500,000 — — |
(1)
|
|
— 106,998 — |
|
|
— — 330,000 |
|
|
— — 46.73 |
|
|
— 4,746,016 5,190,900 |
| ||||||
| Kathleen L. Quirk |
||||||||||||||||||||||||
| AIP – Cash Award AIP – RSU Award Options |
|
— 02/06/12 02/06/12 |
|
|
1,950,000 — — |
(1)
|
|
— 34,774 — |
|
|
— — 110,000 |
|
|
— — 46.73 |
|
|
— 1,542,440 1,730,300 |
| ||||||
| Michael J. Arnold |
||||||||||||||||||||||||
| AIP – Cash Award AIP – RSU Award Options |
|
— 02/06/12 02/06/12 |
|
|
1,650,000 — — |
(1)
|
|
— 29,424 — |
|
|
— — 100,000 |
|
|
— — 46.73 |
|
|
— 1,305,134 1,573,000 |
| ||||||
| (1) | Represents the estimated maximum possible annual cash incentive payment that could have been received by each named executive officer pursuant to the annual incentive plan for fiscal year 2012. These estimated amounts were calculated by multiplying the percentage of the award pool under the plan allocated to each officer for 2012 by the maximum plan funding amount produced for the 2011 plan year and applying the cap of three times each executive’s base salary under the annual incentive plan. The actual cash amounts paid in early 2013 to Mr. Arnold pursuant to the annual incentive plan for 2012 are reflected in the “2012 Summary Compensation Table.” As discussed in the section titled “Compensation Discussion and Analysis” on page 9, our other named executive officers did not receive cash payouts under our annual incentive plan for 2012, instead receiving the entire value of the earned award in performance-based RSUs. |
| (2) | The exercise price of each stock option reflected in this table was determined by reference to the closing quoted per share sale price of our common stock on the composite tape for NYSE-listed stocks on the grant date. |
32
Table of Contents
Outstanding Equity Awards at December 31, 2012
| Option Awards (1) | Stock Awards (2) | |||||||||||||||||||||||||||
| Name |
Option Grant Date |
Number of Securities Underlying Unexercised Options Exercisable |
Number of Securities Underlying Unexercised Options Unexercisable |
Option Exercise Price (3) |
Option Expiration Date |
Equity Incentive Plan Awards: Number of Unearned Shares, Units or Other Rights That Have Not Vested |
Equity Incentive Plan Awards: Market or Payout Value of Unearned Shares, Units or Other Rights That Have Not Vested (4) |
|||||||||||||||||||||
| James R. Moffett |
|
05/11/07 02/02/09 02/02/10 02/08/11 02/06/12 |
|
|
750,000 — 500,000 125,000 — |
|
|
— 250,000 500,000 375,000 330,000 |
|
$
|
36.460 12.295 36.255 55.640 46.730 |
|
|
05/11/17 02/02/19 02/02/20 02/08/21 02/06/22 |
|
253,572 | $ | 8,672,162 | ||||||||||
| Richard C. Adkerson |
|
05/11/07 02/02/09 02/02/10 02/08/11 02/06/12 |
|
|
3,000,000 — 500,000 125,000 — |
|
|
— 250,000 500,000 375,000 330,000 |
|
|
36.460 12.295 36.255 55.640 46.730 |
|
|
05/11/17 02/02/19 02/02/20 02/08/21 02/06/22 |
|
253,572 | 8,672,162 | |||||||||||
| Kathleen L. Quirk |
|
02/04/03 02/03/04 02/01/05 05/11/07 02/02/09 02/02/10 02/08/11 02/06/12 |
|
|
15,000 75,000 371,500 1,000,000 225,000 150,000 37,500 — |
|
|
— — — — 75,000 150,000 112,500 110,000 |
|
|
9.443 18.383 18.520 36.460 12.295 36.255 55.640 46.730 |
|
|
02/04/13 02/03/14 02/01/15 05/11/17 02/02/19 02/02/20 02/08/21 02/06/22 |
|
80,257 | 2,744,789 | |||||||||||
| Michael J. Arnold |
|
05/11/07 02/02/09 02/02/10 02/08/11 02/06/12 |
|
|
700,000 120,000 120,000 30,000 — |
|
|
— 60,000 120,000 90,000 100,000 |
|
|
36.460 12.295 36.255 55.640 46.730 |
|
|
05/11/17 02/02/19 02/02/20 02/08/21 02/06/22 |
|
66,795 | 2,284,389 | |||||||||||
| (1) | Unless otherwise noted, the stock options become exercisable in 25% annual increments on each of the first four anniversaries of the date of grant and have a term of 10 years. The stock options granted prior to 2012 will become immediately exercisable in the event of a change in control of the company (as defined in the applicable agreement), and stock options granted in 2012 will only become immediately exercisable if there is a qualifying termination of employment following a change in control. |
| (2) | The RSUs held by the named executive officers will vest and be paid out in shares of our common stock as follows, provided the average return on investment for the five calendar years preceding the year of vesting is at least 6%. |
33
Table of Contents
| Name |
RSUs | Vesting Date |
||||||
| Mr. Moffett |
|
100,035 46,539 106,998 |
|
|
02/15/13 02/15/14 02/15/15 |
| ||
| Mr. Adkerson |
|
100,035 46,539 106,998 |
|
|
02/15/13 02/15/14 02/15/15 |
| ||
| Ms. Quirk |
|
31,786 13,697 34,774 |
|
|
02/15/13 02/15/14 02/15/15 |
| ||
| Mr. Arnold |
|
26,600 10,771 29,424 |
|
|
02/15/13 02/15/14 02/15/15 |
| ||
| (3) | Effective January 30, 2007, the compensation committee (formerly the corporate personnel committee) of the board amended its policies to provide that the exercise price of an option shall not be less than the closing quoted per share sale price of our common stock on the composite tape for NYSE-listed stocks on the grant date or, if there are no reported sales on such date, on the last preceding date on which any reported sale occurred. Thus, the exercise price of the stock options expiring in 2017 and thereafter was determined by reference to the closing price of our common stock. Prior to that time, the exercise price of each outstanding stock option reflected in this table was determined by reference to the average of the high and low quoted per share sale price of our common stock on the composite tape for NYSE-listed stocks on the grant date or, if there are no reported sales on such date, on the last preceding date on which any reported sale occurred. |
| (4) | The market value of the unvested RSUs reflected in this table was based on the $34.20 closing market price per share of our common stock on December 31, 2012. |
Option Exercises and Stock Vested During 2012
| Option Awards | Stock Awards | |||||||||||||||
| Name |
Number of Shares Acquired on Exercise |
Value Realized on Exercise (1) |
Number of Shares Acquired on Vesting |
Value Realized on Vesting (2) |
||||||||||||
| James R. Moffett |
250,000 | $ | 7,526,250 | 100,033 | $ | 4,241,399 | ||||||||||
| Richard C. Adkerson |
250,000 | 8,531,250 | 180,033 | 7,184,599 | ||||||||||||
| Kathleen L. Quirk |
— | — | 61,785 | 2,451,384 | ||||||||||||
| Michael J. Arnold |
— | — | 26,599 | 1,127,798 | ||||||||||||
| (1) | The value realized on exercise is based on the difference between the closing sale price on the date of exercise and the exercise price of each option. |
| (2) | The value realized on vesting is based on the closing sale price on the date of vesting of the RSUs or, if there were no reported sales on such date, on the last preceding date on which any reported sale occurred. |
34
Table of Contents
Retirement Benefit Programs
Nonqualified Defined Contribution Plan. We maintain an unfunded nonqualified defined contribution plan for the benefit of our executive officers, as well as others. The plan provides those employees whose earnings in a prior year were in excess of the dollar limit under Section 401(a)(17) of the Internal Revenue Code the ability to defer up to 20% of their base salary after deferrals to the ECAP have ceased due to qualified plan limits. The company makes a matching contribution equal to the participant’s deferrals in this plan and the ECAP limited to 5% of the participant’s base salary. In addition, the company also makes enhanced contributions equal to 4% of eligible compensation (base salary plus 50% of bonus) in excess of qualified plan limits for each eligible employee, with employees who met certain age and service requirements in 2000 (including Messrs. Moffett and Adkerson) receiving an additional 6% contribution. Distribution is made in a lump sum as soon as practicable or if timely elected by the participant, on January 1st of the year following retirement, but no earlier than the date allowable under law following separation from service. The table below sets forth the balances under our unfunded nonqualified defined contribution plan as of December 31, 2012 for each named executive officer.
2012 Nonqualified Deferred Compensation
| Name |
Executive Contributions in Last Fiscal Year (1) |
Registrant Contributions in Last Fiscal Year (2) |
Aggregate Earnings in Last Fiscal Year (3) |
Aggregate Withdrawals / Distributions |
Aggregate Balance at Last Fiscal Year End (4) |
|||||||||||||||
| James R. Moffett |
$ | 202,500 | $ | 871,750 | $ | 946,645 | — | $ | 30,076,071 | |||||||||||
| Richard C. Adkerson |
112,500 | 880,750 | 678,970 | — | 21,618,876 | |||||||||||||||
| Kathleen L. Quirk |
28,500 | 99,860 | 31,749 | — | 1,045,839 | |||||||||||||||
| Michael J. Arnold |
27,000 | 80,920 | 102,738 | — | 3,272,409 | |||||||||||||||
| (1) | The amounts reflected in this column are included in the “Salary” column for each named executive officer for 2012 reported in the “2012 Summary Compensation Table.” |
| (2) | The amounts reflected in this column are included in the “All Other Compensation” column for each named executive officer for 2012 in the “2012 Summary Compensation Table,” although the “Plan Contributions” reflected in footnote 6 to that table also include contributions to the company’s ECAP. |
| (3) | The assets in the plan are treated as if invested to produce a rate of interest equal to the prime rate, as published in the Federal Reserve Statistical Report at the beginning of each month. For 2012, that rate of interest was equal to 3.25% for the entire year and none of the earnings were considered preferential. |
| (4) | The following amounts reflected in this column for each named executive officer were included in the 2011 “total” compensation for each named executive officer in the “2012 Summary Compensation Table”: Mr. Moffett – $1,413,617, Mr. Adkerson – $1,332,392, Ms. Quirk – $161,991 and Mr. Arnold – $133,775. The following amounts reflected in this column for each named executive officer were included in the 2010 “total” compensation for each named executive officer in the “2012 Summary Compensation Table”: Mr. Moffett – $1,171,105, Mr. Adkerson – $1,418,605, Ms. Quirk – $116,290 and Mr. Arnold – $97,850. |
Supplemental Executive Retirement Plan – Messrs. Moffett and Adkerson. In February 2004, we established an unfunded Supplemental Executive Retirement Plan (SERP) for Messrs. Moffett and Adkerson. The compensation committee, advised by its independent compensation consultant at that time, approved the SERP, which was then recommended to and approved by the board. The SERP provides for benefits payable in the form of a 100% joint and survivor annuity, life annuity or an equivalent lump sum. If a participant retires prior to completing 25 years of credited service, the annuity will equal a percentage of the executive’s highest average base pay for any three of the five calendar years immediately preceding the executive’s retirement, plus his average bonus for the same three years; provided that the average bonus cannot exceed 200% of the average base pay. The percentage used in this calculation is 2% for each year of credited service for the company and its predecessor
35
Table of Contents
beginning in 1981, but capped at 25 years. For Mr. Moffett, who has attained 25 years of credited service, the annuity was fixed as of January 1st of the year in which he completed 25 years of credited service, and will only increase at retirement as a result of mortality and interest adjustments.
The SERP benefit is reduced by the value of all benefits from current and former retirement plans (qualified and nonqualified), sponsored by the company, by FM Services Company or by any predecessor employer (including our former parent company, Freeport-McMoRan Inc.), except for benefits produced by accounts funded exclusively by deductions from the participant’s pay. The amounts provided in the table below reflect these reductions. Messrs. Moffett and Adkerson are both 100% vested under the SERP, and each has elected to receive his SERP benefit in a lump sum.
2012 Pension Benefits
| Name |
Plan Name |
Number of Years Credited Service (1) |
Present Value of Accumulated Benefit (2) |
|||||
| James R. Moffett |
Supplemental Executive Retirement Plan | 25 | $ | 22,041,551 | ||||
| Richard C. Adkerson |
Supplemental Executive Retirement Plan | 24 | 27,592,359 | |||||
| (1) | The years of credited service under the SERP is the participant’s years of service with the company and its predecessor beginning in 1981, but capped at 25 years. |
| (2) | The present value of the accumulated benefit at the normal retirement date is calculated using the following assumptions: the mortality table described in Revenue Ruling 2001-62 of the IRS, and a 6% interest rate. |
Potential Payments upon Termination or Change of Control
Employment Agreements – Messrs. Moffett and Adkerson and Ms. Quirk. We have entered into employment agreements with each of Messrs. Moffett and Adkerson and Ms. Quirk, which were approved by our compensation committee and the board.
Mr. Moffett. The employment agreement with Mr. Moffett provides for a base salary of $2,500,000 per year and eligibility to participate in our annual incentive plan. Mr. Moffett continues to be eligible for all other benefits and compensation, including stock options, generally provided to our most senior executives. The amended term of the agreement continued through December 31, 2009, with automatic one-year extensions unless a change of control occurs or prior written notice is given by the compensation committee (formerly the corporate personnel committee) that it does not wish to extend the agreement. In the event of a change of control during the employment term, Mr. Moffett’s employment will continue for an additional three years following the change of control pursuant to his change of control agreement. Mr. Moffett’s agreement also contains non-competition, nondisclosure and other provisions intended to protect our interests in the event that he ceases to be employed.
Mr. Adkerson and Ms. Quirk. The employment agreements with Mr. Adkerson and Ms. Quirk reflect the current base salary for each executive officer, $2,500,000 for Mr. Adkerson and $650,000 for Ms. Quirk, and provide that each executive officer is eligible to participate in our annual incentive plan. Mr. Adkerson and Ms. Quirk continue to be eligible for all other benefits and compensation, including stock options, generally provided to our most senior executives. The original term of each agreement continued through January 1, 2012, with automatic one-year extensions unless prior written notice is given by the compensation committee (formerly the corporate personnel committee) that it does not wish to extend the agreement. In the event of a change of control, the agreements will expire three years following the change of control. These agreements also contain non-competition, nondisclosure and other provisions intended to protect our interests in the event that the executive officer ceases to be employed.
36
Table of Contents
In addition to the post-employment benefits provided under the company’s retirement benefit programs described above, as of December 31, 2012, we provided the following additional benefits to our named executive officers.
Severance Benefits - Messrs. Moffett and Adkerson and Ms. Quirk. As of December 31, 2012, the employment agreements for Messrs. Moffett and Adkerson and Ms. Quirk provide that if we terminate the executive’s employment without cause or the executive terminates employment for good reason, we will make certain payments and provide certain benefits to the executive, including:
| • | payment of a pro rata bonus for the year in which the termination of employment occurs, |
| • | a cash payment equal to three times the sum of (a) the executive’s base salary plus (b) the average of the bonuses paid to the executive for the immediately preceding three years, |
| • | continuation of insurance and welfare benefits for three years or until the executive accepts new employment, if earlier, and |
| • | acceleration of the vesting and payout of all outstanding stock options and RSUs. |
Under the employment agreements, “cause” is generally defined as the executive’s (a) failure to perform substantially the executive’s duties with the company, (b) breach of the agreement, (c) felony conviction, (d) unauthorized acts resulting in harm to the company or (e) falsification of financial records. “Good reason” is generally defined as (a) any failure by the company to materially comply with any of the provisions of the agreement or (b) the assignment to the executive of any duties inconsistent in any material respect with the executive’s position, authority, duties or responsibilities under the agreement.
If the executive’s employment terminates as a result of death, disability or retirement, benefits to the executive or the executive’s estate include the payment of a pro rata bonus for the year of termination and, in the case of retirement, the continuation of insurance and welfare benefits for three years or until the executive accepts new employment, if earlier. The executive will also receive an additional year’s vesting on unvested stock options and the vesting of certain outstanding RSUs, all as described in footnotes (1) and (2) to the table below.
As a condition to receipt of these severance benefits, the executive must retain in confidence all confidential information known to him or her concerning our business. Further, Messrs. Moffett and Adkerson have each agreed not to compete with us for a period of two years after termination of employment. Ms. Quirk has agreed not to compete with us for a period of six months after termination of employment.
Change of Control Benefits - Messrs. Moffett and Adkerson and Ms. Quirk. The change of control agreement for Mr. Moffett and the employment agreement for each of Mr. Adkerson and Ms. Quirk provide generally that the terms and conditions of the executive’s employment (including position, compensation and benefits) will not be adversely changed until the third anniversary of the change of control.
If any of Messrs. Moffett or Adkerson or Ms. Quirk is terminated without “cause,” as generally defined above, or if the executive terminates for “good reason” during the covered period after a change of control, the executive is generally entitled to receive the same payments and benefits that he or she would receive in the event of a similar termination under the employment agreements, described above, except the executive will receive a cash payment equal to three times the sum of the executive’s base salary plus the highest bonus paid to the executive (rather than the average bonus paid to the executive) for the immediately preceding three fiscal years. This is a “double trigger” agreement meaning that they do not receive benefits unless (1) a change of control occurs and (2) employment is terminated. The term “good reason” includes the failure of the acquiror to provide the executive with substantially the same position, authority, duties and responsibilities in the ultimate parent company of the entity resulting from the transaction, in addition to the reasons generally provided above.
37
Table of Contents
If employment terminates as a result of death, disability or retirement following a change of control, the executive will receive the same benefits described above under “Severance Benefits - Messrs. Moffett and Adkerson and Ms. Quirk” in the event of death, disability or retirement.
We do not provide excise tax gross-up protections in any of our change of control arrangements. If any part of the payments or benefits received by Messrs. Moffett or Adkerson or Ms. Quirk in connection with a termination following a change of control constitutes an excess parachute payment under Section 4999 of the Internal Revenue Code, the executive will receive the greater of (a) the amount of such payments and benefits reduced so that none of the amount constitutes an excess parachute payment, net of income taxes, or (b) the amount of such payments and benefits, net of income taxes and net of excise taxes under Section 4999 of the Internal Revenue Code.
The confidentiality and non-competition provisions of the executives’ employment agreements continue to apply after a change of control.
Change of Control Benefits - Mr. Arnold. Mr. Arnold’s change of control agreement expired on December 31, 2011. Accordingly, we currently do not have a change of control agreement with Mr. Arnold. For Mr. Arnold, the following table shows only accelerated vesting of stock options and RSUs upon certain terminations of employment and upon a change of control. This benefit is a term of the stock option or RSU grant, and applies to all stock option or RSU recipients, not just our executives.
The following table quantifies the potential payments to our named executive officers under the contracts, arrangements or plans discussed above for various scenarios involving a change of control or termination of employment of each of our named executive officers. In addition to these benefits, our named executive officers would be entitled to receive the retirement and pension benefits described above under “Retirement Benefit Programs,” and outstanding vested stock options, which amounts are reflected in the “Walk-Away Value” column.
In accordance with SEC rules, the information below assumes a termination date of December 31, 2012. We have used the closing price of our common stock of $34.20 on December 31, 2012, as reported on the NYSE, for purposes of calculating the value of the unvested and accelerated options and restricted stock units.
Potential Payments Upon Termination or Change of Control
| Name |
Lump Sum Payment |
Options (Unvested and Accelerated) (1) |
Restricted Stock Units (Unvested and Accelerated) (2) |
Accumulated Dividends & Interest Payable on Accelerated RSUs |
Health and Welfare Benefits |
Total | Walk-Away Value (including Value of Vested Benefits) (3) |
|||||||||||||||||||||
| James R. Moffett |
||||||||||||||||||||||||||||
| — Retirement (4) |
— | $ | 5,476,250 | $ | 7,080,529 | $ | 482,842 | $ | 605,325 | $ | 13,644,946 | $ | 65,762,568 | |||||||||||||||
| — Death / Disability (4) |
— | 5,476,250 | 7,080,529 | 482,842 | — | 13,039,621 | 65,157,243 | |||||||||||||||||||||
| — Termination-Good Reason/No Cause |
$ | 48,932,454 | 5,476,250 | 8,672,162 | 614,638 | 605,325 | 64,300,829 | 116,418,451 | ||||||||||||||||||||
| — Termination after Change of Control (5)(6) |
60,805,014 | 5,476,250 | 8,672,162 | 614,638 | 605,325 | 76,173,389 | 128,291,011 | |||||||||||||||||||||
| Richard C. Adkerson |
||||||||||||||||||||||||||||
| — Retirement (4) |
— | 5,476,250 | 7,080,529 | 482,842 | 103,864 | 13,143,485 | 62,354,720 | |||||||||||||||||||||
| — Death / Disability (4) |
— | 5,476,250 | 7,080,529 | 482,842 | — | 13,039,621 | 62,250,856 | |||||||||||||||||||||
| — Termination-Good Reason/No Cause |
48,932,454 | 5,476,250 | 8,672,162 | 614,638 | 103,864 | 63,799,368 | 113,010,603 | |||||||||||||||||||||
| — Termination after Change of Control (5)(6) |
60,805,014 | 5,476,250 | 8,672,162 | 614,638 | 103,864 | 75,671,928 | 124,883,163 | |||||||||||||||||||||
38
Table of Contents
| Name |
Lump Sum Payment |
Options (Unvested and Accelerated) (1) |
Restricted Stock Units (Unvested and Accelerated) (2) |
Accumulated Dividends & Interest Payable on Accelerated RSUs |
Health and Welfare Benefits |
Total | Walk-Away Value (including Value of Vested Benefits) (3) |
|||||||||||||||||||||
| Kathleen L. Quirk |
||||||||||||||||||||||||||||
| — Retirement (4) |
— | 1,642,875 | 2,276,352 | 155,717 | 39,325 | 4,114,179 | 17,471,438 | |||||||||||||||||||||
| — Death / Disability (4) |
— | 1,642,875 | 2,276,352 | 155,717 | — | 4,074,944 | 17,432,203 | |||||||||||||||||||||
| — Termination-Good Reason/ No Cause |
13,556,211 | 1,642,875 | 2,744,789 | 194,506 | 39,325 | 18,177,616 | 31,534,875 | |||||||||||||||||||||
| — Termination after Change of Control (5)(6) |
16,608,879 | 1,642,875 | 2,744,789 | 194,506 | 39,325 | 21,230,284 | 34,587,543 | |||||||||||||||||||||
| Michael J. Arnold |
||||||||||||||||||||||||||||
| — Retirement (4) |
— | 1,314,300 | 1,916,021 | 131,552 | — | 3,361,873 | 9,262,882 | |||||||||||||||||||||
| — Death / Disability (4) |
— | 1,314,300 | 1,916,021 | 131,552 | — | 3,361,873 | 9,262,882 | |||||||||||||||||||||
| — Termination-No Cause (7) |
— | — | — | — | — | — | 5,901,009 | |||||||||||||||||||||
| — Termination after Change of Control (5)(6) |
— | 1,314,300 | 2,284,389 | 162,055 | — | 3,760,744 | 9,661,753 | |||||||||||||||||||||
| (1) | Vesting of outstanding stock options may be accelerated under certain termination scenarios pursuant to the employment agreements as discussed above. The value of the accelerated options is determined by multiplying (a) the difference between the December 31, 2012 closing price of our common stock and the applicable exercise price of each option, by (b) the number of unvested and accelerated options. |
| (2) | Vesting of outstanding RSUs may be accelerated under certain termination scenarios pursuant to the employment agreements as discussed above. The values of the accelerated RSUs and the RSUs awarded in 2012 were determined by multiplying the December 31, 2012 closing price of our common stock by the number of unvested and accelerated RSUs and the number of RSUs awarded in 2012 to be retained under each scenario. |
| (3) | Includes the value of the following benefits as of December 31, 2012, for each named executive officer, as applicable: outstanding, in-the-money vested stock options, the aggregate balance of the Nonqualified Defined Contribution Plan (as reflected on page 35), and the present value of the Supplemental Executive Retirement Plan (as reflected on page 36). These amounts do not include benefits under our ECAP or life insurance policies. In addition to the standard life insurance policy generally available to employees, Mr. Moffett and Mr. Adkerson each have an executive life insurance policy providing for a death benefit of $3.75 million and $1.5 million, respectively. |
| (4) | Generally, pursuant to the terms of the stock option agreements, upon termination of the executive’s employment as a result of death, disability or retirement, the unvested portion of any outstanding stock option that would have vested within one year of the date of termination will vest. Pursuant to the terms of the RSU agreements outstanding as of December 31, 2011, termination of the executive’s employment as a result of death, disability or retirement will result in acceleration of vesting of certain outstanding RSUs and the related amounts credited to the participant’s dividend equivalent account and all property distributions deposited in such account. With respect to the RSUs granted in February 2012, termination of the executive’s employment as a result of death, disability or retirement will not result in acceleration of vesting of outstanding RSUs awarded in 2012 and the related amounts credited to the 2012 participant’s dividend equivalent account and all property distributions deposited in such account. Instead, such 2012 grants will not be forfeited and will remain outstanding and vest on the regularly scheduled vesting date of February 15, 2015, provided the applicable performance condition is met. The full amount of RSUs granted in 2012 has been included in the table above. |
| (5) | Certain of the benefits described in the table would be achieved in the event of a change of control alone, and would not require a termination of the executive’s employment. In particular, pursuant to the terms of our stock incentive plans and the individual award agreements outstanding as of December 31, 2011, upon a change of control as defined in the plans, (a) all outstanding stock options would immediately vest and (b) all restrictions on outstanding RSUs would lapse. However, with respect to the stock options and RSUs granted in February 2012, the agreements provide for accelerated vesting of the award following a change |
39
Table of Contents
| of control only if the recipient also experiences an actual or constructive termination of employment within one year after the change of control. The amounts stated in the rows titled “Termination after Change of Control” assume the full vesting of options and RSUs granted in 2012. |
| (6) | Pursuant to the terms of the executive’s change of control agreement, the total payments may be subject to reduction if such payments result in the imposition of an excise tax under Section 280G of the Internal Revenue Code. |
| (7) | Mr. Arnold is entitled to certain severance benefits in the event of his termination without cause under the company’s Severance Plan, which is generally available to certain eligible employees. |
Director Compensation
We use a combination of cash and equity-based incentive compensation to attract and retain qualified candidates to serve on the board. In setting director compensation, we consider the significant amount of time directors dedicate in fulfilling their duties as directors as well as the skill-level required by the company to be an effective member of the board. The form and amount of director compensation is reviewed by our nominating and corporate governance committee, which makes recommendations to the full board.
Cash Compensation
Each non-management director and advisory director receives an annual fee of $75,000. Committee chairs receive an additional annual fee as follows: audit committee, $25,000; compensation committee, $20,000; and all other committees (including nominating and corporate governance committee and corporate responsibility committee), $15,000. Committee members, excluding the committee chairman, receive an additional annual fee as follows: audit committee, $12,500; compensation committee, $10,000; and all other committees (including nominating and corporate governance committee and corporate responsibility committee), $7,500. Each non-management director and each advisory director receives a fee of $3,000 for attending each board and committee meeting (for which he or she is a member) and is reimbursed for reasonable out-of-pocket expenses incurred in attending such meetings.
In addition, Messrs. Krulak, Lackey, Madonna and McCoy received a one-time fee of $200,000 and Mr. Allison (chairman) received a one-time fee of $250,000 in connection with their service in 2012 on the special committee of the board.
The compensation of each of Messrs. Moffett and Adkerson is reflected in the “2012 Summary Compensation Table” included in this Amendment.
Equity-Based Compensation
During 2012, non-management directors and advisory directors also received equity-based compensation under our Amended and Restated 2006 Stock Incentive Plan (the Plan), which was approved by our stockholders. The Plan authorizes our nominating and corporate governance committee to make equity grants, including options to acquire shares of our common stock and RSUs, to our non-management directors and advisory directors at its discretion. Under our current program, upon approval of our nominating and corporate governance committee, each non-management director and advisory director receives an annual grant of options to acquire 10,000 shares of our common stock and 2,000 RSUs on June 1 of each year. The options are granted at fair market value on the grant date, vest ratably over the first four anniversaries of the grant date and expire on the tenth anniversary of the grant date. The RSUs also vest ratably over the first four anniversaries of the grant date. Each RSU entitles the director to receive one share of our common stock upon vesting. Dividend equivalents are accrued on the RSUs on the same basis as dividends are paid on our common stock and include market rate interest. The dividend equivalents are only paid upon vesting of the RSUs. In addition, upon initial election to the board other than at an annual meeting, a director will receive a pro rata grant of options and RSUs. On June 1, 2012, each non-management director and advisory director was granted an option to purchase 10,000 shares of common stock with an exercise price of $32.07 and 2,000 RSUs.
40
Table of Contents
Non-management directors and advisory directors may elect to exchange all or a portion of their annual fee for an equivalent number of shares of our common stock on the payment date, based on the fair market value of our common stock on the date preceding the payment date. Non-management directors and advisory directors may also elect to defer all or a portion of their annual fee and meeting fees, and such deferred amounts will accrue interest at a rate equal to the prime commercial lending rate announced from time to time by JPMorgan Chase (compounded quarterly), and shall be paid out at such time or times as directed by the participant. See footnote (1) to the “2012 Director Compensation” table for details regarding participation in this program by our non-management directors.
Frozen and Terminated Retirement Plan
In April 2008, we revised our retirement plan for non-management directors who reach age 65 and are entitled to a retirement benefit based on the annual director fees. We froze the benefit under this plan for our existing directors and terminated the plan for any future directors. Under the plan, as revised, an eligible current director is entitled to an annual benefit up to a maximum of $40,000 (the prior level of annual director fees), depending on the number of years the retiree served as a non-management director for us or our predecessors. The percentage of the maximum annual benefit, which is at least 50% but not greater than 100%, will depend on the number of years the retiree served as a non-management director for us or our predecessors. The benefit is payable from the date of retirement until the retiree’s death. Each eligible director who was also a director of Freeport-McMoRan Inc., our former parent, and who did not retire from that board, will receive upon retirement from the board an additional annual benefit of $20,000, which is also payable from the date of retirement until the retiree’s death.
The chart below identifies the current non-management directors who would have been eligible to participate in the retirement plan as of December 31, 2012, and summarizes the projected benefit to each assuming the director had retired from the board on such date:
| Name of Eligible Director |
Percent of Annual Benefit (Maximum $40,000) to be Paid Annually Following Retirement |
Eligible for Additional $20,000 Benefit | ||
| Robert J. Allison, Jr. |
100% | No | ||
| Robert A. Day |
100% | Yes | ||
| Gerald J. Ford |
100% | No | ||
| H. Devon Graham, Jr. |
100% | No | ||
| Charles C. Krulak |
50% | No | ||
| Bobby Lee Lackey |
100% | Yes | ||
| Jon C. Madonna |
50% | No | ||
| B. M. Rankin, Jr. |
100% | No(1) |
| (1) | Mr. Rankin previously retired from the company’s former parent and is currently receiving the additional $20,000 retirement benefit from a successor entity. |
41
Table of Contents
2012 Director Compensation
The table below summarizes the total compensation paid to or earned by our non-management directors during 2012.
2012 Director Compensation
| Name of Director |
Fees Earned or Paid in Cash (1) |
Stock Awards (2) |
Option Awards (3) |
Change in Pension Value and Nonqualified Deferred Compensation Earnings (4) |
All Other Compensation (5) |
Total | ||||||||||||||||||
| Robert J. Allison, Jr. |
$ | 405,500 | $ | 64,140 | $ | 108,700 | — | $ | 3,021 | $ | 581,361 | |||||||||||||
| Robert A. Day |
143,500 | 64,140 | 108,700 | $ | 3,618 | 489 | 320,447 | |||||||||||||||||
| Gerald J. Ford |
131,000 | 64,140 | 108,700 | 3,900 | 489 | 308,229 | ||||||||||||||||||
| H. Devon Graham, Jr. |
152,500 | 64,140 | 108,700 | — | 3,658 | 328,998 | ||||||||||||||||||
| Charles C. Krulak |
331,500 | 64,140 | 108,700 | — | 2,369 | 506,709 | ||||||||||||||||||
| Bobby Lee Lackey |
334,500 | 64,140 | 108,700 | — | 925 | 508,265 | ||||||||||||||||||
| Jon C. Madonna |
317,500 | 64,140 | 108,700 | 528 | 1,799 | 492,667 | ||||||||||||||||||
| Dustan E. McCoy |
303,500 | 64,140 | 108,700 | 21,935 | 1,448 | 499,723 | ||||||||||||||||||
| B. M. Rankin, Jr. |
103,500 | 64,140 | 108,700 | — | 906,217 | 1,182,557 | ||||||||||||||||||
| Stephen H. Siegele |
141,500 | 64,140 | 108,700 | 52,875 | 489 | 367,704 | ||||||||||||||||||
| (1) | Each of Messrs. Allison, Ford and Siegele elected to receive an equivalent number of shares of our common stock in lieu of 100% of his annual fee. The amounts reflected in this column include the fees used to purchase shares of our common stock by the directors. |
| (2) | On June 1, 2012, each non-management director was granted 2,000 RSUs. Amounts reflect the aggregate grant date fair value of the RSUs, which are valued on the date of grant at the closing sale price per share of our common stock. |
| (3) | On June 1, 2012, each non-management director was granted options to purchase an aggregate of 10,000 shares of our common stock. Amounts reflect the aggregate grant date fair value of the options. The options that were granted had a grant date fair value of $10.87 per option using the Black-Scholes-Merton option valuation model. For information relating to the assumptions made by us in valuing the option awards made to our non-management directors in fiscal year 2012, refer to Notes 1 and 11 of our financial statements in our annual report on Form 10-K for the year ended December 31, 2012. |
The following table sets forth the total number of outstanding RSUs, stock options and stock appreciation rights (SARs) held by each non-management director as of December 31, 2012:
| Name of Director |
RSUs | Options | SARs(†) | |||||||||
| Robert J. Allison, Jr. |
14,500 | 120,000 | — | |||||||||
| Robert A. Day |
6,500 | 180,000 | 13,112 | |||||||||
| Gerald J. Ford |
6,500 | 180,000 | 13,112 | |||||||||
| H. Devon Graham, Jr. |
22,500 | 85,000 | — | |||||||||
| Charles C. Krulak |
10,500 | 110,000 | — | |||||||||
| Bobby Lee Lackey |
10,500 | 65,000 | — | |||||||||
| Jon C. Madonna |
12,500 | 100,000 | — | |||||||||
| Dustan E. McCoy |
13,000 | 110,000 | — | |||||||||
| B. M. Rankin, Jr. |
6,500 | 80,000 | — | |||||||||
| Stephen H. Siegele |
6,500 | 120,000 | — | |||||||||
| (†) | Reflects SARs awarded under our former director compensation program. |
42
Table of Contents
| (4) | Amounts reflect the aggregate change in the actuarial present value of each director’s accumulated benefit under the revised retirement plan as calculated in accordance with Item 402 of Regulation S-K. Messrs. Allison, Graham, Krulak, Lackey and Rankin had a negative change in the actuarial present value of the pension benefit in 2012 in the amounts of $3,960, $7,412, $160, $7,548 and $8,808, respectively, due to changes in the discount rate and/or decreasing life expectancies when the director continues to provide services past the normal retirement date age of 65. As noted above, the director retirement plan has been terminated for any future directors. |
| (5) | Includes (a) consulting fees received in connection with the consulting arrangements described under “Certain Transactions” below, (b) interest credited on dividend equivalents on unvested RSUs during 2012 and (c) the dollar value of life insurance premiums and the related tax reimbursement paid by the company pursuant to an arrangement assumed in connection with our acquisition of Phelps Dodge Corporation as follows: |
| Name of Director |
Consulting Fees |
Interest Credited on Dividend Equivalents |
Life Insurance Premium and Tax Paid |
|||||||||
| Robert J. Allison, Jr. |
— | $ | 3,021 | — | ||||||||
| Robert A. Day |
— | 489 | — | |||||||||
| Gerald J. Ford |
— | 489 | — | |||||||||
| H. Devon Graham, Jr. |
— | 3,658 | — | |||||||||
| Charles C. Krulak |
— | 925 | $ | 1,444 | ||||||||
| Bobby Lee Lackey |
— | 925 | — | |||||||||
| Jon C. Madonna |
— | 1,086 | 713 | |||||||||
| Dustan E. McCoy |
— | 1,099 | 349 | |||||||||
| B. M. Rankin, Jr. |
$ | 905,728 | 489 | — | ||||||||
| Stephen H. Siegele |
— | 489 | — | |||||||||
Payments made under the matching gifts program are no longer reportable as a perquisite because effective January 1, 2012, the limit on the annual amount of our matching gifts was increased to $40,000 for all directors, officers, employees, full time consultants and certain retirees; therefore, matching gifts are no longer reflected in the “All Other Compensation” column for any of our directors.
Compensation Committee Interlocks and Insider Participation
The current members of our compensation committee are Messrs. Allison, Graham, Krulak and Lackey. In 2012, none of our executive officers served as a member of the compensation committee of another entity, or as a director of another entity, one of whose executive officers served on our compensation committee.
Item 12. Security Ownership of Certain Beneficial Owners and Management and Related Stockholder Matters.
The information set forth under the heading “Equity Compensation Plan Information” of Item 12 of Part III of our Annual Report on Form 10-K for the fiscal year ended December 31, 2012 filed with the SEC on February 22, 2013, which is being amended hereby, is incorporated herein by reference.
Stock Ownership of Directors and Executive Officers
We believe that it is important for our directors and executive officers to align their interests with the long-term interests of our stockholders. We encourage stock accumulation through the grant of equity incentives to our directors and executive officers and through our stock ownership guidelines applicable to our directors and executive officers.
43
Table of Contents
The table below shows the amount of our common stock beneficially owned as of April 15, 2013, by (i) each of our current directors and our chief executive officer, our chief financial officer and our other executive officers (such officers being our named executive officers) serving during 2012 and (ii) all of our current directors and executive officers as a group. Unless otherwise indicated, all shares shown in the table below are held with sole voting and investment power.
| Name of Beneficial Owner |
Number of Shares Not Subject to Options |
Number of Shares Subject to Exercisable Options and Vesting of RSUs (1) |
Total Number of Shares Beneficially Owned (2) |
Percent of Class (3) |
||||||||||||
| Richard C. Adkerson (4) |
1,623,163 | 4,332,500 | 5,955,663 | * | ||||||||||||
| Robert J. Allison, Jr. (5) |
175,560 | 105,500 | 281,060 | * | ||||||||||||
| Michael J. Arnold (6) |
189,001 | 1,145,000 | 1,334,001 | * | ||||||||||||
| Robert A. Day (7) |
1,337,500 | 165,500 | 1,503,000 | * | ||||||||||||
| Gerald J. Ford (8) |
125,264 | 165,500 | 290,764 | * | ||||||||||||
| H. Devon Graham, Jr. |
13,500 | 70,500 | 84,000 | * | ||||||||||||
| Charles C. Krulak |
11,500 | 95,500 | 107,000 | * | ||||||||||||
| Bobby Lee Lackey |
22,342 | 50,500 | 72,842 | * | ||||||||||||
| Jon C. Madonna |
16,180 | 85,500 | 101,680 | * | ||||||||||||
| Dustan E. McCoy |
11,000 | 95,500 | 106,500 | * | ||||||||||||
| James R. Moffett (9) |
3,130,989 | 2,082,500 | 5,213,489 | * | ||||||||||||
| Kathleen L. Quirk |
299,932 | 2,074,000 | 2,373,932 | * | ||||||||||||
| B. M. Rankin, Jr. (10) |
709,860 | 65,500 | 775,360 | * | ||||||||||||
| Stephen H. Siegele |
236,384 | 105,500 | 341,884 | * | ||||||||||||
| Directors and executive officers as a group (14 persons) |
7,902,175 | 10,609,000 | 18,541,175 | 1.9% | ||||||||||||
| * | Ownership is less than 1%. |
| (1) | Reflects our common stock that could be acquired within sixty days of April 15, 2013 upon the exercise of options, vesting of RSUs and the termination of deferrals on previously vested RSUs. |
| (2) | In addition to the RSUs included in “Number of Shares Subject to Exercisable Options and Vesting of RSUs,” each beneficial owner holds the following unvested RSUs, which are not included in the table above. |
44
Table of Contents
| Name of Beneficial Owner |
Number of RSUs | |||
| Richard C. Adkerson |
453,537 | |||
| Robert J. Allison, Jr. |
11,500 | |||
| Michael J. Arnold |
90,195 | |||
| Robert A. Day |
3,500 | |||
| Gerald J. Ford |
3,500 | |||
| H. Devon Graham, Jr. |
19,500 | |||
| Charles C. Krulak |
7,500 | |||
| Bobby Lee Lackey |
7,500 | |||
| Jon C. Madonna |
9,500 | |||
| Dustan E. McCoy |
8,000 | (†) | ||
| James R. Moffett |
453,537 | |||
| Kathleen L. Quirk |
148,471 | |||
| B. M. Rankin, Jr. |
3,500 | |||
| Stephen H. Siegele |
3,500 | |||
| (†) | Reflects January 1, 2013 payout of 2,000 previously deferred RSUs pursuant to his deferral election. |
For more information regarding the RSUs, see the sections titled “Director Compensation,” “Compensation Discussion and Analysis” and “Executive Officer Compensation Tables - Grants of Plan-Based Awards in Fiscal Year 2012.”
| (3) | Based on 949,742,416 shares of our common stock outstanding as of April 15, 2013. |
| (4) | Includes (a) 20,330 shares of our common stock held in his individual retirement account (IRA), (b) 552,844 shares of our common stock held in a trust and (c) 131,686 shares held in a foundation with respect to which Mr. Adkerson, as a member of the board of trustees, shares voting and investment power, but as to which he disclaims beneficial ownership. Mr. Adkerson has pledged 862,425 shares of our common stock to secure a line of credit. |
| (5) | Includes 59,244 shares of our common stock held by Mr. Allison’s spouse. |
| (6) | Includes 5,331 shares of our common stock held in our ECAP. |
| (7) | Includes 42,000 shares of our common stock held by his spouse, as to which he disclaims beneficial ownership. Mr. Day has pledged 1,272,000 shares of our common stock to secure a line of credit. |
| (8) | Includes 20,000 shares of our common stock held as trustee of a trust. |
| (9) | Includes (a) 3,066,880 shares of our common stock held by a limited liability company with respect to which Mr. Moffett, as a member, shares voting and investment power, (b) 56,557 shares of our common stock held in our ECAP and (c) 7,552 shares of our common stock held by his spouse, as to which he disclaims beneficial ownership. The limited liability company through which Mr. Moffett owns his shares has entered into three forward sale contracts with a securities broker pursuant to which the limited liability company agreed to sell: (a) 450,000 shares of common stock on March 4, 2014 and 300,000 shares of common stock on November 3, 2014, with the sale price to be determined and paid on the respective maturity dates, and (b) up to 1,500,000 shares on November 3, 2014, with exact number of shares to be delivered on the maturity date determined by the closing price on such date, and in exchange for which the limited liability company received a payment upon execution of the contract. Under all three contracts, the limited liability company may elect to settle the contract in cash and retain ownership of the shares. The limited liability company has pledged a total of 2,250,000 shares in part to secure its obligations under these contracts but continues to hold beneficial ownership and voting power with respect to these shares, and the right to receive quarterly dividend payments of up to $0.3125 per share with respect to 450,000 of the shares. |
45
Table of Contents
| (10) | Includes 585,360 shares held by a limited partnership in which Mr. Rankin is the sole shareholder of the sole general partner. |
Stock Ownership of Certain Beneficial Owners
Based on filings with the SEC, the table below shows the beneficial owner of more than 5% of our outstanding shares of common stock as of December 31, 2012. Unless otherwise indicated, all information is presented as of December 31, 2012, and all shares beneficially owned are held with sole voting and investment power.
| Name and Address of Beneficial Owner |
Number of Shares Beneficially Owned |
Percent of Outstanding Shares (1) |
||||||
| BlackRock, Inc. |
84,022,739 | (2) | 8.9% | |||||
| 40 East 52nd Street |
||||||||
| New York, NY 10022 |
||||||||
| (1) | Based on 949,742,416 shares of our common stock outstanding as of April 15, 2013. |
| (2) | Based on a Schedule 13G/A filed with the SEC on February 1, 2013, by BlackRock, Inc. on its own behalf and on behalf of its subsidiaries identified therein. |
Item 13. Certain Relationships and Related Transactions, and Director Independence.
Certain Transactions
Director Transactions
Our Corporate Governance Guidelines provide that any transaction that would require disclosure under Item 404(a) of Regulation S-K of the rules and regulations of the SEC, with respect to a director or executive officer, must be reviewed and approved, or ratified, annually by the board. Any such related party transactions will only be approved or ratified if the board determines that such transaction will not impair the involved person’s service to, and exercise of judgment on behalf of, the company, or otherwise create a conflict of interest that would be detrimental to the company. The director transaction described below has been reviewed and approved or ratified by the board.
B. M. Rankin, Jr. and FM Services Company are parties to an agreement under which Mr. Rankin renders business consulting services to us and McMoRan relating to finance, accounting, guidance and advice on public policy matters and business development. FM Services Company provides Mr. Rankin compensation, medical coverage and reimbursement for taxes in connection with those medical benefits. In 2012, FM Services Company paid Mr. Rankin $490,000 ($389,991 of which was allocated to us) pursuant to this agreement. During 2012, the cost to FM Services Company (all of which was allocated to us) for Mr. Rankin’s personal use of company facilities was $24,300, medical expenses was $23,327, and reimbursement for a portion of his office rent and utilities and for executive administrative and support services was $37,114. In addition, during 2012 the aggregate incremental cost to FM Services Company (all of which was allocated to us) for Mr. Rankin’s personal use of fractionally owned company aircraft, which includes the hourly operating rate, fuel costs and excise taxes, was $430,996. The aggregate incremental cost does not include the lost tax deduction for expenses that exceeded the amounts reported as income for Mr. Rankin, which for fiscal year 2012 was approximately $81,915. Accordingly, the total received by Mr. Rankin during 2012 pursuant to this agreement was $1,005,737 of which $905,728 was allocated to us.
46
Table of Contents
Board and Committee Independence
On the basis of information solicited from each director, and upon the advice and recommendation of the nominating and corporate governance committee, the board has affirmatively determined that each of Messrs. Allison, Day, Ford, Graham, Krulak, Lackey, Madonna, McCoy and Siegele has no material relationship with the company and is independent within the meaning of our corporate governance guidelines, which comply with the applicable NYSE listing standards and SEC rules. In making this determination, the nominating and corporate governance committee, with assistance from the company’s legal counsel, evaluated responses to a questionnaire completed annually by each director regarding relationships and possible conflicts of interest between each director, the company and management. In its review of director independence, the committee considered the commercial, industrial, banking, consulting, legal, accounting, charitable, and familial relationships any director may have with the company or management. The nominating and corporate governance committee recommended to the board that the nine directors named above be considered independent, which the board approved.
The board also has determined that each of the members of the audit, compensation, and nominating and corporate governance committees has no material relationship with the company and satisfies the independence criteria (including the enhanced criteria with respect to members of the audit committee and compensation committee) set forth in the applicable NYSE listing standards and SEC rules.
Item 14. Principal Accounting Fees and Services.
Fees and Related Disclosures for Accounting Services
The following table discloses the fees for professional services provided by Ernst & Young in each of the last two fiscal years:
| 2012 | 2011 | |||||||
| Audit Fees (1) |
$ | 9,206,000 | $ | 9,585,000 | ||||
| Audit-Related Fees (2) |
106,000 | 83,000 | ||||||
| Tax Fees (3) |
384,000 | 203,000 | ||||||
| All Other Fees |
— | — | ||||||
| (1) | Audit Fees were primarily for professional services rendered for the audits of the consolidated financial statements and internal controls over financial reporting in compliance with Section 404 of the Sarbanes-Oxley Act of 2002, the review of documents filed with the SEC, consents, comfort letters and financial accounting and reporting consultations. |
| (2) | Audit-Related Fees were primarily for professional services rendered for other attest and due diligence services. |
| (3) | Tax Fees were for professional services related to general tax consultation, transfer pricing, tax compliance and international tax matters. |
The audit committee has determined that the provision of the services described above is compatible with maintaining the independence of our independent registered public accounting firm.
Pre-Approval Policies and Procedures
The audit committee’s policy is to pre-approve all audit services, audit-related services and other services permitted by law provided by our independent registered public accounting firm. In accordance with that policy, the committee annually pre-approves a list of specific services and categories of services, including audit, audit-related and other services, for the upcoming or current fiscal year, subject to specified cost levels. Any service that is not included in the approved list of services must be separately pre-approved by the audit committee. In addition, if fees for any service exceed the amount that has been pre-approved, then payment of additional fees for such service must be specifically pre-approved by the audit committee; however, any proposed service that has an anticipated or additional cost of no more than $30,000 may be pre-approved by the chairman of the audit committee, provided that the total anticipated costs of all such projects pre-approved by the chairman during any fiscal quarter does not exceed $60,000.
47
Table of Contents
At each regularly-scheduled audit committee meeting, management updates the committee on the scope and anticipated cost of (1) any service pre-approved by the chairman since the last meeting of the committee and (2) the projected fees for each service or group of services being provided by our independent registered public accounting firm. Since the 2003 effective date of the SEC rules stating that an auditor is not independent of an audit client if the services it provides to the client are not appropriately approved, each service provided by our independent registered public accounting firm has been approved in advance by the audit committee, and none of those services required use of the de minimis exception to pre-approval contained in the SEC’s rules.
48
Table of Contents
Item 15. Exhibits, Financial Statement Schedules.
(a) Documents filed as a part of this Amendment.
1. Financial statements.
The following documents were previously filed as part of our Annual Report on Form 10-K for the fiscal year ended December 31, 2012 filed with the SEC on February 22, 2013, which is being amended hereby.
| • | Financial Statements and Supplementary Data. |
| • | Consolidated Statements of Income for the fiscal years ended December 31, 2012, 2011 and 2010. |
| • | Consolidated Statements of Comprehensive Income for the fiscal years ended December 31, 2012, 2011 and 2010. |
| • | Consolidated Statements of Cash Flows for the fiscal years ended December 31, 2012, 2011 and 2010. |
| • | Consolidated Balance Sheets as of December 31, 2012 and 2011. |
| • | Consolidated Statements of Equity as of December 31, 2012, 2011 and 2010. |
| • | Notes to Consolidated Financial Statements. |
2. Financial Statement Schedules.
All schedules have been omitted because the information is not required or not in amounts sufficient to require submission of the schedule, or because the information required is included in the consolidated financial statements and notes thereto previously filed as part of our Annual Report on Form 10-K for the fiscal year ended December 31, 2012 filed with the SEC on February 22, 2013, which is being amended hereby.
3. Exhibit Listing.
The Exhibit Index, which follows the signature page to this Amendment and is hereby incorporated by reference, sets forth a list of those exhibits filed herewith.
49
Table of Contents
Pursuant to the requirements of Section 13 of the Securities Exchange Act of 1934, the registrant has duly caused this report to be signed on its behalf by the undersigned, thereunto duly authorized, on April 23, 2013.
| Freeport-McMoRan Copper & Gold Inc. | ||
| By: | /s/ Richard C. Adkerson | |
| Richard C. Adkerson | ||
| President, Chief Executive Officer and Director | ||
Pursuant to the requirements of the Securities Exchange Act of 1934, this report has been signed by the following persons on behalf of the registrant in the capacities indicated on April 23, 2013.
| * |
Chairman of the Board | |
| James R. Moffett | ||
| * |
Vice Chairman of the Board | |
| B. M. Rankin, Jr. | ||
| /s/ Richard C. Adkerson |
President, Chief Executive Officer and Director | |
| Richard C. Adkerson | (Principal Executive Officer) | |
| /s/ Kathleen L. Quirk |
Executive Vice President, Chief Financial Officer and Treasurer | |
| Kathleen L. Quirk | (Principal Financial Officer) | |
| * |
Vice President and Controller - Financial Reporting | |
| C. Donald Whitmire, Jr. | (Principal Accounting Officer) | |
| * |
Director | |
| Robert J. Allison, Jr. | ||
| * |
Director | |
| Robert A. Day | ||
| * |
Director | |
| Gerald J. Ford | ||
| * |
Director | |
| H. Devon Graham, Jr. | ||
S-1
Table of Contents
| * |
Director | |
| Charles C. Krulak | ||
| * |
Director | |
| Bobby Lee Lackey | ||
| * |
Director | |
| Jon C. Madonna | ||
| * |
Director | |
| Dustan E. McCoy | ||
| * |
Director | |
| Stephen H. Siegele | ||
| * By: /s/ Richard C. Adkerson |
||
| Richard C. Adkerson | ||
| Attorney-in-Fact | ||
S-2
Table of Contents
FREEPORT-McMoRan COPPER & GOLD INC.
| Filed with | ||||||||||
| Exhibit | this Form | Incorporated by Reference | ||||||||
| Number |
Exhibit Title |
10-K/A | Form | File No. | Date Filed | |||||
| 2.1 |
Agreement and Plan of Merger dated as of November 18, 2006, by and among Freeport-McMoRan Copper & Gold Inc. (FCX), Phelps Dodge Corporation and Panther Acquisition Corporation. | 8-K | 333-139252 | 11/20/2006 | ||||||
| 2.2 |
Agreement and Plan of Merger by and among Plains Exploration & Production Company, Freeport-McMoRan Copper & Gold Inc. and IMONC LLC, dated as of December 5, 2012. | 8-K | 001-11307-01 | 12/6/2012 | ||||||
| 2.3 |
Agreement and Plan of Merger by and among McMoRan Exploration Co., Freeport-McMoRan Copper & Gold Inc. and INAVN Corp., dated as of December 5, 2012. | 8-K | 001-11307-01 | 12/6/2012 | ||||||
| 3.1 |
Composite Certificate of Incorporation of FCX. | 10-Q | 001-11307-01 | 8/6/2010 | ||||||
| 3.2 |
Amended and Restated By-Laws of FCX, as amended through April 17, 2013. | 8-K | 001-11307-01 | 4/17/2013 | ||||||
| 4.1 |
Indenture dated as of March 19, 2007, from FCX to The Bank of New York, as Trustee, with respect to the 8.375% Senior Notes due 2017, and the Senior Floating Rate Notes due 2015. | 8-K | 001-11307-01 | 3/19/2007 | ||||||
| 4.2 |
Indenture dated as of February 13, 2012 between Freeport-McMoRan Copper & Gold Inc. and U.S. Bank National Association, as trustee. | 8-K | 001-11307-01 | 2/13/2012 | ||||||
| 4.3 |
First Supplemental Indenture dated as of February 13, 2012 between Freeport-McMoRan Copper & Gold Inc. and U.S. Bank National Association, as trustee. | 8-K | 001-11307-01 | 2/13/2012 | ||||||
| 4.4 |
Second Supplemental Indenture dated as of February 13, 2012 between Freeport-McMoRan Copper & Gold Inc. and U.S. Bank National Association, as trustee. | 8-K | 001-11307-01 | 2/13/2012 | ||||||
| 4.5 |
Third Supplemental Indenture dated as of February 13, 2012 between Freeport-McMoRan Copper & Gold Inc. and U.S. Bank National Association, as trustee. | 8-K | 001-11307-01 | 2/13/2012 | ||||||
| 10.1 |
Credit Agreement dated as of March 4, 2011, among FCX, the Lenders party thereto, the Issuing Banks party thereto, JP Morgan Chase Bank, N.A. as Administrative Agent and Bank of America, N.A., as Syndication Agent. | 10-Q | 001-11307-01 | 5/6/2011 | ||||||
| 10.2 |
Contract of Work dated December 30, 1991, between the Government of the Republic of Indonesia and PT Freeport Indonesia. | S-3 | 333-72760 | 11/5/2001 | ||||||
| 10.3 |
Contract of Work dated August 15, 1994, between the Government of the Republic of Indonesia and PT Irja Eastern Minerals Corporation. | S-3 | 333-72760 | 11/5/2001 | ||||||
| 10.4 |
Participation Agreement dated as of October 11, 1996, between PT Freeport Indonesia and P.T. RTZ-CRA Indonesia (a subsidiary of Rio Tinto PLC) with respect to a certain contract of work. | S-3 | 333-72760 | 11/5/2001 | ||||||
E-1
Table of Contents
FREEPORT-McMoRan COPPER & GOLD INC.
EXHIBIT INDEX
| Filed with | ||||||||||
| Exhibit | this Form | Incorporated by Reference | ||||||||
| Number |
Exhibit Title |
10-K/A | Form | File No. | Date Filed | |||||
| 10.5 |
Agreement dated as of October 11, 1996, to Amend and Restate Trust Agreement among PT Freeport Indonesia, FCX, the RTZ Corporation PLC (now Rio Tinto PLC), P.T. RTZ-CRA Indonesia, RTZ Indonesian Finance Limited and First Trust of New York, National Association, and The Chase Manhattan Bank, as Administrative Agent, JAA Security Agent and Security Agent. | 8-K | 001-09916 | 11/13/1996 | ||||||
| 10.6 |
Concentrate Purchase and Sales Agreement dated effective December 11, 1996, between PT Freeport Indonesia and PT Smelting. | S-3 | 333-72760 | 11/5/2001 | ||||||
| 10.7 |
Second Amended and Restated Joint Venture and Shareholders’ Agreement dated as of December 11, 1996, among Mitsubishi Materials Corporation, Nippon Mining and Metals Company, Limited and PT Freeport Indonesia. | S-3 | 333-72760 | 11/5/2001 | ||||||
| 10.8 |
Participation Agreement, dated as of March 16, 2005, among Phelps Dodge Corporation, Cyprus Amax Minerals Company, a Delaware corporation, Cyprus Metals Company, a Delaware corporation, Cyprus Climax Metals Company, a Delaware corporation, Sumitomo Corporation, a Japanese corporation, Summit Global Management, B.V., a Dutch corporation, Sumitomo Metal Mining Co., Ltd., a Japanese corporation, Compañia de Minas Buenaventura S.A.A., a Peruvian sociedad anonima abierta, and Sociedad Minera Cerro Verde S.A.A., a Peruvian sociedad anonima abierta. | 8-K | 001-00082 | 3/22/2005 | ||||||
| 10.9 |
Shareholders Agreement, dated as of June 1, 2005, among Phelps Dodge Corporation, Cyprus Climax Metals Company, a Delaware corporation, Sumitomo Corporation, a Japanese corporation, Sumitomo Metal Mining Co., Ltd., a Japanese corporation, Summit Global Management B.V., a Dutch corporation, SMM Cerro Verde Netherlands, B.V., a Dutch corporation, Compañia de Minas Buenaventura S.A.A., a Peruvian sociedad anonima abierta, and Sociedad Minera Cerro Verde S.A.A., a Peruvian sociedad anonima abierta. | 8-K | 001-00082 | 6/7/2005 | ||||||
| 10.10 |
Master Agreement and Plan of Merger among Columbian Chemicals Company, Columbian Chemicals Acquisition LLC, Columbian Chemicals Merger Sub, Inc. and Phelps Dodge Corporation, dated November 15, 2005. | 10-K | 001-00082 | 2/27/2006 | ||||||
| 10.11 |
Reclamation and Remediation Trust Agreement between Phelps Dodge Corporation and Wells Fargo Delaware Trust Company, dated December 22, 2005. | 10-K | 001-00082 | 2/27/2006 | ||||||
| 10.12 |
Amended and Restated Mining Convention dated as of September 28, 2005, among the Democratic Republic of Congo, La Générale des Carrières et des Mines, Lundin Holdings Ltd. (now TF Holdings Limited) and Tenke Fungurume Mining S.A.R.L. | 8-K | 001-11307-01 | 9/2/2008 | ||||||
E-2
Table of Contents
FREEPORT-McMoRan COPPER & GOLD INC.
EXHIBIT INDEX
| Filed with | ||||||||||
| Exhibit | this Form | Incorporated by Reference | ||||||||
| Number |
Exhibit Title |
10-K/A | Form | File No. | Date Filed | |||||
| 10.13 |
Addendum No. 1 to the Amended and Restated Mining Convention dated as of September 28, 2005, among the Democratic Republic of Congo, La Générale des Carrières et des Mines, TF Holdings Limited and Tenke Fungurume Mining S.A.R.L., dated as of December 11, 2010 | 10-Q | 001-11307-01 | 5/6/2011 | ||||||
| 10.14 |
Amended and Restated Shareholders Agreement dated as of September 28, 2005, by and between La Générale des Carrières et des Mines and Lundin Holdings Ltd. (now TF Holdings Limited) and its subsidiaries. | 8-K | 001-11307-01 | 9/2/2008 | ||||||
| 10.15 |
Addendum No. 1 to the Amended and Restated Shareholders Agreement dated as of September 28, 2005, among La Générale des Carrières et des Mines and TF Holdings Limited, Chui Ltd., Faru Ltd., Mboko Ltd., Tembo Ltd., and Tenke Fungurume Mining S.A.R.L., dated as of December 11, 2010. | 10-Q | 001-11307-01 | 5/6/2011 | ||||||
| 10.16 |
Stock Purchase Agreement dated September 19, 2010, by and among Freeport-McMoRan Copper & Gold Inc., Freeport-McMoRan Preferred LLC and McMoRan Exploration Co. | 10-Q | 001-11307-01 | 11/5/2010 | ||||||
| 10.17 |
Registration Rights Agreement by and between Freeport-McMoRan Preferred LLC and McMoRan Exploration Co. | 8-K | 001-11307-01 | 12/30/2010 | ||||||
| 10.18 |
Stockholder Agreement by and among McMoRan Exploration Co., Freeport-McMoRan Copper & Gold Inc. and Freeport-McMoRan Preferred LLC. | 8-K | 001-11307-01 | 12/30/2010 | ||||||
| 10.19 |
Term Loan Agreement dated as of February 14, 2013, among Freeport-McMoRan Copper & Gold Inc., JPMorgan Chase Bank, N.A., as administrative agent, Bank of America, N.A., as syndication agent, HSBC Bank USA, National Association, Mizuho Corporate Bank, Ltd., Sumitomo Mitsui Banking Corporation, The Bank of Nova Scotia and The Bank of Tokyo-Mitsubishi UFJ, Ltd., as co-documentation agents, and each of the lenders party thereto. Upon consummation of the acquisition of Plains Exploration & Production Company (PXP), the PXP surviving entity, will join the Term Loan as a borrower thereunder. | 8-K | 001-11307-01 | 2/15/2013 | ||||||
E-3
Table of Contents
FREEPORT-McMoRan COPPER & GOLD INC.
EXHIBIT INDEX
| Filed with | ||||||||||
| Exhibit | this Form | Incorporated by Reference | ||||||||
| Number |
Exhibit Title |
10-K/A | Form | File No. | Date Filed | |||||
| 10.20 |
Revolving Credit Agreement dated as of February 14, 2013, among Freeport-McMoRan Copper & Gold Inc., PT Freeport Indonesia, JPMorgan Chase Bank, N.A., as administrative agent and the swingline lender, Bank of America, N.A., as syndication agent, BNP Paribas, Citibank, N.A., HSBC Bank USA, National Association, Muzho Corporate Bank, Ltd., Sumitomo Mitsui Banking Corporation, The Bank of Nova Scotia and The Bank of Tokyo-Mitsubishi UFJ, Ltd., as co-documentation agents, and each of the lenders and issuing banks party thereto. Upon consummation of the acquisition of Plains Exploration & Production Company (PXP), the PXP surviving entity, will join the Revolving Credit Facility as a borrower thereunder. | 8-K | 001-11307-01 | 2/15/2013 | ||||||
| 10.21 |
Voting and Support Agreement, dated as of December 5, 2012, by and between Plains Exploration & Production Company, Freeport-McMoRan Copper & Gold Inc. and McMoRan Exploration Co. | 8-K | 001-11307-01 | 12/6/2012 | ||||||
| 10.22 |
Letter Agreement, dated as of December 5, 2012, by and among James C. Flores, Plains Exploration & Production Company and Freeport-McMoRan Copper & Gold Inc. | 8-K | 001-11307-01 | 12/6/2012 | ||||||
| 10.23 |
Letter Agreement, dated as of December 5, 2012, by and among Doss R. Bourgeois, Plains Exploration & Production Company and Freeport-McMoRan Copper & Gold Inc. | 8-K | 001-11307-01 | 12/6/2012 | ||||||
| 10.24 |
Letter Agreement, dated as of December 5, 2012, by and among Winston M. Talbert, Plains Exploration & Production Company and Freeport-McMoRan Copper & Gold Inc. | 8-K | 001-11307-01 | 12/6/2012 | ||||||
| 10.25 |
Letter Agreement, dated as of December 5, 2012, by and among John F. Wombwell, Plains Exploration & Production Company and Freeport-McMoRan Copper & Gold Inc. | 8-K | 001-11307-01 | 12/6/2012 | ||||||
| 10.26* |
FCX Director Compensation. | 10-Q | 001-11307-01 | 5/6/2011 | ||||||
| 10.27* |
Amended and Restated Agreement for Consulting Services between FMS and B. M. Rankin, Jr. effective as of January 1, 2010. | 10-K | 001-11307-01 | 2/26/2010 | ||||||
| 10.28* |
Amended and Restated Executive Employment Agreement dated effective as of December 2, 2008, between FCX and James R. Moffett. | 10-K | 001-11307-01 | 2/26/2009 | ||||||
| 10.29* |
Amended and Restated Change of Control Agreement dated effective as of December 2, 2008, between FCX and James R. Moffett. | 10-K | 001-11307-01 | 2/26/2009 | ||||||
| 10.31* |
Amended and Restated Executive Employment Agreement dated effective as of December 2, 2008, between FCX and Richard C. Adkerson. | 10-K | 001-11307-01 | 2/26/2009 | ||||||
E-4
Table of Contents
FREEPORT-McMoRan COPPER & GOLD INC.
EXHIBIT INDEX
| Filed with | ||||||||||||||||
| Exhibit | this Form | Incorporated by Reference | ||||||||||||||
| Number |
Exhibit Title |
10-K/A | Form | File No. | Date Filed | |||||||||||
| 10.32* |
Amendment to Amended and Restated Executive Employment Agreement dated December 2, 2008, by and between FCX and Richard C. Adkerson, dated April 27, 2011. | 8-K | 001-11307-01 | 4/29/2011 | ||||||||||||
| 10.33* |
Amended and Restated Executive Employment Agreement dated effective as of December 2, 2008, between FCX and Kathleen L. Quirk. | 10-K | 001-11307-01 | 2/26/2009 | ||||||||||||
| 10.34* |
Amendment to Amended and Restated Executive Employment Agreement dated December 2, 2008, by and between FCX and Kathleen L. Quirk, dated April 27, 2011. | 8-K | 001-11307-01 | 4/29/2011 | ||||||||||||
| 10.35* |
FCX Executive Services Program | 10-K | 001-11307-01 | 2/27/2012 | ||||||||||||
| 10.36* |
FCX Supplemental Executive Retirement Plan, as amended and restated. | 8-K | 001-11307-01 | 2/5/2007 | ||||||||||||
| 10.37* |
FCX Supplemental Executive Capital Accumulation Plan. | 10-Q | 001-11307-01 | 5/12/2008 | ||||||||||||
| 10.38* |
FCX Supplemental Executive Capital Accumulation Plan Amendment One. | 10-Q | 001-11307-01 | 5/12/2008 | ||||||||||||
| 10.39* |
FCX Supplemental Executive Capital Accumulation Plan Amendment Two. | 10-K | 001-11307-01 | 2/26/2009 | ||||||||||||
| 10.40* |
FCX 2005 Supplemental Executive Capital Accumulation Plan. | 10-K | 001-11307-01 | 2/26/2009 | ||||||||||||
| 10.41* |
FCX 2005 Supplemental Executive Capital Accumulation Plan Amendment One. | 10-K | 001-11307-01 | 2/26/2010 | ||||||||||||
| 10.42* |
FCX 1995 Stock Option Plan for Non-Employee Directors, as amended and restated. | 10-Q | 001-11307-01 | 5/10/2007 | ||||||||||||
| 10.43* |
FCX Amended and Restated 1999 Stock Incentive Plan, as amended and restated. | 10-Q | 001-11307-01 | 5/10/2007 | ||||||||||||
| 10.44* |
FCX 2003 Stock Incentive Plan, as amended and restated. | 10-Q | 001-11307-01 | 5/10/2007 | ||||||||||||
| 10.45* |
Form of Amendment No. 1 to Notice of Grant of Nonqualified Stock Options and Stock Appreciation Rights under the 2004 Director Compensation Plan. | 8-K | 001-11307-01 | 5/5/2006 | ||||||||||||
| 10.46* |
FCX 2004 Director Compensation Plan, as amended and restated. | 10-Q | 001-11307-01 | 8/6/2010 | ||||||||||||
| 10.47* |
FCX 2005 Annual Incentive Plan, as amended and restated. | 10-K | 001-11307-01 | 2/26/2009 | ||||||||||||
| 10.48* |
FCX Amended and Restated 2006 Stock Incentive Plan. | 8-K | 001-11307-01 | 6/14/2010 | ||||||||||||
| 10.49* |
Form of Notice of Grant of Nonqualified Stock Options for grants under the FCX 1999 Stock Incentive Plan, the 2003 Stock Incentive Plan and the 2006 Stock Incentive Plan. | 10-K | 001-11307-01 | 2/29/2008 | ||||||||||||
| 10.50* |
Form of Notice of Grant of Restricted Stock Units for grants under the FCX 1999 Stock Incentive Plan, the 2003 Stock Incentive Plan and the 2006 Stock Incentive Plan. | 10-K | 001-11307-01 | 2/26/2010 | ||||||||||||
| 10.51* |
Form of Notice of Grant of Nonqualified Stock Options and Restricted Stock Units under the 2006 Stock Incentive Plan (for grants made to non-management directors and advisory directors). | 8-K | 001-11307-01 | 6/14/2010 | ||||||||||||
E-5
Table of Contents
FREEPORT-McMoRan COPPER & GOLD INC.
EXHIBIT INDEX
| Filed with | ||||||||||
| Exhibit | this Form | Incorporated by Reference | ||||||||
| Number |
Exhibit Title |
10-K/A | Form | File No. | Date Filed | |||||
| 10.52* |
Form of Performance-Based Restricted Stock Unit Agreement for grants under the FCX 1999 Stock Incentive Plan, the 2003 Stock Incentive Plan and the 2006 Stock Incentive Plan, (Form used for awards granted prior to 2010). | 10-K | 001-11307-01 | 2/29/2008 | ||||||
| 10.53* |
Form of Notice of Grant of Performance-Based Restricted Stock Units for grants under the FCX 2003 Stock Incentive Plan and the 2006 Stock Incentive Plan. | 8-K | 001-11307-01 | 2/5/2010 | ||||||
| 10.54* |
Form of Restricted Stock Unit Agreement (form used in connection with participant elections) for grants under the FCX 1999 Stock Incentive Plan, the 2003 Stock Incentive Plan and the 2006 Stock Incentive Plan. | 10-K | 001-11307-01 | 2/29/2008 | ||||||
| 10.55* |
Form of Performance-Based Restricted Stock Unit Agreement (form used in connection with participant elections) for grants under the FCX 1999 Stock Incentive Plan, the 2003 Stock Incentive Plan and the 2006 Stock Incentive Plan. | 10-K | 001-11307-01 | 2/29/2008 | ||||||
| 10.56* |
FCX 2009 Annual Incentive Plan | 8-K | 001-11307-01 | 6/17/2009 | ||||||
| 10.57* |
Form of Nonqualified Stock Options Grant Agreement (effective February 2012). | 10-K | 001-11307-01 | 2/27/2012 | ||||||
| 10.58* |
Form of Restricted Stock Unit Agreement (effective February 2012). | 10-K | 001-11307-01 | 2/27/2012 | ||||||
| 10.59* |
Form of Performance-Based Restricted Stock Unit Agreement (effective February 2012). | 10-K | 001-11307-01 | 2/27/2012 | ||||||
| 12.1† |
FCX Computation of Ratio of Earnings to Fixed Charges. | 10-K | 001-11307-01 | 2/22/2013 | ||||||
| 14.1 |
FCX Principles of Business Conduct. | 10-K | 001-11307-01 | 2/29/2008 | ||||||
| 21.1† |
Subsidiaries of FCX. | 10-K | 001-11307-01 | 2/22/2013 | ||||||
| 23.1† |
Consent of Ernst & Young LLP. | 10-K | 001-11307-01 | 2/22/2013 | ||||||
| 24.1† |
Certified resolution of the Board of Directors of FCX authorizing this report to be signed on behalf of any officer or director pursuant to a Power of Attorney. | 10-K | 001-11307-01 | 2/22/2013 | ||||||
| 24.2† |
Powers of Attorney pursuant to which this report has been signed on behalf of certain officers and directors of FCX. | 10-K | 001-11307-01 | 2/22/2013 | ||||||
| 31.1 |
Certification of Principal Executive Officer pursuant to Rule 13a-14(a)/15d – 14(a). | X | ||||||||
| 31.2 |
Certification of Principal Financial Officer pursuant to Rule 13a-14(a)/15d – 14(a). | X | ||||||||
| 32.1†† |
Certification of Principal Executive Officer pursuant to 18 U.S.C. Section 1350. | 10-K | 001-11307-01 | 2/22/2013 | ||||||
| 32.2†† |
Certification of Principal Financial Officer pursuant to 18 U.S.C. Section 1350. | 10-K | 001-11307-01 | 2/22/2013 | ||||||
| 95.1† |
Mine Safety Disclosure | 10-K | 001-11307-01 | 2/22/2013 | ||||||
| 99.1† |
Asset and Stock Purchase Agreement among OMG Harjavalta Chemicals Holding BV, OMG Americas, Inc., OM Group, Inc., Koboltti Chemicals Holdings Limited and solely for purposes of Section 10.13 and Exhibit A, Freeport-McMoRan Corporation, dated as of January 21, 2013. | 10-K | 001-11307-01 | 2/22/2013 | ||||||
| 101.INS†† |
XBRL Instance Document | 10-K | 001-11307-01 | 2/22/2013 | ||||||
E-6
Table of Contents
FREEPORT-McMoRan COPPER & GOLD INC.
EXHIBIT INDEX
| Filed with | ||||||||||
| Exhibit | this Form | Incorporated by Reference | ||||||||
| Number |
Exhibit Title |
10-K/A | Form | File No. | Date Filed | |||||
| 101.SCH†† |
XBRL Taxonomy Extension Schema | 10-K | 001-11307-01 | 2/22/2013 | ||||||
| 101.CAL†† |
XBRL Taxonomy Extension Calculation Linkbase | 10-K | 001-11307-01 | 2/22/2013 | ||||||
| 101.DEF†† |
XBRL Taxonomy Extension Definition Linkbase | 10-K | 001-11307-01 | 2/22/2013 | ||||||
| 101.LAB†† |
XBRL Taxonomy Extension Label Linkbase | 10-K | 001-11307-01 | 2/22/2013 | ||||||
| 101.PRE†† |
XBRL Taxonomy Extension Presentation Linkbase | 10-K | 001-11307-01 | 2/22/2013 | ||||||
Note: Certain instruments with respect to long-term debt of FCX have not been filed as exhibits to this Annual Report on Form 10-K since the total amount of securities authorized under any such instrument does not exceed 10% of the total assets of FCX and its subsidiaries on a consolidated basis. FCX agrees to furnish a copy of each such instrument upon request of the Securities and Exchange Commission.
| * | Indicates management contract or compensatory plan or agreement. |
| † | Indicates documents previously filed with our Annual Report on Form 10-K for the fiscal year ended December 31, 2012, originally filed with the SEC on February 22, 2013, which is being amended hereby. |
| †† | Indicates documents previously furnished with our Annual Report on Form 10-K for the fiscal year ended December 31, 2012, originally filed with the SEC on February 22, 2013, which is being amended hereby. |
E-7