Attached files
| file | filename |
|---|---|
| EX-99.2 - EX-99.2 - COMERICA INC /NEW/ | ex992.htm |
| 8-K - CURRENT REPORT OF MATERIAL EVENTS OR CORPORATE CHANGES - COMERICA INC /NEW/ | a2013annualmeetingpresenta.htm |
Comerica Incorporated 2013 Annual Meeting of Shareholders April 23, 2013Comerica Bank TowerDallas, TX Call to Order
Quorum Proposal I Election of Directors
Proposal II Ratification of the Appointment of Independent Auditors Proposal III Approval of the Comerica Incorporated 2006 Amended and Restated Long-Term Incentive Plan, as Further Amended
Proposal IV Approval of a Non-Binding, Advisory Proposal Approving Executive Compensation A Motion to Vote

Polls Open for Voting Polls Closed
Voting Results Adjournment
Safe Harbor Statement 13 Any statements in this presentation that are not historical facts are forward-looking statements as defined in the Private Securities Litigation Reform Act of 1995. Words such as “anticipates,” “believes,” “contemplates,” “feels,” “expects,” “estimates,” “seeks,” “strives,” “plans,” “intends,” “outlook,” “forecast,” “position,” “target,” “mission,” “assume,” “achievable,” “potential,” “strategy,” “goal,” “aspiration,” “opportunity,” “initiative,” “outcome,” “continue,” “remain,” “maintain,” “on course,” “trend,” “objective,” “looks forward” and variations of such words and similar expressions, or future or conditional verbs such as “will,” “would,” “should,” “could,” “might,” “can,” “may” or similar expressions, as they relate to Comerica or its management, are intended to identify forward-looking statements. These forward-looking statements are predicated on the beliefs and assumptions of Comerica's management based on information known to Comerica's management as of the date of this presentation and do not purport to speak as of any other date. Forward-looking statements may include descriptions of plans and objectives of Comerica's management for future or past operations, products or services, and forecasts of Comerica's revenue, earnings or other measures of economic performance, including statements of profitability, business segments and subsidiaries, estimates of credit trends and global stability. Such statements reflect the view of Comerica's management as of this date with respect to future events and are subject to risks and uncertainties. Should one or more of these risks materialize or should underlying beliefs or assumptions prove incorrect, Comerica's actual results could differ materially from those discussed. Factors that could cause or contribute to such differences are changes in general economic, political or industry conditions; changes in monetary and fiscal policies, including the interest rate policies of the Federal Reserve Board; volatility and disruptions in global capital and credit markets; changes in Comerica's credit rating; the interdependence of financial service companies; changes in regulation or oversight; unfavorable developments concerning credit quality; any future acquisitions or divestitures; the effects of more stringent capital or liquidity requirements; declines or other changes in the businesses or industries of Comerica's customers; the implementation of Comerica's strategies and business models; Comerica's ability to utilize technology to efficiently and effectively develop, market and deliver new products and services; operational difficulties, failure of technology infrastructure or information security incidents; changes in the financial markets, including fluctuations in interest rates and their impact on deposit pricing; competitive product and pricing pressures among financial institutions within Comerica's markets; changes in customer behavior; management's ability to maintain and expand customer relationships; management's ability to retain key officers and employees; the impact of legal and regulatory proceedings or determinations; the effectiveness of methods of reducing risk exposures; the effects of terrorist activities and other hostilities; the effects of catastrophic events including, but not limited to, hurricanes, tornadoes, earthquakes, fires, droughts and floods; changes in accounting standards and the critical nature of Comerica's accounting policies. Comerica cautions that the foregoing list of factors is not exclusive. For discussion of factors that may cause actual results to differ from expectations, please refer to our filings with the Securities and Exchange Commission. In particular, please refer to “Item 1A. Risk Factors” beginning on page 13 of Comerica's Annual Report on Form 10-K for the year ended December 31, 2012. Forward-looking statements speak only as of the date they are made. Comerica does not undertake to update forward-looking statements to reflect facts, circumstances, assumptions or events that occur after the date the forward-looking statements are made. For any forward-looking statements made in this presentation or in any documents, Comerica claims the protection of the safe harbor for forward-looking statements contained in the Private Securities Litigation Reform Act of 1995. Chairman and Chief Executive Officer’s Presentation

15 16

Overview ? 2012 and first quarter 2013 financial results ? Our solid capital position ? Stock performance ? Executive compensation ? Capitalizing on opportunities ? Ongoing commitment to community, diversity and sustainability ? Questions and answers 17 Financial Results 18 $ in millions, except per share data ● 1Excludes the reclassification impact of ASU 2011-11 ● 2Calculated using net income attributable to common shares ● 3Estimated 1Q13 4Q12 20121 20111 Diluted income per common share2 $0.70 $0.68 $2.67 $2.09 Net interest income $416 $424 $1,728 $1,653 Loan accretion 11 13 71 53 Provision for credit losses 16 16 79 144 Noninterest income 200 204 818 792 Noninterest expenses 416 427 1,757 1,771 Restructuring expenses -- 2 35 75 Net income 134 130 521 393 Total loans (average) $44,617 $44,119 $43,306 $40,075 Total deposits (average) 50,692 51,282 49,540 43,762 Tier 1 capital ratio 10.40%3 10.17% Average diluted shares (millions) 187 188
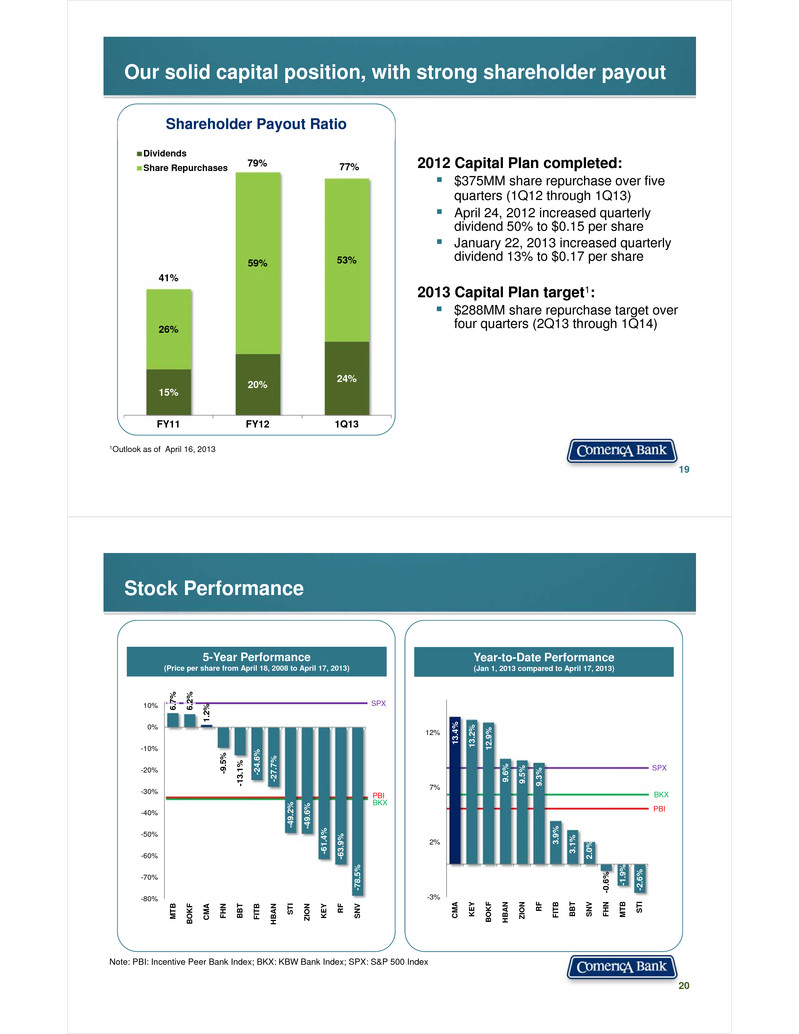
Our solid capital position, with strong shareholder payout 19 Shareholder Payout Ratio 15% 20% 24% 26% 59% 53% 41% 79% 77% FY11 FY12 1Q13 Dividends Share Repurchases 1Outlook as of April 16, 2013 2012 Capital Plan completed: ? $375MM share repurchase over five quarters (1Q12 through 1Q13) ? April 24, 2012 increased quarterly dividend 50% to $0.15 per share ? January 22, 2013 increased quarterly dividend 13% to $0.17 per share 2013 Capital Plan target1: ? $288MM share repurchase target over four quarters (2Q13 through 1Q14) SPX PBI BKX 13 .4% 13 .2% 12 .9% 9.6 % 9.5 % 9.3 % 3.9 % 3.1 % 2.0 % -0. 6% -1. 9% -2. 6% -3% 2% 7% 12% CM A KE Y BO KF HB AN ZIO N RF FIT B BB T SN V FH N MT B ST I 20 5-Year Performance (Price per share from April 18, 2008 to April 17, 2013) Year-to-Date Performance (Jan 1, 2013 compared to April 17, 2013) Note: PBI: Incentive Peer Bank Index; BKX: KBW Bank Index; SPX: S&P 500 Index SPX PBIBKX Stock Performance 6.7 % 6.2 % 1.2 % -9. 5% -13 .1% -24 .6% -27 .7% -49 .2% -49 .6% -61 .4% -63 .9% -78 .5% -80% -70% -60% -50% -40% -30% -20% -10% 0% 10% MT B BO KF CM A FH N BB T FIT B HB AN ST I ZIO N KE Y RF SN V
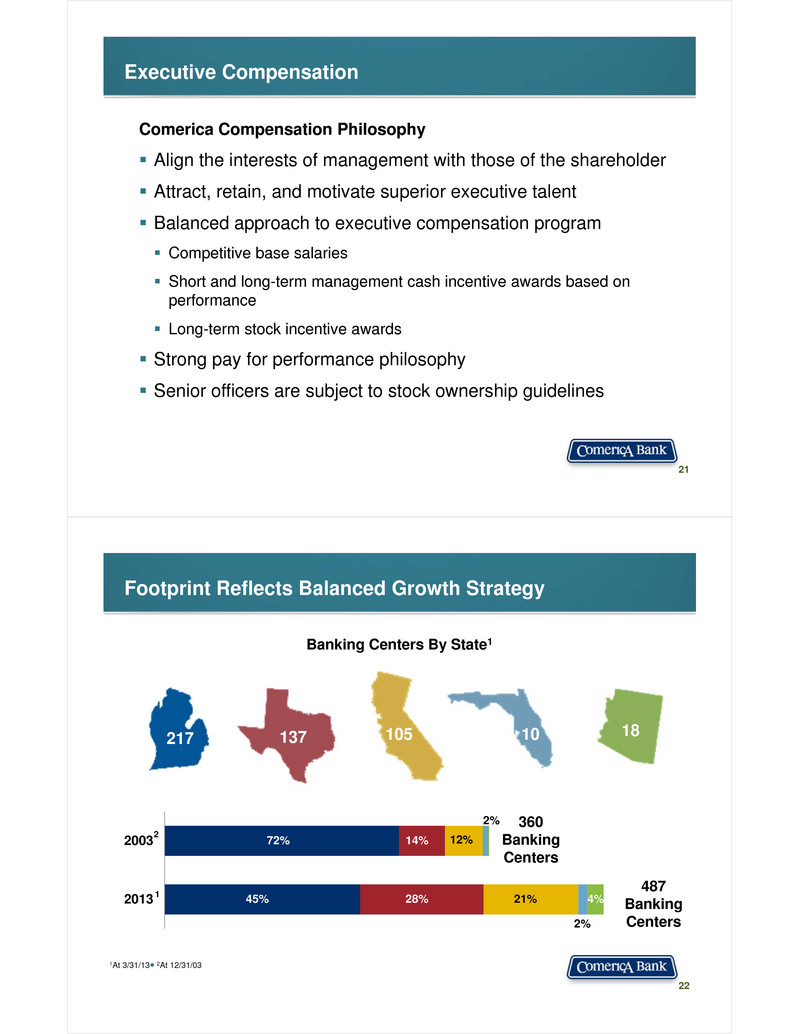
Executive Compensation Comerica Compensation Philosophy ? Align the interests of management with those of the shareholder ? Attract, retain, and motivate superior executive talent ? Balanced approach to executive compensation program ? Competitive base salaries ? Short and long-term management cash incentive awards based on performance ? Long-term stock incentive awards ? Strong pay for performance philosophy ? Senior officers are subject to stock ownership guidelines 21 Footprint Reflects Balanced Growth Strategy 22 1At 3/31/13● 2At 12/31/03 2013 2003 72% 45% 14% 28% 12% 21% 2% 2% 4% 360 Banking Centers 487 Banking Centers 217 137 105 10 18 Banking Centers By State1 2 1
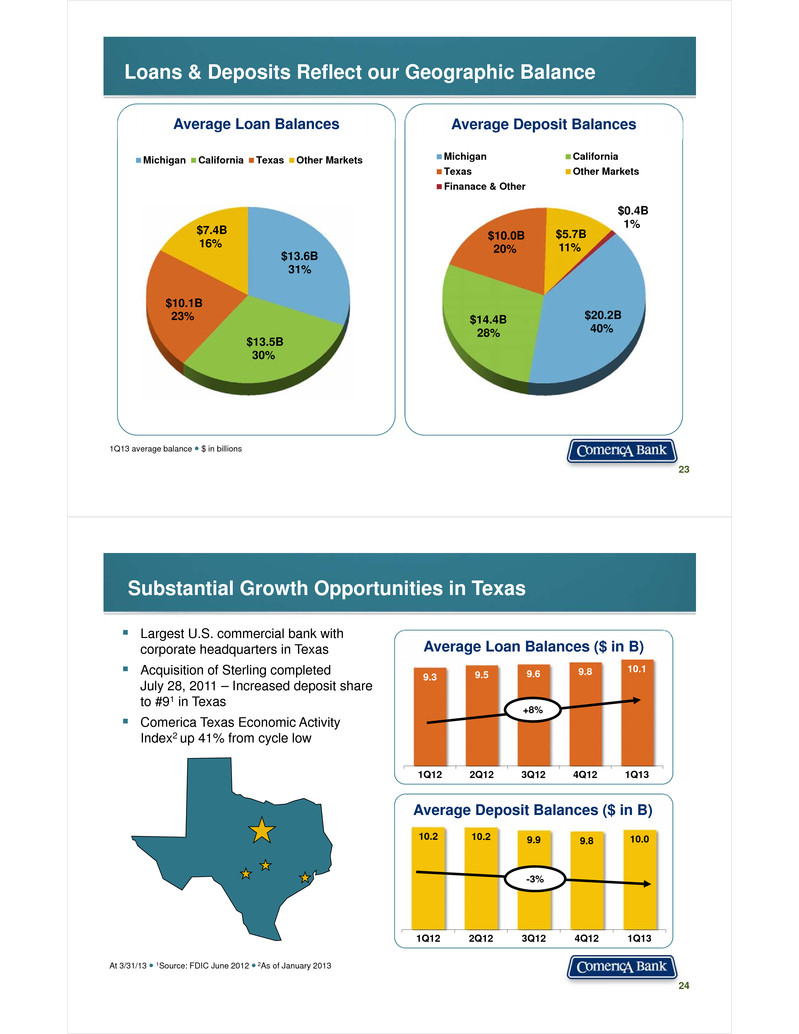
Loans & Deposits Reflect our Geographic Balance 23 1Q13 average balance ● $ in billions $13.6B 31% $13.5B 30% $10.1B 23% $7.4B 16% Michigan California Texas Other Markets Average Loan Balances Average Deposit Balances $20.2B 40%$14.4B28% $10.0B 20% $5.7B 11% $0.4B 1% Michigan California Texas Other Markets Finanace & Other ? Largest U.S. commercial bank with corporate headquarters in Texas ? Acquisition of Sterling completed July 28, 2011 – Increased deposit share to #91 in Texas ? Comerica Texas Economic Activity Index2 up 41% from cycle low 24 At 3/31/13 ● 1Source: FDIC June 2012 ● 2As of January 2013 Substantial Growth Opportunities in Texas 9.3 9.5 9.6 9.8 10.1 1Q12 2Q12 3Q12 4Q12 1Q13 10.2 10.2 9.9 9.8 10.0 1Q12 2Q12 3Q12 4Q12 1Q13 -3% +8% Average Loan Balances ($ in B) Average Deposit Balances ($ in B)
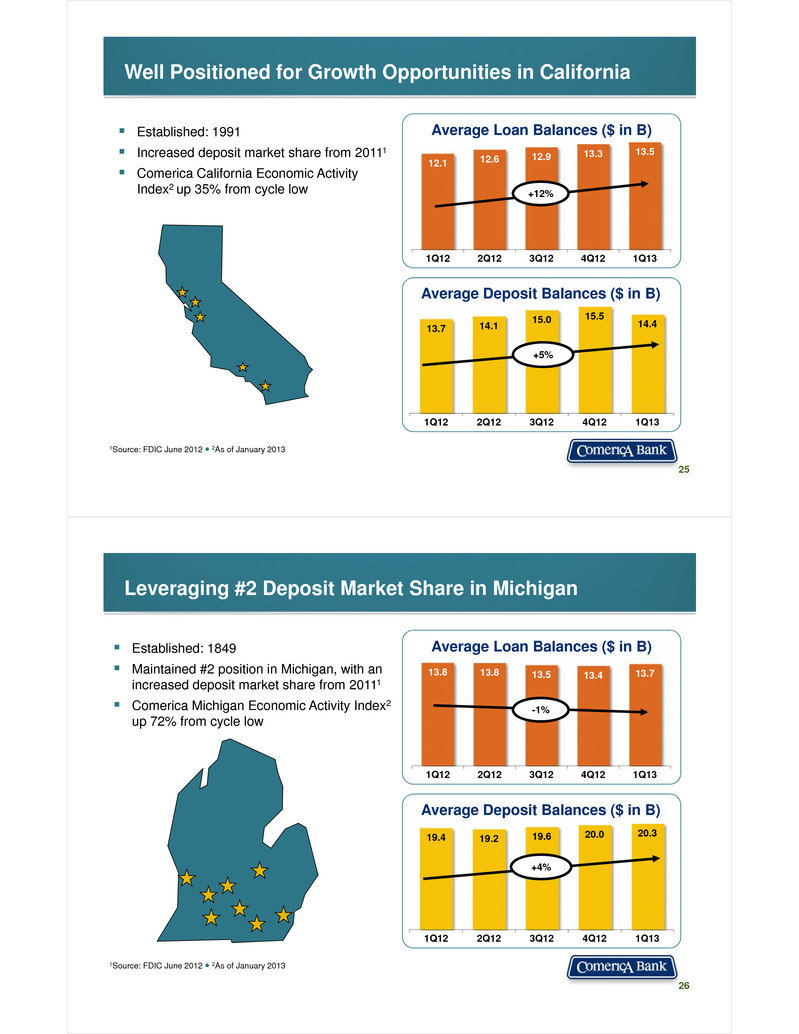
? Established: 1991 ? Increased deposit market share from 20111 ? Comerica California Economic Activity Index2 up 35% from cycle low 25 1Source: FDIC June 2012 ● 2As of January 2013 Well Positioned for Growth Opportunities in California 12.1 12.6 12.9 13.3 13.5 1Q12 2Q12 3Q12 4Q12 1Q13 13.7 14.1 15.0 15.5 14.4 1Q12 2Q12 3Q12 4Q12 1Q13 +5% +12% Average Loan Balances ($ in B) Average Deposit Balances ($ in B) ? Established: 1849 ? Maintained #2 position in Michigan, with an increased deposit market share from 20111 ? Comerica Michigan Economic Activity Index2 up 72% from cycle low 1Source: FDIC June 2012 ● 2As of January 2013 26 Leveraging #2 Deposit Market Share in Michigan 13.8 13.8 13.5 13.4 13.7 1Q12 2Q12 3Q12 4Q12 1Q13 19.4 19.2 19.6 20.0 20.3 1Q12 2Q12 3Q12 4Q12 1Q13 +4% -1% Average Loan Balances ($ in B) Average Deposit Balances ($ in B)
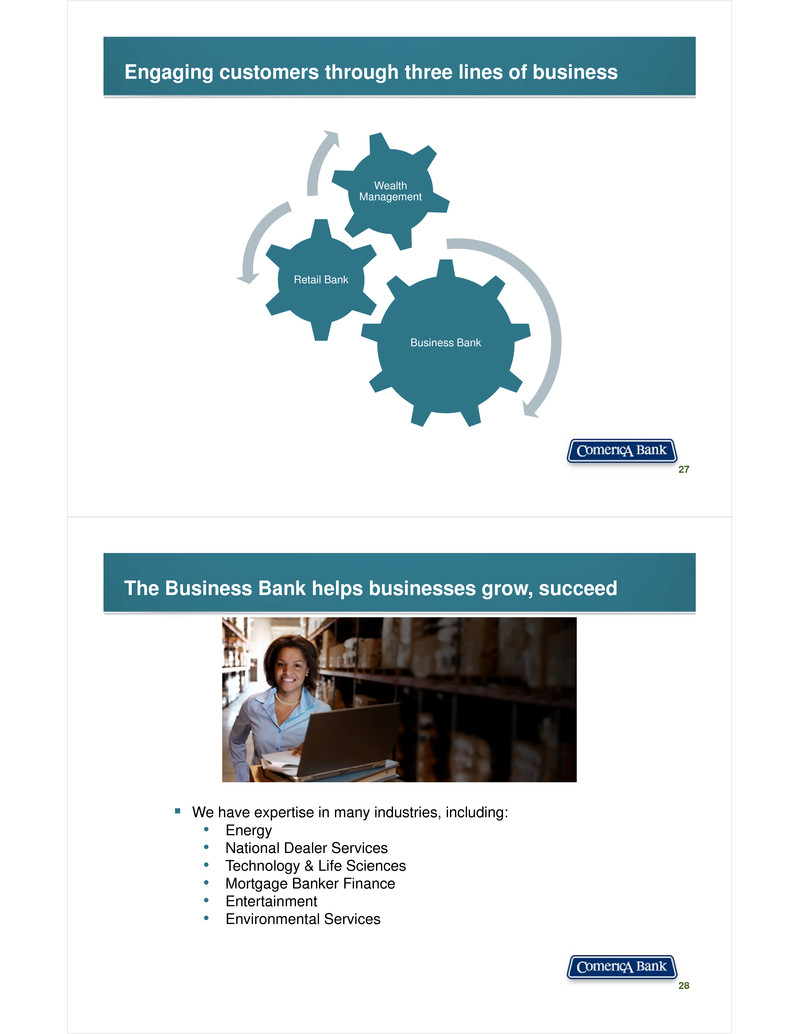
Engaging customers through three lines of business 27 Business Bank Retail Bank Wealth Management The Business Bank helps businesses grow, succeed 28 ? We have expertise in many industries, including: • Energy • National Dealer Services • Technology & Life Sciences • Mortgage Banker Finance • Entertainment • Environmental Services

Our card programs are national in scope 29 Among commercial card issuers1: • #8 among the largest U.S. commercial card issuers • #2 in prepaid commercial cards • #4 in fleet cards • #15 in purchasing and corporate cards We are financial agent for the U.S. Treasury Department’s Direct Express card program: • More than 4 million registered cardholders • No set-up fees or monthly account fees • Safe, convenient alternative to paper checks 1Source: The Nilson Report, July 2012 reflecting 2011 data Collaboration is key for Retail Bank and Wealth Management 30 Strategic initiative focused on referral opportunities between our business lines

Convenience is a hallmark of our Retail Bank 31 Wealth Management clients receive exclusive services 32 Target Segments: ? Individuals with $1MM or greater in investable assets: • Business owners • Corporate executives • First generation wealth ? Foundations & Institutions – With over $10MM in investable assets

We have a strong commitment to the community … 33 In 2012 … ? Provided more than $9MM to not-for- profit organizations ? Employees raised more than $2MM for the United Way ? Employees donated more than 71,000 hours of time in volunteer activities An equally strong commitment to diversity … 34
And an internationally recognized commitment to sustainability 35 Ready for the Road Ahead 36 146 0 64 17 73 134 ? Consistent strategy • Based on relationship banking model • Core businesses and geographies unchanged • Recession-tested business model ? Expense management ? Solid capital position Main Street Bank Well Positioned for Growth
Questions and Answers 37
