Attached files
| file | filename |
|---|---|
| 8-K - 8-K - GARDNER DENVER INC | d525534d8k.htm |
Exhibit 99.1
Certain Information Included in or Otherwise Derived from Senior Unsecured Bridge Loan Confidential
Information Memorandum
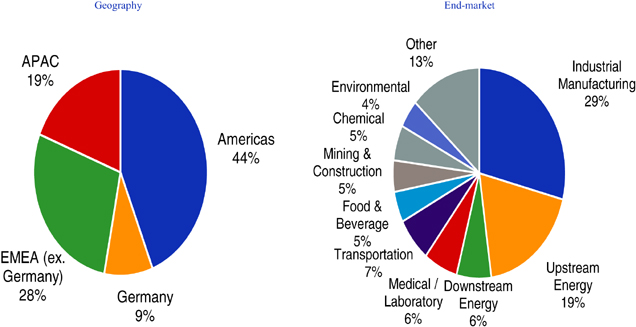
2012 Revenue Breakdown (total company)
| ||
| Note: High growth, developing and emerging markets (including China and Brazil) account for 27% of the Company’s sales |
Note: Percentages may not sum to 100 due to rounding | |
| ||
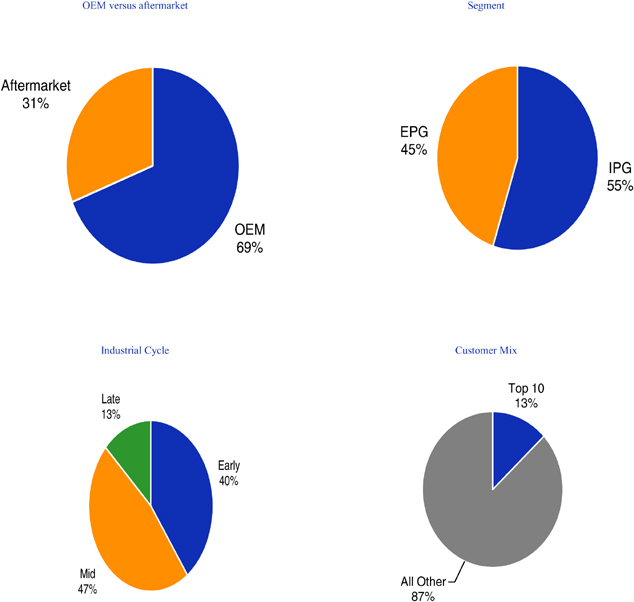
| Note: The Company has over 100,000 customers globally and the Company’s top 10 customers have partnered with the Company for an average of 20 years | ||
2
|
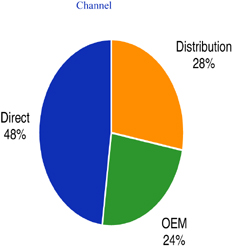
| Note: | Percentages may not sum to 100 due to rounding |
3
|
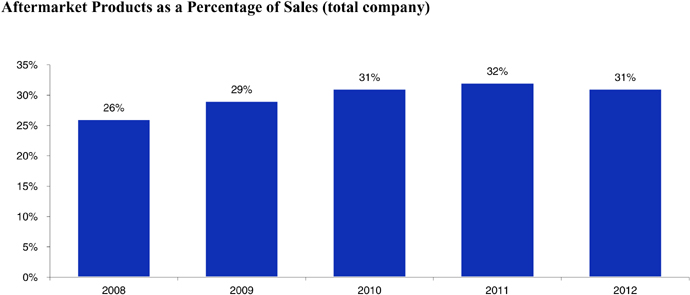
| Note: | Aftermarket represented 32% of 2012 sales excluding the impact of the Robuschi acquisition |
4
Financial Summary (total company)
| ($ in millions) | 2008 | 2009 | 2010 | 2011 | 2012 | |||||||||||||||
| EPG |
$ | 960 | $ | 755 | $ | 795 | $ | 1,115 | $ | 1,062 | ||||||||||
| % growth |
3.8 | % | (21.3) | % | 5.3 | % | 40.2 | % | (4.8) | % | ||||||||||
| IPG |
$ | 1,058 | $ | 1,023 | $ | 1,100 | $ | 1,256 | $ | 1,294 | ||||||||||
| % growth |
12.1 | % | (3.3) | % | 7.5 | % | 14.2 | % | 3.0 | % | ||||||||||
| Total revenue |
$ | 2,018 | $ | 1,778 | $ | 1,895 | $ | 2,371 | $ | 2,356 | ||||||||||
| % growth |
8.0 | % | (11.9) | % | 6.6 | % | 25.1 | % | (0.6) | % | ||||||||||
| Pro forma revenue (a) |
$ | 2,557 | $ | 1,870 | $ | 1,987 | $ | 2,460 | $ | 2,356 | ||||||||||
| % growth |
N/A | (26.9) | % | 6.3 | % | 23.8 | % | (4.2) | % | |||||||||||
| Adjusted EBITDA Illustratively Pro Forma For Future Cost Savings |
$ | 404 | $ | 284 | $ | 342 | $ | 503 | $ | 522 | ||||||||||
| % margin |
15.8 | % | 15.2 | % | 17.2 | % | 20.4 | % | 22.2 | % | ||||||||||
| Capital expenditures |
$ | 41 | $ | 43 | $ | 33 | $ | 56 | $ | 50 | ||||||||||
| % of revenue |
2.0 | % | 2.4 | % | 1.7 | % | 2.4 | % | 2.1 | % | ||||||||||
| Net working capital (b) |
$ | 313 | $ | 263 | $ | 289 | $ | 361 | $ | 397 | ||||||||||
| % of revenue |
15.5 | % | 14.8 | % | 15.2 | % | 15.2 | % | 16.8 | % | ||||||||||
| Unlevered free cash flow (c) |
$ | 363 | $ | 241 | $ | 309 | $ | 447 | $ | 472 | ||||||||||
| % conversion |
89.9 | % | 84.9 | % | 90.4 | % | 88.9 | % | 90.4 | % | ||||||||||
| (a) | Pro forma revenue includes the impact of revenues associated with historical acquisitions of CompAir Holdings Limited, Robuschi S.p.A. and ILMVAC GmbH (2008 - $539, 2009 - $92, 2010 - $92, 2011 - $89) |
| (b) | Net working capital defined as accounts receivable and inventory, less accounts payable and accrued liabilities |
| (c) | Unlevered free cash flow defined as Pro Forma Adjusted EBITDA less capex |
5
Reconciliations of Non-GAAP Financial Measures (Total Company)
The following reconciliation is included for illustrative purposes only and represents a sample presentation of Pro Forma Adjusted EBITDA based on and for purposes of the expected EBITDA definitions under the Company’s new debt agreements. As a result, Pro Forma Adjusted EBITDA includes adjustments to exclude/include certain items such as: non-cash and non-recurring items; foreign currency items; cost savings initiatives (not retroactive; only applied to 2012 and 2013E); historical acquisitions (2008 CompAir, 2010 ILMVAC, 2011 Robuschi and China JVs); and other adjustment items expected to be permitted under the Company’s debt agreements.
Reconciliation of Total Company Adjusted EBITDA to Net Income
| Year Ended December 31, | ||||||||||||||||||||
| 2008 | 2009 | 2010 | 2011 | 2012 | ||||||||||||||||
| (in millions) | ||||||||||||||||||||
| Net income attributable to Gardner Denver |
$ | 166.0 | $ | (165.2 | ) | $ | 173.0 | $ | 277.6 | $ | 263.3 | |||||||||
| Interest expense |
25.5 | 28.5 | 23.4 | 15.4 | 14.7 | |||||||||||||||
| Provision for income taxes |
67.5 | 24.9 | 56.9 | 107.4 | 97.1 | |||||||||||||||
| Depreciation and amortization |
61.5 | 68.7 | 60.2 | 60.3 | 63.8 | |||||||||||||||
|
|
|
|
|
|
|
|
|
|
|
|||||||||||
| EBITDA |
$ | 320.5 | $ | (43.1 | ) | $ | 313.5 | $ | 460.7 | $ | 438.9 | |||||||||
| Restructuring costs (A) |
11.1 | 46.1 | 2.2 | 8.6 | 18.7 | |||||||||||||||
| Acquisition EBITDA (I) |
48.3 | 16.6 | 18.3 | 21.1 | — | |||||||||||||||
| Non-cash purchase accounting adjustments (B) |
2.5 | — | 0.3 | 1.0 | 3.4 | |||||||||||||||
| Stock-based compensation expense (C) |
4.5 | 3.0 | 6.4 | 6.5 | 5.4 | |||||||||||||||
| Other employee termination and certain retirement costs (D) |
5.0 | (0.3 | ) | 1.0 | 2.0 | 2.3 | ||||||||||||||
| Foreign currency (gains) / losses (E) |
12.9 | 0.5 | (2.0 | ) | (0.7 | ) | 3.4 | |||||||||||||
| Pension and OPEB adjustment (F) |
(1.6 | ) | 0.2 | — | 0.8 | 1.8 | ||||||||||||||
| Other adjustments (G) |
0.8 | 261.3 | 2.3 | 2.8 | 3.2 | |||||||||||||||
|
|
|
|
|
|
|
|
|
|
|
|||||||||||
| Adjusted EBITDA |
$ | 404.0 | $ | 284.3 | $ | 342.0 | $ | 502.8 | $ | 477.1 | ||||||||||
| Future cost savings illustratively pulled forward (H) |
— | — | — | — | 45.2 | |||||||||||||||
|
|
|
|
|
|
|
|
|
|
|
|||||||||||
| Adjusted EBITDA Illustratively Pro Forma for Future Cost Savings |
$ | 404.0 | $ | 284.3 | $ | 342.0 | $ | 502.8 | $ | 522.3 | ||||||||||
|
|
|
|
|
|
|
|
|
|
|
|||||||||||
| Note: | Please refer to the corresponding footnotes below under “Pro Forma Adjusted EBITDA Reconciliation” |
Reconciliation of Total Company Adjusted Revenue to Historical Revenue
| Year Ended December 31, | ||||||||||||||||||||
| 2008 | 2009 | 2010 | 2011 | 2012 | ||||||||||||||||
| (in millions) | ||||||||||||||||||||
| Historical Consolidated Revenues |
$ | 2,018 | $ | 1,778 | $ | 1,895 | $ | 2,371 | $ | 2,356 | ||||||||||
| Robuschi S. p. A. |
91.7 | 77.3 | 84.4 | 88.6 | — | |||||||||||||||
| CompAir Holdings Limited |
429.8 | — | — | — | — | |||||||||||||||
| ILMVAC GmbH |
17.5 | 14.3 | 7.1 | — | — | |||||||||||||||
|
|
|
|
|
|
|
|
|
|
|
|||||||||||
| Pro forma Revenues |
2,557 | 1,870 | 1,987 | 2,460 | 2,356 | |||||||||||||||
6
Pro Forma Adjusted EBITDA Reconciliation
The following reconciliation is included for illustrative purposes only and represents a sample presentation of Pro Forma Adjusted EBITDA based on and for purposes of the expected EBITDA definitions under the Company’s new debt agreements. As a result, Pro Forma Adjusted EBITDA includes adjustments to exclude/include certain items such as: non-cash and non-recurring items; foreign currency items; cost savings initiatives (not retroactive; only applied to 2012 and 2013E); historical acquisitions (2008 CompAir, 2010 ILMVAC, 2011 Robuschi and China JVs); and other adjustment items expected to be permitted under the Company’s debt agreements.
| ($ in millions) | Est. Based on Midpoint of EPS Guidance |
|||||||||
| Reconciliation: |
2012 | 2013E | ||||||||
| Midpoint of 2013 DEPS Guidance (1) |
NA | $ | 4.37 | |||||||
| Diluted shares outstanding |
NA | 49.316 | ||||||||
|
|
|
|
|
|||||||
| Net income attributable to Gardner Denver |
$ | 263.3 | $ | 215.5 | ||||||
| Interest expense |
14.7 | 12.7 | ||||||||
| Provision for income taxes |
97.1 | 82.2 | ||||||||
| Depreciation and amortization |
63.8 | 62.6 | ||||||||
|
|
|
|
|
|||||||
| EBITDA |
$ | 438.9 | $ | 373.0 | ||||||
| (A) |
Restructuring costs |
18.7 | 46.2 | |||||||
| (B) |
Non-cash purchase accounting adjustments |
3.4 | — | |||||||
| (C) |
Stock-based compensation expense |
5.4 | 5.1 | |||||||
| (D) |
Other employee termination and certain retirement costs |
2.3 | — | |||||||
| (E) |
Foreign currency (gains) / losses |
3.4 | — | |||||||
| (F) |
Pension and OPEB adjustment |
1.8 | 1.0 | |||||||
| (G) |
Other adjustments |
3.2 | 2.3 | |||||||
|
|
|
|
|
|||||||
| Adjusted EBITDA |
$ | 477.1 | $ | 427.6 | ||||||
| (H) |
Future cost savings illustratively pulled forward |
45.2 | 25.7 | |||||||
|
|
|
|
|
|||||||
| Adjusted EBITDA Illustratively Pro Forma for Future Cost Savings |
$ | 522.3 | $ | 453.3 | ||||||
| Note: | Does not represent management’s expectation for earnings performance in these periods |
| (1) | DEPS Guidance based on public information contained in GDI’s press release for the fourth quarter and full year 2012, dated February 22, 2013. Previously disclosed guidance indicated expected full year 2013 earnings of $4.25 to $4.50 per diluted share. |
| (A) | Represents historical restructuring costs incurred in connection with the closure and consolidation of certain facilities and functions. |
| (B) | Represents the reversal of the income statement impacts of non-recurring Robuschi purchase accounting adjustments associated with (1) the write-up of the fair value of inventory and (2) the amortization of favorable and unfavorable leases. |
| (C) | Represents non-cash stock-based compensation expense relating to stock options and restricted share awards. |
| (D) | Represents certain non-recurring employee related costs resulting from terminations (non-restructuring). |
| (E) | Represents gains and losses on transactions denominated in currencies other than our functional currency, including gains and losses on intercompany transactions. |
| (F) | Represents the effects of amortization of prior service costs and amortization of losses (gains) in pension and OPEB expense. |
7
| (G) | Represents non-cash, non-operating, or non-recurring adjustments, consisting of: (1) gains/losses on disposal of assets, (2) third-party costs associated with successful / abandoned transactions, (3) investment gains and losses associated with our deferred compensation plan, (4) board of directors’ fees, (5) non-cash income associated with a decrease of inventories in certain LIFO pools and the resulting liquidations of LIFO inventory layers, and (6) other minor miscellaneous adjustments. The adjustment for 2009 includes an addback of approximately $262 million for impairment charges. |
| (H) | Represents savings the Company expects to realize during 2013 and 2014 from optimizing IPG Europe’s operations and achieving sourcing savings, resulting in reduced costs and margin expansion. The IPG Europe initiative is expected to leverage lower cost locations, as well as reduce excess capacity and average labor costs, while the sourcing savings will be achieved by developing a global procurement organization and strategically managing direct materials spend. The pro forma adjustments in 2012 and 2013 represent expected future cost savings not realized during each respective period. |
| (I) | Represents adjustments to include the EBITDA impact of historical acquisitions as if the Company owned the acquired entities throughout each period. |
8
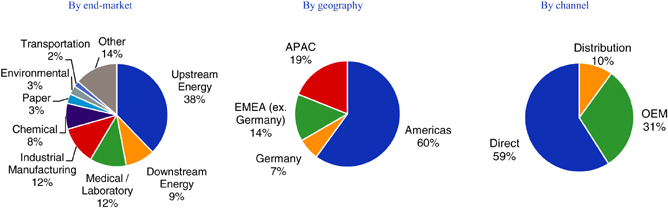
Segment Information: Engineered Products Group
The Thomas business offers a broad range of over 20,000 SKUs, deriving ~60% of its revenue from medical and laboratory sciences applications offered primarily under the Thomas business, Welch and ILMVAC trademarks.
2012 Revenue Breakdown
|
| Note: | Percentages may not sum to 100 due to rounding |
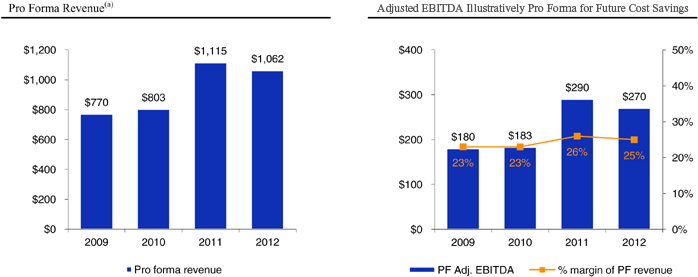
Financial Summary ($ in millions)
|
| (a) | Note: Amounts included herein represent pro forma revenue for 2009 and 2010 |
9
Reconciliation of Engineered Products Group Adjusted Revenue to Historical Revenue
| Year Ended December 31, | ||||||||||||||||
| 2009 | 2010 | 2011 | 2012 | |||||||||||||
| (in millions) | ||||||||||||||||
| Historical EPG Revenues |
$ | 756 | $ | 795 | $ | 1,115 | $ | 1,062 | ||||||||
| ILMVAC GmbH |
14.3 | 7.1 | — | — | ||||||||||||
| Pro forma EPG Revenues |
770 | 802 | 1,115 | 1,062 | ||||||||||||
10
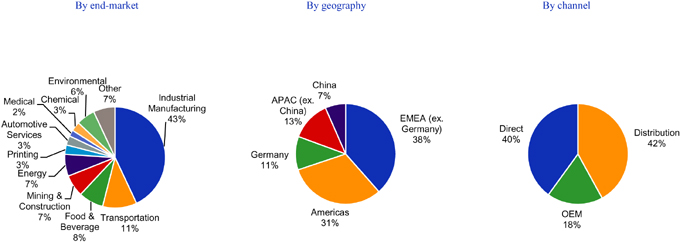
Segment Information: Industrial Products Group
2012 Revenue Breakdown
|
| Note: | Percentages may not sum to 100 due to rounding |
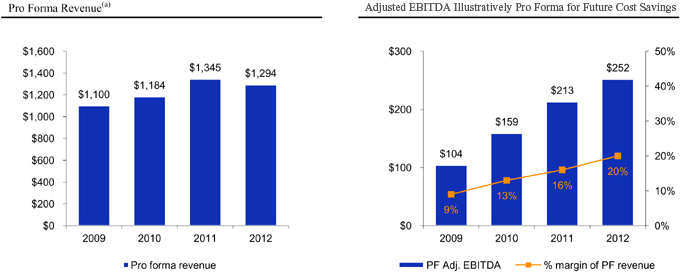
Financial Summary ($ in millions)
|
| (a) | Note: Amounts included herein represent pro forma revenue for 2009, 2010 and 2011 |
11
Reconciliation of Industrial Products Group Adjusted Revenue to Historical Revenue
| Year Ended December 31, | ||||||||||||||||
| 2009 | 2010 | 2011 | 2012 | |||||||||||||
| (in millions) | ||||||||||||||||
| Historical IPG Revenues |
$ | 1,023 | $ | 1,100 | $ | 1,256 | $ | 1,294 | ||||||||
| Robuschi S.p.A. |
77.3 | 84.4 | 88.6 | — | ||||||||||||
|
|
|
|
|
|
|
|
|
|||||||||
| Pro forma IPG Revenues |
1,100 | 1,184 | 1,345 | 1,294 | ||||||||||||
Reconciliation of Segment Adjusted EBITDA Illustratively Pro Forma for Future Cost Savings
| Year Ended December 31, | ||||||||||||||||||||||||||||||||
| 2009 | 2010 | 2011 | 2012 | |||||||||||||||||||||||||||||
| IPG | EPG | IPG | EPG | IPG | EPG | IPG | EPG | |||||||||||||||||||||||||
| (in millions) | ||||||||||||||||||||||||||||||||
| Total Company EBITDA (A) |
($43.1) | $313.5 | $460.7 | $438.9 | ||||||||||||||||||||||||||||
| EBITDA |
$ | (192.9 | ) | $ | 149.8 | $ | 133.7 | $ | 179.8 | $ | 179.6 | $ | 281.1 | $ | 179.5 | $ | 259.4 | |||||||||||||||
| Restructuring costs |
20.4 | 25.7 | 3.7 | (1.5 | ) | 6.6 | 2.0 | 14.8 | 3.9 | |||||||||||||||||||||||
| Acquisition EBITDA |
14.5 | 2.1 | 17.1 | 1.2 | 21.1 | — | — | — | ||||||||||||||||||||||||
| Non-cash purchase accounting adjustments |
— | — | — | 0.3 | 1.0 | — | 3.4 | — | ||||||||||||||||||||||||
| Stock-based compensation expense |
1.8 | 1.2 | 3.8 | 2.6 | 3.6 | 2.9 | 2.8 | 2.6 | ||||||||||||||||||||||||
| Other employee termination and certain retirement costs |
(0.2 | ) | (0.1 | ) | 0.6 | 0.4 | 1.3 | 0.7 | 1.1 | 1.2 | ||||||||||||||||||||||
| Foreign currency (gains) / losses |
(1.6 | ) | 2.1 | (2.0 | ) | — | (2.7 | ) | 2.0 | 1.9 | 1.5 | |||||||||||||||||||||
| Pension and OPEB adjustment |
0.1 | 0.1 | — | — | 0.4 | 0.4 | 0.9 | 0.9 | ||||||||||||||||||||||||
| Other adjustments |
261.6 | (0.3 | ) | 2.6 | (0.3 | ) | 1.8 | 1.0 | 2.3 | 0.9 | ||||||||||||||||||||||
|
|
|
|
|
|
|
|
|
|
|
|
|
|
|
|
|
|||||||||||||||||
| Adjusted EBITDA |
$ | 103.7 | $ | 180.6 | $ | 159.5 | $ | 182.5 | $ | 212.7 | $ | 290.1 | $ | 206.7 | $ | 270.4 | ||||||||||||||||
| Future cost savings illustratively pulled forward |
— | — | — | — | — | — | 45.2 | — | ||||||||||||||||||||||||
|
|
|
|
|
|
|
|
|
|
|
|
|
|
|
|
|
|||||||||||||||||
| Adjusted EBITDA Illustratively Pro Forma for Future Cost Savings |
$ | 103.7 | $ | 180.6 | $ | 159.5 | $ | 182.5 | $ | 212.7 | $ | 290.1 | $ | 251.9 | $ | 270.4 | ||||||||||||||||
|
|
|
|
|
|
|
|
|
|
|
|
|
|
|
|
|
|||||||||||||||||
| (A) | The sum of IPG and EPG EBITDA for each year equals the aggregate Company EBITDA as disclosed above under the heading “Reconciliation of Total Company Adjusted EBITDA to Net Income.” Please refer to the table set forth therein for a reconciliation of aggregate Company EBITDA to aggregate Company net income. |
12