Attached files
| file | filename |
|---|---|
| EX-99.1 - EXHIBIT 99.1 - WESTERN ALLIANCE BANCORPORATION | a50612661ex99_1.htm |
| 8-K - WESTERN ALLIANCE BANCORPORATION 8-K - WESTERN ALLIANCE BANCORPORATION | a50612661.htm |
Exhibit 99.2
(NYSE: WAL) April 19, 2013
Western Alliance Bancorporation 1st Quarter Earnings Call
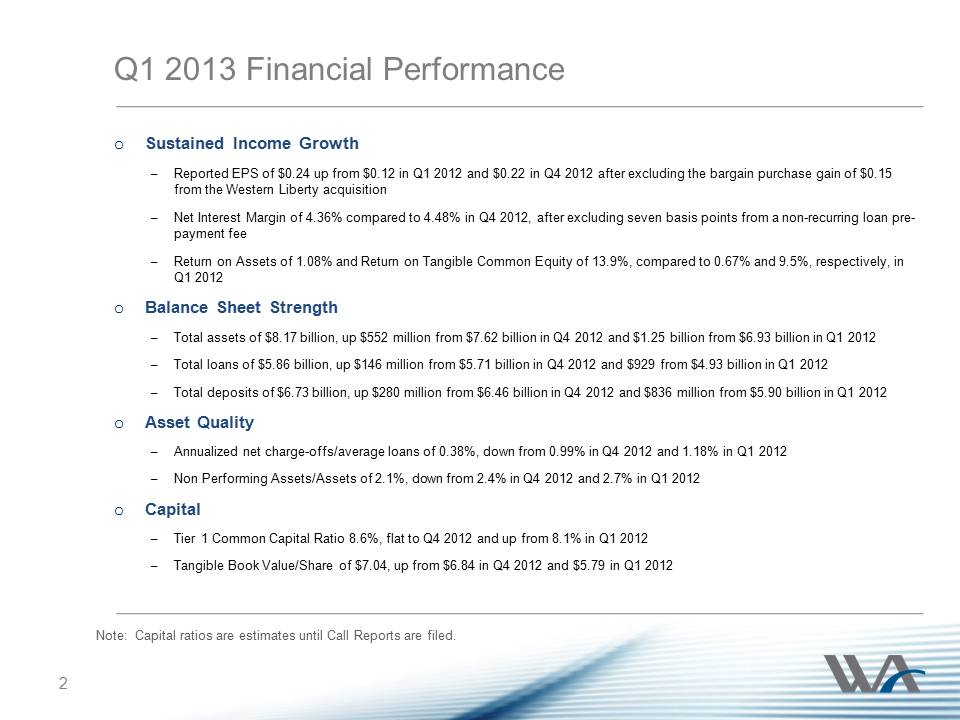
Q1 2013 Financial
Performance oSustained Income Growth –Reported EPS of $0.24 up from
$0.12 in Q1 2012 and $0.22 in Q4 2012 after excluding the bargain
purchase gain of $0.15 from the Western Liberty acquisition –Net
Interest Margin of 4.36% compared to 4.48% in Q4 2012, after excluding
seven basis points from a non-recurring loan pre-payment fee –Return on
Assets of 1.08% and Return on Tangible Common Equity of 13.9%, compared
to 0.67% and 9.5%, respectively, in Q1 2012 oBalance Sheet Strength
–Total assets of $8.17 billion, up $552 million from $7.62 billion in Q4
2012 and $1,25 billion from $6.93 billion in Q1 2012 –Total loans of
$5.86 billion, up $146 million from $5.71 billion in Q4 2012 and $929
from $4.93 billion in Q1 2012 –Total deposits of $6.73 billion, up $280
million from $6.46 billion in Q4 2012 and $836 million from $5.90
billion in Q1 2012 oAsset Quality –Annualized net charge-offs/average
loans of 0.38%, down from 0.99% in Q4 2012 and 1.18% in Q1 2012 –Non
Performing Assets/Assets of 2.1%, down from 2.4% in Q4 2012 and 2.7% in
Q1 2012 oCapital –Tier 1 Common Capital Ratio 8.6%, flat to Q4 2012 and
up from 8.1% in Q1 2012 –Tangible Book Value/Share of $7.04, up from
$6.84 in Q4 2012 and $5.79 in Q1 2012 2 Note: Capital ratios are
estimates until Call Reports are filed.
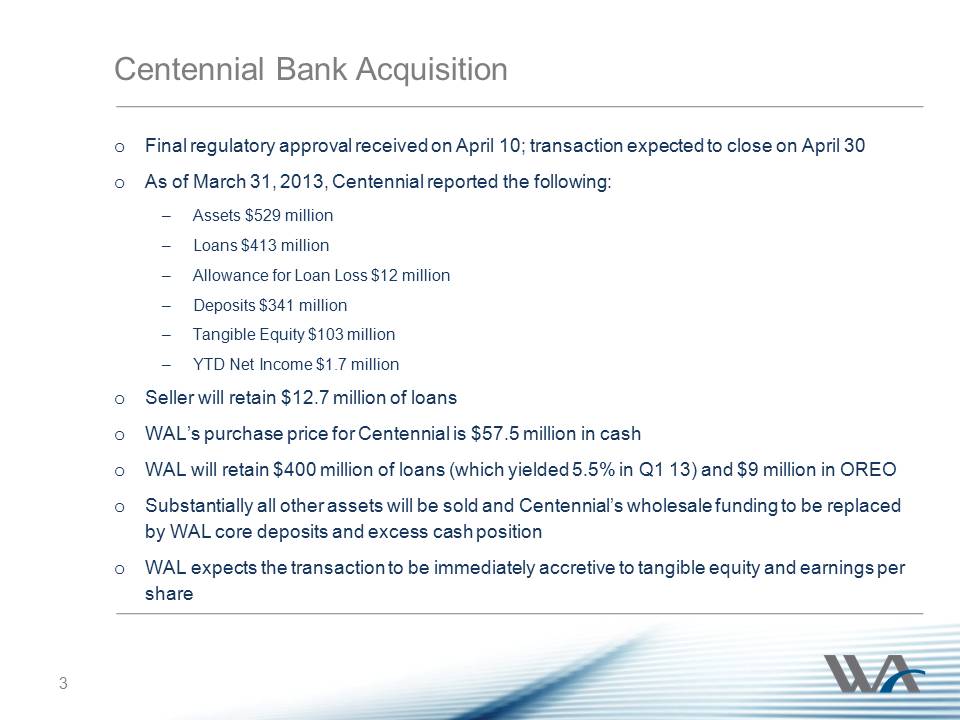
Centennial Bank Acquisition
3 oFinal regulatory approval received on April 10; transaction expected
to close on April 30 oAs of March 31, 2013, Centennial reported the
following: –Assets $529 million –Loans $413 million –Allowance for Loan
Loss $12 million –Deposits $341 million –Tangible Equity $103 million
–YTD Net Income $1.7 million oSeller will retain $12.7 million of loans
oWAL’s purchase price for Centennial is $57.5 million in cash oWAL will
retain $400 million of loans (which yielded 5.5% in Q1 13) and $9
million in OREO oSubstantially all other assets will be sold and
Centennial’s wholesale funding to be replaced by WAL core deposits and
excess cash position oWAL expects the transaction to be immediately
accretive to tangible equity and earnings per share 3
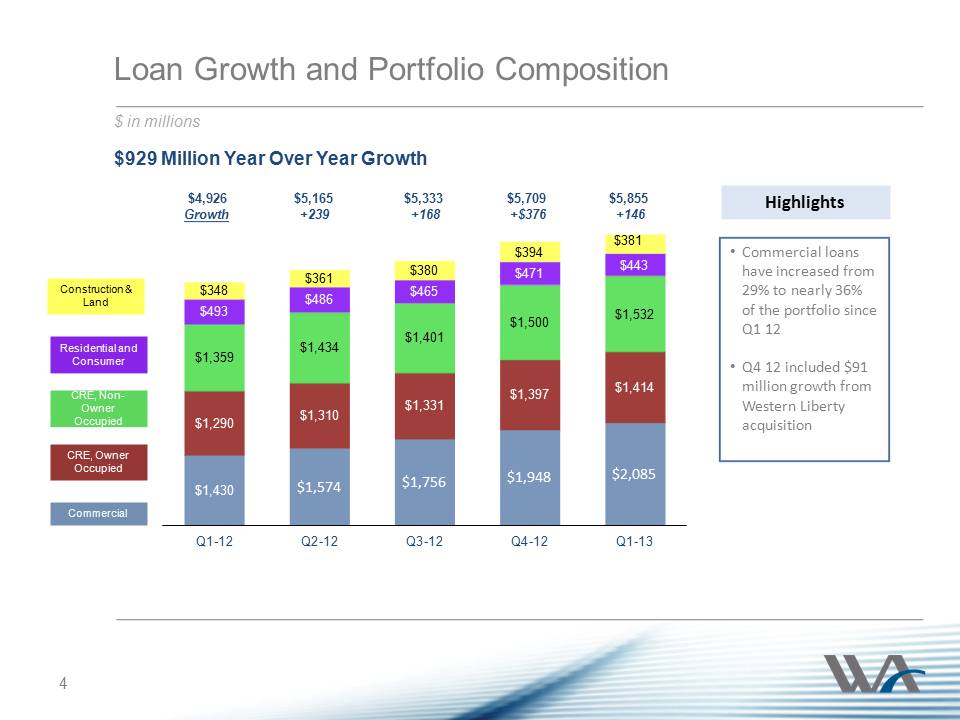
Loan Growth and Portfolio Composition $ in millions $381 $929 Million Year Over Year Growth Commercial CRE, Owner Occupied CRE, Non-Owner OccupiedConstruction & Land Residential and Consumer •Commercial loans have increased from 29% to nearly 36% of the portfolio since Q1 12 •Q4 12 included $91 million growth from Western Liberty acquisition Highlights 4 $1,359 $1,434 $1,401.$1,500 $1,532 $348 $361 $380 $394 Q1-12 Q2-12 Q3-12 Q4-12 Q1-13 $4,926 $5,165 $5,333 $5,709 $5,855 Growth +239 +168 +$376 +146 4
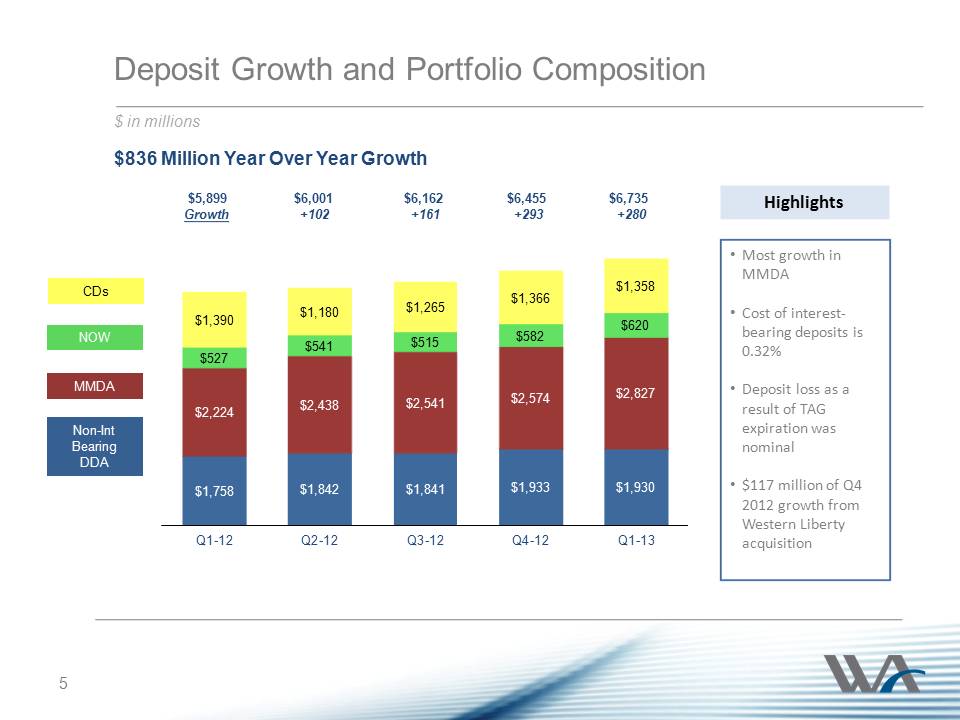
Deposit Growth and
Portfolio Composition $ in millions $836 Million Year Over Year Growth
MMDA NOW CDs Non-Int Bearing DDA $1,758 $1,842 $1,841 $1,933 $1,930
$2,224 $2,438 $2,541 $2,574 $2,827 $527 $541 $515 $582 $620 $1,390
$1,180 $1,265 $1,366 $1,358 Q1-12 Q2-12 Q3-12 Q4-12 Q1-13 $5,899 $6,001
$6,162 $6,455 $6,735 Growth +102 +161 +293 +280 •Most growth in MMDA
•Cost of interest-bearing deposits is 0.32% •Deposit loss as a result of
TAG expiration was nominal •$117 million of Q4 2012 growth from Western
Liberty acquisition Highlights 5
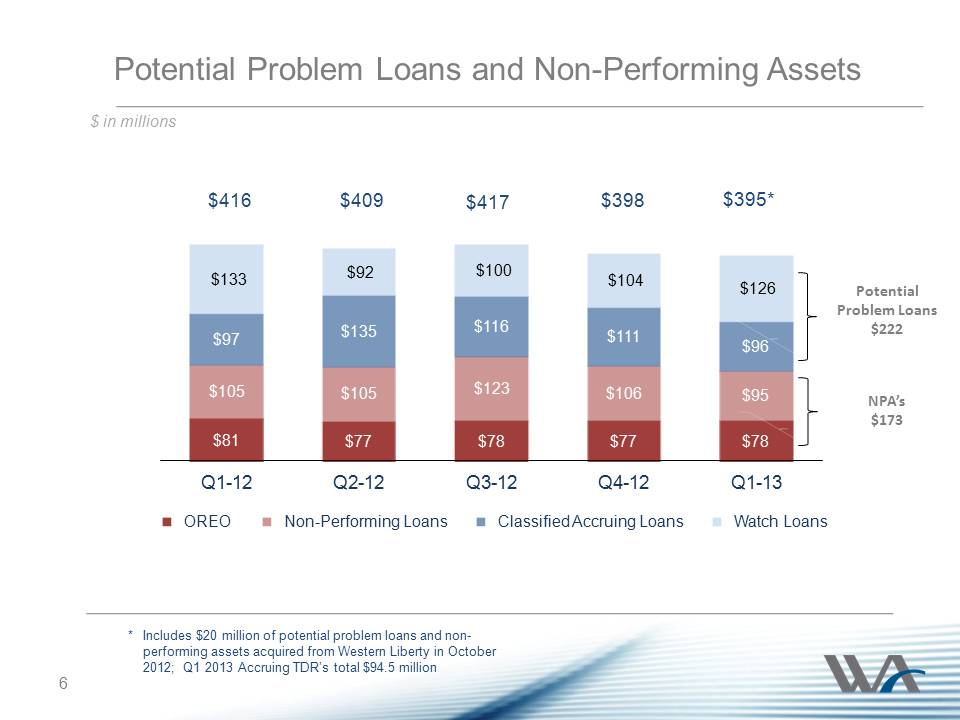
6 Potential Problem Loans and Non-Performing Assets $ in millions $81 $77 $78 $77 $78 $105 $105 $123 $106 $95 $97 $135 $116 $111 $96 $133 $92 $100 $104 $126 Q1-12 Q2-12 Q3-12 Q4-12 Q1-13 OREO Non-Performing Loans Classified Accruing Loans (1) Watch Loans $416 $409 $417 $398 $395* * Includes $20 million of potential problem loans and non- performing assets acquired from Western Liberty in October 2012; Q1 2013 Accruing TDR’s total $94.5 million NPA’s $173 Potential Problem Loans $222
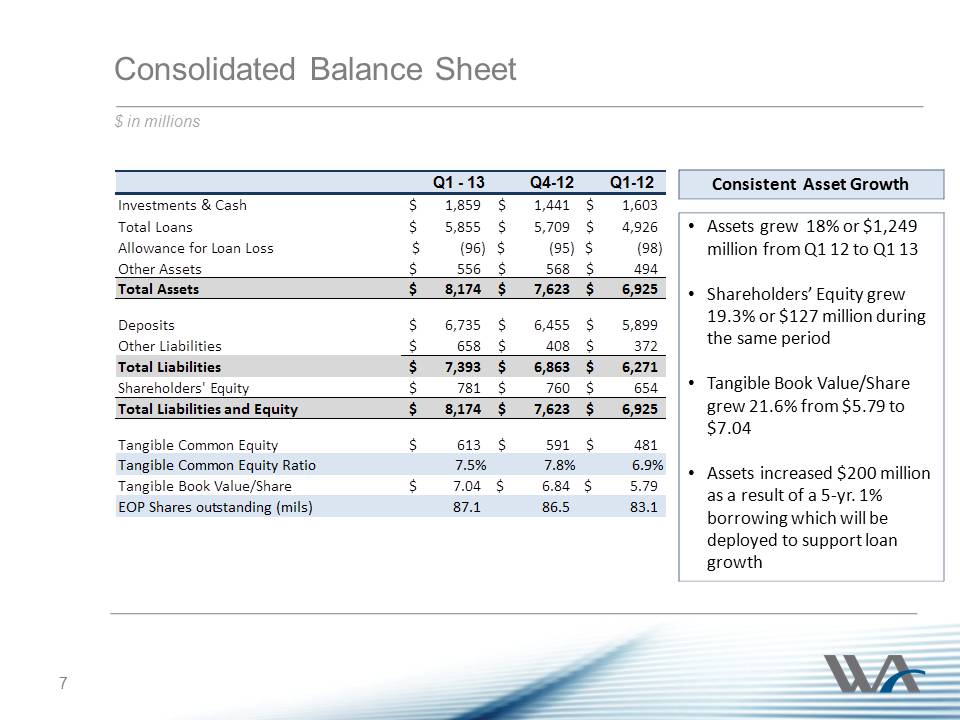
Consolidated Balance Sheet $ in millions Consistent Asset Growth •Assets grew 18% or $1,249 million from Q1 12 to Q1 13 •Shareholders’ Equity grew 19.3% or $127 million during the same period •Tangible Book Value/Share grew 21.6% from $5.79 to $7.04 •Assets increased $200 million as a result of a 5-yr. 1% borrowing which will be deployed to support loan growth 7
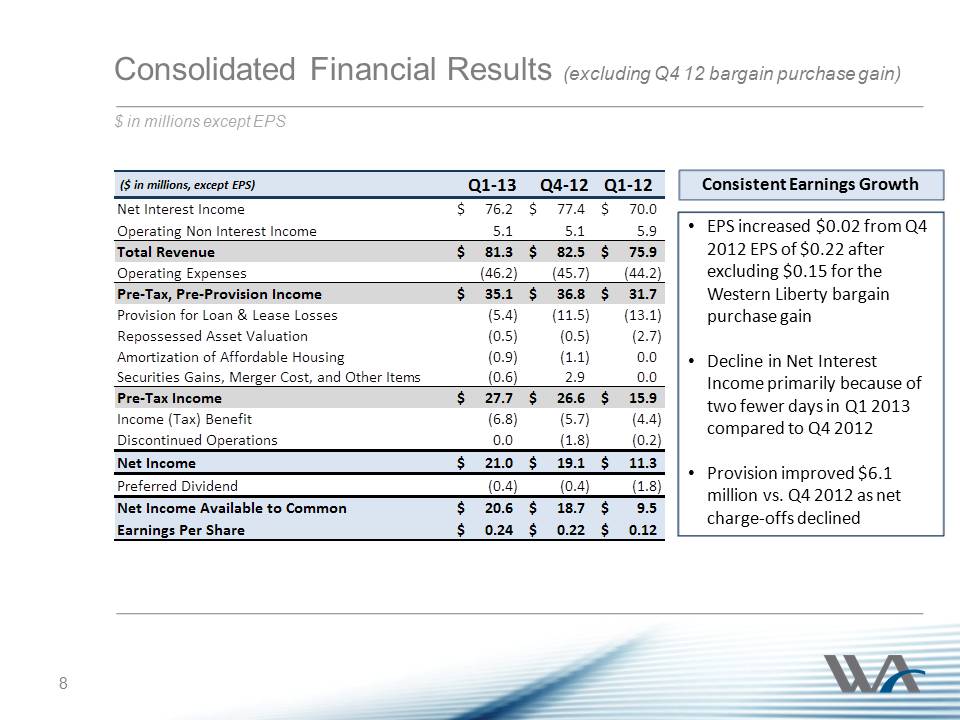
8Consolidated Financial Results (excluding Q4 12 bargain purchase gain) Consistent Earnings Growth •EPS increased $0.02 from Q4 2012 EPS of $0.22 after excluding $0.15 for the Western Liberty bargain purchase gain •Decline in Net Interest Income primarily because of two fewer days in Q1 2013 compared to Q4 2012 •Provision improved $6.1 million vs. Q4 2012 as net charge-offs declined 8 $ in millions except EPS ($ in millions, except EPS) Q1-13Q4-12Q1-12 Net Interest Income 76.2$ 77.4$ 70.0$ Operating Non Interest Income5.15.15.9Total Revenue81.3$ 82.5$ 75.9$ Operating Expenses46.2(45.7)44.2Pre-Tax, Pre-Provision Income35.1$ 36.8$ 31.7$ Provision for Loan & Lease Losses (5.4)(11.5)(13.1)Repossessed Asset Valuation (0.5)(0.5)(2.7)Amortization of Affordable Housing(0.9)(1.1)0.0Securities Gains, Merger Cost, and Other Items(0.6)2.90.0Pre-Tax Income 27.7$ 26.6$ 15.9$ Income (Tax) Benefit(6.8)(5.7)(4.4)Discontinued Operations0.0(1.8)(0.2)Net Income 20.9$ 19.1$ 11.3$ Preferred Dividend(0.4)(0.4)(1.8)Net Income Available to Common 20.6$ 18.7$ 9.5$ Earnings Per Share0.24$ 0.22$ 0.12$
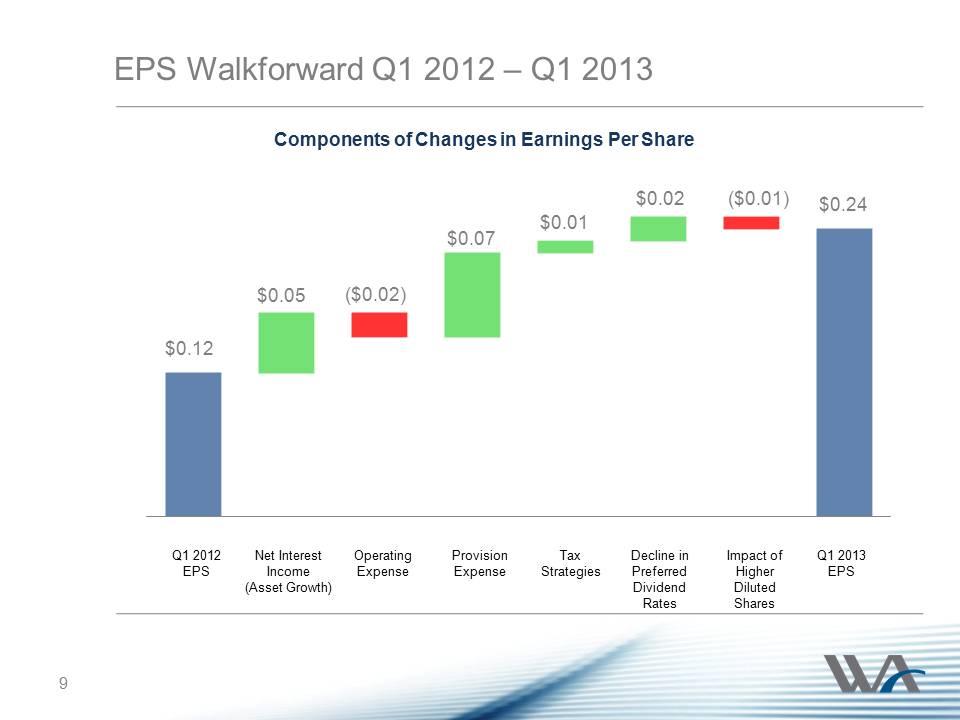
9 EPS Walkforward Q1 2012 – Q1 2013 Components of Changes in Earnings Per Share $0.12 $0.05 ($0.02) $0.07 $0.01 $0.02 ($0.01) $0.24 Q1 2012 EPS Net Interest Income (Asset Growth) Provision Expense Tax Strategies Q1 2013 EPS 9 Operating Expense Decline in Preferred Dividend Rates Impact of Higher Diluted Shares
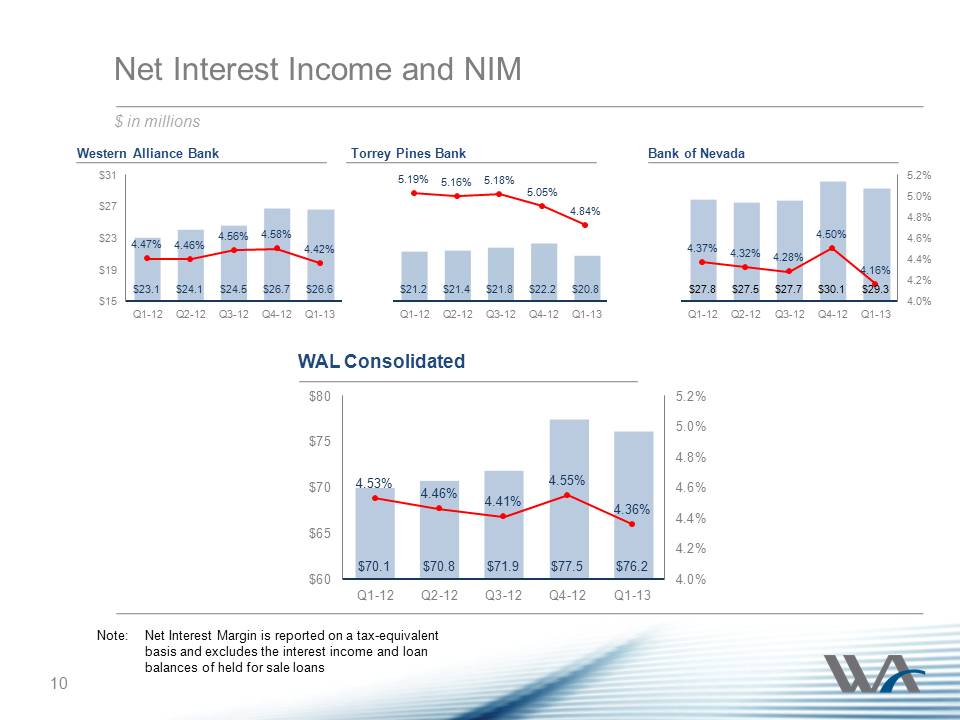
10 $27.8 $27.5 $27.7 $30.1 $29.3 4.37% 4.32% 4.28% 4.50% 4.16% 4.0% 4.2% 4.4% 4.6% 4.8% 5.0% 5.2% Q1-12 Q2-12 Q3-12 Q4-12 Q1-13 $23.1 $24.1 $24.5 $26.7 $26.6 4.47% 4.46% 4.56% 4.58% 4.42% $15 $19 $23 $27 $31 Q1-12 Q2-12 Q3-12 Q4-12 Q1-13 $21.2 $21.4 $21.8 $22.2 $20.8 5.19% 5.16% 5.18% 5.05% 4.84% Q1-12 Q2-12 Q3-12 Q4-12 Q1-13 $70.1 $70.8 $71.9 $77.5 $76.2 4.53% 4.46% 4.41% 4.55% 4.36% 4.0% 4.2% 4.4% 4.6% 4.8% 5.0% 5.2% $60 $65 $70 $75 $80 Q1-12 Q2-12 Q3-12 Q4-12 Q1-13 Net Interest Income and NIM $ in millions Western Alliance Bank 10 Bank of Nevada Torrey Pines Bank WAL Consolidated Note: Net Interest Margin is reported on a tax-equivalent basis and excludes the interest income and loan balances of held for sale loans
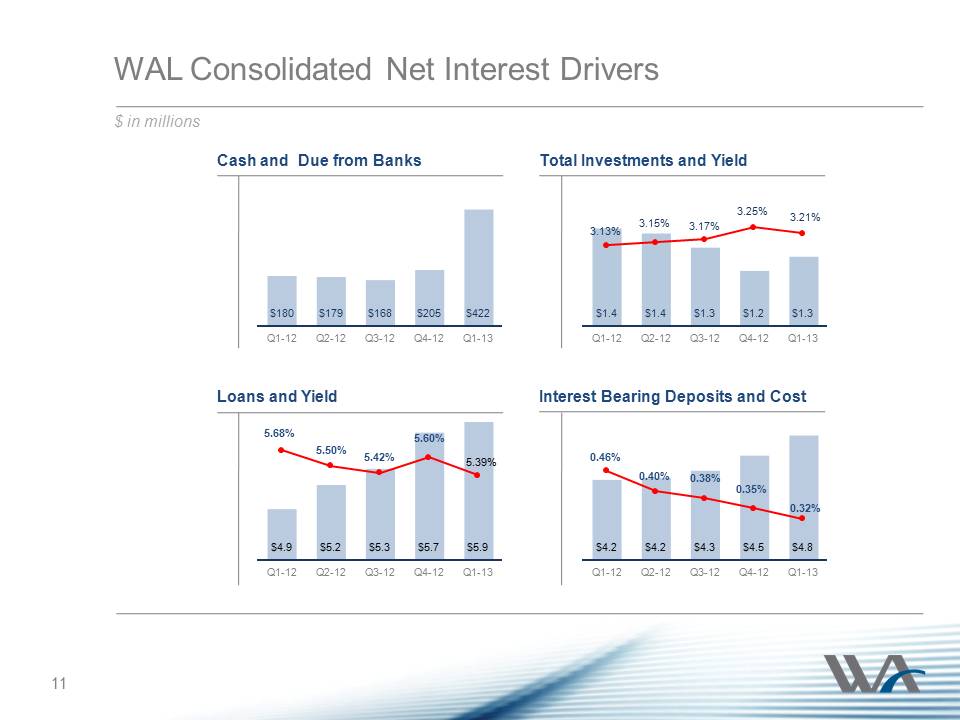
$4.9 $5.2 $5.3 $5.7 $5.9 5.68% 5.50% 5.42% 5.60% 5.39% Q1-12 Q2-12 Q3-12 Q4-12 Q1-13 $180 $179 $168 $205 $422 Q1-12 Q2-12 Q3-12 Q4-12 Q1-13 $1.4 $1.4 $1.3 $1.2 $1.3 3.13% 3.15% 3.17% 3.25% 3.21% Q1-12 Q2-12 Q3-12 Q4-12 Q1-13 $4.2 $4.2 $4.3 $4.5 $4.8 0.46% 0.40% 0.38% 0.35% 0.32% Q1-12 Q2-12 Q3-12 Q4-12 Q1-13 WAL Consolidated Net Interest Drivers $ in millions Cash and Due from Banks Loans and Yield Total Investments and Yield Interest Bearing Deposits and Cost 11
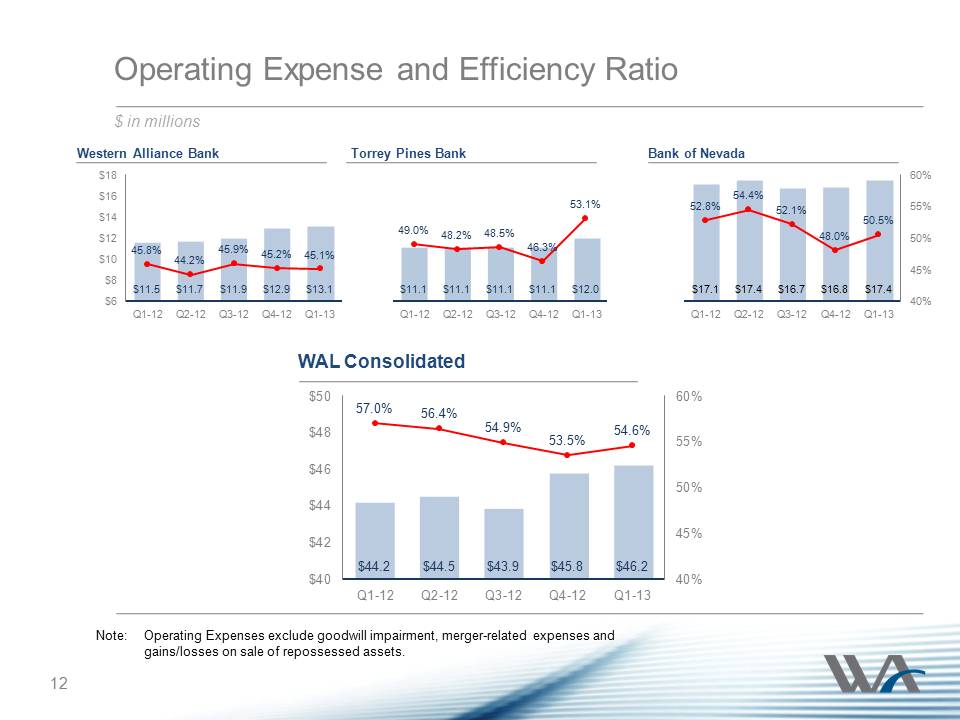
12 Operating Expense and Efficiency Ratio $ in millions $17.1 $17.4 $16.7 $16.8 $17.4 52.8% 54.4% 52.1% 48.0% 50.5% 40% 45% 50% 55% 60% Q1-12 Q2-12 Q3-12 Q4-12 Q1-13 $11.5 $11.7 $11.9 $12.9 $13.1 45.8% 44.2% 45.9% 45.2% 45.1% $6 $8 $10 $12 $14 $16 $18 Q1-12 Q2-12 Q3-12 Q4-12 Q1-13 $11.1 $11.1 $11.1 $11.1 $12.0 49.0% 48.2% 48.5% 46.3% 53.1% Q1-12 Q2-12 Q3-12 Q4-12 Q1-13 $44.2 $44.5 $43.9 $45.8 $46.2 57.0% 56.4% 54.9% 53.5% 54.6% 40% 45% 50% 55% 60% $40 $42 $44 $46 $48 $50 Q1-12 Q2-12 Q3-12 Q4-12 Q1-13 Western Alliance Bank Bank of Nevada Torrey Pines Bank WAL Consolidated 12 Note: Operating Expenses exclude goodwill impairment, merger-related expenses and gains/losses on sale of repossessed assets.
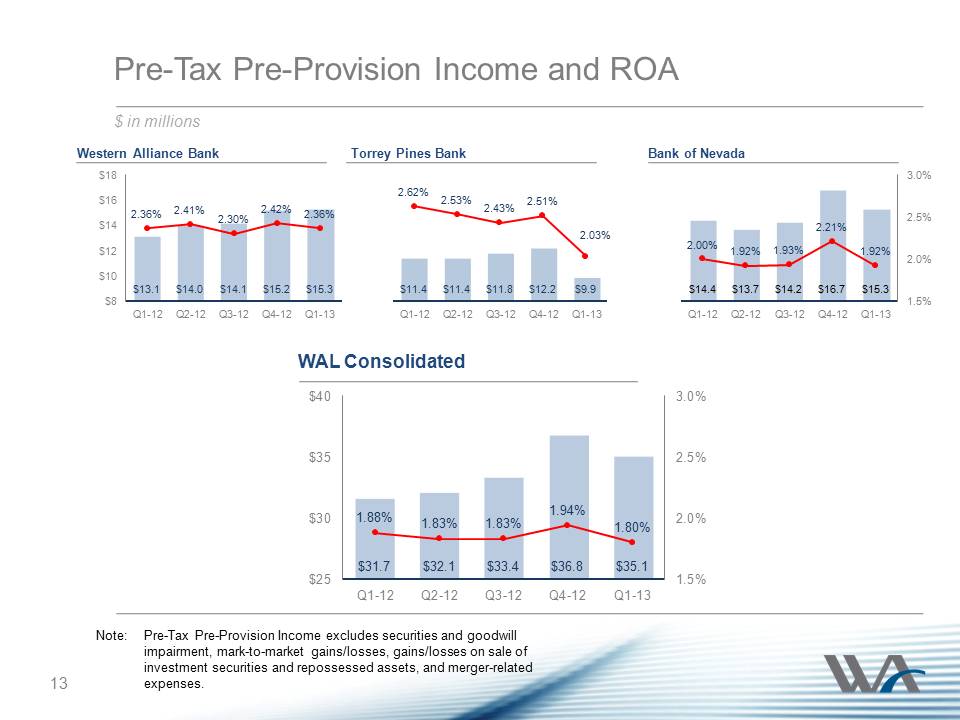
13 Pre-Tax Pre-Provision Income and ROA $ in millions $14.4 $13.7 $14.2 $16.7 $15.3 2.00% 1.92% 1.93% 2.21% 1.92% 1.5% 2.0% 2.5% 3.0% Q1-12 Q2-12 Q3-12 Q4-12 Q1-13 $13.1 $14.0 14.1 $15.2 $15.3 2.36% 2.41% 2.30% 2.42% 2.36% $8 $10 $12 $14 $16 $18 Q1-12 Q2-12 Q3-12 Q4-12 Q1-13 $11.4 $11.4 $11.8 $12.2 $9.9 2.62% 2.53% 2.43% 2.51% 2.03% Q1-12 Q2-12 Q3-12 Q4-12 Q1-13 $31.7 $32.1 $33.4 $36.8 $35.1 1.88% 1.83% 1.83% 1.94% 1.80% 1.5% 2.0% 2.5% 3.0% $25 $30 $35 $40 Q1-12 Q2-12 Q3-12 Q4-12 Q1-13 Western Alliance Bank Bank of Nevada Torrey Pines Bank WAL Consolidated 13 Note: Pre-Tax Pre-Provision Income excludes securities and goodwill impairment, mark-to-market gains/losses, gains/losses on sale of investment securities and repossessed assets, and merger-related expenses.
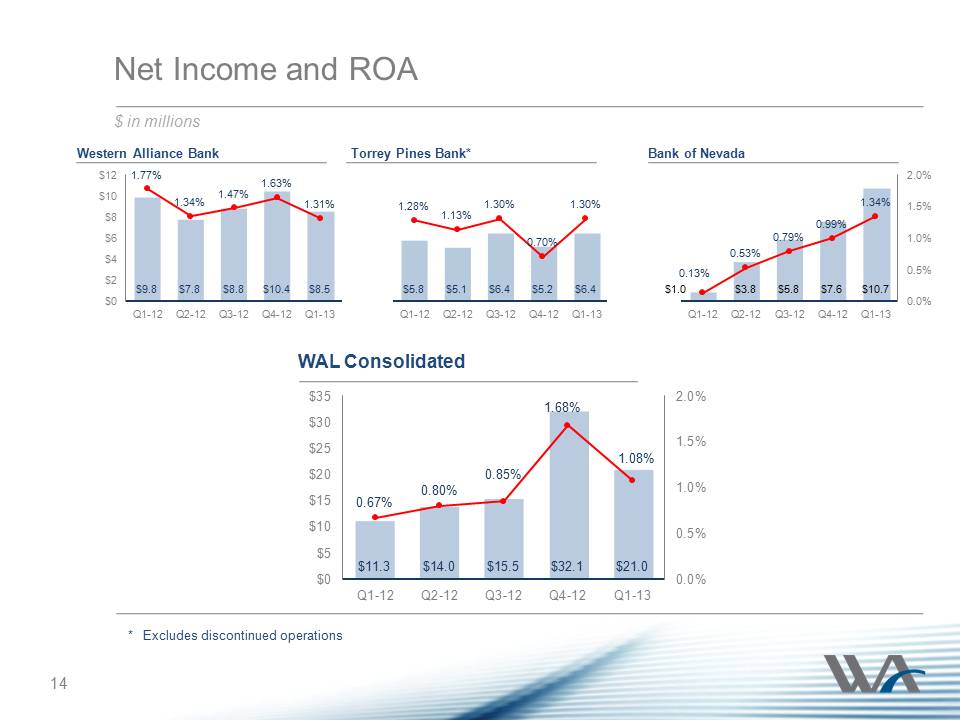
14 Net Income and ROA $ in millions $1.0 $3.8 $5.8 $7.6 $10.7 0.13% 0.53% 0.79% 0.99% 1.34% 0.0% 0.5% 1.0% 1.5% 2.0% Q1-12 Q2-12 Q3-12 Q4-12 Q1-13 $9.8 $7.8 $8.8 $10.4 $8.5 1.77% 1.34% 1.47% 1.63% 1.31% $0 $2 $4 $6 $8 $10 $12 Q1-12 Q2-12 Q3-12 Q4-12 Q1-13 $5.8 $5.1 $6.4 $5.2 $6.4 1.28% 1.13% 1.30% 0.70% 1.30% Q1-12 Q2-12 Q3-12 Q4-12 Q1-13 $11.3 $14.0 $15.5 $32.1 $21.0 0.67% 0.80% 0.85% 1.68% 1.08% 0.0% 0.5% 1.0% 1.5% 2.0% $0 $5 $10 $15 $20 $25 $30 $35 Q1-12 Q2-12 Q3-12 Q4-12 Q1-13 Western Alliance Bank Bank of Nevada Torrey Pines Bank* WAL Consolidated 14 * Excludes discontinued operations
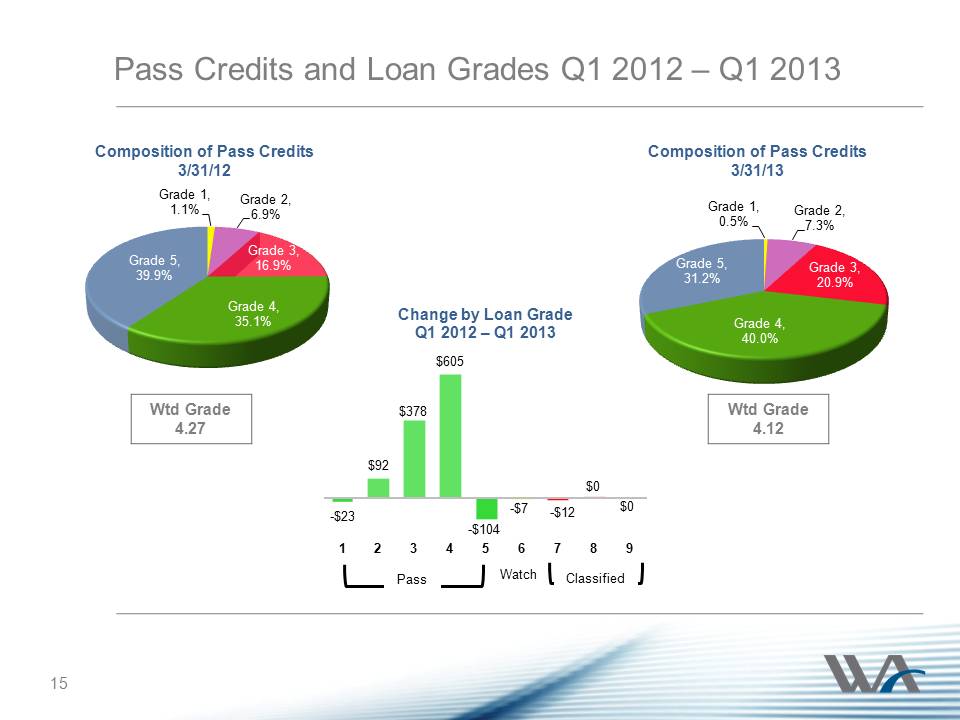
15 Pass Credits and Loan Grades Q1 2012 – Q1 2013 -$23 $92 $378 $605 -$104 -$7 -$12 $0 $0 1 2 3 4 5 6 7 8 9 Change by Loan Grade Q1 2012 – Q1 2013 Pass Watch Composition of Pass Credits 3/31/12 Grade 1, 1.1% Grade 2, 6.9% Grade 3, 16.9% Grade 4, 35.1% Grade 5, 39.9% Grade 1, 0.5% Grade 2, 7.3% Grade 3, 20.9% Grade 4, 40.0% Grade 5, 31.2% Composition of Pass Credits 3/31/13 Wtd Grade 4.27 Wtd Grade 4.12 Classified 15
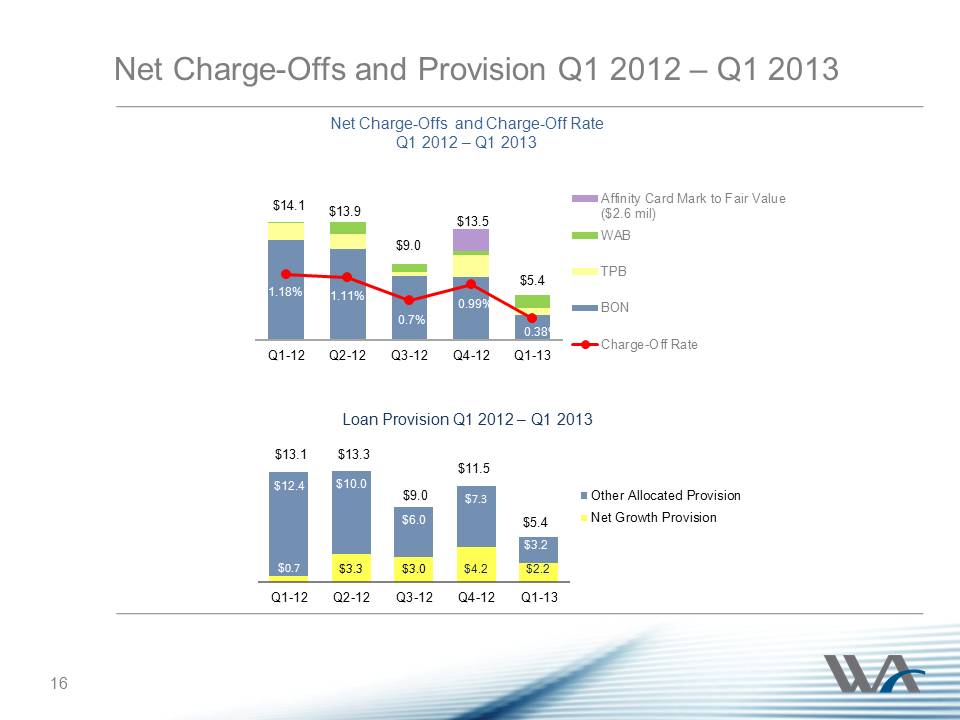
16 Net Charge-Offs and Provision Q1 2012 – Q1 2013 $14.1 $13.9 $9.0 $13.5 $5.4 1.18% 1.11% 0.7% 0.99% 0.38% Q1-12 Q2-12 Q3-12 Q4-12 Q1-13 Affinity Card Mark to Fair Value ($2.6 mil) WAB TPB BON Charge-Off Rate $0.7 $3.3 $3.0 $4.2 $2.2 $12.4 $10.0 $6.0 $7.3 $3.2 Q1-12 Q2-12 Q3-12 Q4-12 Q1-13 Other Allocated Provision Net Growth Provision Net Charge-Offs and Charge-Off Rate Q1 2012 – Q1 2013 Loan Provision Q1 2012 – Q1 2013 16 $13.1 $13.3 $9.0 $11.5 $5.4
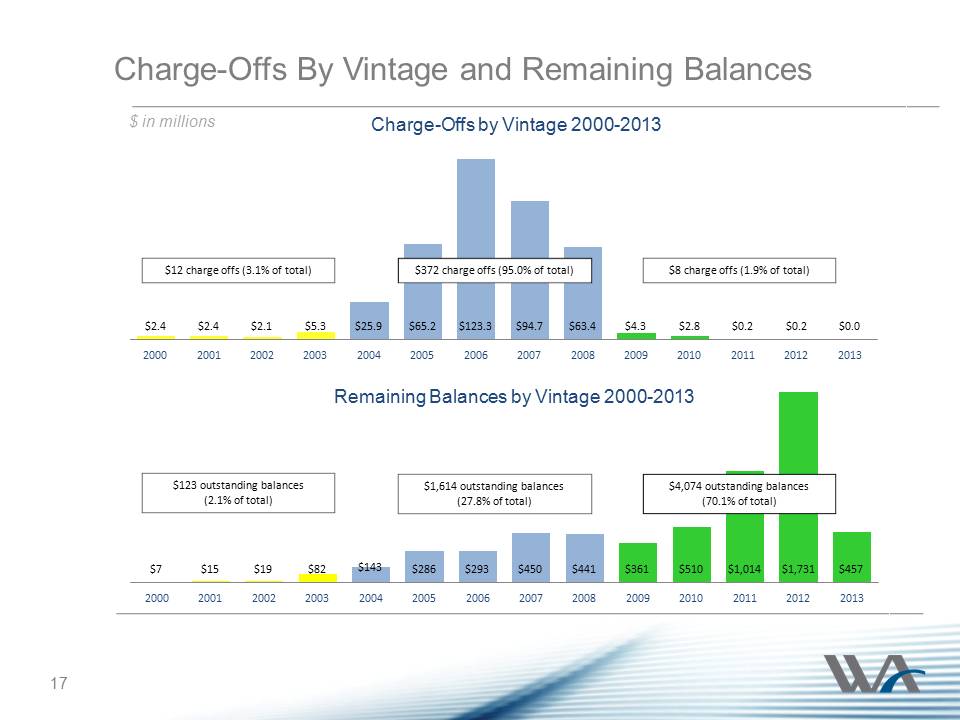
Charge-Offs By Vintage and Remaining Balances $ in millions $7 $15 $19 $82 $143 $286 $293 $450 $441 $361 $510 $1,014 $1,731 $457 2000 2001 2002 2003 2004 2005 2006 2007 2008 2009 2010 2011 2012 2013 $2.4 $2.4 $2.1 $5.3 $25.9 $65.2 $123.3 $94.7 $63.4 $4.3 $2.8 $0.2 $0.2 $0.0 2000 2001 2002 2003 2004 2005 2006 2007 2008 2009 2010 2011 2012 2013 Remaining Balances by Vintage 2000-2013 Charge-Offs by Vintage 2000-2013 $123 outstanding balances (2.1% of total) $372 charge offs (95.0% of total) $8 charge offs (1.9% of total) $12 charge offs (3.1% of total) $1,614 outstanding balances (27.8% of total) $4,074 outstanding balances (70.1% of total) 17
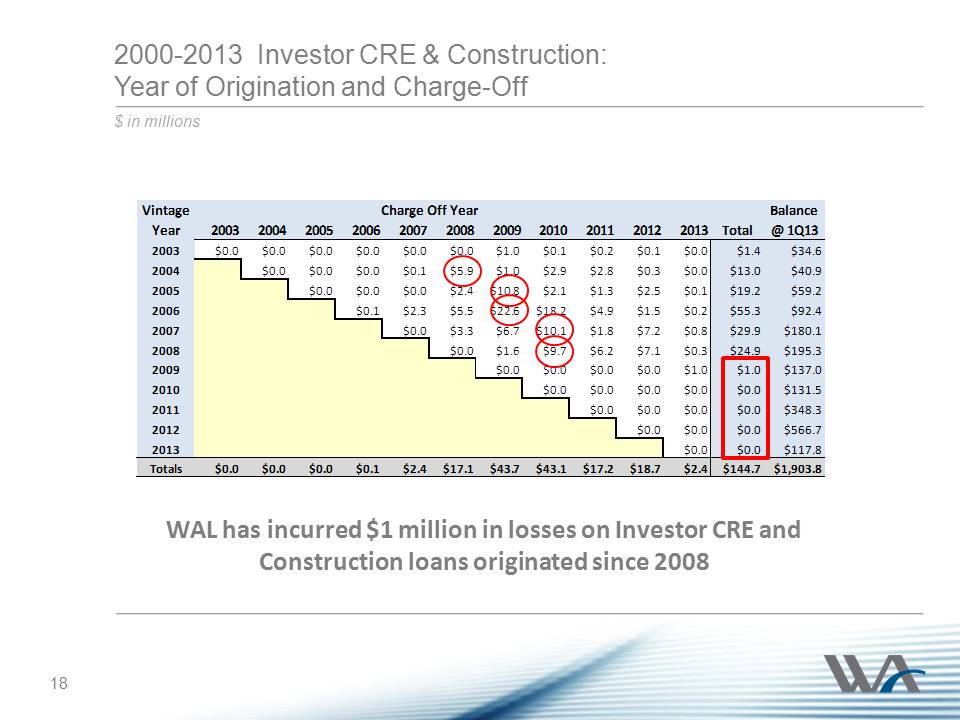
2000-2013 Investor CRE & Construction: Year of Origination and Charge-Off $ in millions WAL has incurred $1 million in losses on Investor CRE and Construction loans originated since 2008 18
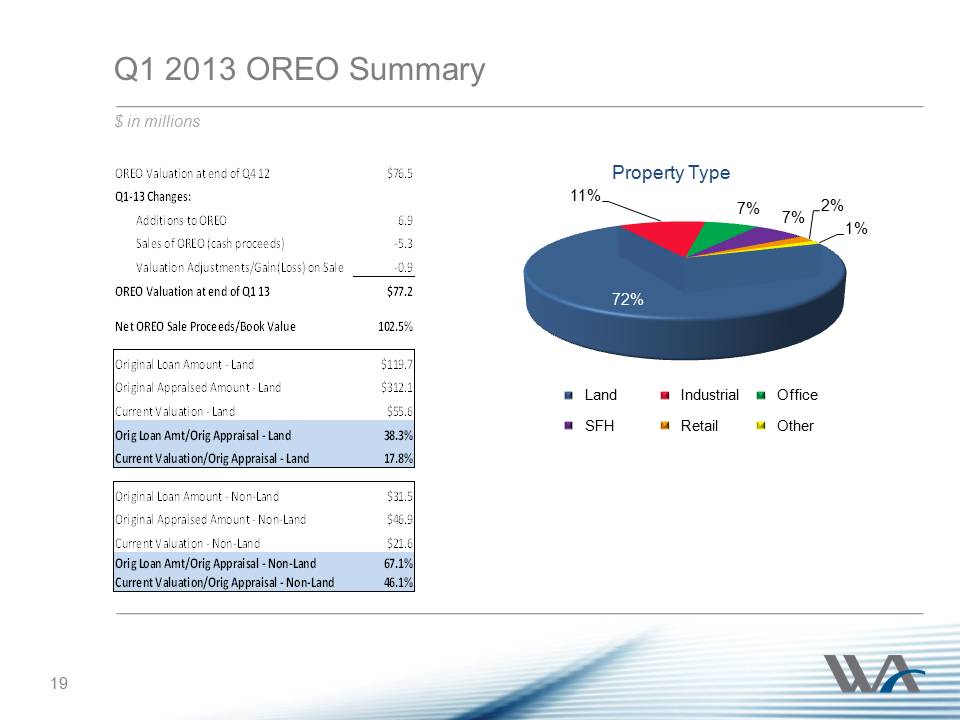
Q1 2013 OREO Summary $ in millions OREO Valuation at end of Q4 12$76.5Q1-13 Changes:Additions to OREO6.9Sales of OREO (cash proceeds)-5.3Valuation Adjustments/Gain(Loss) on Sale-0.9OREO Valuation at end of Q1 13$77.2Net OREO Sale Proceeds/Book Value102.5%Original Loan Amount - Land$119.7Original Appraised Amount - Land$312.1Current Valuation - Land$55.6Orig Loan Amt/Orig Appraisal - Land38.3%Current Valuation/Orig Appraisal - Land17.8%Original Loan Amount - Non-Land$31.5Original Appraised Amount - Non-Land$46.9Current Valuation - Non-Land$21.6Orig Loan Amt/Orig Appraisal - Non-Land67.1%Current Valuation/Orig Appraisal - Non-Land46.1%72% 11% 7% 7% 2% 1% Property Type Land Industrial Office SFH Retail Other 19
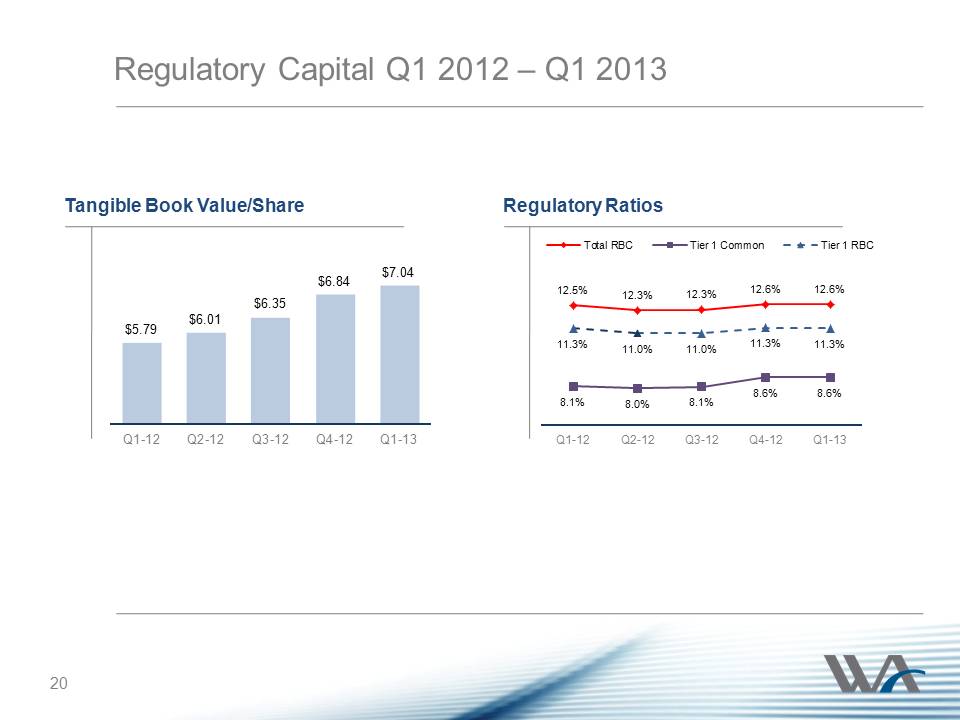
Regulatory Capital Q1 2012 – Q1 2013 $5.79 $6.01 $6.35 $6.84 $7.04 Q1-12 Q2-12 Q3-12 Q4-12 Q1-13 Tangible Book Value/Share 12.5% 12.3% 12.3% 12.6% 12.6% 8.1% 8.0% 8.1% 8.6% 8.6% 11.3% 11.0% 11.0% 11.3% 11.3% Q1-12 Q2-12 Q3-12 Q4-12 Q1-13 Total RBC Tier 1 Common Tier 1 RBC Regulatory Ratios 20
Outlook 2nd Quarter 2013 oBalance Sheet Growth oNet Interest Margin oEfficiency Ratio oAsset Quality oAcquisition Integration 21
Question & Answer 22 WAL Q1 2013 Earnings Presentation
Forward Looking Statements
This presentation contains forward-looking statements that relate to
expectations, beliefs, projections, future plans and strategies,
anticipated events or trends and similar expressions concerning matters
that are not historical facts. The forward-looking statements contained
herein reflect our current views about future events and financial
performance and are subject to risks, uncertainties, assumptions and
changes in circumstances that may cause our actual results to differ
significantly from historical results and those expressed in any
forward-looking statement. Some factors that could cause actual results
to differ materially from historical or expected results include:
factors listed in the Company’s annual report on Form 10-K as filed with
the Securities and Exchange Commission; changes in general economic
conditions, either nationally or locally in the areas in which we
conduct or will conduct our business; inflation, interest rate, market
and monetary fluctuations; increases in competitive pressures among
financial institutions and businesses offering similar products and
services; higher defaults on our loan portfolio than we expect; changes
in management’s estimate of the adequacy of the allowance for loan
losses; legislative or regulatory changes or changes in accounting
principles, policies or guidelines; supervisory actions by regulatory
agencies which may limit our ability to pursue certain growth
opportunities; management’s estimates and projections of interest rates
and interest rate policy; the execution of our business plan; and other
factors affecting the financial services industry generally or the
banking industry in particular. We do not intend and disclaim any duty
or obligation to update or revise any industry information or
forward-looking statements set forth in this presentation to reflect new
information, future events or otherwise. 23