Attached files
| file | filename |
|---|---|
| 8-K - FORM 8-K - POPULAR, INC. | d523079d8k.htm |
 Financial
Results Financial Results
First Quarter 2013
First Quarter 2013
Exhibit 99.1 |
 1
Forward Looking Statements |
 Q1 2013
Highlights & Recent Events 2
Earnings
•
Adjusted net income of $60M
Credit
Recent Events
Capital
•
Strong capital ratios: Common Equity Tier One ratio at 12.4%
•
$1.7B in excess of CET1 over current well-capitalized threshold
•
Tangible Book Value/Share at March 31, 2013: $31.21
Strong margins: Popular, Inc. 4.39%, BPPR 5.18%
•
Continued improvement across key metrics
Excluding
bulk
sale
and
covered
loans:
NPLs
declined
by
$42M,
NCOs
down
$20M
$58M
adjusted
provision
lowest
in
this
credit
cycle
Total
NPL
inflows
decreased
by
$60M
to
lowest
level
in
three
years
Total
NPL-to-Loans
ratio
decreased
by
193
bps
to
4.86%
Total
NPA-to-Assets
ratio
decreased
by
164
bps
to
3.84%
•
Successful EVERTEC IPO highlights significant value of BPOP stake and results in
partial monetization in early Q2
•
Puerto Rico government retirement system measures signed into law; other
important initiatives completed or in process
•
Bulk sale further accelerates credit-quality improvements |
 NPA Sale
Substantially De-risked Balance Sheet •
Pricing:
Purchase price: $338M (34% of UPB)
Book Value of assets sold: $509M¹
$92M in cash received at closing
•
Deal structure:
Included $392M in commercial and construction NPLs, $108M in residential and
commercial OREOs and $9M of other loans
Sold to a third party financial group
Retained 24.9% interest in the acquiring entity, ensuring we participate in any
upside
Provided
$247M
in
seller
financing
to
entity
to
fund
a
portion
of
purchase
price,
costs-to-complete amounts and expenses of certain projects, working capital and
other items
•
Deal structure is similar to 2011 NPL sale transaction, which has performed well:
Credit facilities have been substantially repaid sooner than expected
Value of our JV interest has appreciated
3
¹
Excludes $25 Million of OREO properties sold that are subject to post closing conditions and
therefore did not qualify for derecognition for accounting purposes.
|
 EVERTEC IPO
4
•
“EVTC”
commenced trading on April 12 on NYSE
Transaction
Overview
Additional
Value
Q2 Impact on
Balance Sheet
•
BPOP retaining stake of 33.5% (26.5M shares) following IPO
•
Value of $530M based on the public offering price of $20 versus
our pro-forma book value after IPO of $75M
•
Bank holding company will receive approximately $254M in cash
from IPO proceeds and repayment of EVERTEC debt held by
Popular
•
After-tax gain will increase Common Equity Tier 1
Price highlights significant value of BPOP stake
Overall EVERTEC enterprise value of $2.3B, IPO equity value of $1.6B
Offering upsized to $505M
Sold 8.8M shares and will record after-tax gain of $169M in Q2
|
 Addressing Key
Areas of Shareholder Focus •
Reducing
non-performing
assets
(excluding
covered
loans)
Total NPAs down by $885M or 42% YoY
Total NPLs held in portfolio declined $631M or 38% YoY
–
NPL declines of $498M in commercial,
$66M in mortgage and $43M in
legacy
Reduced NPL HFS balance to $18M from $672M in Q4 2010
5
Credit
TARP
•
TARP repayment
EVERTEC IPO and NPA sale continued to improve the company’s
position for shareholder-friendly exit from TARP, which remains
subject to regulatory approval |
 Financial Summary
(unaudited) 6
¹
Includes $8.8 million of negative valuation adjustments on loans held for sale, which were
transferred to held-in-portfolio subsequent to the sale ²Includes tax
benefit related to EVERTEC minority ownership of $31.6 million ¹
²
$ in thousands (except per share data)
US GAAP
Non GAAP
In thousands, except per share amount
Actual
NPA Sale
Adjusted
Q4 2012
Adjusted
Variance
Net interest income
$345,347
$345,347
$350,411
($5,064)
Service fees & other oper. income
109,018
109,018
150,249
(41,231)
Gain on sale of investments, loans & trading profits
(65,177)
(72,087)
6,910
19,576
(12,666)
FDIC loss-share expense
(26,266)
(26,266)
(36,824)
10,558
Gross revenues
362,922
(72,087)
435,009
483,412
(48,403)
Provision for loan losses (excluding covered loans)
206,300
(148,823)
57,477
86,256
(28,779)
Provision for loan losses
(covered WB loans)
17,556
17,556
(3,445)
21,001
Total provision
223,856
(148,823)
75,033
82,811
(7,778)
Net revenues
139,066
(220,910)
359,976
400,601
(40,625)
Personnel costs
115,989
115,989
116,325
(336)
Other operating expenses
200,261
37,051
163,210
180,422
(17,212)
Total operating expenses
316,250
37,051
279,199
296,747
(17,548)
Income before tax
(177,184)
(257,961)
80,777
103,854
(23,077)
Income tax (benefit) expense
(56,877)
(77,388)
20,511
19,914
597
Net (loss) income
($120,307)
($180,573)
$60,266
$83,940
($23,674)
EPS
($1.18)
$0.81
NIM
4.39%
4.41%
Tangible book value per share (quarter end)
$31.21
$32.55
Market price (quarter end)
$27.60
$20.79
Q1 2013 |
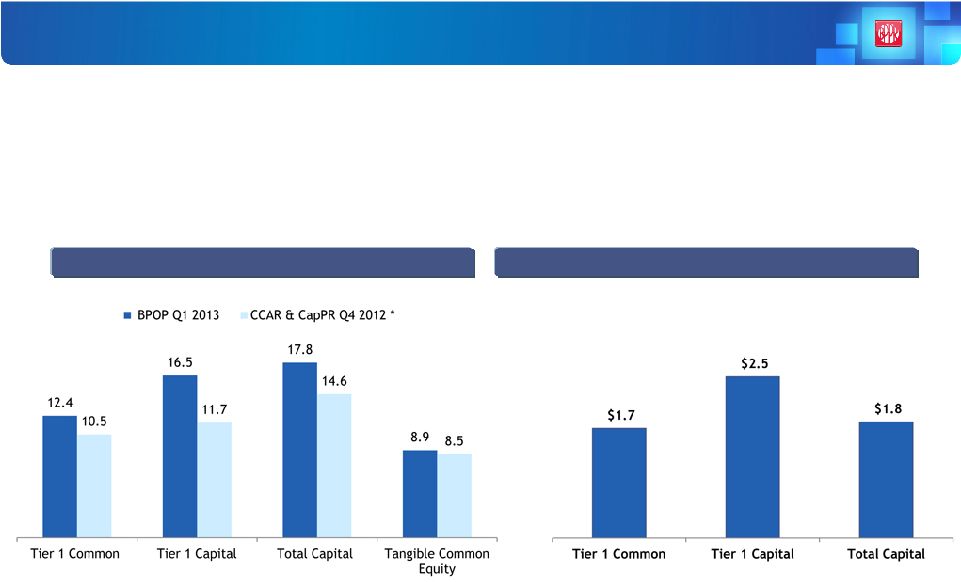 Capital
Remains Strong Post-NPA Sale 7
Current Risk Weighted Assets are approximately $23.6 billion
Capital Ratios %
Excess Capital ($ in billions)
**Excess
capital
over
“well
capitalized”
Basel
I
threshold
*Averages
for
30
bank
holding
Companies
with
$50
billion
or
more
of
total
consolidated assets, consisting of 19 firms included in Comprehensive Capital Analysis
and Review (CCAR) and 11 firms included in Capital Plan Review (CapPR).
•
Tier 1 Common Equity capital ratio of 12.4% in Q1 exceeds current
well-capitalized guideline by $1.7B
**
** |
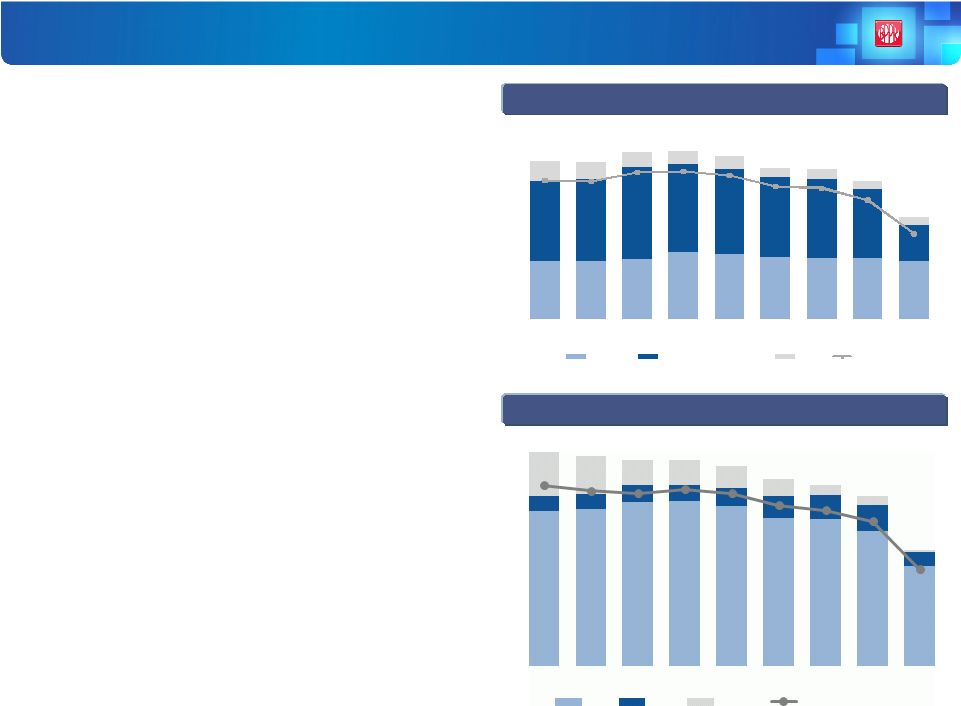 Asset Sale
Strengthens Credit Quality •
Non-performing loans held-in-portfolio are down by
$375M or 26% QoQ and $631M or 38% YoY
•
NPL to Loans at 4.86% in Q1 13 vs. 6.79% in Q4 12,
and 8.21% in Q1 12
•
Remaining NPLs are mostly in PR mortgages and to
lesser extent in US commercial loans
•
Non-performing assets declined by $565M or 32%
QoQ and $885M or 42% YoY
•
Decline of $112M in OREO to $155M was mainly
driven by bulk sale, which included $58M and $50M
in commercial and mortgage OREO, respectively
Non-Performing Loans HIP ($M)
Non-Performing Assets ($M)
7.9%
7.9%
8.4%
8.4%
8.2%
7.6%
7.5%
6.8%
4.9%
0.0%
2.0%
4.0%
6.0%
8.0%
10.0%
Q1 11
Q2 11
Q3 11
Q4 11
Q1 12
Q2 12
Q3 12
Q4 12
Q1 13
Mortgage
Commercial & Construction
Other
NPL/Loans (HIP)
$1,637
$1,682
$1,563
$1,550
$1,425
$1,738
$1,732
$1,625
$1,051
Metrics exclude covered loans
8
$2,257
$2,214
$2,168
$2,173
$2,108
$1,968
$1,911
$1,788
$1,223
7.1%
6.9%
6.8%
7.0%
6.8%
6.4%
6.2%
5.7%
3.8%
Q1 11
Q2 11
Q3 11
Q4 11
Q1 12
Q2 12
Q3 12
Q4 12
Q1 13
NPLs
OREO
NPL HFS
NPAs/Total Assets |
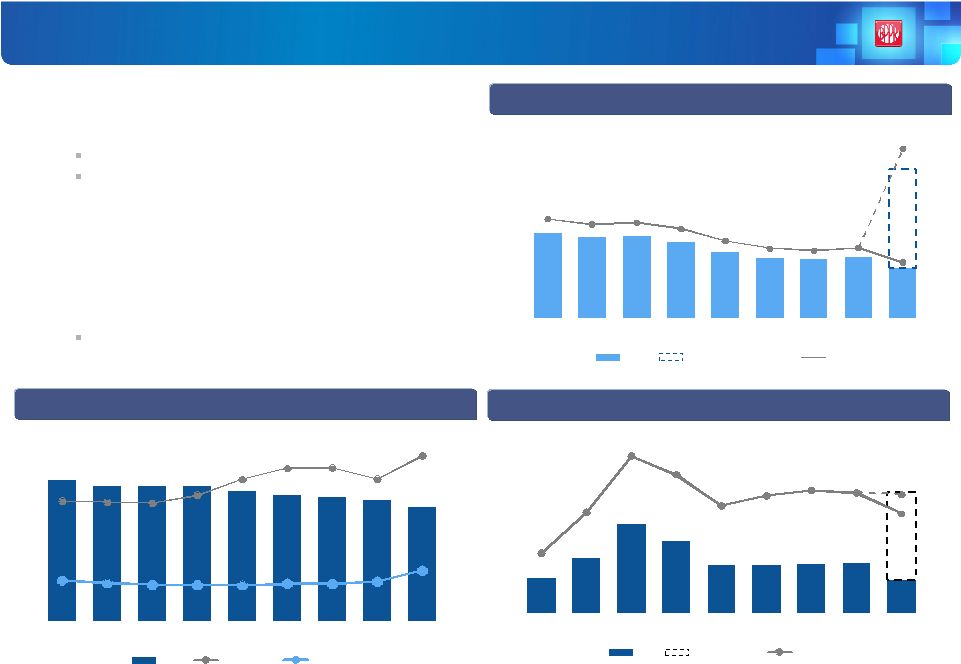
 Total NPL
Inflows ($M) NPL Inflows at 3-Year Lows
•
Total NPL inflows decreased by $60 million QoQ,
driven by mortgage NPL inflows, and are at the
lowest level in three years
•
Commercial, construction and legacy NPL inflows
remained stable at lowest levels of credit cycle in
both PR and US
Mortgage NPL Inflows ($M)
Commercial, Construction & Legacy NPL Inflows ($M)
9
Excludes consumer loans
$67
$92
$87
$84
$55
$51
$52
$34
$26
$271
$273
$397
$333
$279
$231
$257
$210
$158
Q1 11
Q2 11
Q3 11
Q4 11
Q1 12
Q2 12
Q3 12
Q4 12
Q1 13
US Inflows
PR Inflows
-46%
($154M)
$9
$13
$10
$8
$6
$6
$10
$8
$5
$140
$154
$175
$232
$187
$166
$157
$167
$110
Q1 11
Q2 11
Q3 11
Q4 11
Q1 12
Q2 12
Q3 12
Q4 12
Q1 13
US Inflows
PR Inflows
$58
$79
$77
$76
$48
$45
$42
$26
$21
$131
$119
$222
$101
$93
$65
$100
$43
$48
Q1 11
Q2 11
Q3 11
Q4 11
Q1 12
Q2 12
Q3 12
Q4 12
Q1 13
US Inflows
PR Inflows
Metrics exclude covered loans |
 Continuous
Improvement in Asset Quality •
NCOs include $163.1M related to NPA bulk sale
Excluding impact of the sale:
Decline of $20M vs. Q4 2012
NCO ratio under 2% for fourth consecutive quarter,
reaching 2008 levels
•
ALLL decreased 26 bps to 2.70% of loans, reflecting
improved credit performance
NPL reduction drove increase of ALLL/NPL to 56%
ALLL ($M), ALLL-to-NCO and ALLL-to-NPL Ratios
NCO ($M) and NCO-to-HIP Loan Ratio
Provision ($M) and Provision-to-NCO Ratio
10
Metrics exclude covered loans
$727
$690
$693
$690
$665
$649
$636
$622
$584
130%
129%
128%
137%
154%
165%
166%
154%
179%
44%
42%
40%
40%
40%
41%
41%
44%
56%
Q1 11
Q2 11
Q3 11
Q4 11
Q1 12
Q2 12
Q3 12
Q4 12
Q1 13
ALLL
ALLL/NCO
ALLL/NPL
$60
$96
$151
$124
$83
$82
$84
$86
$58
$149
43%
72%
111%
98%
76%
83%
87%
86%
84%
71%
Q1 11
Q2 11
Q3 11
Q4 11
Q1 12
Q2 12
Q3 12
Q4 12
Q1 13
PLL
NPL Sale PLL
PLL/NCO
$139
$133
$135
$126
$108
$98
$96
$101
$81
$163
2.74%
2.59%
2.64%
2.46%
2.13%
1.93%
1.87%
1.94%
4.66%
1.55%
Q1 11
Q2 11
Q3 11
Q4 11
Q1 12
Q2 12
Q3 12
Q4 12
Q1 13
NCO
NPL Sale Charge-offs
NCO%
•
Provision increased to $206M; includes $149M related to the
effect of the sale
•
Provision to NCOs in BPPR of 91% |
 Driving
Shareholder Value 11
Unique franchise in PR provides strong, stable revenue-generating capacity
Credit metrics continue to improve
NPA sale substantially accelerated de-risking
Strong capital position with excess Tier 1 Common Equity of $1.7B
After-tax gain of EVERTEC IPO will increase CET1 in Q2
Continue to build optionality for US operations and determine best path to
value creation
Actions drive us closer to TARP exit in the most shareholder-friendly fashion
|
 Appendix
 |
 Who We Are
– Popular, Inc.
Franchise
•
Financial services company
•
Headquartered in San Juan, Puerto Rico
•
$37 billion in assets (top 50 bank holding company in
the U.S.)
•
$22 billion in total loans
1
•
$27 billion in total deposits
•
276 branches serving customers in Puerto Rico,
New York, California, Florida, Illinois, U.S. Virgin
Islands, and New Jersey
•
NASDAQ ticker symbol: BPOP
•
Market Cap: $2.8 billion
2
1
Excludes covered portfolio
²
As of March 31, 2013
*Doing business as Popular Community Bank.
Summary Corporate Structure
Assets = $36.9bn
Popular Auto,
Inc.
Banco Popular
de Puerto Rico
Popular
Securities, Inc.
Assets = $27.9 bn
Assets = $8.7bn
Banco Popular
North America*
Puerto Rico operations
Selected
equity
investments
(first
two
under
“corporate”
segment
and
third
under
PR):
Popular
Insurance, Inc.
Popular North
America, Inc.
U.S. banking operations
Transaction processing,
business processes outsourcing
33.5% stake
Adjusted EBITDA of $169.6
million for 2012
Dominican
Republic bank
19.99% stake
2012 approximate
income $114
million
PRLP 2011 Holdings
Construction and
commercial loans vehicle
24.9% stake
PR Asset Portfolio 2013-1
International, LLC
Construction, commercial
loans and OREOs vehicle
24.9% stake
13 |
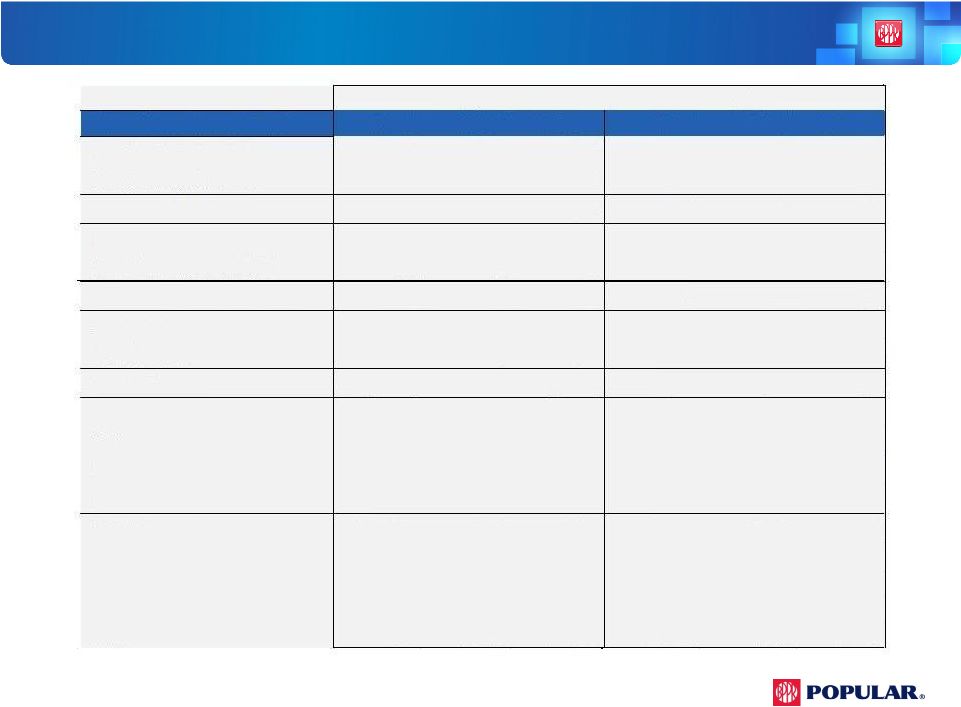
 14
Consolidated
Credit
Summary
(Excluding
Covered
Loans)
$ in millions
Q1 13
Q4 12
Q1 12
Loans Held in Portfolio (HIP)
$21,634
$20,984
$650
3.1%
$20,479
$1,155
5.7%
Performing HFS
183
258
(75)
(29.1%)
129
54
41.9%
NPL HFS
18
96
(78)
-81.3%
232
(214)
-92.3%
Total Non Covered Loans
21,835
21,338
$497
2.3%
20,840
$995
4.8%
Non-performing loans (NPLs)
$1,051
$1,425
($375)
-26.3%
$1,682
($632)
-37.5%
Commercial
$321
$665
($345)
-51.8%
$819
($498)
-60.8%
Construction
$51
$43
$8
17.5%
$69
($19)
-26.7%
Legacy
$36
$41
($5)
-12.1%
$79
($43)
-54.7%
Mortgage
$601
$630
($29)
-4.7%
$667
($66)
-10.0%
Consumer
$42
$46
($3)
-7.2%
$47
($5)
-10.6%
NPLs HIP to loans HIP
4.86%
6.79%
-1.9%
-28.5%
8.21%
-3.35%
-40.9%
Net charge-offs (NCOs)
$81
$101
($20)
-19.7%
$108
($27)
-25.1%
Commercial
$32
$49
($16)
-33.3%
$54
($22)
-40.4%
Construction
$0
($2)
$2
NM
($0)
$0
NM
Legacy
$2
$3
($1)
-44.0%
$4
($2)
-47.0%
Mortgage
$20
$20
($1)
-3.8%
$17
$2
12.1%
Consumer
$27
$31
($4)
-12.5%
$33
($6)
-17.6%
Write-downs bulk sale
$163
$0
$163
NM
$0
$163
NM
NCOs to average loans HIP
1.55%
1.94%
-0.4%
-20.1%
2.13%
-0.6%
-27.2%
Provision for loan losses (PLL)
1.10%
1
$86
($29)
(33.72%)
$83
($26)
(31.3%)
PLL to average loans HIP
1.66%
(0.6%)
(33.73%)
1.62%
(0.5%)
(30.9%)
PLL to NCOs
0.71x
1
0.86x
(0.15x)
(17.4%)
0.76x
(0.05x)
(6.58%)
Allowance for loan losses (ALL)
$584
$622
($37)
-6.1%
$665
($81)
-12.2%
ALL to loans
HIP
2.70%
2.96%
-0.3%
-8.9%
3.25%
-0.6%
-17.0%
ALL to NPLs HIP
55.54%
43.62%
11.9%
27.3%
39.53%
16.0%
40.5%
Q1 13 vs Q4 12
Q1 13 vs Q1 12
1
Excluding provision for loan losses and net write-downs related to the asset sale.
$57
1 |
 PR &
US Business 15
1
Excludes covered loans
$ in millions (unaudited)
Q1 13
Q4 12
Variance
Q1 13
Q4 12
Variance
Net Interest Income
$305
$309
($4)
$68
$68
$0
Non Interest Income
16
90
(74)
10
15
(5)
Gross Revenues
321
399
(78)
78
83
(5)
Provision (non-covered)
204
78
126
2
8
(6)
Provision (covered WB)
18
(3)
21
-
-
-
Provision for loan losses
222
75
147
2
8
(6)
Expenses
261
240
21
58
57
1
Tax (Benefit) Expense
(53)
19
(72)
1
1
0
Net (Loss) Income
($109)
65
($174)
$17
$17
$0
NPLs (HIP) ¹
$838
$1,192
($354)
$213
$233
($20)
NPLs (HIP + HFS) ¹
854
1,286
(432)
214
235
(21)
Loan loss reserve ¹
424
445
(21)
159
176
(17)
Assets
$27,863
$27,600
$263
$8,727
$8,652
$75
Loans (HIP)
19,278
18,959
319
5,688
5,751
(63)
Loans (HIP + HFS)
19,476
19,309
167
5,692
5,755
(63)
Deposits
20,946
20,989
(43)
6,121
6,076
45
NIM
5.18%
5.18%
0.00%
3.48%
3.51%
-0.03%
PR
US |
 16
Recent PR Government Actions
•
Comprehensive Government Pension Plan Reform was enacted in April 2013. Main elements include:
Retirement age increased for some groups of employees
Employee contribution to the system will be increased to 10% from 8.275%
Active
public
employees
will
be
granted
future
benefits
based
on
a
defined
contribution
plan
which
will
be paid through a lifetime annuity
Reduction in Christmas bonus and elimination of summer bonus
•
Act 154 excise tax has been increased and fixed at 4%; also extended for five years
(approx. $600 million in additional annual revenues)
•
Completed Luis Muñoz Marín International Airport lease agreement with Aerostar
Holdings Upfront payment of $615 million and $240 million in capital improvement
commitments over the next 5 years
•
Puerto Rico Aqueduct and Sewer Authority (“PRASA”) announced a 67% rate increase
that will provide additional revenues to cover operational expenses
•
Promotion
of
Act
20-2012
-
Export
Services
&
Act
22-2012
-
Individual
Residents
Investors
Source: Government Development Bank of PR bgfpr.com, PR Finance
Housing Authority, PR Commissioner of Financial Institutions
|
 Popular, Inc.
Credit Ratings •
Our senior unsecured ratings have been gradually improving since
2010:
Fitch:
BB-
Stable Outlook (Revised January 2013)
Moody’s:
B1
Stable Outlook (Revised December 2012)
S&P:
B+
Stable Outlook (No Change)
January 2013: Fitch raised to BB-
from B+; outlook revised to stable
December 2012: Moody’s downgraded BPOP by two notches to B1; stable outlook
assigned
April 2012: Moody’s placing most of the PR banks under review with the possibility
of downgrades, due to the state of the Puerto Rico economy
January 2012: Fitch raised BPOP’s outlook to positive
December
2011:
S&P
raised
its
ratings
on
BPPR
to
BB
from
BB-
and
changed
outlook to stable given revised bank criteria to regional banks
July 2011: S&P raised our senior unsecured rating by one notch to B+
As the P.R. economy stabilizes and our credit metrics improve, we should see
upward pressure on the ratings
17 |
 Financial
Results Financial Results
First Quarter 2013
First Quarter 2013 |