Attached files
| file | filename |
|---|---|
| EX-32.2 - CFO CERTIFICATIO - Start Scientific, Inc. | ex32_2edwardscert.htm |
| EX-31.1 - CEO CERTIFICATION - Start Scientific, Inc. | ex31_1greavescert.htm |
| EX-32.1 - CEO CERTIFICATION - Start Scientific, Inc. | ex32_1greavescert.htm |
| EX-31.2 - CFO CERTIFICATION - Start Scientific, Inc. | ex31_2edwardscert.htm |
| EXCEL - IDEA: XBRL DOCUMENT - Start Scientific, Inc. | Financial_Report.xls |
SECURITIES AND EXCHANGE COMMISSION
Washington, D.C. 20549
______________________
FORM 10-K
[ X ] Annual Report under Section 13 or 15(d) of the Securities Exchange Act of 1934
For the fiscal year ended December 31, 2012
OR
[ ] Transition Report Pursuant to Section 13 or 15(d) of the Securities Exchange Act of 1934
For the transition period from ________ to ___________
Commission file number: 000-52227
START SCIENTIFIC, INC.
(Exact name of registrant as specified in its charter)
| Delaware | 20-4910418 | |
|
(State or Other Jurisdiction of Incorporation or Organization) |
(IRS Employer Identification No.) | |
| 6 Champion Trail | ||
| San Antonio, TX | 78258 | |
| (Address of Principal Executive Offices) | (Zip Code) |
| (801) 816-2570 | ||
| Issuer’s Telephone Number, Including Area Code | ||
Securities registered under Section 12(b) of the Exchange Act: None
Securities registered under Section 12(g) of the Exchange Act: None
Indicate by check mark if the registrant is a well-known seasoned issuer, as defined in Rule 405 of the Securities Act. Yes £ No S
Indicate by check mark if the registrant is not required to file reports pursuant to Section 13 or Section 15(d) of the Act. Yes £ No S
Indicate by check mark whether the issuer (1) filed all reports required to be filed by Sections 13 or 15(d) of the Securities Exchange Act of 1934 during the past 12 months (or for such shorter period that the registrant was required to file such reports), and (2) has been subject to such filing requirements for the past 90 days. Yes S No £
Indicate by checkmark if disclosure of delinquent filers pursuant to Item 405 of Regulation S-K (§229.405 of this chapter) is not contained herein, and will not be contained, to the best of registrant’s knowledge, in definitive proxy or information statements incorporated by reference in Part III of this Form 10-K or any amendment to this Form 10-K. £
Indicate by check mark whether the registrant is a large accelerated filer, an accelerated filer, a non-accelerated filer or a smaller reporting company. See the definitions of “large accelerated filer,”“accelerated filer” and “smaller reporting company” in Rule 12b-2 of the Exchange Act.
|
Large accelerated filer £
|
Accelerated filer £ | |
|
Non-accelerated filer £
|
Smaller reporting company S |
Indicate by check mark whether the registrant is a shell company (as defined in Rule 12b-2 of the Exchange Act). £ Yes £ No
The aggregate market value of the Company’s voting stock held by non-affiliates computed by reference to the closing price as quoted on the Pink Sheets quotation system on June 30, 2013, was approximately $275,000. For purposes of this calculation, voting stock held by officers, directors, and affiliates has been excluded.
As of April 12, 2013, the Company had 109,165,000 outstanding shares of common stock, par value $0.001 per share.
DOCUMENTS INCORPORATED BY REFERENCE
None.
PART I.
ITEM 1: BUSINESS
Cautionary Factors That May Affect Future Results (Cautionary Statements Under the Private Securities Litigation Reform Act of 1995)
The disclosure and analysis set forth herein concerning Start Scientific, Inc. (hereafter, “we”, “our”, “us”, or the “Company”)contains certain forward looking statements, particularly statements relating to future actions, performance or results of current and anticipated products and services, sales efforts, expenditures, and financial results. From time to time, we also provide forward-looking statements in other publicly-released materials, both written and oral. Forward-looking statements provide current expectations or forecasts of future events such as new products or services, product approvals, revenues, and financial performance. These statements are identified as any statement that does not relate strictly to historical or current facts. We use words such as “anticipates,” “intends,” “plans,” “expects,” “will,” and other words and phrases of similar meaning. In all cases, a broad variety of assumptions can affect the realization of the expectations or forecasts in those statements. Consequently, no forward-looking statement can be guaranteed. Actual future results may vary materially.
We undertake no obligation to update any forward-looking statements, but investors are advised to consult any further disclosures by the Company on this subject in our subsequent filings pursuant to the Securities Exchange Act of 1934. Furthermore, as permitted by the Private Securities Litigation Reform Act of 1995, we provide these cautionary statements identifying risk factors, listed below, that could cause our actual results to differ materially from expected and historical results. It is not possible to foresee or identify all such factors. Consequently, this list should not be considered an exhaustive statement of all potential risks, uncertainties and inaccurate assumptions.
Corporate Organization
The Company was formed in the State of Utah under the name of “Secure Networks, Inc.” on February 4, 2004, and was subsequently reincorporated in Delaware on February 14, 2007 under the name “Secure Netwerks, Inc.” At the time of its formation, the Company was a wholly-owned subsidiary of SportsNuts, Inc., a Delaware corporation traded on the OTC Electronic Bulletin Board that files reports with the Securities and Exchange Commission under Sections 13(a) and 15(d) of the Securities Exchange Act of 1934. On March 1, 2007, the shares of the Company were spun-off to the shareholders of SportsNuts, Inc. As of April 12, 2013, we had shareholders of record.
The Business of the Company
Overview
Prior to March 2012, we were a computer and technology hardware reseller to businesses and other organizations. Most of our clients were small and medium sized organizations, although we attempted to market our products and services to larger organizations. We also outsourced technology-related services to provide a full solution basket of technology products and services including hardware, software, network development and services. Our clients consisted of some retail purchasers and small to medium-sized organizations, operating mostly in North America, but we did have occasional clients in Europe. Due to our recent acquisition of oil and gas interests, our future business is expected to be based on the exploration, development, drilling, and production of various oil and gas properties. In particular, we intend to look for oil and gas opportunities in international markets. Whether in respect to the
development of oil and gas interests in North America or overseas, we expect to align with industry partners in respect of the drilling and operation of these wells. Our long-term focus is to grow and develop existing oil and gas leasehold interests and acquire new interests within and without the continental United States. In addition, we intend to acquire interests in older wells that, with the application of newer technologies, may increase production and reserves.
Our Oil & Gas Interests
Carpathian Energy. On May 16, 2012, we entered into an agreement with Standard Energy Holdings LLC to acquire all of the shares of Carpathian Energy – Companie Petroliera SRL, a Romanian limited liability company that holds various oil and gas interests in Romania (hereafter, "Carpathian"). All of the conditions of purchase have not been satisfied as described herein. The first recorded oil and gas production in history was established in Romania in 1854. In 1857, the giant Moreni-Gura-Ocnitei Field was discovered which has produced approximately 750 million barrels of oil. Oil production increased dramatically from the late 19th century until World War I, which resulted in massive destruction of oil production infrastructure throughout the country. Following a rebuilding phase, Romanian oil exports were among the highest in the world just prior to the outbreak of World War II. After that war, the oil industry was nationalized under communist rule and production continued to increase until 1976, but, while under communist control, the lack of investment in oil and gas exploration resulted in fewer discoveries and new producing fields. The very low depletion rate of recoverable oil and gas reserves under the communist regime (3.5% annually), the lack of a profit motive (and concomitant rewards for risk assumption), and the poor investment climate is indicative of the inefficiency of oil and gas operations during this era. Since the fall of the communist dictatorship of Ceaucescu in 1989 and the establishment of a democracy one year later, it appears that the political climate now exists to safely accommodate investment in most economic and business sectors of Romania. Romania became a member of the European Union (EU) in 2007. We believe there is a very significant opportunity for investment in the Romanian oil and gas industry.
To date, approximately 6.7 billion barrels of recoverable oil reserves has been discovered in Romania, of which 5.8 billion have been produced. We have therefore estimated that approximately 1 billion barrels of recoverable oil reserves remain in place. Also, some 55 trillion cubic feet (Tcf) of recoverable gas has been discovered, of which 43 Tcf has been produced. Romania has current average daily production of approximately 200,000 barrels of oil and oil equivalents from 250 to 300 oil and gas fields. It is estimated that these producing fields could yield approximately 300 million barrels of oil and oil equivalents.
The price of oil in Romania is tied to world markets. The price of gas in Romania is presently at about $4.50 MCF, which is below market but is expected to rise to market rates over the next 18 months as price controls are removed, pursuant to EU requirements. The present top corporate tax rate is 16% of profits.
Established in 2001, Carpathian has analyzed and studied over 40 existing fields in Romania. After the initial studies identified certain oil and gas fields that met the parameters of Carpathian’s objectives, efforts commenced to acquire those fields. Carpathian has been successful in acquiring exploration and production licenses for six fields which have met its criteria. All concessions went through a preliminary evaluation using American and Romanian geologists and engineers. A more detailed and extensive evaluation has been completed on the Calinesti Field/Alexandria Block and is ongoing on the Cozieni Field, Nadlac Field, and the Bordei Verde Vest Field. The Catrunesti Field is a small, simple structure, upon which it is planned to drill one or two wells. The East Ciumeghiu Field produced about 14 BCF and is expected to have significant remaining reserves that could be economically produced by drilling one new well.
Using American and Romanian geologists and engineers, Carpathian has analyzed the shut-in fields available for concession and has concluded that a number of the oil fields have produced only 10% of recoverable reserves as result of inefficient drilling and production techniques. In addition, some of the individual wells in the fields reviewed were producing significant amounts of oil and/or gas when they developed mechanical problems and were either shut down or, in some instances, simply plugged and abandoned. It also appears that the official government calculation of the original reserves in many of the oil fields were significantly underestimated.
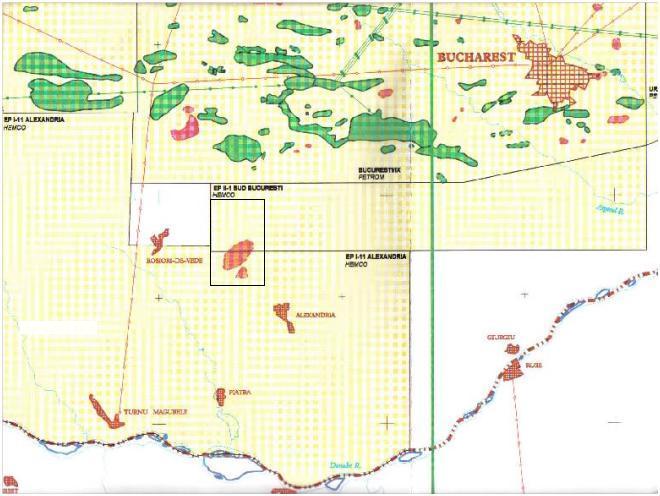
Upon completion of its review of the available fields, Carpathian acquired the concession rights to Bordei Verde Vest, Nadlac, Catrunesti, Cozieni, and East Ciumeghiu fields, as well as the South Bucharest Block I-II concession (also called the Alexandria Block which encompasses 114,000 acres and includes the Calinesti field). A tabular summary of each of these concession rights are included below and encompass a total of approximately 120,000 acres. Extensive geological and engineering research was performed on these fields, including the re-evaluation of all well logs, core analyses, mud logs, production history, and any other information available. All six fields have data indicating significant remaining reserves in multiple zones. It is believed that these reserves can be recovered at a relatively low cost by drilling new wells in the known reserves. Once these projects are profitable, additional wells may be drilled to explore deeper substrata. We have attached as an exhibit to this report our Reserves and Economic Evaluation from Aluko & Associates, Inc., a Consulting Petroleum Engineering firm based in Austin, Texas, dated June 28, 2008.
Our policy in respect of the operation and production of these fields will be to produce them at conservative rates so as to recover a higher percentage of hydrocarbons from the reservoir. We plan to rework and/or drill and develop these properties in an orderly and economically efficient manner.
Risk of Unwinding. We intend to enable us to use the proceeds to invest in the development of our oil and gas properties. Importantly, our agreement to acquire Carpathian contains an obligation to invest, no later than July 15, 2012, a minimum of Five Million Dollars ($5,000,000) into the development of Carpathian’s oil and gas assets. The previous owners of Carpathian have the right to unwind the acquisition of Carpathian and reclaim the Carpathian interest from the Company. (See RISK FACTORS)
All of the following summaries of reserves on the Carpathian Fields are based upon a June 28, 2008 Reserves and Economic Evaluation performed by Aluko & Associates, Inc., attached to this annual report as an exhibit. The Company does not have any other basis for evaluating the fields other than the Aluko Reserves report as detailed below:
| Summary of the Alexandria Block/Calinesti Field | ||
| Size/area: | 114,000 acres | |
| Average net pay: | 25 feet | |
| Depth: | 2,400 feet | |
| Proven reserves: | 19 BCF | |
| Probable/Possible reserves: | 20 BCF | |
| Exploratory/Gas reserves | 24 BCF | |
| Total reserves: | 63 BCF | |
| Expected initial daily production per well: | 1,000 MCF | |
| Working interest: | 100% | |
| Net revenue interest: | 80% | |
| Expected drilling costs (11 wells @ $800,000): | $8,800,000 | |
| Expected pipeline costs (30 kilometers): | $1,500,000 to $2,000,000 |
| Summary of the Bordei Verde Vest Field | ||
| Size/area: | 2,500 acres | |
| Average net pay: | 15 to 25 feet | |
| Depth: | 4,500 feet | |
| Proven reserves: | 1,200,000 BOE | |
| Probable/Possible reserves: | 1,500,000 BOE | |
| Total reserves: | 2,700,000 BOE | |
| Expected initial daily production per well: | 75 BOEPD | |
| Working interest: | 26.25% | |
| Net revenue interest: | 21% | |
| Expected drilling costs (15 wells @ $1,400,000): | $5,512,500 (26.25%) |
| Summary of the Nadlac Field | ||
| Size/area: | 800 acres | |
| Average net pay: | 200 feet | |
| Depth: | 10,000 feet | |
| Proven reserves (gas): | 7.0 BCF | |
| Proven reserves (oil): | 1,680,000 BO | |
| Probable/Possible reserves (gas): | 5.0 BCF | |
| Probable/Possible reserves (oil): | 2,000,000 BO | |
| Total reserves: | 12.0 BCF + 3,680,000 BO | |
| Expected initial daily production per well: | 2,000 MCFGPD equivalent | |
| Working interest: | 26.25% | |
| Net revenue interest: | 21% | |
| Expected drilling costs (4 wells @ $3,000,000): | $3,150,000 (26.25%) |
| Summary of the Catrunesti Field | ||
| Size/area: | 100 acres | |
| Average net pay: | 20 feet | |
| Depth: | 5,000 feet | |
| Proven reserves: | 50,000 BO | |
| Probable/Possible reserves: | 50,000 BO | |
| Total reserves: | 100,000 BO | |
| Expected initial daily production per well: | 50 BOPD | |
| Working interest: | 80% | |
| Net revenue interest: | 64% | |
| Expected recompletion costs (1 well @ $375,000): | $300,000 (80%) |
| Summary of the East Ciumeghiu Fields | ||
| Size/area: | 800 acres | |
| Average net pay: | 15 to 20 feet | |
| Depth: | 4,500 feet | |
| Proven reserves: | 1 BCF | |
| Probable/Possible reserves: | 4 BCF | |
| Total reserves: | 5 BCF | |
| Expected initial daily production per well: | 1,200 MCFGPD | |
| Working interest: | 80% | |
| Net revenue interest: | 64% | |
| Expected drilling costs (1 well @ $1,000,000): | $800,000 (80%) |
| Summary of the Cozieni Field | ||
| Size/area: | 600 acres | |
| Average net pay: | 25 feet | |
| Depth: | 2,000 feet | |
| Proven reserves: | 3.5 BCF | |
| Probable/Possible reserves: | 3.0 BCF | |
| Total reserves: | 6.5 BCF | |
| Expected initial daily production per well: | 1,200 MCFGPD | |
| Working interest | 80% | |
| Net revenue interest: | 64% | |
| Expected drilling costs (4 wells @ $750,000): | $2,400,000 (80%) |
On April 2, 2012, the Company entered into an agreement to acquire two separate one-fourth (1/4) working interests (collectively, the “Working Interests”) in certain oil and gas leases covering the Board of Education No. 6 Well located in Yazoo County, Mississippi ("Pickens")from Standard Energy Holdings LLC. The consideration granted by the Company in exchange for the Working Interests consisted of ten million (10,000,000) shares of restricted common stock. The Company has properly recorded its Working Interest with the County Recorder in Yazoo County, Mississippi.
About the Pickens Field
The first oil field discovered in Mississippi, the Tinsley field, is located 27 miles to the southwest of the Pickens Field. The Pickens Field was discovered six months later.
The Pickens Field is located about 35 miles north of Jackson, Mississippi, in Madison and Yazoo Counties. The field was discovered by Kingwood Oil Company in March of 1940 with the drilling of the R. E. Wilburn No.1, which is located in Section 31 of T12N-R3E, Yazoo County. The R.E. Wilburn was completed open hole in the Eutaw Wilburn sand at a depth of 4878-4889 feet, and initially tested 1013 barrels per day of 40 gravity oil and eventually produced 356,489 barrels of oil over its life time.
Pickens Field was discovered six months after the discovery of the Tinsley Field in western Yazoo County, and was the fourth field discovered in Mississippi. Pickens Field has produced 20,441,487 barrels of oil from the Eutaw Wilburn sand, approximately 2,000,000 barrels of oil from the Selma Chalk, and approximately 100,000 barrels of oil from the Tuscaloosa and Lower Cretaceous.
The Pickens Field is a ten-mile long northwest-southeast trending fault line trap with up-thrown fault blocks and structural closer. The Selma Chalk and the Tuscaloosa reservoirs are also associated with the same type of trapping mechanisms. Pickens is located near the western end of the Pickens-Gilbertown fault system, which begins west of the Pickens Field, and extends to the southeast through the producing oil regions of Scott, Jasper, and Clarke counties Mississippi, and ending at the Gilbertown Field in Choctaw County, Alabama. This fault system is also located at the northern end of the Mississippi Interior Salt Basin, and has had many oil fields discovered along its trend.
The first oil field discovered in Mississippi, the Tinsley field, is located 27 miles to the southwest of the Pickens Field. Other producing oil fields in the region are the Bentonia and Flora oil fields, which are 21 miles to the southwest. It is believed that an upward movement in the Louann Salt caused a northwest-southeast trending salt ridge, creating an overlying high relief Smackover structure and severe faulting in the shallow reservoirs of the Eutaw and other Cretaceous reservoirs. The high-grade crude oil that has charged the shallower horizons, most likely migrated up the faults from the Smackover structure below.
The Selma Chalk Formation. The Texas Oil Company discovered oil in the Selma Chalk formation in March of 1963 with the completion of the Eliza Thomas No.1. This well is located in the SE quarter of Section 29 of T12N-R3E, Yazoo County. The Chalk is a light gray carbonate rock, which is approximately 900 feet thick in the Pickens area. The Chalk is more sandy and permeable in the northwest portion of the field and less permeable in the southeast portion of the field. Up until 1963 the oil produced at the Pickens Field came from the Eutaw. Over the years as Eutaw wells were being drilled, it became common knowledge in the local oil industry as well as drilling contractors that a loss of circulation would sometimes occur when drilling through the Chalk. Also, oil would occasionally appear on the mud pits as drilling mud was circulated back to the surface after drilling through the Chalk section.
The Eliza Thomas No.1 was north of the Pickens Field on a separate fault. The Thomas well was originally drilled to 5,415 feet, and then completed in the Selma Chalk in the interval from 4434 to 4454. After acidizing, the well flowed 309 BOPD and no water, with 175 pounds of flowing tubing pressure. The Chalk oil was 37 gravity, similar to the Eutaw. Sidewall cores taken in the Chalk had a slight oil show, which probably led Texaco to complete in the interval.
The John McGowan Company and Clement & Stover subsequently drilled other Chalk wells after the successful completion of the Thomas well. These operators would typically run a Drill Stem Test to see if the Chalk would show oil. This was a fairly successful technique, but was not always an indication of whether a well would be productive or not. McGowan and Clement & Stover, however, completed the more successful wells in the field such as the Varnado, the Livingston and the Bridgforth. Out of the 27 Chalk wells completed at the Pickens Field, the average cumulative production was 65,734 BO. However, the better producers in the field were the H. R. Varnado No. 1, the No. 2 Board of Supervisors, the Stewart Bridgforth No. 2, and the Livingston No. 1. These four wells averaged 263,000 BO per well. Drilling in the more permeable part of the field along with cutting the fault at the optimum depth most likely led to the higher recovery.
The No. 2 Board of Supervisors was drilled by Clement & Stover and is located in Section 16 of T12N-2E of Yazoo County. This well was completed in the Chalk open-hole and no log was run. The initial test was 64 BO and 8 BW per day, and produced 287,482 BO cumulatively. This well steadily produced an average of 4472 barrels of oil per month (149 per day) for the first four years before it began to decline. The Clement-Stover/Stewart Bridgforth No. 2 flowed 168 BO and 48 BW per day on the initial test, and produced a total of 213,500 BO. The McGowan/H. R. Varnado No.1 tested 156 BO per day, and produced a total of 440,000 BO cumulatively. The Clement-Stover/Livingston No.1 tested 112 BO and 128 BW per day, and produced a total of 110,000 BO.
In March of 1996, G&S Oil Company re-entered the Palmer Petroleum/Bridgforth No.1, and completed in the Selma Chalk from 4180 to 4230. The well flowed 380 BOPD with no water and 225 pounds of tubing pressure. Cumulative oil production is 49,496 barrels. A fault cut the Chalk in the top 150 feet of the section. The pay section shows no SP response and resistivity of 7 ohms. This well did not flow oil until it was acidized with Hydrochloric acid. After reviewing various Selma Chalk completions in the Pickens Field, it seems that the wells that cut a fault in the top 100 feet of the Chalk section performed better than the ones that did not. Acidizing (HCL) after perforating is also important for a successful completion.
We believe that there is significant potential remaining in the Selma Chalk at the Pickens Field. New locations should be drilled directly on the down-thrown side of the main faults allowing a fault cut in the top 100 feet of the Chalk section. In the Northwest portion of the Pickens Field, the chalk is more permeable and should have a higher than average recovery of oil. We estimate that as many as twenty locations are possible, and total recovery could be 200,000 barrels of oil per well. Depending on the western extent of the field, an estimated 4,000,000 to 5,000,000 barrels of oil may be recoverable.
| Summary of the Pickens Field | ||
| Size/area: | 1560 acres | |
| Average net pay: | 50 feet | |
| Depth: | 4,300 feet | |
| Proven reserves: | 600,000 BO | |
| Probable/Possible reserves: | 1,000,000 BO | |
| Total reserves: | 1,600,000 BO | |
| Expected initial daily production per well: | 100 BOPD | |
| Working interest: | 50%* | |
| Net revenue interest: | 37.5% | |
| Expected drilling costs (5 wells @ $800,000): | $2,000,000 (50%) | |
| *The company owns a 25% working interest in the Pickens Field and has an option to purchase an additional 25% subject to certain conditions. |
Market
Generally. The oil and gas industry is highly susceptible to extreme fluctuations in energy-related commodity prices, which in turn has a corresponding effect on the level of drilling and exploration activity and the costs associated therewith. Such volatility is also represented in the trends, however disparate, of supplies, demand, and price movements of crude oil and natural gas. Oil and gas industry revenues have grown in excess of 7% per annum, on average, since 2007 and are expected to increase moderately in 2012.
Crude Oil. In general, 2011 was a strong year for oil companies, with increasing crude prices and concomitantly higher revenues. Price appreciation was driven by geopolitical turmoil, supply shocks such as the Deepwater Horizon spill in the Gulf of Mexico, and reduced output from natural production declines in existing oil fields. While U.S. domestic oil consumption has decreased, international demand has remained relatively strong and, combined with rising tensions in the Middle East affecting perceptions of regional supply disruptions, prices are not expected to materially decrease for the remainder of 2012.
Natural Gas. Unlike crude oil, the natural gas market has suffered from a glut of excess production and protracted price declines. Technological advancements have enabled progressively fewer producers to employ horizontal drilling and hydraulic fracturing methods at significantly lower costs than previous techniques, and yet production yields per well have increased dramatically. In addition, these increased yields have resulted in greater quantities of higher value natural gas byproducts, particularly in respect to liquid hydrocarbons extracted from shale formations (ethane, propane, and butane, among others). Consequently, assessments of the economic feasibility of gas wells have increasingly relied on the presence of these byproducts to achieve desired returns on drilling and exploration costs. Even in these wells, however, natural gas remains the dominant element and an overabundance of supplies has resulted in a 10-year low in the spot price of natural gas as of the end of March 2012, and the outlook for the remainder of the year does not suggest that any significant price appreciation is imminent. Increased government regulation and requirements associated with natural gas development (specifically hydraulic fracturing) remains a constant concern affecting pricing and industry forecasts.
Regulation
Federal and state regulations control various aspects of drilling and operating oil and gas wells, including care of the environment, the safety of workers and the public, and the relations with the owners and occupiers of surface lands within or near the leasehold acreage. The effect of these regulations is, invariably, to increase the cost of operations. The costs of compliance with state regulations include a permit for drilling a well before beginning a project. Other compliance matters have to do with keeping the property free of oil spills and the plugging of non-productive wells.
Oil and gas exploration, drilling, and production activities are also subject to private property rights. Owners of real property also own the rights to the minerals underneath the surface, unless such mineral rights have been retained, sold or transferred by a previous landowner. Oil and gas rights held by the United States government are managed by the Bureau of Land Management in conjunction with the U.S. Forest Service pursuant to a variety of federal statutes.
Environmental impacts of oil and gas production include produced water and drilling waste. Wastes that cannot be reused or recycled must be stored or disposed of in some manner, increasing the land area affected by oil and gas extraction and raising concerns over potential leaking of drilling fluids and other wastes from storage sites. Some petroleum industry operations have been responsible for water pollution through by-products of refining and oil spills.The combustion of fossil fuels produces greenhouse gases and other air pollutants as byproducts. Pollutants include nitrogen oxides, sulphur dioxide, volatile organic compounds and heavy metals.
Employees
As of December 31, 2012, we had 4 employees and 4 part-time contractors, although we intend to hire additional personnel to pursue our new business as an oil and gas exploration and development company. Although national unemployment rates remain high relative to historical averages, there exists a significant amount of competition for skilled personnel in the oil and gas services industry. Nevertheless, we expect to be able to attract and retain such additional employees as are necessary, commensurate with the anticipated future expansion of our business. Further, we expect to continue to use consultants, contract labor, attorneys and accountants as necessary.
ITEM 1A: RISK FACTORS
Since we are a smaller reporting company, we are not required to supply the information required by this Item 1A.
ITEM 1B: UNRESOLVED STAFF COMMENTS.
None.
ITEM 2: PROPERTIES.
Until March 2012, we occupied approximately 2,500 square feet of office space located at 11650 South State Street, Suite 240, Draper, Utah 84020. Following the change of our business in March 2012, our offices were ultimately relocated to San Antonio, Texas. During 2012, we incurred $10,701 in rental expense related to our corporate offices.
We do not own any real property.
ITEM 3: LEGAL PROCEEDINGS
None.
ITEM 4: MINE SAFETY DISCLOSURES.
Not Applicable.
PART II
ITEM 5: MARKET FOR REGISTRANT’S COMMON EQUITY, RELATED STOCKHOLDER MATTERS AND ISSUER PURCHASES OF EQUITY SECURITIES.
| (a) | Market for Common Equity and Related Stockholder Matters. |
| (1) | Market Information. |
The Company’s Common Stock is listed on the Pink Sheets quotation system (“Pink Sheets”) under the symbol “STSC.” The Company’s stock has been publicly traded since March, 2007. The following table sets forth, for the periods indicated, the high and low closing sales prices as quoted on the Pink Sheets, of shares of the Company’s Common Stock during the calendar year ended December 31, 2012:
| High | Low | |||||||
| Fourth Quarter 2012 | $ | 0.43 | $ | 0.15 | ||||
| Third Quarter 2012 | $ | 0.75 | $ | 0.25 | ||||
| Second Quarter 2012 | $ | 1.01 | $ | 0.55 | ||||
| First Quarter 2012 | $ | 0.60 | $ | 0.25 | ||||
The following table sets forth, for the periods indicated, the high and low closing sales prices as quoted on the Pink Sheets, of shares of the Company’s common stock during the calendar year ended December 31, 2011:
| High | Low | |||||||
| Fourth Quarter 2011 | $ | 0.55 | $ | 0.03 | ||||
| Third Quarter 2011 | $ | 0.25 | $ | 0.15 | ||||
| Second Quarter 2011 | $ | 0.25 | $ | 0.25 | ||||
| First Quarter 2011 | $ | 0.25 | $ | 0.01 | ||||
| (2) | Holders. |
As of December 31, 2012, the Company had approximately 274 holders of record of its common stock.
| (3) | Dividends. |
The Company has not paid any cash dividends on its common stock since inception and does not anticipate paying cash dividends in the foreseeable future. The Company anticipates that any future earnings will be retained for use in developing and/or expanding the business.
| (4) | Securities Authorized for Issuance Under Equity Compensation Plans. |
None
(b) Recent Sales of Unregistered Securities.
On September 25, 2012, the Company entered into a consulting agreement with TEGA, LLC, a Kentucky-based consulting company. The Company issued 600,000 shares of its common stock to TEGA, LLC, 500,000 shares of its common stock to TEGA's transferee Frances Crew, and 100,000 shares of its common stock to TEGA's transferee Teddy Colley.
On August 31, 2012, in exchange for $100,000, the Company issued a promissory note in the original principal amount of $100,000 (“Note”) to a lender. The Note matures on August 30, 2013 and carries an interest rate of 8% per annum payable on a quarterly basis. The Note shall at the maturity date, be due and payable in full unless converted partially or in its entirety upon the election of the lender into fully paid and non-assessable shares of Common Stock of the Company at a conversion price equal to $0.25 per share of Common Stock.
On August 15, 2012, the Company amended that certain consulting agreement with JT Arco, LLC. a New Jersey-based Corporation. Pursuant to the terms of the Addendum Agreement the Company issued an additional 500,000 restricted shares of its common stock.
On August 1, 2012, the Company issued 5,000,000 shares of common stock of the Company to an officer of the Company for services pertaining to business development.
On June 27, 2012, the Company entered into a consulting agreement with Morris Carlo White IV a Texas-based consultant. Pursuant to the terms of the Agreement the Company issued 65,000 restricted shares of its common stock.
On June 12, 2012, the Company entered into a consulting agreement with JT Arco, LLC. a New Jersey-based Corporation. Pursuant to the terms of the Agreement the Company issued 500,000 restricted shares of its common stock.
On May 16, 2012, the Company entered into an agreement to acquire all of the outstanding shares of Carpathian Energy SRL in exchange for 90,000,000 shares of restricted common stock of the Company. Carpathian is a Romanian limited liability company engaged in oil & gas exploration and development. Pursuant to the terms of the agreement, the former owners of Carpathian may rescind the Acquisition and reclaim the shares of Carpathian in the event that the Company does not invest at least $5 million toward development of Carpathian’s oil and gas assets. As of December 31, 2012, the conditions of the agreement had not been met.
On May 4, 2012, pursuant to the Company’s 2012 Equity Incentive Plan (the "Plan") which Plan is attached as an exhibit to the Company’s Current Report on Form 8-K filed with the Securities and Exchange Commission on May 9, 2012, the Board approved the grant of 10,500,000 common stock purchase options to five individuals at a weighted average exercise price of $0.65 per share.
On April 2, 2012, the Company entered into an agreement to acquire two separate one-fourth (1/4) working interests (collectively, the “Working Interests”) in certain oil and gas leases covering the Board of Education No. 6 Well located in Yazoo County, Mississippi. The consideration granted by the Company in exchange for the Working Interests consisted of 10,000,000 shares of restricted common stock.
On March 1, 2012, the Company accepted the subscription of an investor for $300,000 in exchange for 1,200,000 shares of restricted common stock.
On February 29, 2012, in exchange for $100,000, the Company issued 200,000 shares of restricted common stock and a promissory note in the original principal amount of $100,000 (“Note”) to an investor. The Note matures on August 27, 2012 and carries a fixed interest payment at maturity of $25,000.
Exemption From Registration Claimed
All of the sales by the Company of its unregistered securities were made by the Company in reliance upon Section 4(2) of the Securities Act of 1933, as amended (the “1933 Act”). All of the individuals and/or entities listed above that purchased the unregistered securities were all known to the Company and its management, through pre-existing business relationships. All purchasers were provided access to all material information, which they requested, and all information necessary to verify such information and were afforded access to management of the Company in connection with their purchases. All purchasers of the unregistered securities acquired such securities for investment and not with a view toward distribution, acknowledging such intent to the Company. All certificates or agreements representing such securities that were issued contained restrictive legends, prohibiting further transfer of the certificates or agreements representing such securities, without such securities either being first registered or otherwise exempt from registration in any further resale or disposition.
Penny Stock Rules
Due to the price of our common stock, as well as the fact that we are not listed on a national securities exchange, our stock is characterized as “penny stocks” under applicable securities regulations. Our stock will therefore be subject to rules adopted by the SEC regulating broker-dealer practices in connection with transactions in penny stocks. The broker or dealer proposing to effect a transaction in a penny stock must furnish his customer a document containing information prescribed by the SEC and obtain from the customer an executed acknowledgment of receipt of that document. The broker or dealer must also provide the customer with pricing information regarding the security prior to the transaction and with the written confirmation of the transaction. The broker or dealer must also disclose the aggregate amount of any compensation received or receivable by him in connection with such transaction prior to consummating the transaction and with the written confirmation of the trade. The broker or dealer must also send an account statement to each customer for which he has executed a transaction in a penny stock each month in which such security is held for the customer's account. The existence of these rules may have an effect on the price of our stock, and the willingness of certain brokers to effect transactions in our stock.
Dividend Policy
We have never declared or paid dividends on our common stock. Payment of future dividends, if any, will be at the discretion of our Board of Directors after taking into account various factors, including the terms of any credit arrangements, our financial condition, operating results, current and anticipated cash needs and plans for expansion. At the present time, we are not party to any agreement that would limit our ability to pay dividends.
ITEM 6: SELECTED FINANCIAL DATA
As a smaller reporting company we are not required to provide this information
ITEM 7: MANAGEMENT’S DISCUSSION AND ANALYSIS OF FINANCIAL CONDITION AND RESULTS OF OPERATIONS
You should read the following discussion of the company’s financial condition and results of operations in conjunction with the audited financial statements and related notes included in this registration statement. This discussion may contain forward-looking statements, including, without limitation, statements regarding our expectations, beliefs, intentions, or future strategies that are signified by the words “expects,” “anticipates,” “intends,” “believes,” or similar language. Actual results could differ materially from those projected in the forward looking statements. You should carefully consider the information set forth above under Item 1 of this Part I under the caption “Risk Factors” in addition to the other information set forth in this registration statement. We caution you that Secure Netwerks’ business and financial performance is subject to substantial risks and uncertainties.
Overview
Prior to April 2012, we were a reseller of technology-related hardware and software, including laptops, desktops, networking devices, telecommunication systems and networks, servers and software. In April, 2012 in connection with the acquisition of two separate one-fourth (1/4) working interests in certain oil and gas leases located in Yazoo County, Mississippi, our principal business became the exploration, development, and production of oil and gas interests.
On May 16, 2012, the Company entered into an agreement to acquire all of the outstanding shares of Carpathian Energy SRL (hereafter, “Carpathian”), in exchange for 90,000,000 shares of restricted common stock of the Company (such transaction is hereafter referred to as the “Acquisition”). Carpathian is a Romanian limited liability company engaged in oil & gas exploration and development. Pursuant to the terms of agreement entered into in connection with the Acquisition, the former owners of Carpathian may rescind the Acquisition and reclaim the shares of Carpathian in the event that the Company does not invest at least $5 million toward development of Carpathian’s oil and gas assets.
Results of Operations
Following is our discussion of the relevant items affecting results of operations for the years ended December 31, 2012 and 2011.
Revenues. The Company generated net revenues of $-0- for the year ended December 31, 2012 compared to $30,096 in net revenues for the year ended December 31, 2011. During 2011, net revenues were recognized from software and hardware product resales and equipment leasing. The decrease in revenues is mainly the result of the change in our business model from a reseller of computer hardware and software to an oil and gas exploration and development company.
Cost of Sales. Cost of sales for the year ended December 31, 2012 was $-0- compared to $27,683 for the year ended December 31, 2011. The decrease is mainly the result of decreased sales and the change in our business model as discussed above.
Salaries and Consulting Expenses. For the years ended December 31, 2012 and 2011, salaries and consulting expenses consisted of salaries and benefits, Company paid payroll taxes and outside consulting expenses. Salaries and consulting expenses for the year ended December 31, 2012 were $5,082,739 compared to $2,298 during the year ended December 31, 2011. The increase is mainly the result of stock based compensation during 2012 in the amount of $4,688,426. We expect that salaries and consulting expenses will increase commensurate with the expansion of the Company’s business as an oil and gas exploration, development, and production firm.
Professional Fees. Professional fees for the year ended December 31, 2012 were $166,116, compared to $28,217 during the year ended December 31, 2011. The change of our business to an oil and gas exploration, development, and production company has resulted in an increase in professional fees.
Selling, General and Administrative Expenses. For the years ended December 31, 2012 and 2011, selling, general and administrative expenses were comprised of advertising; bad debts; occupancy and office expenses; equipment leases; travel and other miscellaneous administrative expenses. Selling, general and administrative expenses for the year ended December 31, 2012 were $34,872 compared to $5,084 during the year ended December 31, 2011. We expect that selling, general, and administrative expenses will continue to increase in the future in connection with the expansion of the Company’s business.
Other Income (Expense). We incurred net other expense of $127,381 for the year ended December 31, 2012 compared to net other expense of $36,024 during the year ended December 31, 2011. Other expenses incurred during 2012 and 2011 were comprised primarily of interest expenses related to credit cards as well as promissory notes issued by the Company. The increase is the result of increased interest on new promissory notes issued during 2012.
Off-Balance Sheet Arrangements
The Company has no off-balance sheet arrangements.
Personnel
We presently have four employees and four other project-based contract personnel that we utilize to carry out our business. We utilize contract personnel on a continuous basis, primarily in connection with our reporting obligations under the Securities Exchange Act of 1934. We expect to hire more full-time employees in the future. Although competition for personnel in the oil and gas industry is intense, we don’t believe we will have significant difficulty retaining additional employees or contract personnel in the future.
Liquidity and Capital Resources
Since inception, the Company has financed its operations through a series of loans, credit accounts with hardware vendors, and the use of Company credit to procure goods and services. As of
December 31, 2012, our primary source of liquidity consisted of $90 in cash and cash equivalents. We expect to secure additional debt or equity capital to finance substantial business development initiatives or acquire additional oil and gas interests.
ITEM 7A: QUANTITATIVE AND QUALITATIVE DISCLOSURES ABOUT MARKET RISK
As a smaller reporting company we are not required to provide this information.
ITEM 8: FINANCIAL STATEMENTS AND SUPPLEMENTARY DATA
| Report of Independent Registered Public Accounting Firm……………...…………………….. |
20
|
| Balance Sheets………………………………………………………………..…………………. |
21
|
| Statements of Operations………………………………………………………………………... |
22
|
| Statements of Stockholders’ Deficit…………………………………………………………….. |
23
|
| Statements of Cash Flows……………………………………………………………………….. |
24
|
| Notes to the Financial Statements……………………………………………………………….. |
25
|
REPORT OF INDEPENDENT REGISTERED PUBLIC ACCOUNTING FIRM
To the Board of Directors and Stockholders
Start Scientific, Inc. (formerly Secure Netwerks, Inc.)
San Antonio, TX
We have audited the accompanying balance sheets of Start Scientific, Inc. (formerly Secure Netwerks, Inc.) as of December 31, 2012 and 2011 and the related statements of operations, stockholders’ deficit and cash flows for the years then ended. These financial statements are the responsibility of the Company’s management. Our responsibility is to express an opinion on these financial statements based on our audits.
We conducted our audits in accordance with the standards of the Public Company Accounting Oversight Board (United States). Those standards require that we plan and perform the audit to obtain reasonable assurance about whether the financial statements are free of material misstatement. The Company is not required to have, nor were we engaged to perform, an audit of its internal control over financial reporting. Our audit included consideration of internal control over financial reporting as a basis for designing audit procedures that are appropriate in the circumstances, but not for the purpose of expressing an opinion on the effectiveness of the Company’s internal control over financial reporting. Accordingly, we express no such opinion. An audit also includes examining, on a test basis, evidence supporting the amounts and disclosures in the financial statements, assessing the accounting principles used and significant estimates made by management, as well as evaluating the overall financial statement presentation. We believe that our audits provide a reasonable basis for our opinion.
In our opinion, the financial statements referred to above present fairly, in all material respects, the financial position of Start Scientific, Inc. (formerly Secure Netwerks, Inc.) as of December 31, 2012 and 2011 and the results of its operations and cash flows for the years then ended in conformity with generally accepted accounting principles in the United States of America.
The accompanying financial statements have been prepared assuming that the Company will continue as a going concern. As discussed in Note10 to the financial statements the Company has negative working capital, negative cash flows from operations, and recurring operating losses which raises substantial doubt about the Company’s ability to continue as a going concern. Management’s plan regarding these matters is also described in Note10 to the financial statements. The financial statements do not include any adjustments that might result from the outcome of this uncertainty.
/s/ Morrill & Associates
Morrill & Associates
Clinton, Utah 84015
April 16, 2013
START SCIENTIFIC, INC.
(formerly Secure Netwerks, Inc.)
Notes to the Financial Statements
December 31, 2012 and 2011
NOTE 1 ORGANIZATION AND DESCRIPTION OF BUSINESS
Start Scientific, Inc. (the Company) was formed in the state of Utah on February 4, 2004, with authorized common stock of 10,000,000 shares. The Company was subsequently reincorporated in the State of Delaware on February 14, 2006 with authorized common stock of 500,000,000 shares and authorized preferred stock of 100 shares. Both classes of stock have a par value of $0.0001 per share.
Prior to March 2012, we were a computer and technology hardware reseller to businesses and other organizations. Most of our clients were small and medium sized organizations, although we attempted to market our products and services to larger organizations. We also outsourced technology-related services to provide a full solution basket of technology products and services including hardware, software, network development and services. Our clients consisted of some retail purchasers and small to medium-sized organizations, operating mostly in North America, but we did have occasional clients in Europe. Due to our recent acquisition of oil and gas interests, our future business is expected to be based on the exploration, development, drilling, and production of various oil and gas properties. In particular, we intend to look for oil and gas opportunities in international markets. Whether in respect to the development of oil and gas interests in North America or overseas, we expect to align with industry partners in respect of the drilling and operation of these wells. Our long-term focus is to grow and develop existing oil and gas leasehold interests and acquire new interests within and without the continental United States. In addition, we intend to acquire interests in older wells that, with the application of newer technologies, may increase production and reserves.
NOTE 2 SIGNIFICANT ACCOUNTING POLICIES
This summary of significant accounting policies of the Company is presented to assist in understanding the Company’s financial statements. The financial statements and notes are representations of the Company’s management who are responsible for their integrity and objectivity. These accounting policies conform to accounting principles generally accepted in the United States of America and have been consistently applied in the preparation of the financial statements. The following policies are considered to be significant:
a. Accounting Method
The Company recognizes income and expenses based on the accrual method of accounting. The Company has elected a calendar year-end.
b. Cash and Cash Equivalents
Cash equivalents are generally comprised of certain highly liquid investments with original maturities of less than three months.
c. Use of Estimates in the Preparation of Financial Statements
The preparation of financial statements in conformity with U.S. generally accepted accounting principles requires management to make estimates and assumptions that affect the reported amounts of assets and liabilities and disclosure of contingent assets and liabilities at
START SCIENTIFIC, INC.
(formerly Secure Netwerks, Inc.)
Notes to the Financial Statements
December 31, 2012 and 2011
NOTE 2 SIGNIFICANT ACCOUNTING POLICIES (Continued)
the date of the financial statements and the reported amounts of revenues and expenses during the reporting period. Actual results could differ from those estimates.
d. Basic and Fully Diluted Net Loss per Share of Common Stock
In accordance with Financial Accounting Standards No. ASC 260, “Earnings per Share,” basic net loss per common share is based on the weighted average number of shares
outstanding during the periods presented. Diluted earnings per share is computed using the weighted average number of common shares plus dilutive common share equivalents outstanding during the period. There are no common stock equivalents as of December 31, 2012 and 2011.
| December 31, | ||||||||
| 2012 | 2011 | |||||||
| Net loss (numerator) | $ | (5,411,108 | ) | $ | (69,210 | ) | ||
| Weighted average shares outstanding (denominator) | 11,659,986 | 500,000 | ||||||
| Basic and fully diluted net loss per share amount | $ | (0.46 | ) | $ | (0.14 | ) | ||
e. Allowance for Doubtful Accounts Receivable
Accounts receivable are recorded net of the allowance for doubtful accounts. The Company generally offers 15-day credit terms on sales to its customers and requires no collateral. The Company maintains an allowance for doubtful accounts which is determined based on a number of factors, including each customer’s financial condition, general economic trends and management judgment. As of December 31, 2012 and 2011, the allowance for doubtful accounts was $-0- and $14,203, respectively. Bad debt expense was $1,800 and $-0- for the years ended December 31, 2012 and 2011, respectively.
f. Inventories
Inventories are stated at the lower of average cost or market value. When there is evidence that the inventories value is less than original cost, the inventory is reduced to market value. The Company had $-0- in inventory at December 31, 2012 and 2011.
g. Property and Equipment
Property and equipment are stated at cost less accumulated depreciation. Depreciation is calculated using the straight-line method over the estimated useful lives of the assets. When assets are disposed of, the cost and accumulated depreciation (net book value of the assets) are eliminated and any resultant gain or loss reflected accordingly. Betterments and improvements are capitalized over their estimated useful lives whereas repairs and maintenance expenditures on the assets are charged to expense as incurred.
h. Revenue Recognition
Products and services provided by the Company are broken down into two main categories for revenue recognition purposes, they are: off-the-shelf hardware/software sales and
START SCIENTIFIC, INC.
(formerly Secure Netwerks, Inc.)
Notes to the Financial Statements
December 31, 2012 and 2011
NOTE 2 SIGNIFICANT ACCOUNTING POLICIES (Continued)
technology related services. The revenue recognition policy for these categories is as follows:
Revenue is recognized upon completion of services or delivery of goods where the sales price is fixed or determinable and collectibility is reasonably assured. Advance customer payments are recorded as deferred revenue until such time as they are recognized. The Company does not offer any cash rebates. Returns or discounts, if any, are netted against gross revenues. For the years ended December 31, 2012 and 2011, sales are recorded net of the allowance for returns and discounts of $-0-. Product sales were solely derived from the resale of off-the-shelf hardware and software packages. Product sales are not warranted by the Company and may be subject only to warranties that may be provided by the product manufacturer.
i. Recent Accounting Pronouncements
We have reviewed accounting pronouncements issued during the past two years and have adopted any that are applicable to the Company. We have determined that none had a material impact on our financial position, results of operations, or cash flows for the years ended December 31, 2012 and 2011.
j. Income Taxes
The Financial Accounting Standards Board (FASB) has issued FASB ASC 740-10 (Prior authoritative literature: Financial Interpretation No. 48, "Accounting for Uncertainty in Income Taxes - An Interpretation of FASB Statement No. 109 (FIN 48)). FASB ASC 740-10 clarifies the accounting for uncertainty in income taxes recognized in an enterprise's financial statements in accordance with prior literature FASB Statement No. 109, Accounting for Income Taxes. This standard requires a company to determine whether it is more likely than not that a tax position will be sustained will be sustained upon examination based upon the technical merits of the position. If the more-likely-than- not threshold is met, a company must measure the tax position to determine the amount to recognize in the financial statements. As a result of the implementation of this standard, the Company performed a review of its material tax positions in accordance with recognition and measurement standards established by FASB ASC 740-10.
Deferred taxes are provided on a liability method whereby deferred tax assets are recognized for deductible temporary differences and operating loss and tax credit carryforwards and deferred tax liabilities are recognized for taxable temporary differences. Temporary differences are the differences between the reported amounts of assets and liabilities and their tax basis. Deferred tax assets are reduced by a valuation allowance when, in the opinion of management, it is more likely than not that some portion or all of the deferred tax assets will not be realized. Deferred tax assets and liabilities are adjusted for the effects of changes in tax laws and rates on the date of enactment.
At December 31, 2012, the Company had net operating loss carryforwards of approximately $2,013,500 which may be offset against future taxable income through 2032. No tax benefit has been reported in the financial statements because the potentialtax benefits of the net operating loss carryforwards are offset by a valuation allowance of the same amount.
START SCIENTIFIC, INC.
(formerly Secure Netwerks, Inc.)
Notes to the Financial Statements
December 31, 2012 and 2011
NOTE 2 SIGNIFICANT ACCOUNTING POLICIES (Continued)
Due to the change in ownership provisions of the Tax Reform Act of 1986, net operating loss carryforwards for Federal income tax reporting purposes are subject to annual limitations. Should a change in ownership occur, net operating loss carryforwards may be limited as to future use.
Net deferred tax assets consist of the following components as of December 31, 2012 and 2011:
| 2012 | 2011 | |||||||
| Deferred tax assets: | ||||||||
| NOL Carryover | $ | 2,013,500 | $ | 173,500 | ||||
| Valuation allowance | (2,013,500 | ) | (173,500 | ) | ||||
| Net deferred tax asset | $ | — | $ | — | ||||
The income tax provision differs from the amount of income tax determined by applying the U.S. federal and state income tax rates of 34% to pretax income from continuing operations for the years ended December 31, 2012 and 2011 due to the following:
| 2012 | 2011 | |||||||
| Current Federal Tax | $ | — | $ | — | ||||
| Current State Tax | — | — | ||||||
| Change in NOL Benefit | 1,840,000 | 23,500 | ||||||
| Valuation allowance | (1,840,000 | ) | (23,500 | ) | ||||
| $ | — | $ | — | |||||
A reconciliation of the beginning and ending amount of unrecognized tax benefits is as follows:
| Year ended December 31, | ||||||||
| 2012 | 2011 | |||||||
| Beginning balance | $ | — | $ | — | ||||
| Additions based on tax positions related to current year | — | — | ||||||
| Additions for tax positions of prior years | — | — | ||||||
| Reductions for tax positions of prior years | — | — | ||||||
| Reductions in benefit due to income tax expense | — | — | ||||||
| Ending balance | $ | — | $ | — | ||||
At December 31, 2012, the Company had no unrecognized tax benefits that, if recognized, would affect the effective tax rate.
START SCIENTIFIC, INC.
(formerly Secure Netwerks, Inc.)
Notes to the Financial Statements
December 31, 2012 and 2011
NOTE 2 SIGNIFICANT ACCOUNTING POLICIES (Continued)
The Company did not have any tax positions for which it is reasonably possible that the total amount of unrecognized tax benefits will significantly increase or decrease within the next 12 months.
The Company includes interest and penalties arising from the underpayment of income taxes in the consolidated statements of operations in the provision for income taxes. As of December 31, 2012 and 2011, the Company had no accrued interest or penalties related to uncertain tax positions.
The tax years that remain subject to examination by major taxing jurisdictions are those for the years ended December 31, 2012, 2011 and 2010.
k. Concentrations of Credit Risk
Financial instruments that potentially subject the Company to concentrations of credit risks consist of cash and cash equivalents. The Company places cash and cash equivalents at well known quality financial institutions. Cash and cash equivalents at banks are insured by the Federal Deposit Insurance Corporation for up to $250,000. The Company did not have any cash or cash equivalents in excess of this amount at December 31, 2012 and 2011.
NOTE 3 PREPAID ASSETS
On May 16, 2012, the Company entered into an agreement to acquire all of the outstanding shares of Carpathian Energy SRL from Standard Energy Holdings, LLC in exchange for 90 million shares of common stock of the Company. The common stock was delivered by the Company to Standard Energy Holdings, LLC on December 5, 2012. Carpathian is a Romanian limited liability company engaged in oil & gas exploration and development. Pursuant to the terms of the agreement, amendments, and letters of understanding, the Company must deliver $5,000,000 to satisfy the agreement to be used to develop the oil & gas concessions held by Carpathian. Also, the ownership units of Carpathian have not yet been transferred. Both of these conditions to the agreement have not yet been met. The agreement is in default and is subject to an unwind provision that may be asserted by the Company or Carpathian. Therefore the Company has a prepaid asset in the amount of $22,645,000 which consists of the market value of the 90,000,000 shares of its stock on the date of issuance ($22,500,000). and cash payments of $145,000 toward the development of the oil & gas assets.
NOTE 4 WORKING INTEREST IN OIL LEASES
On April 2, 2012, the Company entered into an agreement to acquire two separate one-fourth (1/4) working interests (“Working Interests”) in certain oil and gas leases covering the Board of Education No. 6 Well located in Yazoo County, Mississippi. The consideration granted by the Company in exchange for the Working Interests consisted of 10,000,000 shares of restricted common stock on. The Company has recorded the working interests at $2,560,000 which consists of the market value of the 10,000,000 shares of stock on date of issuance ($2,500,000) and cash payments of $60,000 toward the development of the interests.
START SCIENTIFIC, INC.
(formerly Secure Netwerks, Inc.)
Notes to the Financial Statements
December 31, 2012 and 2011
NOTE 5 RELATED PARTY TRANSACTIONS
The Company issued certain promissory notes to individuals as disclosed in Note 7. The individuals consist of an officer of the Company and a director of the Company. The Company received advances of $12,013 and $14,807, respectively; and made payments on these advances of $-0- during the years ended December 31, 2012 and 2011.
NOTE 6 NOTES PAYABLE
| Notes payable consisted of the following: | December 31, 2012 | December 31, 2011 | ||||||
| Note payable to a company, interest at 24% per annum, due on demand, unsecured | $ | 7,100 | $ | 7,100 | ||||
| Notes payable to individuals, interest at 10% per annum, due on demand, unsecured | 40,760 | 48,750 | ||||||
Note payable to an individual, interest at 10% per annum, due on August 27, 2012, unsecured, in default | 100,000 | — | ||||||
| Notes payable to an individual, interest at 6% per annum, due on July 13, 2013, unsecured | 100,000 | — | ||||||
| Notes payable to individuals, interest at 8% per annum, due on August 30,2013 and September 9, 2013, unsecured | 300,000 | — | ||||||
| Total Notes Payable | 547,860 | 55,850 | ||||||
| Less: Current Portion | (547,860 | ) | (55,850 | ) | ||||
| Long-Term Notes Payable | $ | — | $ | — | ||||
Accrued interest at December 31, 2012 and 2011 was $20,231 and $46,551, respectively.
START SCIENTIFIC, INC.
(formerly Secure Netwerks, Inc.)
Notes to the Financial Statements
December 31, 2012 and 2011
NOTE 7 NOTES PAYABLE – RELATED PARTIES
| Notes payable – related parties consisted of the following: | December 31, 2012 | December 31, 2011 | ||||||
| Note payable to a related individual, interest at 4% per annum, due on demand, unsecured | $ | 59,501 | $ | 52,220 | ||||
| Note payable to a related individual, interest at 0% per annum, due on demand, unsecured | 16,578 | 10,107 | ||||||
| Note payable to a related individual, interest at 0% per annum, due on demand, unsecured | 4,145 | 6,250 | ||||||
| Note payable to a related individual, interest at 10% per annum, due on demand, unsecured | 16,578 | — | ||||||
| Note payable to a company, due on demand, unsecured | 284 | 6,000 | ||||||
| Total Notes Payable – Related Parties | 97,086 | 99,577 | ||||||
| Less: Current Portion | (97,086 | ) | (99,577 | ) | ||||
| Long-Term Notes Payable – Related Parties | $ | — | $ | — | ||||
Accrued interest at December 31, 2012 and 2011 was $17,272 and $159,692, respectively.
NOTE 8 EQUITY TRANSACTIONS
500,000 common shares of Secure Networks, Inc. (Utah) were issued to the incorporator upon incorporation which included the assumption of $25,196 in liabilities.
500,000 common shares of Secure Netwerks, Inc. (Delaware) were issued on the basis of 1-for-1 for all of the outstanding shares of Secure Networks, Inc. (Utah) as part of the Company’s reincorporation into the State of Delaware. All references to shares issued and outstanding in the financial statements have been retroactively restated to reflect the effects of this change in capital structure.
On February 14, 2006, the Board of Directors approved the Company’s amended and restated Articles of Incorporation (Amendment). The Amendment increases the authorized shares of common stock from 10,000,000 to 100,000,000 shares. The Amendment also provides for a new class of preferred stock with 10,000,000 shares authorized. The rights and preferences of the preferred stock have yet to be determined. Both common and preferred stock have a par value of $0.001.
NOTE 8 EQUITY TRANSACTIONS (Continued)
On July 6, 2011, the Company issued 100 shares of Series “A” Preferred Stock in exchange for the forgiveness of $25,000 in debt. The Series A Preferred Stock carries no dividend, distribution, liquidation, or rights of conversion into common stock, but holds 10,000,000 votes per share.
On September 25, 2012, the Company entered into a consulting agreement with TEGA, LLC, a Kentucky-based consulting company. The Company issued 600,000 shares of its common stock to TEGA, LLC, 500,000 shares of its common stock to TEGA's transferee Frances Crew, and 100,000 shares of its common stock to TEGA's transferee Teddy Colley.
On August 15, 2012, the Company amended that certain consulting agreement with JT Arco, LLC. a New Jersey-based Corporation. Pursuant to the terms of the Addendum Agreement the Company issued an additional 500,000 restricted shares of its common stock.
On August 1, 2012, the Company issued 5,000,000 shares of common stock of the Company to an officer of the Company for services pertaining to business development.
On June 27, 2012, the Company entered into a consulting agreement with Morris Carlo White IV a Texas-based consultant. Pursuant to the terms of the Agreement the Company issued 65,000 restricted shares of its common stock.
On June 12, 2012, the Company entered into a consulting agreement with JT Arco, LLC. a New Jersey-based Corporation. Pursuant to the terms of the Agreement the Company issued 500,000 restricted shares of its common stock.
On May 16, 2012, the Company entered into an agreement to acquire all of the outstanding shares of Carpathian Energy SRL in exchange for 90,000,000 shares of restricted common stock of the Company. Carpathian is a Romanian limited liability company engaged in oil & gas exploration and development. Pursuant to the terms of the agreement, the former owners of Carpathian may rescind the Acquisition and reclaim the shares of Carpathian in the event that the Company does not invest at least $5 million toward development of Carpathian’s oil and gas assets. As of December 31, 2012, the conditions of the agreement had not been met.
On April 2, 2012, the Company entered into an agreement to acquire two separate one-fourth (1/4) working interests (collectively, the “Working Interests”) in certain oil and gas leases covering the Board of Education No. 6 Well located in Yazoo County, Mississippi. The consideration granted by the Company in exchange for the Working Interests consisted of 10,000,000 shares of restricted common stock.
On March 1, 2012, the Company accepted the subscription of an investor for $300,000 in exchange for 1,200,000 shares of restricted common stock.
On February 29, 2012, in exchange for $100,000, the Company issued 200,000 shares of restricted common stock and a promissory note in the original principal amount of $100,000 (“Note”) to an investor. The Note matures on August 27, 2012 and carries a fixed interest payment at maturity of $25,000.
NOTE 9 OPTIONS AND WARRANTS
The Company has adopted FASB ASC 718, “Share-Based Payments” (“ASC 718”) to account for its stock options. The Company estimates the fair value of each stock award at the grant date by using the Black-Scholes option pricing model. The assumptions used to calculate the fair value of options granted are evaluated and revised, as necessary, to reflect market conditions and our experience. Compensation expense is recognized only for those options expect to vest, with forfeitures estimated at the date of grant based on our historical experience and future expectations.
The following table summarizes the changes in options outstanding issued to employees of the Company:
| Number of Shares | Weighted Average Exercise Price | |||||||||
| Outstanding as of January 1, 2011 | — | $ | — | |||||||
| Granted | — | — | ||||||||
| Exercised | — | — | ||||||||
| Cancelled | — | — | ||||||||
| Outstanding at December 31, 2011 | — | $ | — | |||||||
| Granted | 10,500,000 | 0.65 | ||||||||
| Exercised | — | — | ||||||||
| Cancelled | — | 0.65 | ||||||||
| Outstanding at December 31, 2012 | 10,500,000 | $ | 0.65 | |||||||
Common stock options outstanding and exercisable as of December, 2012 are:
| Options Outstanding | Options Exercisable | |||||||||||||||||||
| Expiration Date | Exercise Price | Number shares outstanding | Weighted Average Contractual Life (Years) | Number Exercisable | Weighted Average Exercise Price | |||||||||||||||
| May 12, 2017 | $ | 0.65 | 10,500,000 | 5.00 | 2,625,000 | $ | 0.01 | |||||||||||||
| Total | 10,500,000 | 2,625,000 | ||||||||||||||||||
The fair value of these stock options granted and the significant assumptions used to determine those fair values, using a Black-Scholes option-pricing model are as follows:
| Significant assumptions: | ||||
| Risk-free interest rate: | 0.78 | % | ||
| Expected volatility: | 275 | % | ||
| Dividend yield: | 0.0 | % | ||
| Expected life: | 5 years | |||
START SCIENTIFIC, INC.
(formerly Secure Netwerks, Inc.)
Notes to the Financial Statements
December 31, 2012 and 2011
NOTE 10 FINANCIAL INSTRUMENTS
On January 1, 2008, the Company adopted FASB ASC 820-10-50, “Fair Value Measurements.” This guidance defines fair value, establishes a three-level valuation hierarchy for disclosures of fair value measurement and enhances disclosure requirements for fair value measures. The three levels are defined as follows:
Level 1 inputs to the valuation methodology are quoted prices (unadjusted) for identical assets or liabilities in active markets.
Level 2 inputs to the valuation methodology include quoted prices for similar assets and liabilities in active markets, and inputs that are observable for the asset or liability, either directly or indirectly, for substantially the full term of the financial instrument.
Level 3 inputs to valuation methodology are unobservable and significant to the fair measurement.
The carrying amounts reported in the balance sheets for the cash and cash equivalents, receivables and current liabilities each qualify as financial instruments and are a reasonable estimate of fair value because of the short period of time between the origination of such instruments and their expected realization and their current market rate of interest.
NOTE 11 GOING CONCERN
The accompanying financial statements have been prepared assuming that the Company will continue as a going concern, which contemplates the realization of assets and satisfaction of liabilities in the normal course of business. The Company has a working capital deficit, negative cash flows from operations and has sustained net losses from inception which have resulted in an accumulated deficit at December 31, 2012 of approximately $5,921,881 and has experienced periodic cash flow difficulties, all of which raise substantial doubt regarding the Company’s ability to continue as a going concern.
To date the Company has funded its operations through a combination of loans. The Company anticipates another net loss for the year ended December 31, 2013 and with the expected cash requirements for the coming year, there is substantial doubt as to the Company’s ability to continue operations.
The Company is attempting to improve these conditions by way of financial assistance through issuances of additional equity and by generating revenues through sales of products and services.
NOTE 12 COMMITMENTS & CONTINGENCIES
The Company had a month to month lease agreement which was terminated on December 31, 2010. Following the change of our business in March 2012, our offices were ultimately relocated to San Antonio, Texas. Rent expense was $10,701 and $-0-, respectively, for the years ended December 31, 2012 and 2011.
START SCIENTIFIC, INC.
(formerly Secure Netwerks, Inc.)
Notes to the Financial Statements
December 31, 2012 and 2011
NOTE 13 CONCENTRATIONS OF CREDIT RISK
Major Customers
The Company had -0- and 2 customers, respectively, who represented 10% or more of total sales for the years ended December 31, 2012 and 2011.
| December 31 | ||||||||
| 2012 | 2011 | |||||||
| Customer A | — | 54.2 | % | |||||
| Customer B | — | 13.9 | % | |||||
As of December 31, 2012 and 2011, Company had $-0- and $428, respectively, in accounts receivable due from these customers. The loss of these customers, although not anticipated, could have a material impact on the Company’s present and future operations.
Major Suppliers
The Company had -0- and 2 vendors who represented 10% or more of the total purchases for the years ended December 31, 2012 and 2011.
| December 31 | ||||||||
| 2012 | 2011 | |||||||
| Vendor A | — | 47.4 | % | |||||
| Vendor B | — | 19.4 | % | |||||
The loss of these vendors could have a temporary impact on operations; however, alternate suppliers are readily available that the Company feels could quickly fill the void, should it ever need to.
NOTE 14 SUBSEQUENT EVENTS
The Company has evaluated subsequent events from the balance sheet date through the date the financial statements were issued and has determined that there are no other events that would have a material impact on the financial statements.
ITEM 9: CHANGES IN AND DISAGREEMENTS WITH ACCOUNTANTS ON ACCOUNTING AND FINANCIAL DISCLOSURE
None.
ITEM 9A: CONTROLS AND PROCEDURES
Management’s Report on Disclosure Controls and Procedures
We maintain disclosure controls and procedures that are designed to ensure that information required to be disclosed in our reports filed under the Securities Exchange Act of 1934, as amended, is recorded, processed, summarized and reported within the time periods specified in the Securities and Exchange Commission's rules and forms, and that such information is accumulated and communicated to our management, to allow for timely decisions regarding required disclosure.
As of December 31, 2012, the end of our fiscal year covered by this report, we carried out an evaluation, under the supervision of our Chief Executive Officer and our Chief Financial Officer, of the effectiveness of the design and operation of our disclosure controls and procedures. Based on the foregoing, we concluded that our disclosure controls and procedures were in effective as of the end of the period covered by this annual report. Our board of directors has five members. We do not have a formal audit committee.
Management’s Report on Internal Control over Financial Reporting
Our management is responsible for establishing and maintaining adequate internal control over financial reporting (as defined in Rule 13a-15(f) under the Securities Exchange Act, as amended). In fulfilling this responsibility, estimates and judgments by management are required to assess the expected benefits and related costs of control procedures. The objectives of internal control include providing management with reasonable, but not absolute, assurance that assets are safeguarded against loss from unauthorized use or disposition, and that transactions are executed in accordance with management’s authorization and recorded properly to permit the preparation of consolidated financial statements in conformity with accounting principles generally accepted in the United States. Our management assessed the effectiveness of our internal control over financial reporting as of December 31, 2012. In making this assessment, our management used the criteria set forth by the Committee of Sponsoring Organizations of the Treadway Commission (“COSO”) in Internal Control-Integrated Framework. Our management has concluded that, as of December 31, 2012, our internal control over financial reporting is ineffective in providing reasonable assurance regarding the reliability of financial reporting and the preparation of financial statements for external purposes in accordance with US generally accepted accounting principles.
This annual report does not include an attestation report of the Company’s registered public accounting firm regarding internal control over financial reporting. Management’s report was not subject to attestation by the Company’s registered public accounting firm pursuant to temporary rules of the Securities and Exchange Commission that permit the Company to provide only management’s report in this annual report.
Inherent limitations on effectiveness of controls
Internal control over financial reporting has inherent limitations which include but is not limited to the use of independent professionals for advice and guidance, interpretation of existing and/or changing rules and principles, segregation of management duties, scale of organization, and personnel factors. Internal control over financial reporting is a process which involves human diligence and compliance and
is subject to lapses in judgment and breakdowns resulting from human failures. Internal control over financial reporting also can be circumvented by collusion or improper management override. Because of its inherent limitations, internal control over financial reporting may not prevent or detect misstatements on a timely basis, however these inherent limitations are known features of the financial reporting process and it is possible to design into the process safeguards to reduce, though not eliminate, this risk. Therefore, even those systems determined to be effective can provide only reasonable assurance with respect to financial statement preparation and presentation. Projections of any evaluation of effectiveness to future periods are subject to the risk that controls may become inadequate because of changes in conditions, or that the degree of compliance with the policies or procedures may deteriorate.
Changes in Internal Control over Financial Reporting
There have been no significant changes in our internal controls over financial reporting that occurred during the year ended December 31, 2012 that have materially or are reasonably likely to materially affect, our internal controls over financial reporting.
ITEM 9B: OTHER INFORMATION
None.
PART III
ITEM 10: DIRECTORS, EXECUTIVE OFFICERS, ANDCORPORATE GOVERNANCE
Directors and Executive Officers
| Name | Age | Position |
| S. Arne D. Greaves | 51 | Chief Executive Officer, Secretary, and Director |
| George Edwards | 65 | Chief Financial Officer and Director |
| Kenneth Denos | 45 | Director |
| Ruben Flores | 37 | Director |
S. Arne D. Greaves. Mr. Greaves, age 51, is the Chief Executive Officer and Chairman of the Board of Directors of the Company. Since 1983, he has been working in the oil and gas industry. In May 2001, Mr. Greaves co-founded Carpathian Energy Companie Petroliera S.R.L., a Romanian oil and gas production company, and has actively been involved the acquisition of concessions and development plans for reentries and development of new wells. Since November 2007, he has been the President of Livingston Operating Company, LLC, a family-owned oil and gas production company, based in Jackson, Mississippi.
George J. Edwards. Mr. Edwards, age 65, is the Chief Financial Officer and member of the board of directors of the Company. He has focused the past 37 years of his career negotiating international and domestic mergers and acquisitions for oil and gas, chemical, and technology corporations based in Texas and Pennsylvania. From June 1999 until March 2011, Mr. Edwards was the Executive Vice President and Director for Osyka Corporation, an oil and gas exploration and production company. He has a Bachelor of Science degree in Accounting from LaSalle University, a Master of Business Administration with a focus on Finance and Accounting from Harvard University: Graduate School of Business Administration, and a Juris Doctor from the University of Pennsylvania School of Law. Mr. Edwards is a member of the Pennsylvania State Bar. He has served as a former director of the Association of International Petroleum Negotiators and Vice Chairman of the Board of Directors and head of the policy committee for the Corporate Council on Africa, Mr. Edwards is currently a board member of the University of Pennsylvania Law School Alumni Association, and member of the Executive Leadership Council.
Kenneth Denos. In addition to his service as a non-executive director of the Company, Mr. Denos, age 45, is a director and the Secretary and Chief Compliance Officer for Equus Total Return, Inc. (“Equus”), a closed-end fund traded on the New York Stock Exchange. Mr. Denos is also the Chairman and CEO of the Acadia Group, Inc., an international corporate finance and investment firm. Mr. Denos’ other directorships include London Pacific & Partners, Inc., (a Los Angeles-based advisory and investment firm which specializes in the healthcare, hospitality, and natural resources industries), Vican Resources, Inc. (an oil and gas exploration and development company) and Scorpex, Inc. (a provider of first toxic and hazardous waste storage, treatment, and disposal in Mexico). From August 2007 to June 2009, Mr. Denos was the President and CEO of Equus, and prior to that time, served as the EVP of Equus. From May 2006 to July 2009 Mr. Denos was the Chief Executive Officer of MCC Global NV (FSE: IFQ2) an international financial services and investment conglomerate based in London and traded on the Geregeltermarkt of the Frankfurt Stock Exchange. For the past 14 years, Mr. Denos has served as a director or principal for several small-cap public companies on the London AIM, Frankfurt Stock Exchange, New York Stock Exchange, and the OTC Bulletin Board, and has worked closely with many public and private emerging growth companies throughout the world. In addition to a Bachelor of Science degree in Business Finance and Political Science, he holds a Master of Business Administration and a Juris Doctor from the University of Utah.
Ruben Flores. Mr. Flores, age 37. Mr. Flores is a non-executive director of the Company. He specializes in corporate finance with commercial lenders, hedge funds, private equity groups, and other forms of structured finance. Mr. Flores is the founder and has been the President of Definitive Commercial Capital, a Texas-based strategic finance company, since July 2005. Prior to July 2005, he was involved in the real estate mortgage industry. During March 2008, Mr. Flores filed a chapter 13 bankruptcy, and on October 2009 he voluntarily dismissed the bankruptcy. He has a Bachelor of Business Administration from the University of Incarnate Word in San Antonio, Texas.
Compensation of Directors
Although we anticipate compensating the members of our Board of Directors in the future at industry levels, the current members are not paid cash compensation for their service as directors. Each director may be reimbursed for certain expenses incurred in attending Board of Directors’ and committee meetings. We are contemplating the issuance of stock or stock options of shares of the Company to our directors for their service on the Board of Directors.
Board of Directors Meetings and Committees
Although various items were reviewed and approved by the Board of Directors during 2012, the Board of Directors held only one formal meeting during the fiscal year ended December 31, 2012. The remaining actions of the Board were approved by unanimous written consent.
The Company does not have Audit or Compensation Committees of the Board of Directors.
Code of Ethics
The Company expects that its Officers and Directors will maintain appropriate standards of honesty and ethical conduct in connection with the performance of their duties on behalf of the Company. In recognition of this expectation, the Company has adopted a Code of Ethics. The purpose of this Code of Ethics is to codify standards the Company believes are reasonably necessary to deter wrongdoing and to promote honest and ethical conduct, including the ethical handling of actual or apparent conflicts of interest between personal and professional relationships and full, fair, accurate, timely and understandable disclosure in reports and documents that the Company files with, or submits to, the Securities and Exchange Commission (the “SEC”), or other regulatory bodies and in other public communications made by the Company.
Section 16(a) Beneficial Ownership Reporting Compliance
We are required to identify each person who was an officer, director or beneficial owner of more than 10% of our registered equity securities during our most recent fiscal year and who failed to file on a timely basis reports required by Section 16(a) of the Securities Exchange Act of 1934.
For the 2012 fiscal year we are unaware of any officer, director or beneficial owner of more that 10% of our registered equity securities who failed to file reports on a timely basis in accordance with Section 16(a) of the Securities Exchange Act of 1934.
ITEM 11: EXECUTIVE COMPENSATION
The following table summarizes the total compensation, for the two fiscal years ended December 31, 2012 and 2011, of our executive officers. Our company did not award cash bonuses, stock awards, stock options or non-equity incentive plan compensation to any Named Executive Officer during the past two fiscal years, thus these items are omitted from the table below:
Summary Compensation Table
| Name and Principal Position | Year | Salary | Stock Awards | All Other Compensation | Total | |||||||||||||||
| S. Arne D. Greaves | 2012 | $ | 92,500 | $ | — | $ | — | $ | 92,500 | |||||||||||
| Chief Executive | 2011 | $ | — | $ | — | $ | — | $ | — | |||||||||||
| Officer (1) | ||||||||||||||||||||
| George Edwards | 2012 | $60,000 (4) | $ | — | $ | __ | $ | 60,000 | ||||||||||||
| Chief Financial | 2011 | $ | — | $ | — | $ | — | $ | — | |||||||||||
| Officer (2) | ||||||||||||||||||||
| John D. Thomas | 2012 | $ | 59,200 | $ | — | $ | — | $ | 59,200 | |||||||||||
| VP of Business | 2011 | $ | — | $ | — | $ | — | $ | — | |||||||||||
| Development (3) | ||||||||||||||||||||
(1) Appointed May 3, 2012.
(2) Appointed May 3, 2012.
(3) Appointed August 15, 2012.
Aggregated Option Exercises in Last Fiscal Year and Year End Option Values
| Number of Unexercised Options at December 31, 2012 | Value of Unexercised In-the-Money Options at December 31, 2012 (1) | |||||||||||||||
Name | Shares Acquired On Exercise |
Value Realized |
Exercisable/ Unexercisable
|
Exercisable/ Unexercisable | ||||||||||||
| Kenneth Denos | 0 | 0 | 250,000/750,000 | 0/0 | ||||||||||||
| S. Arne D. Greaves | 0 | 0 | 1,250,000/3,750,000 | 0/0 | ||||||||||||
| George Edwards | 0 | 0 | 625,000/1,875,000 | 0/0 | ||||||||||||
| Ruben Flores | 0 | 0 | 250,000/750,000 | 0/0 | ||||||||||||
| Scott Bouslog | 0 | 0 | 250,000/750,000 | 0/0 | ||||||||||||
(1) Based on the closing sales price of the Common Stock on the NASD Electronic Bulletin Board on December 31, 2012 of $0.00269.
Employment Agreements
S. Arne D. Greaves and George Edwards are subject to an employment agreement with Start Scientific, Inc.
ITEM 12: SECURITY OWNERSHIP OF CERTAIN BENEFICIAL OWNERS AND MANAGEMENT AND RELATED STOCKHOLDER MATTERS
The following table sets forth certain information regarding the beneficial ownership of our common stock (par value $0.001 per share) as of April 9, 2012 by (i) each person (or group of affiliated persons) who is known by us to beneficially own more than 5% of the outstanding shares of our common stock, (ii) each person serving as a director or executive officer of the Company, and (iii) all directors and executive officers of the Company as a group. As of such date, we had 109,615,000 shares of common stock outstanding.
|
Name of Beneficial Owner(1) |
Number of Shares Beneficially Owned (2) |
Percent of Class(3) |
| S. Arne D. Greaves(4) | 1,250,000 | 1.13% |
| George Edwards(5) | 625,000 | * |
| Kenneth Denos(6) | 262,657 | * |
| Ruben Flores(7) | 250,000 | * |
| Standard Energy, LLC(8) | 100,000,000 | 91.23% |
| John Thomas(9) | 105,000,000 | 95.79% |
|
All officers and directors as a group (4 persons) (10) |
2,387,657 |
2.13% |
* Indicates ownership of less than 1%.
(1) The address of each officer, director, and beneficial owner is c/o the Company, 6 Champion Trail, San Antonio, TX 78006.
(2) The number of shares of common stock beneficially owned by any shareholder is determined by the sum of (i) all shares of common stock held directly or indirectly by such shareholder, and (ii) shares of common stock subject to options, warrants and/or conversion rights deemed beneficially owned by the shareholder that are currently exercisable or exercisable within 60 days. Excludes shares of Series A Preferred Stock beneficially held by Kenneth Denos that are not convertible into common stock but collectively hold 1,000,000,000 voting rights and are entitled to vote together with holders of common stock on all such matters upon which common stockholders may vote.
(3) The calculation of percentage of beneficial ownership is based upon: (i) 109,615,000 shares of common stock outstanding as of April 12, 2013, and (ii) shares of common stock subject to options, warrants and/or conversion rights deemed beneficially held by the shareholder that are currently exercisable or exercisable within 60 days. The percentage ownership of any shareholder is determined by assuming that the shareholder has exercised all options, warrants, and conversion rights to obtain additional securities, and that no other shareholder has exercised such rights. Except as otherwise indicated below, the persons and entity named in the table have sole voting and investment power with respect to all shares of common stock and voting rights shown as beneficially owned by them, subject to applicable community property laws.
(4) Chief Executive Officer, Secretary, and Chairman of the Board of Directors. Includes 1,250,000 vested options to purchase shares of common stock based upon a May 4, 2012 award date. The exercise price for the stock options is $.65 per share.
(5) Chief Financial Officer, and member of the Board of Directors. Includes 625,000 vested options to purchase shares of common stock based upon a May 4, 2012 award date. The exercise price for the stock options is $.65 per share.
(6) Controlling shareholder of the Company. Includes 12,657 shares held directly. Excludes 100 shares of Series A Preferred Stock held by Acadia Group, Inc., a corporation owned and controlled by Mr. Denos. The Series A Preferred Stock carries no dividend, distribution, or liquidation, or common stock conversion rights, but holds 10,000,000 votes per share, enabling Mr. Denos to unilaterally control the election of the Board of Directors. If the Series A Preferred Stock is taken into account in determining percentage of beneficial ownership, Mr. Denos would beneficially hold 99.81% of the voting shares of the Company. Includes 250,000 vested options to purchase shares of common stock based upon a May 4, 2012 award date. The exercise price for the stock options is $.65 per share.
(7) Member of the Board of Directors. Includes 250,000 vested options to purchase shares of common stock based upon a May 4, 2012 award date. The exercise price for the stock options is $.65 per share.
(8) Principal shareholder of the Company. Includes 100,000,000 shares of common stock held directly.
(9) Vice President of Business Development, and principal shareholder of the Company. Includes 100,000,000 shares of common stock held directly by Standard Energy, LLC which is owned and controlled by a trust, of which Mr. Thomas serves as the trustee, and 5,000,000 shares of common stock held directly.
(10) Includes 2,625,000 vested options to purchase shares of common stock based upon a May 4, 2012 award date. The exercise price for the stock options is $.65 per share.
Changes in Control
On July 6, 2011, in exchange for the forgiveness of $25,000 in amounts owed, the Company issued 100 shares of Series “A” Preferred Stock to Acadia Group, Inc., a corporation owned and controlled by Kenneth Denos, then a member of the Board of Directors of the Company. The Series A Preferred Stock carries no dividend, distribution, liquidation, or rights of conversion into common stock, but holds 10,000,000 votes per share, enabling Mr. Denos to unilaterally control the election of the Board of Directors.
Securities Authorized for Issuance Under Equity Compensation Plans
On May 4, 2012, the Company adopted its 2012 Equity Incentive Plan (the "Plan"). The Plan allows for the grant and issuance of common stock purchase options and grants of restricted common stock to employees, non-employee directors, consultants, and advisors of the Company. The Plan reserves for issuance thereunder 20,000,000 shares. Not all of the Options granted under the Plan are vested, some Options are subject to various performance criteria as set forth in the respective consulting and employment agreements of the Plan participants. The foregoing summary of the Plan does not purport to be complete and is qualified in its entirety by reference to the Company’s 2012 Equity Incentive Plan, 2012 Equity Incentive Plan (incorporated by reference to Exhibit 99.1 to Registrant’s Current Report on Form 8-K filed on May 9, 2012).
ITEM 13: CERTAIN RELATIONSHIPS AND RELATED TRANSACTIONS, AND DIRECTOR INDEPENDENCE
On July 6, 2011, in exchange for the forgiveness of $25,000 in amounts owed, the Company issued 100 shares of Series “A” Preferred Stock to Kenneth I. Denos, P.C., a corporation owned and controlled by Kenneth Denos, then a member of the Board of Directors of the Company. The Series A Preferred Stock carries no dividend, distribution, liquidation, or rights of conversion into common stock, but holds 10,000,000 votes per share, enabling Mr. Denos to unilaterally control the election of the Board of Directors.
On June 10, 2004, $80,000 was loaned to the Company in the form of the payment of outstanding liabilities on behalf of the Company, and on January 1, 2005, the Company issued 3 promissory notes to the following individuals to formalize these non-cash payments in the prior year:
| £ | Chene Gardner ($6,250), a former member of the Board of Directors and the Company’s CEO; |
| £ | Kenneth Denos ($25,000), a former member of the Board of Directors; and |
| £ | Travis Pera ($23,750), son of Walter Pera, former Chairman of the Board of Directors. |
The notes each mature upon demand, are unsecured, and bear interest at the rate of ten percent per annum.
Director Independence
Ruben Flores is the only Director considered to be independent, inasmuch as he does not beneficially hold greater than a 10% ownership interest in our common stock and is unrelated to any of our shareholders who hold any such interest. We have not established any board committees. We hope in the future to add at least one independent director and establish one or more board committees including, in particular, an audit committee.
ITEM 14: PRINCIPAL ACCOUNTANT FEES AND SERVICES
Change in Auditors
On or about March 31, 2011, our previous independent accountant, Chisholm, Bierwolf, Nilson & Morrill, LLP (“CBNM”) was dismissed due to the fact that CBNM informed the Company of the pending revocations of CBNM’s registration with the Public Company Accounting Oversight Board. Also on March 31, 2011, the Company engaged Morrill & Associates, LLC as our independent accountants.
During the period from the engagement of the former auditors through the change of auditors, including the registrant’s most recent fiscal year and the subsequent interim period, there were no disagreements with the former auditors, whether or not resolved, on any matter of accounting principles or practices, financial statements disclosure, or auditing scope or procedure, which, if not resolved to the former auditor’s satisfaction, would have caused it to make reference to the subject matter of the disagreement(s) in connection with its report.
The reports of CBNM did not contain any adverse opinion or disclaimer of opinion and were not qualified or modified as to uncertainty, audit scope or accounting principles.
Fees Billed For Audit and Non-Audit Services
The following table represents the aggregate fees billed for professional audit services rendered to the Company by Morrill and CBNM for the audit of the Company’s annual financial statements for the years ended December 31, 2012and 2011, respectively, and all fees billed for other services rendered by Morrill and CBNM during those periods.
| Year Ended December 31 | 2012 | 2011 | ||||||
| Audit Fees(1) | $ | 16,403 | $ | 14,097 | ||||
| Audit-Related Fees(2) | 0 | 0 | ||||||
| Tax Fees(3) | 0 | 0 | ||||||
| All Other Fees(4) | 0 | 0 | ||||||
| Total Accounting Fees and Services | $ | 16,403 | $ | 14,097 | ||||
(1) Audit Fees. These are fees for professional services for the audit of the Company’s annual financial statements, and for the review of the financial statements included in the Company’s filings on Form 10-Q, and for services that are normally provided in connection with statutory and regulatory filings or engagements.
(2) Audit-Related Fees. These are fees for the assurance and related services reasonably related to the performance of the audit or the review of the Company’s financial statements.
(3) Tax Fees. These are fees for professional services with respect to tax compliance, tax advice, and tax planning.
(4) All Other Fees. These are fees for permissible work that does not fall within any of the other fee categories, i.e., Audit Fees, Audit-Related Fees, or Tax Fees.
ITEM 15: EXHIBITS AND FINANCIAL STATEMENT SCHEDULES.
The following exhibits are filed with or incorporated by referenced in this report:
| Item No. | Description |
| 10.1 | 2012 Equity Incentive Plan (incorporated by reference to Exhibit 99.1 to Registrant’s Current Report on Form 8-K filed on May 9, 2012). |
| 10.2 | Reserves and Economic Evaluation, Aluko & Associates |
| 14.1 | Code of Ethics for the Registrant. |
| 21.1 | Subsidiaries of the Registrant. |
| 31.1* | Certification pursuant to Section 302 of the Sarbanes-Oxley Act of 2002 for S. Arne D. Greaves. |
| 31.2* | Certification pursuant to Section 302 of the Sarbanes-Oxley Act of 2002 for George Edwards. |
| 32.1* | Certification pursuant to Section 906 of the Sarbanes-Oxley Act of 2002 for S. Arne D. Greaves. |
| 32.1* | Certification pursuant to Section 906 of the Sarbanes-Oxley Act of 2002 for George Edwards. |
* filed herewith.
SIGNATURES
In accordance with Section 13 or 15(d) of the Exchange Act, the Company caused this report to be signed on its behalf by the undersigned, thereunto duly authorized.
| START SCIENTIFIC, INC. | ||||
| Date: | April 15, 2013 | By: | /s/ S. Arne D. Greaves | |
| S. Arne D. Greaves | ||||
| Chief Executive Officer | ||||
In accordance with the Exchange Act, this report has been signed below by the following persons on behalf of the Company and in the capacities and on the dates indicated.
| Signature | Title | Date | ||
|
/s/ S. Arne D. Greaves |
Chairman and Chief Executive Officer |
April 15, 2013 | ||
|
/s/ George Edwards |
Director and Chief Financial Officer |
April 15, 2013 |