Attached files
| file | filename |
|---|---|
| EX-99.1 - EXHIBIT 99.1 - ESB FINANCIAL CORP | v341556_ex99-1.htm |
| EX-99.3 - EXHIBIT 99.3 - ESB FINANCIAL CORP | v341556_ex99-3.htm |
| 8-K - 8-K - ESB FINANCIAL CORP | v341556_8k.htm |
Exhibit 99.2

ESB Financial Corp. ANNUAL MEETING PRESENTATION APRIL 17, 2013

Thank You For Turning Off Your Cell Phone
FORWARD LOOKING STATEMENTS This presentation contains certain forward - looking statements (as defined in the Private Securities Litigation Reform Act of 1995 ) . In the normal course of business, we, in an effort to help keep our shareholders and the public informed about our operations, may from time to time issue or make certain statements, either in writing or orally, that are or contain forward - looking statements, as that term is defined in the U . S . federal securities laws . Generally, these statements relate to business plans or strategies, projected or anticipated benefits from acquisitions made by or to be made by us, projections involving anticipated revenues, earnings, profitability or other aspects of operating results or other future developments in our affairs or the industry in which we conduct business . Forward - looking statements may be identified by reference to a future period or periods or by the use of forward - looking terminology such as “anticipate,” “believe,” “expect,” “intend, “plan,” “estimate” or similar expressions . Although we believe that the anticipated results or other expectations reflected in our forward - looking statements are based on reasonable assumptions we can give no assurance that those results or expectations will be attained . Forward - looking statements involve risks, uncertainties and assumptions (some of which are beyond our control) and as a result actual results may differ materially from those expressed in forward - looking statements . Factors that could cause actual results to differ from forward - looking statements include, but are not limited to, the following : investments in our business and technology ; general economic or industry conditions ; changes in interest rates ; conditions in the securities markets and funding sources ; changes in laws, regulations and policies ; industry changes in information technology systems ; competition ; acquisition charges ; and acts or threats of terrorism . You should not put undue reliance on any forward - looking statements . Forward - looking statements speak only as of the date they are made and we undertake no obligation to update them in light of new information or future events except to the extent required by federal securities laws . For a more detailed description of outcomes described in these forward - looking statement or the factors that may affect our operating results, please refer to our filings with the Securities and Exchange Commission, including our Annual Report on Form 10 - K for the year ended December 31 , 2012 . For more information, please visit our website at www . esbbank . com .
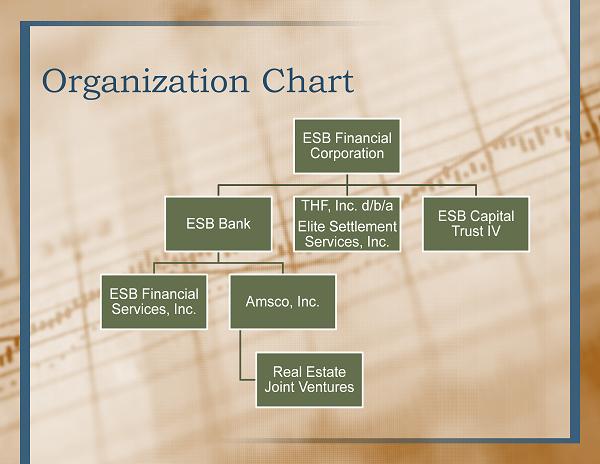
Organization Chart ESB Financial Corporation ESB Bank ESB Financial Services, Inc. Amsco , Inc. Real Estate Joint Ventures THF, Inc. d/b/a Elite Settlement Services, Inc. ESB Capital Trust IV
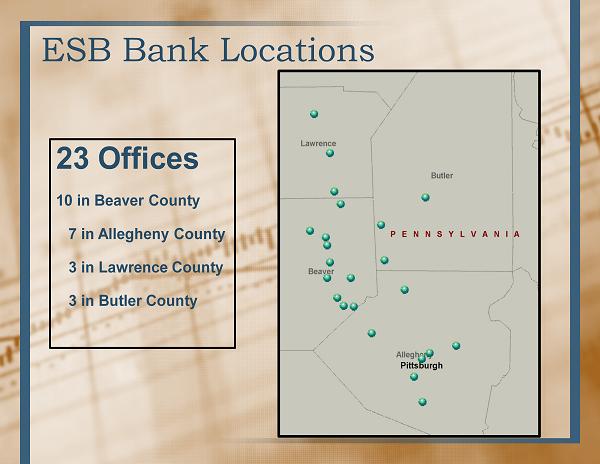
ESB Bank Locations 23 Offices 10 in Beaver County 7 in Allegheny County 3 in Lawrence County 3 in Butler County
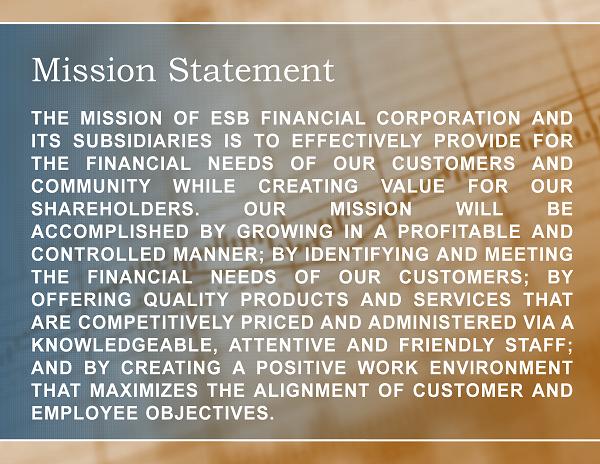
Mission Statement THE MISSION OF ESB FINANCIAL CORPORATION AND ITS SUBSIDIARIES IS TO EFFECTIVELY PROVIDE FOR THE FINANCIAL NEEDS OF OUR CUSTOMERS AND COMMUNITY WHILE CREATING VALUE FOR OUR SHAREHOLDERS . OUR MISSION WILL BE ACCOMPLISHED BY GROWING IN A PROFITABLE AND CONTROLLED MANNER ; BY IDENTIFYING AND MEETING THE FINANCIAL NEEDS OF OUR CUSTOMERS ; BY OFFERING QUALITY PRODUCTS AND SERVICES THAT ARE COMPETITIVELY PRICED AND ADMINISTERED VIA A KNOWLEDGEABLE, ATTENTIVE AND FRIENDLY STAFF ; AND BY CREATING A POSITIVE WORK ENVIRONMENT THAT MAXIMIZES THE ALIGNMENT OF CUSTOMER AND EMPLOYEE OBJECTIVES .

Values We Share • Our Purpose • Our Foundation • Our Goal • Our Style • Our Responsibility • Our Strength • Customer Satisfaction • Integrity • Excellence • Teamwork • Community Involvement • Leadership
Summary of Operating Strategy • Earnings

Earnings per Share (diluted) $0.20 $0.40 $0.60 $0.80 $1.00 $1.20 2008 2009 2010 2011 2012 $0.70 $0.83 $0.98 $1.02 $1.03
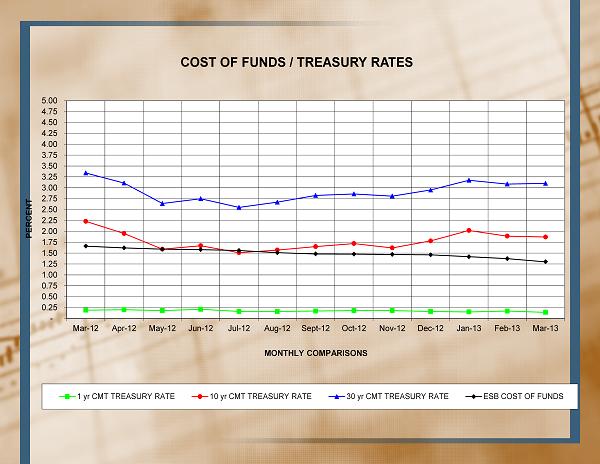
- 0.25 0.50 0.75 1.00 1.25 1.50 1.75 2.00 2.25 2.50 2.75 3.00 3.25 3.50 3.75 4.00 4.25 4.50 4.75 5.00 Mar-12 Apr-12 May-12 Jun-12 Jul-12 Aug-12 Sept-12 Oct-12 Nov-12 Dec-12 Jan-13 Feb-13 Mar-13 PERCENT MONTHLY COMPARISONS COST OF FUNDS / TREASURY RATES 1 yr CMT TREASURY RATE 10 yr CMT TREASURY RATE 30 yr CMT TREASURY RATE ESB COST OF FUNDS
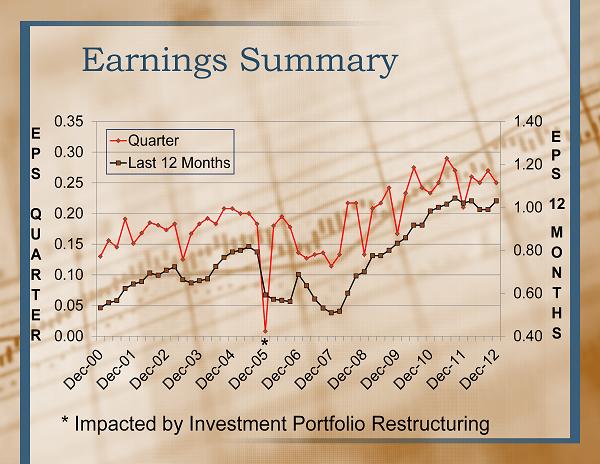
Earnings Summary 0.40 0.60 0.80 1.00 1.20 1.40 0.00 0.05 0.10 0.15 0.20 0.25 0.30 0.35 Quarter Last 12 Months * * Impacted by Investment Portfolio Restructuring M O N T H S 12 E P S Q U A R T E R E P S
Summary of Operating Strategy • Earnings • Growth through Acquisition
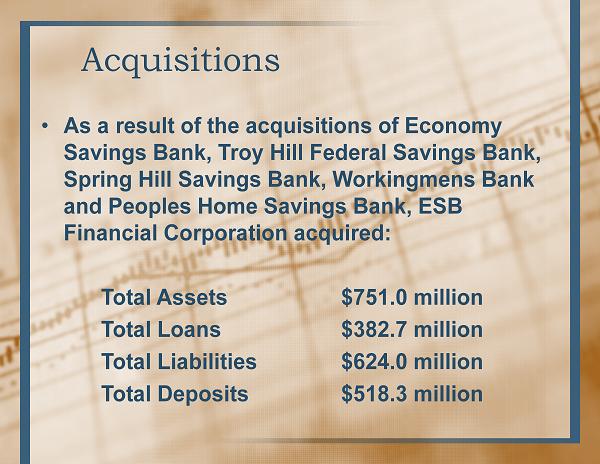
Acquisitions • As a result of the acquisitions of Economy Savings Bank, Troy Hill Federal Savings Bank, Spring Hill Savings Bank, Workingmens Bank and Peoples Home Savings Bank, ESB Financial Corporation acquired: Total Assets $751.0 million Total Loans $382.7 million Total Liabilities $624.0 million Total Deposits $518.3 million

Total Assets (at year end) $1,850 $1,900 $1,950 $2,000 2008 2009 2010 2011 2012 $1,974.8 $1,960.7 $1,913.9 $1,964.8 $1,927.6 Total Assets ($millions)
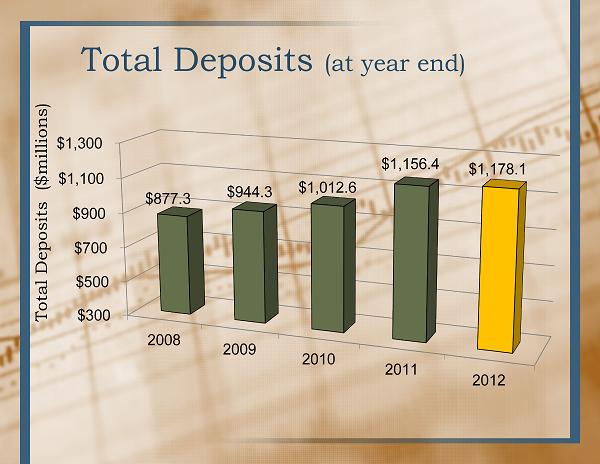
Total Deposits (at year end) $300 $500 $700 $900 $1,100 $1,300 2008 2009 2010 2011 2012 $877.3 $944.3 $1,012.6 $1,156.4 $1,178.1 Total Deposits ($millions)
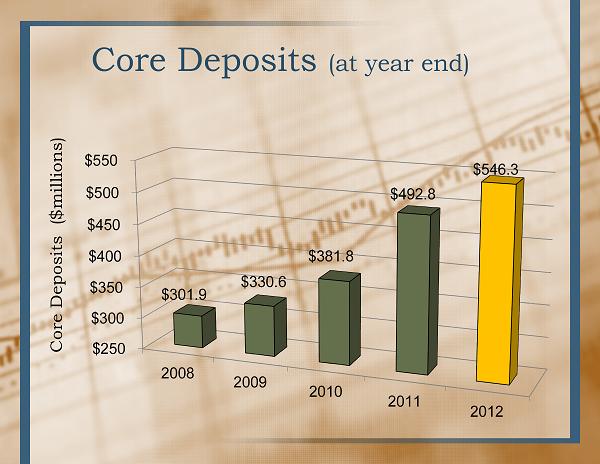
Core Deposits (at year end) $250 $300 $350 $400 $450 $500 $550 2008 2009 2010 2011 2012 $301.9 $330.6 $381.8 $492.8 $546.3 Core Deposits ($millions)
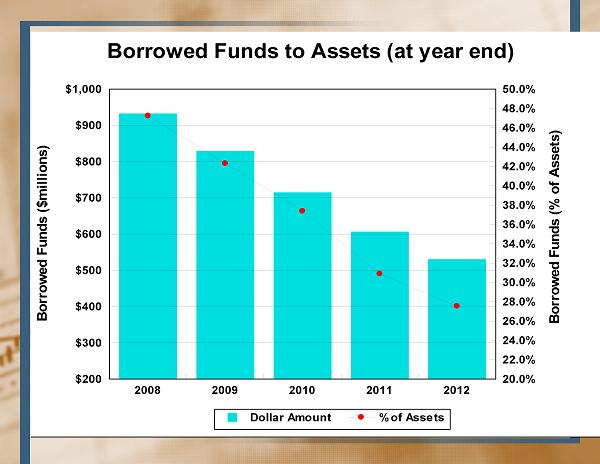
2008 2009 2010 2011 2012 $200 $300 $400 $500 $600 $700 $800 $900 $1,000 20.0% 22.0% 24.0% 26.0% 28.0% 30.0% 32.0% 34.0% 36.0% 38.0% 40.0% 42.0% 44.0% 46.0% 48.0% 50.0% Dollar Amount % of Assets Borrowed Funds to Assets (at year end) Borrowed Funds ($millions) Borrowed Funds (% of Assets)

Loans Receivable, Net (at year end) $200 $300 $400 $500 $600 $700 2008 2009 2010 2011 2012 $691.3 $671.4 $640.9 $648.9 $672.1 Loans Receivable, Net ($millions)
Summary of Operating Strategy • Earnings • Growth through Acquisition • Capital Management
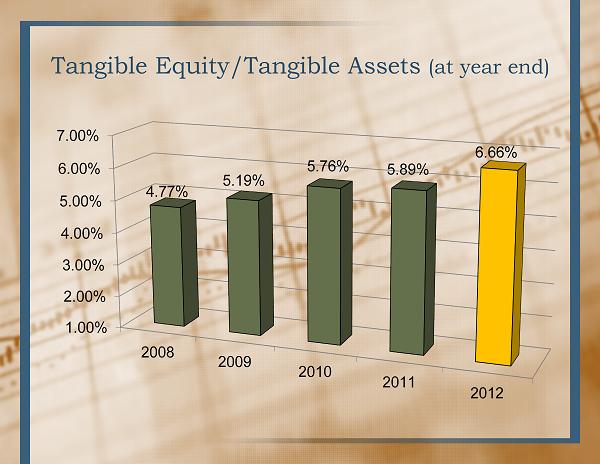
Tangible Equity/Tangible Assets (at year end) 1.00% 2.00% 3.00% 4.00% 5.00% 6.00% 7.00% 2008 2009 2010 2011 2012 4.77% 5.19% 5.76% 5.89% 6.66%
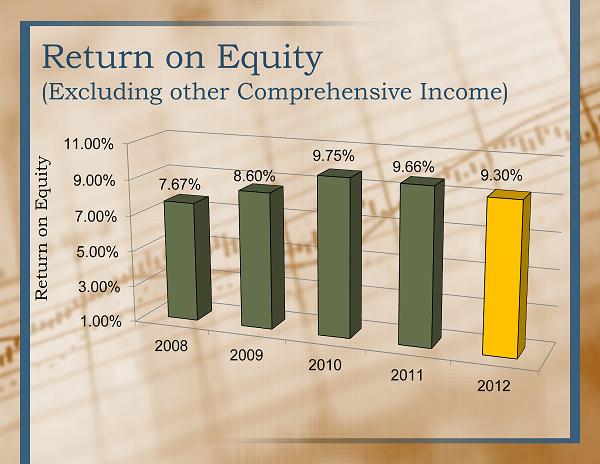
Return on Equity (Excluding other Comprehensive Income) 1.00% 3.00% 5.00% 7.00% 9.00% 11.00% 2008 2009 2010 2011 2012 7.67% 8.60% 9.75% 9.66% 9.30% Return on Equity
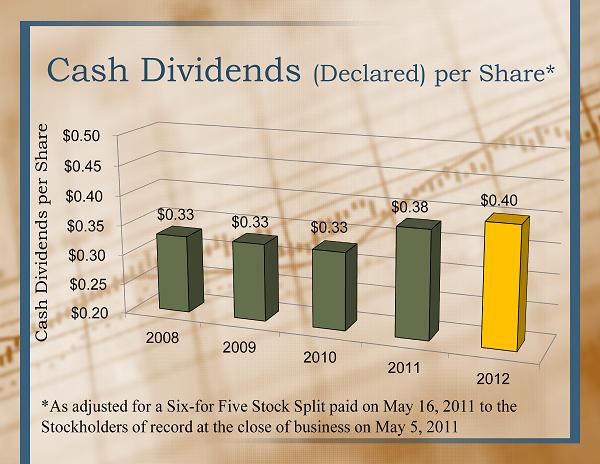
Cash Dividends (Declared) per Share* $0.20 $0.25 $0.30 $0.35 $0.40 $0.45 $0.50 2008 2009 2010 2011 2012 $0.33 $0.33 $0.33 $0.38 $0.40 Cash Dividends per Share *As adjusted for a Six - for Five Stock Split paid on May 16, 2011 to the Stockholders of record at the close of business on May 5, 2011

Stock Split – May 2013 • Six - for - Five Stock Split • To be Paid May 17, 2013 • To Stockholders of Record at the Close of Business on May 3, 2013 * The basic net income, diluted net income and dividends declared per share have not been adjusted to reflect the six - for - five stock split declared April 16, 2013 for stockholders of record May 3, 2013. The stock split will be paid May 17, 2013.
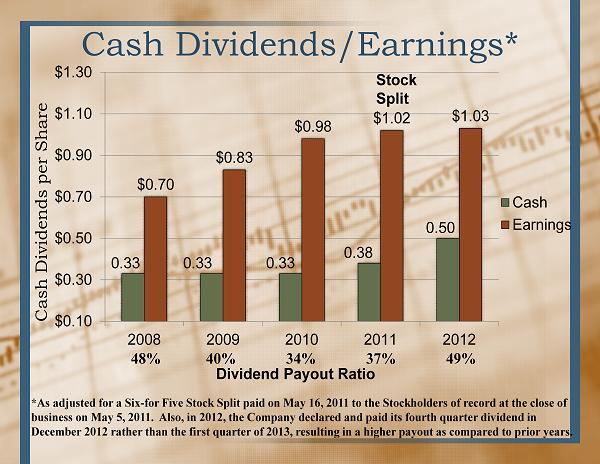
Cash Dividends/Earnings* 0.33 0.33 0.33 0.38 0.50 $0.70 $0.83 $0.98 $1.02 $1.03 $0.10 $0.30 $0.50 $0.70 $0.90 $1.10 $1.30 2008 2009 2010 2011 2012 Cash Earnings 48% 40% 34% 37% Dividend Payout Ratio Cash Dividends per Share 49% Stock Split *As adjusted for a Six - for Five Stock Split paid on May 16, 2011 to the Stockholders of record at the close of business on May 5, 2011. Also, in 2012, the Company declared and paid its fourth quarter dividend in December 2012 rather than the first quarter of 2013, resulting in a higher payout as compared to prior years.
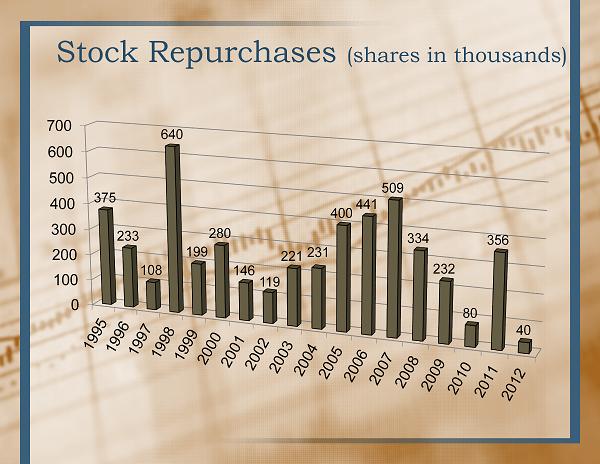
Stock Repurchases (shares in thousands) 0 100 200 300 400 500 600 700 375 233 108 640 199 280 146 119 221 231 400 441 509 334 232 80 356 40
Summary of Operating Strategy • Earnings • Growth through Acquisitions • Capital Management • Increase Shareholder Value

Stock Split/Dividend History ∙ 20% Stock Splits – January 1992 – July 1992 – January 1993 – June 1993 – January 1994 – January 1995 – May 2001 – October 2002 – May 2003 – May 2011 – May 2013 ∙ 10% Stock Dividends – August 1997 – May 1998 – May 2000
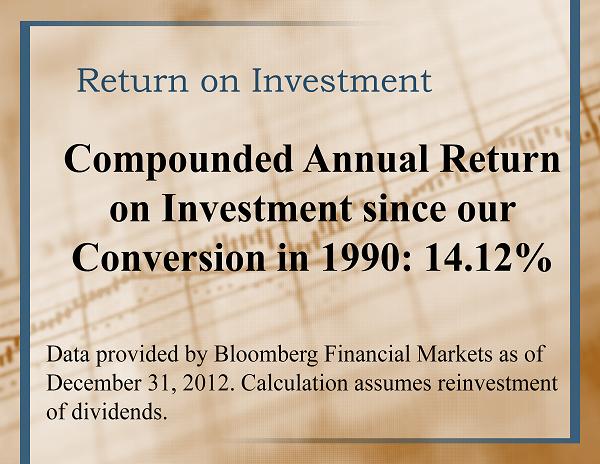
Return on Investment Compounded Annual Return on Investment since our Conversion in 1990: 14.12% Data provided by Bloomberg Financial Markets as of December 31, 2012. Calculation assumes reinvestment of dividends.

Market Performances of ESBF vs Other Indexes (12/31/12) 8.59% 7.43% 7.93% 13.50% 0.00% 2.00% 4.00% 6.00% 8.00% 10.00% 12.00% 14.00% 16.00% Since June 30, 1990 S&P 500 Index Russell 2000 NASDAQ Bank ESBF Calculated by Bloomberg Financial Markets.
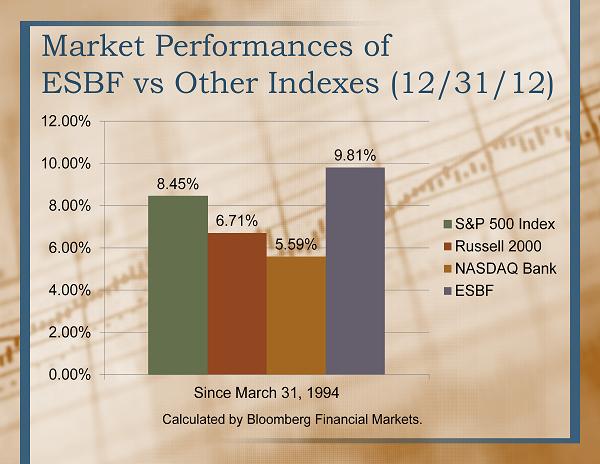
Market Performances of ESBF vs Other Indexes (12/31/12) 8.45% 6.71% 5.59% 9.81% 0.00% 2.00% 4.00% 6.00% 8.00% 10.00% 12.00% Since March 31, 1994 S&P 500 Index Russell 2000 NASDAQ Bank ESBF Calculated by Bloomberg Financial Markets.

Market Performances of ESBF vs Other Indexes (12/31/12) 6.00% 7.37% 4.42% 10.05% 0.00% 2.00% 4.00% 6.00% 8.00% 10.00% 12.00% Since March 31, 1997 S&P 500 Index Russell 2000 NASDAQ Bank ESBF Calculated by Bloomberg Financial Markets.
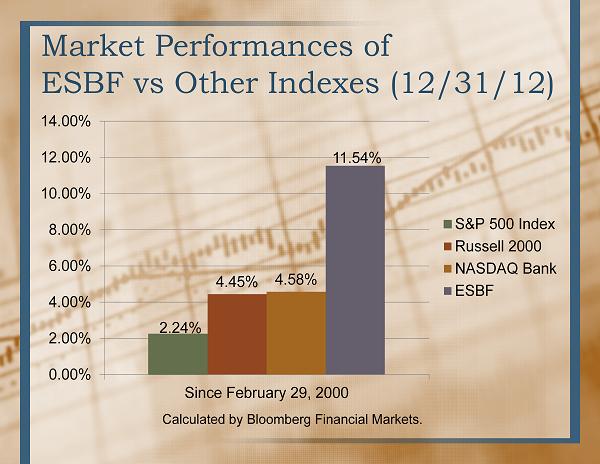
Market Performances of ESBF vs Other Indexes (12/31/12) 2.24% 4.45% 4.58% 11.54% 0.00% 2.00% 4.00% 6.00% 8.00% 10.00% 12.00% 14.00% Since February 29, 2000 S&P 500 Index Russell 2000 NASDAQ Bank ESBF Calculated by Bloomberg Financial Markets.
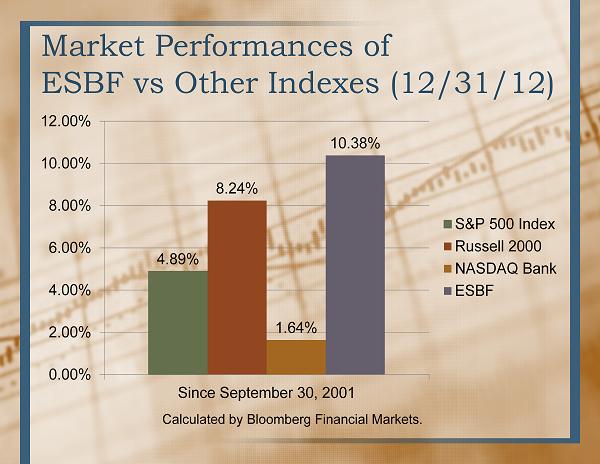
Market Performances of ESBF vs Other Indexes (12/31/12) 4.89% 8.24% 1.64% 10.38% 0.00% 2.00% 4.00% 6.00% 8.00% 10.00% 12.00% Since September 30, 2001 S&P 500 Index Russell 2000 NASDAQ Bank ESBF Calculated by Bloomberg Financial Markets.
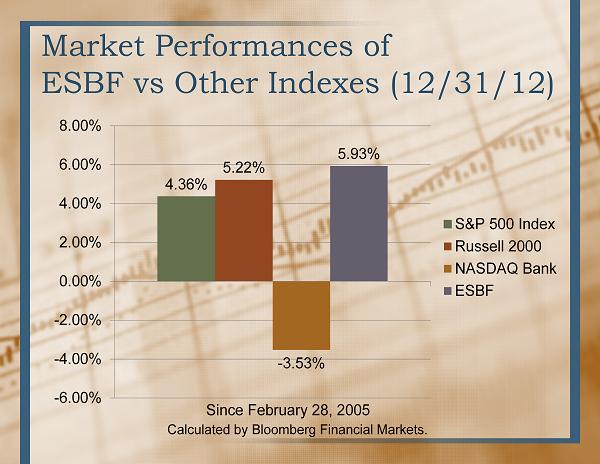
Market Performances of ESBF vs Other Indexes (12/31/12) 4.36% 5.22% - 3.53% 5.93% -6.00% -4.00% -2.00% 0.00% 2.00% 4.00% 6.00% 8.00% S&P 500 Index Russell 2000 NASDAQ Bank ESBF Since February 28, 2005 Calculated by Bloomberg Financial Markets.
Summary of Operating Strategy • Earnings • Growth through Acquisition • Capital Management • Increase Shareholder Value • Maintain Asset Quality
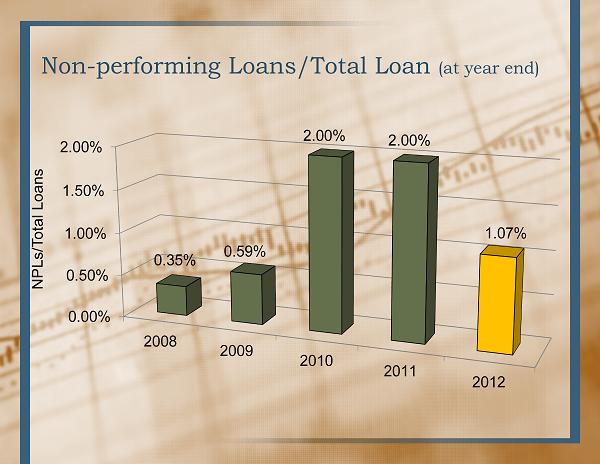
Non - performing Loans/Total Loan (at year end) 0.00% 0.50% 1.00% 1.50% 2.00% 2008 2009 2010 2011 2012 0.35% 0.59% 2.00% 2.00% 1.07% NPLs/Total Loans
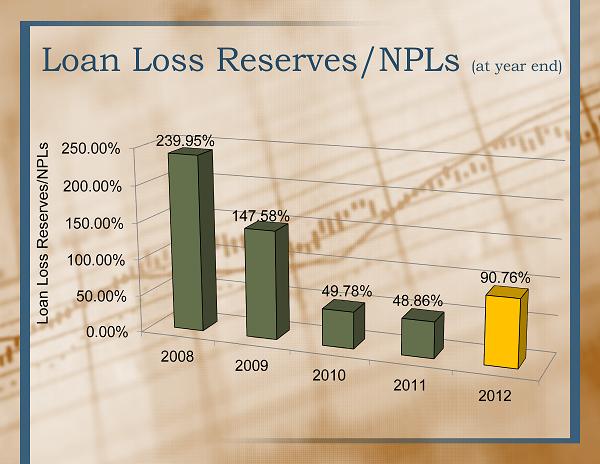
Loan Loss Reserves/NPLs (at year end) 0.00% 50.00% 100.00% 150.00% 200.00% 250.00% 2008 2009 2010 2011 2012 239.95% 147.58% 49.78% 48.86% 90.76% Loan Loss Reserves/NPLs
Summary of Operating Strategy • Earnings • Growth through Acquisition • Capital Management • Increase Shareholder Value • Maintain Asset Quality • Retain Emphasis on Real Estate Lending
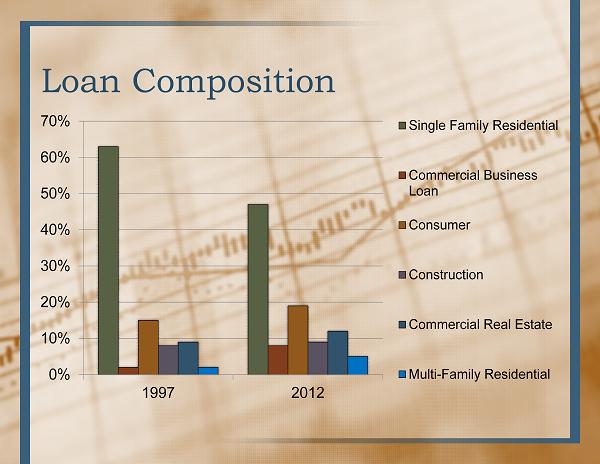
Loan Composition 0% 10% 20% 30% 40% 50% 60% 70% 1997 2012 Single Family Residential Commercial Business Loan Consumer Construction Commercial Real Estate Multi-Family Residential
Summary of Operating Strategy • Earnings • Growth through Acquisition • Capital Management • Increase Shareholder Value • Maintain Asset Quality • Retain Emphasis on Real Estate Lending • Control Operating Expenses and Increase Noninterest Income
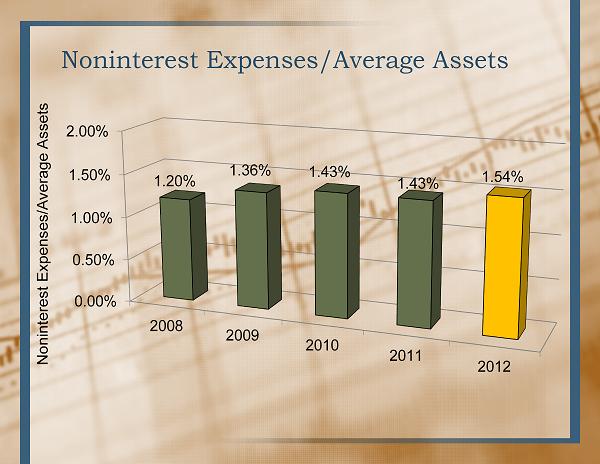
Noninterest Expenses/Average Assets 0.00% 0.50% 1.00% 1.50% 2.00% 2008 2009 2010 2011 2012 1.20% 1.36% 1.43% 1.43% 1.54% Noninterest Expenses/Average Assets
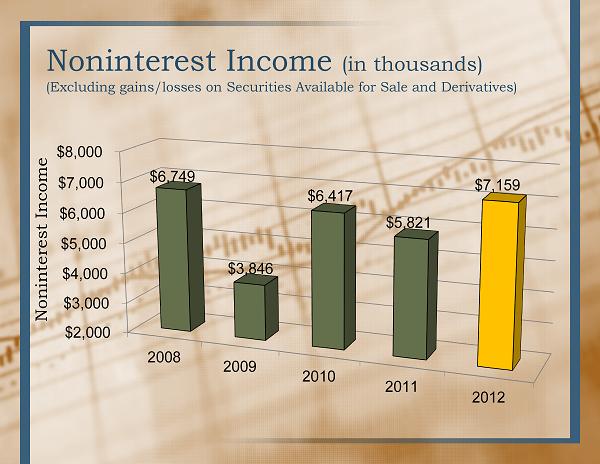
Noninterest Income (in thousands) (Excluding gains/losses on Securities Available for Sale and Derivatives) $2,000 $3,000 $4,000 $5,000 $6,000 $7,000 $8,000 2008 2009 2010 2011 2012 $6,749 $3,846 $6,417 $5,821 $7,159 Noninterest Income
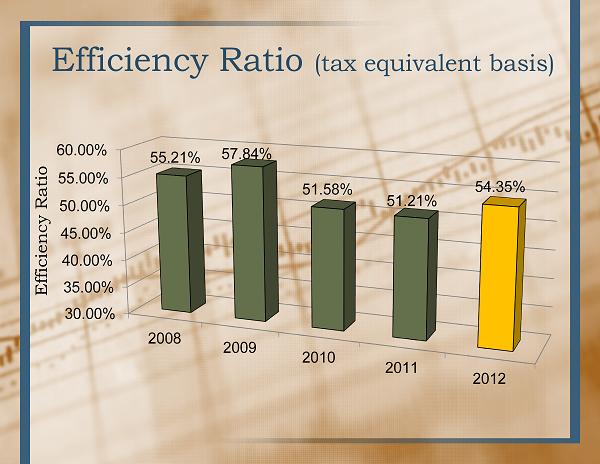
Efficiency Ratio (tax equivalent basis) 30.00% 35.00% 40.00% 45.00% 50.00% 55.00% 60.00% 2008 2009 2010 2011 2012 55.21% 57.84% 51.58% 51.21% 54.35% Efficiency Ratio
Accomplishments for 2012 • Record Earnings 4 years in row • Nationally ranked 4 years in a row by SNL Financial - in the top 10 of the Nation’s 100 largest Public Thrifts by asset size, ranked by financial performance for 12 months ended March 31, 2012. • Pittsburgh Post - Gazette first ever Top Places to Work survey, ESB Bank was selected as a Top Place to Work • Included in Russell 2000 Index • Named Best Places to Work in Western Pennsylvania by the Pittsburgh Business Times in 2004, 2005, 2006, 2009, 2010, 2011 and 2012 • Community Service Program – 4,223 Community Service Hours by employees in 2012 • Casual for Charity raised over $22,500

Accomplishments • Beaver County Times – 2012 Silver Winner – Best of the Valley category: Bank - Times circulation • Ellwood Ledger – 2012 Gold Winner – Best of the Best: Bank – the Ledgers circulation area • New Castle News – Best of the Best – 2012 Gold Winner: Bank - New Castle Area
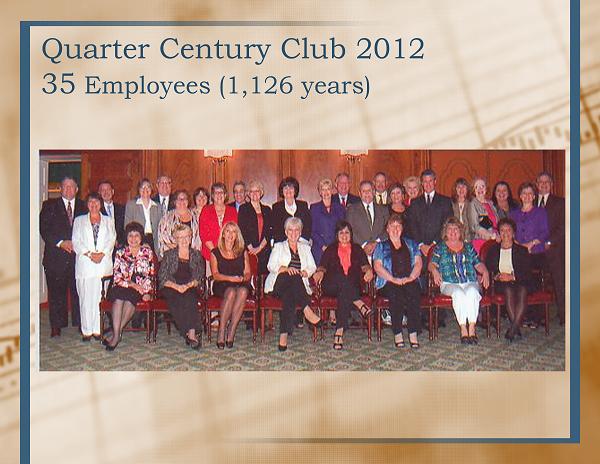
Quarter Century Club 2012 35 Employees (1,126 years)
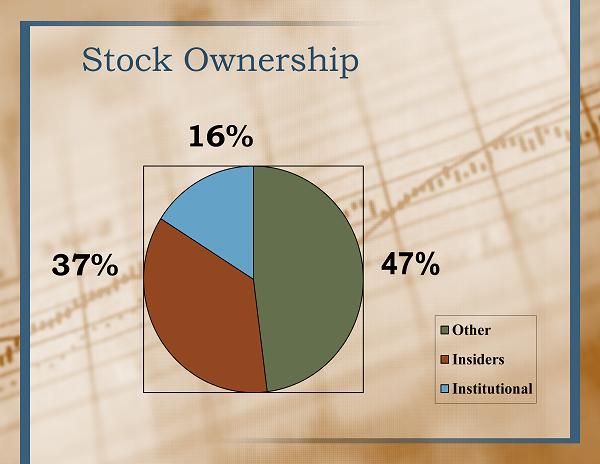
Stock Ownership Other Insiders Institutional 47% 16% 37%
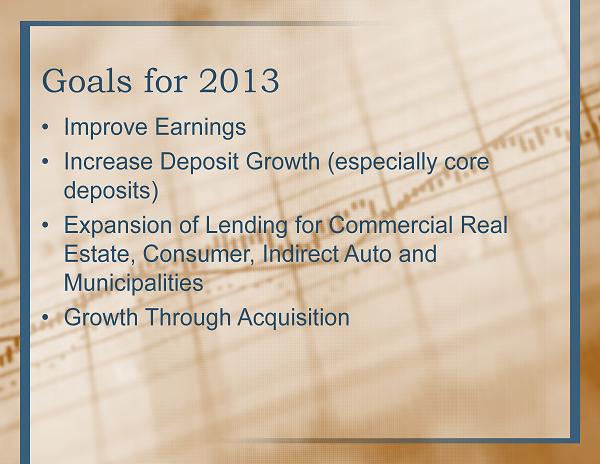
Goals for 2013 • Improve Earnings • Increase Deposit Growth (especially core deposits) • Expansion of Lending for Commercial Real Estate, Consumer, Indirect Auto and Municipalities • Growth Through Acquisition
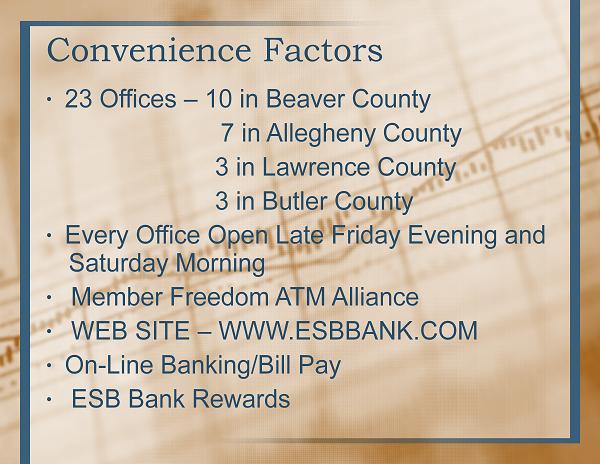
Convenience Factors ∙ 23 Offices – 10 in Beaver County 7 in Allegheny County 3 in Lawrence County 3 in Butler County ∙ Every Office Open Late Friday Evening and Saturday Morning ∙ Member Freedom ATM Alliance ∙ WEB SITE – WWW.ESBBANK.COM ∙ On - Line Banking/Bill Pay ∙ ESB Bank Rewards
Best Places to Work 2004, 2005, 2006, 2009, 2010, 2011 and 2012

Thank you for Attending .