Attached files
| file | filename |
|---|---|
| 8-K - 8-K - NATIONAL FUEL GAS CO | d520550d8k.htm |
 National Fuel Gas Company
Investor Presentation
April 2013
Exhibit 99 |
 April 2013
National Fuel Gas Company
2
Safe Harbor For Forward Looking Statements
This presentation may contain “forward-looking statements” as defined by the
Private Securities Litigation Reform Act of 1995, including statements regarding future prospects, plans, performance
and capital structure, anticipated capital expenditures and completion of construction projects,
as well as statements that are identified by the use of the words “anticipates,” “estimates,”
“expects,” “forecasts,” “intends,” “plans,”
“predicts,” “projects,” “believes,” “seeks,” “will,” “may,” and similar expressions. Forward-looking statements involve risks and uncertainties, which could
cause actual results or outcomes to differ materially from those expressed in the
forward-looking statements. The Company’s expectations, beliefs and projections contained herein are expressed
in good faith and are believed to have a reasonable basis, but there can be no assurance that
such expectations, beliefs or projections will result or be achieved or accomplished.
In addition to other factors, the following are important factors that could cause actual
results to differ materially from results referred to in the forward-looking statements: factors affecting the
Company’s ability to successfully identify, drill for and produce economically viable
natural gas and oil reserves, including among others geology, lease availability, title disputes, weather conditions,
shortages, delays or unavailability of equipment and services required in drilling operations,
insufficient gathering, processing and transportation capacity, the need to obtain governmental
approvals and permits, and compliance with environmental laws and regulations; changes in laws,
regulations or judicial interpretations to which the Company is subject, including those involving
derivatives, taxes, safety, employment, climate change, other environmental matters, real
property, and exploration and production activities such as hydraulic fracturing; changes in the price of
natural gas or oil; impairments under the SEC’s full cost ceiling test for natural gas and
oil reserves; uncertainty of oil and gas reserve estimates; significant differences between the Company’s
projected and actual production levels for natural gas or oil; changes in demographic patterns
and weather conditions; changes in the availability, price or accounting treatment of derivative
financial instruments; governmental/regulatory actions, initiatives and proceedings, including
those involving rate cases (which address, among other things, allowed rates of return, rate design and
retained natural gas), environmental/safety requirements, affiliate relationships, industry
structure, and franchise renewal; delays or changes in costs or plans with respect to Company projects or
related projects of other companies, including difficulties or delays in obtaining necessary
governmental approvals, permits or orders or in obtaining the cooperation of interconnecting facility
operators; financial and economic conditions, including the availability of credit, and
occurrences affecting the Company’s ability to obtain financing on acceptable terms for working capital, capital
expenditures and other investments, including any downgrades in the Company’s credit
ratings and changes in interest rates and other capital market conditions; changes in economic conditions,
including global, national or regional recessions, and their effect on the demand for, and
customers’ ability to pay for, the Company’s products and services; the creditworthiness or performance of
the Company’s key suppliers, customers and counterparties; economic disruptions or
uninsured losses resulting from major accidents, fires, severe weather, natural disasters, terrorist activities, acts
of war, cyber attacks or pest infestation; changes in price differential between similar
quantities of natural gas at different geographic locations, and the effect of such changes on the demand for
pipeline transportation capacity to or from such locations; other changes in price differentials
between similar quantities of oil or natural gas having different quality, heating value, geographic
location or delivery date; significant differences between the Company’s projected and
actual capital expenditures and operating expenses; changes in laws, actuarial assumptions, the interest rate
environment and the return on plan/trust assets related to the Company’s pension and other
post-retirement benefits, which can affect future funding obligations and costs and plan liabilities; the
cost and effects of legal and administrative claims against the Company or activist shareholder
campaigns to effect changes at the Company; increasing health care costs and the resulting effect on
health insurance premiums and on the obligation to provide other post-retirement benefits;
or increasing costs of insurance, changes in coverage and the ability to obtain insurance.
Forward-looking statements include estimates of oil and gas quantities. Proved oil and
gas reserves are those quantities of oil and gas which, by analysis of geoscience and engineering data, can be
estimated with reasonable certainty to be economically producible under existing economic
conditions, operating methods and government regulations. Other estimates of oil and gas quantities,
including estimates of probable reserves, possible reserves, and resource potential, are by
their nature more speculative than estimates of proved reserves. Accordingly, estimates other than
proved reserves are subject to substantially greater risk of being actually realized. Investors
are urged to consider closely the disclosure in our Form 10-K available at
You can also obtain this form on the SEC’s website at For a
discussion of the risks set forth above and other factors that could cause actual results to differ materially from results referred to in the forward-looking statements, see “Risk Factors” in the
Company’s Form 10-K for the fiscal year ended September 30, 2012 and Form 10-Q for
the period ended December 31, 2012. The Company disclaims any obligation to update any forward-looking
statements to reflect events or circumstances after the date thereof or to reflect the
occurrence of unanticipated events. |
 April 2013
National Fuel Gas Company
3
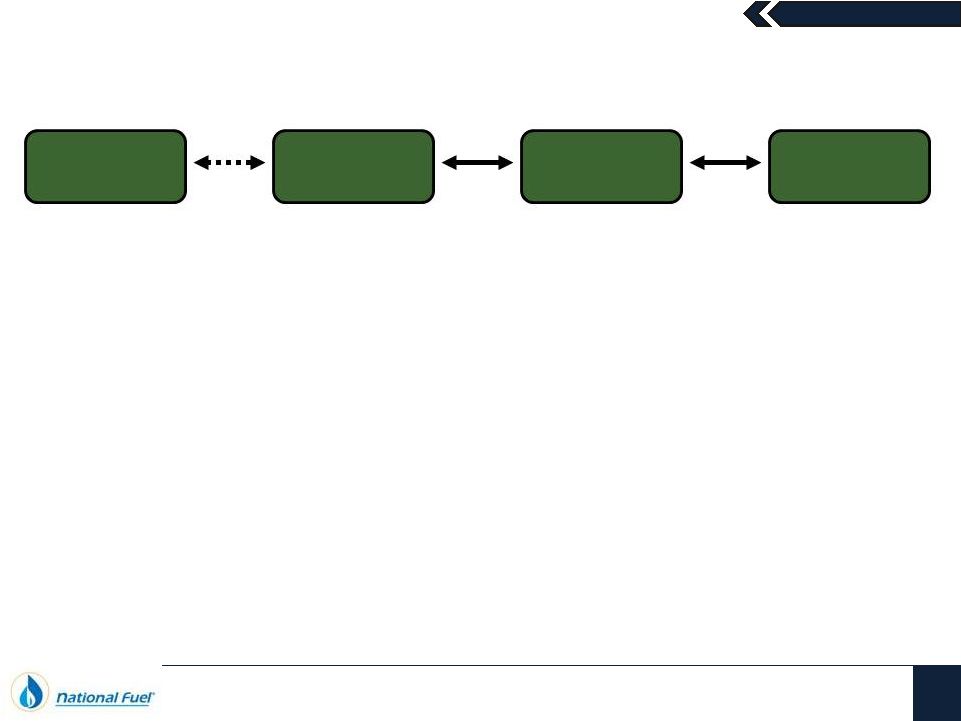
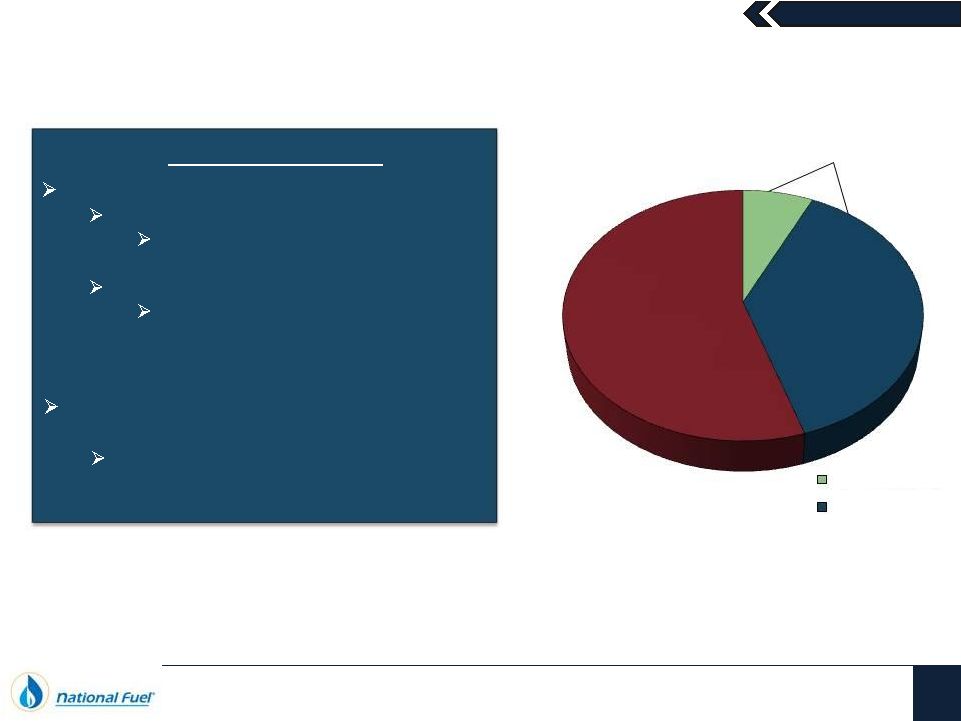
Our Business Mix Leads to Long-Term Value Creation
Upstream
Crude Oil
Midstream
Downstream
National Fuel Gas
Supply Corporation
Empire Pipeline, Inc.
National Fuel Gas
Midstream Corporation
National Fuel Gas
Distribution
Corporation
National Fuel
Resources, Inc.
The strategic, operational and financial benefits, along with capital
flexibility and consistent growth opportunities generated by this
integrated mix of businesses continues to create significant
long-term value for the Company’s shareholders in nearly all
economic and commodity price scenarios
Upstream
Natural Gas
Seneca Resources
Corporation
(West Division)
Seneca Resources
Corporation
(East Division) |
 April 2013
National Fuel Gas Company
4
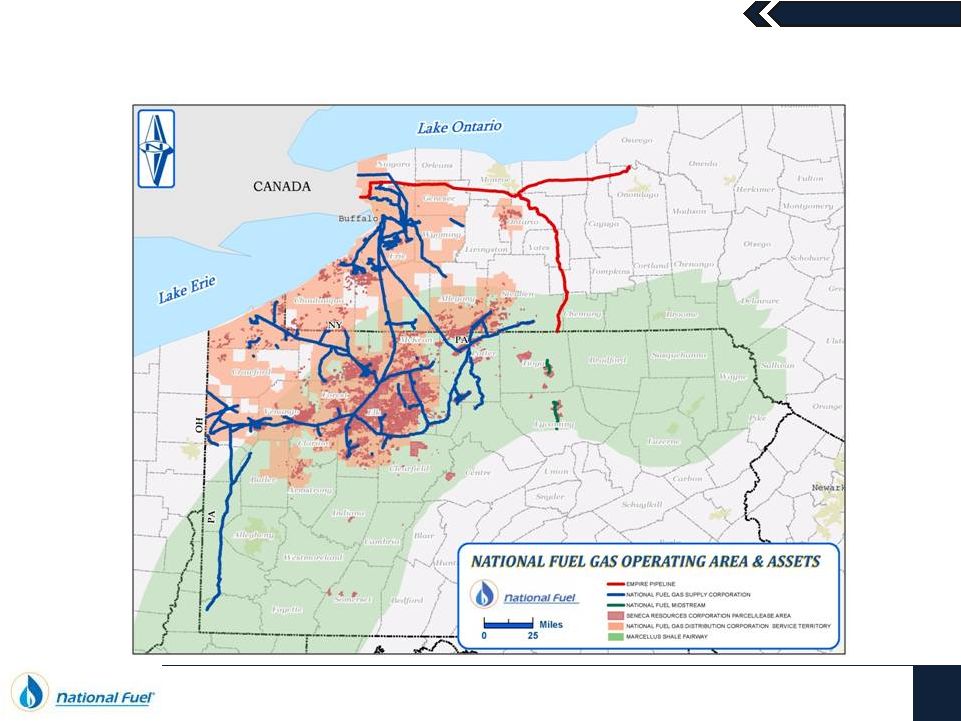
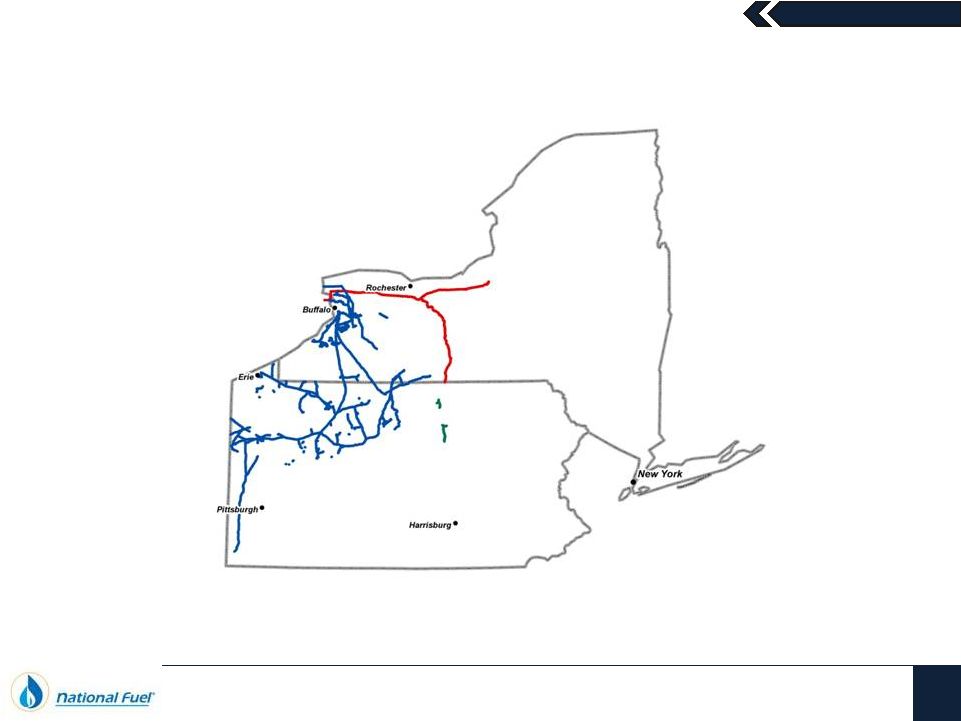
Integrated Businesses with Significant Marcellus Exposure… |
 April 2013
National Fuel Gas Company
5
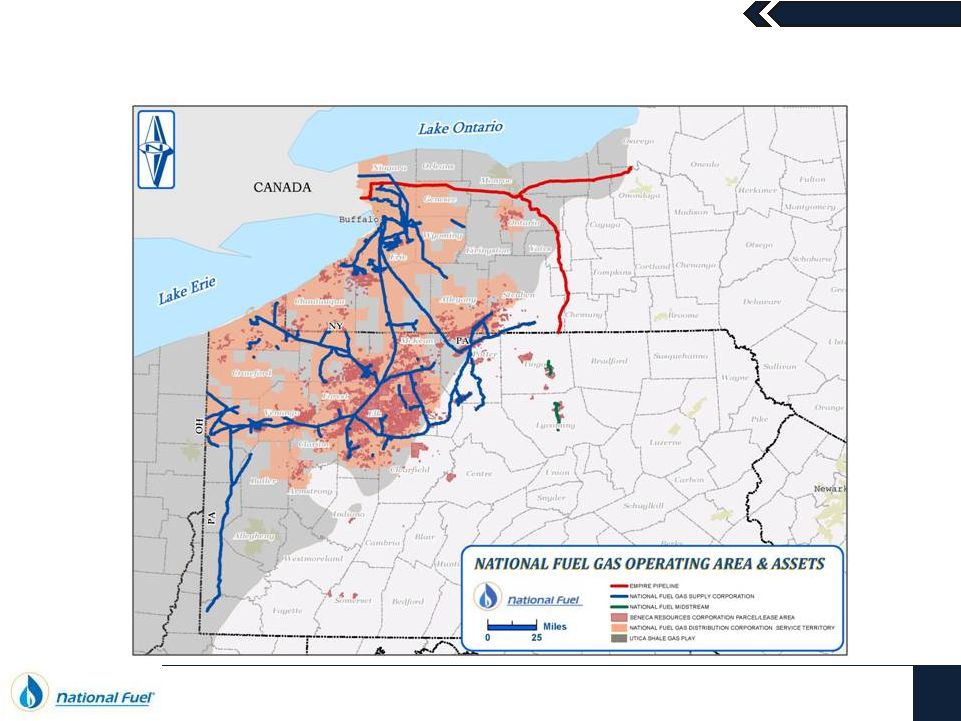
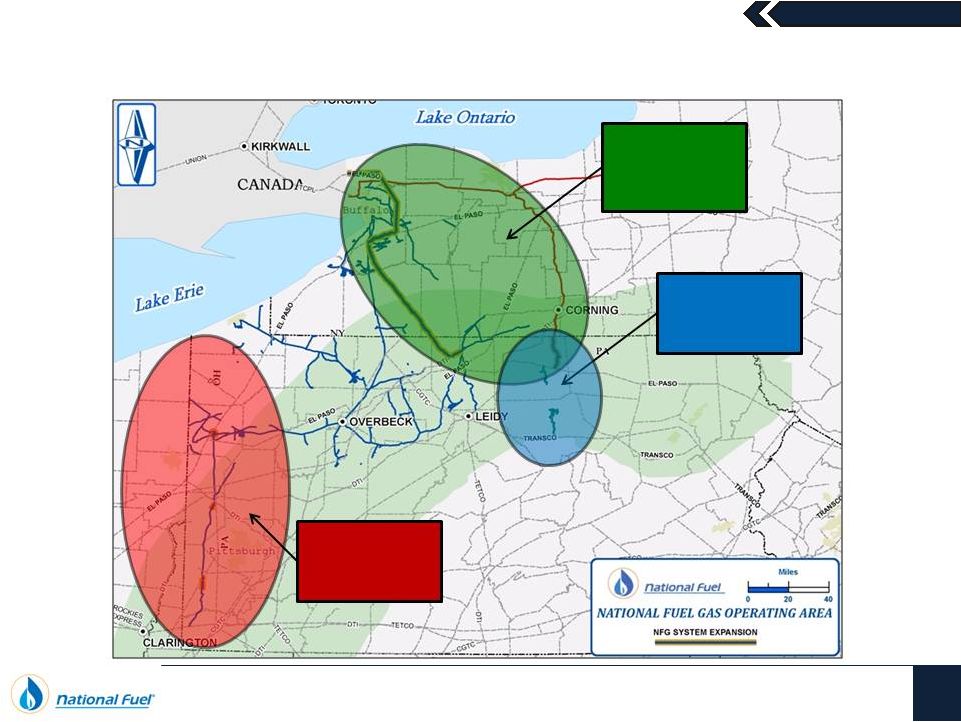
…And Exposure to Growth from the Utica Shale |
 April 2013
National Fuel Gas Company
6
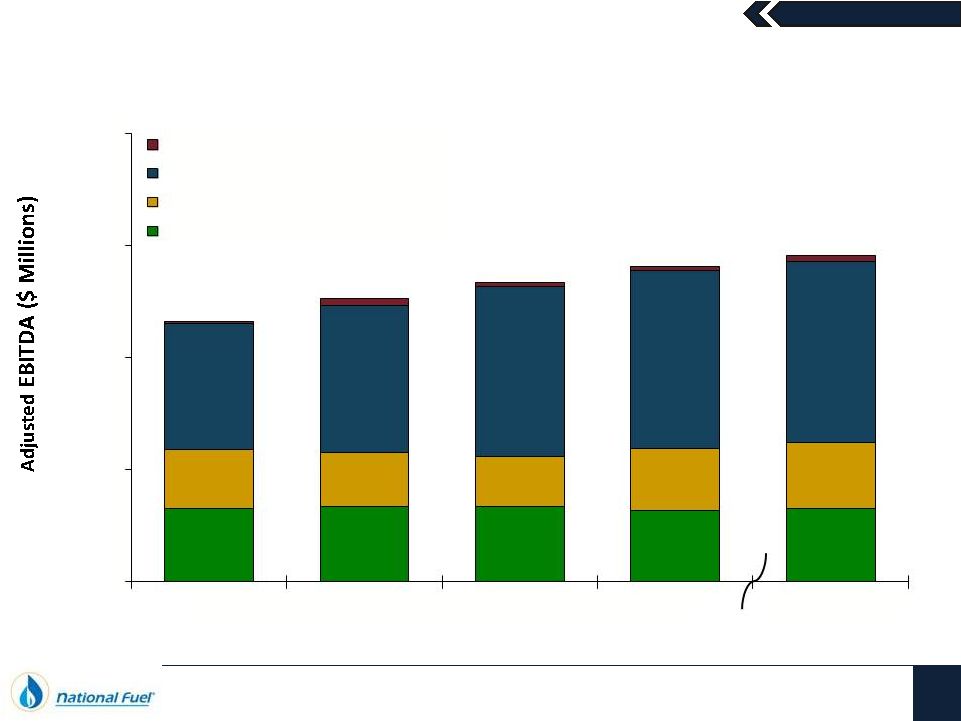
EBITDA Growth Driven by Stability and Continued Success
$0
$250
$500
$750
$1,000
2009
2010
2011
2012
12 Months Ended
12/31/2012
Midstream, Energy Marketing & Other
Exploration & Production Segment
Pipeline & Storage Segment
Utility Segment
$164
28%
$167
26%
$169
25%
$160
23%
$164
23%
$131
$121
19%
$111
17%
$137
19%
$146
20%
$280
48%
$327
52%
$377
57%
$397
56%
$404
56%
$581
$632
$668
$704
$727
23%
Fiscal Year
Note: A reconciliation of Adjusted EBITDA to Net Income as presented on the Consolidated
Statement of Income and Earnings is included at the end of this presentation. |
 April 2013
National Fuel Gas Company
7
Capital Spending Flexibility to Maintain Financial Strength
$56
$58
$58
$58
$65-
$70
$65-$70
$53
$38
$129
$144
$70-
$80-
$100
$188
$398
$649
$694
$480-
$560
$550-
$650
$81
$50-
$75
$75-
$125
307
$501
$854
$977
$665-
$795
$770-
$945
$0
$250
$500
$750
$1,000
$1,250
2009
2010
2011
2012
2013 Forecast
2014 Forecast
Fiscal Year
Midstream, Energy Marketing & Other
Exploration & Production Segment
Pipeline & Storage Segment
Utility Segment
$90
$
(1)
Note: A reconciliation to Capital Expenditures as presented on the Consolidated Statement of
Cash Flows is included at the end of this presentation. Does not include the $34.9 MM
Seneca Resources Corporation’s acquisition of Ivanhoe’s U.S.-based assets in California, as this was accounted for as an
investment in subsidiaries on the Statement of Cash Flows, and was not included in the
Exploration & Production segment’s Capital Expenditures (1)
|
 April 2013
Total Debt
(1)
45%
National Fuel Gas Company
8
Strong Balance Sheet and Liquidity Position
Capital Resources
Total Short-Term Capacity: $1,085 Million
Committed Credit Facility: $750 Million
Syndicated facility extends until
January 6, 2017
Uncommitted Lines of Credit: $335 Million
$18.0 million of outstanding short-
term notes payable to banks as of
December 31, 2012
$3.653 Billion
(2)
As of December 31, 2012
(1)
Includes Long-Term Debt of $1.149 billion, the Current Portion of Long-Term Debt of
$0.250 billion, and Notes Payable to Banks and Commercial Paper of $0.238 billion, as
of December 31, 2012. (2)
Includes Notes Payable to Banks and Commercial Paper of $238.0 million and Current Portion of
Long-Term Debt of $250.0 million as of December 31, 2012.
In February 2013, the Company issued $500
million in 10-year notes to repay a $250 maturity
and all
outstanding short-term debt
Short
-Term Debt
Long-Term Debt
Shareholders’
Equity
55 %
$300.0 Million Commercial Paper Program
backed by Committed Credit Facility
$220.0 million of outstanding commercial
paper as of December 31, 2012 |
 April 2013
Midstream Businesses
9
Pipeline & Storage/NFG Midstream |
 April
2013 Midstream Businesses
10
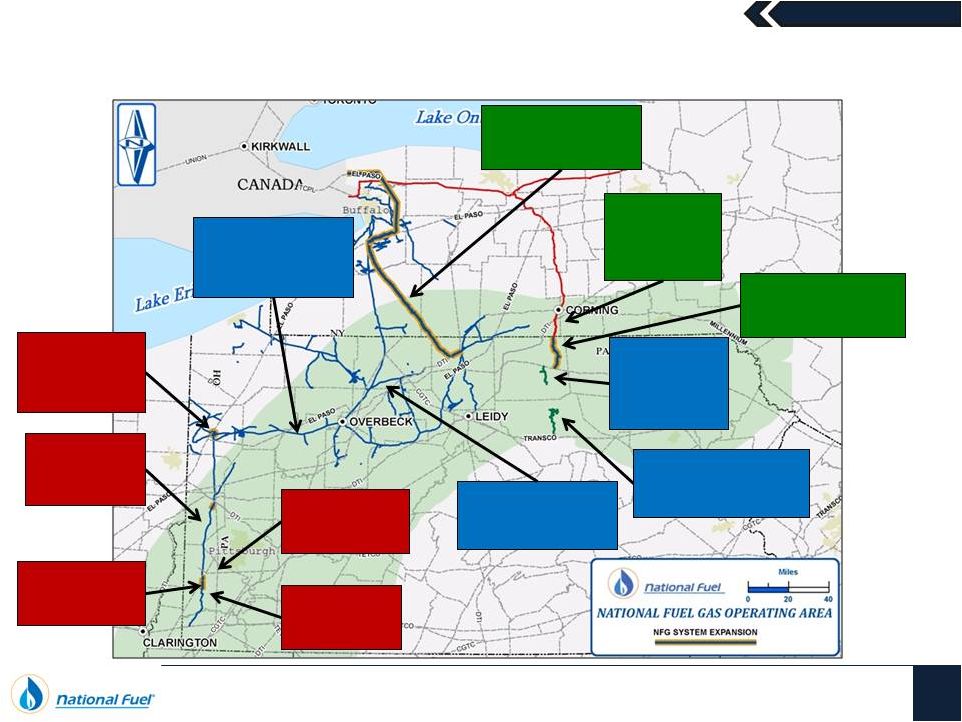
Pipeline Expansions to Transport Appalachian Production
Gathering
Marcellus
Production
Shipping Gas
to Canada &
Northeast
Line N
Corridor
Expansions |
 April
2013 Exploration & Production
11 |
 April
2013 Seneca Resources
12
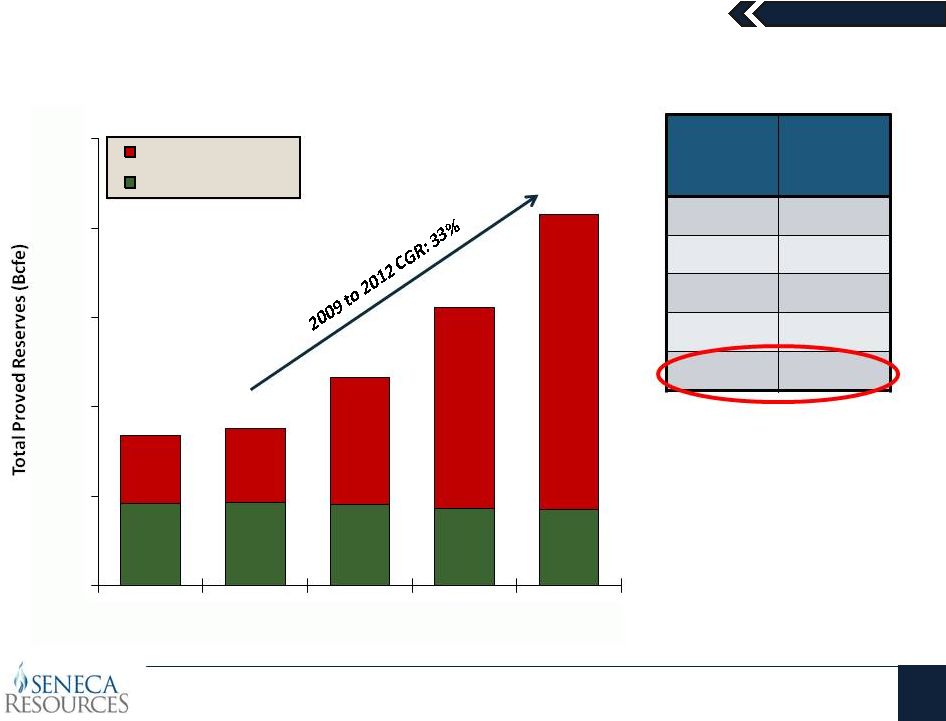
Another Strong Year of Reserve Growth
Seneca has more than doubled
its proved reserves since 2009,
while maintaining a relatively
high percentage of proved
developed reserves (67%),
given its large resource base
(1)
Represents a three-year average U.S. finding and development cost
46.2
46.6
45.2
43.3
42.9
226
249
428
675
988
503
528
700
935
1,246
0
300
600
900
1200
1500
2008
2009
2010
2011
2012
At September 30
Natural Gas (Bcf)
Crude Oil (MMbbl)
Fiscal
Years
3-Year
F&D Cost
(1)
($/Mcfe)
2006-2008
$7.63
2007-2009
$5.35
2008-2010
$2.37
2009-2011
$2.09
2010-2012
$1.87 |
 April
2013 Seneca Resources
13
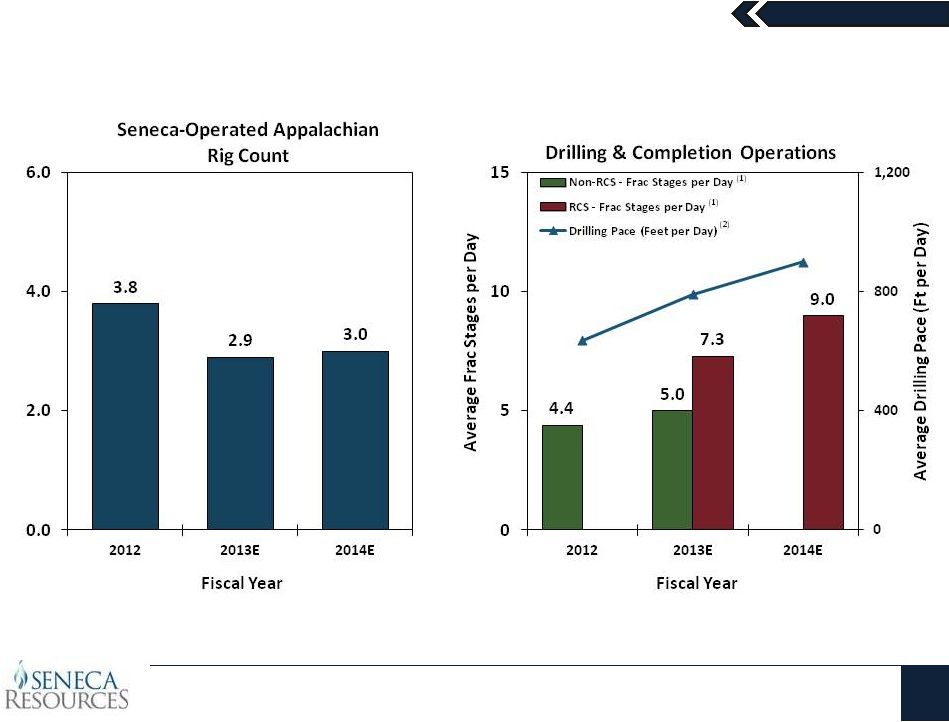
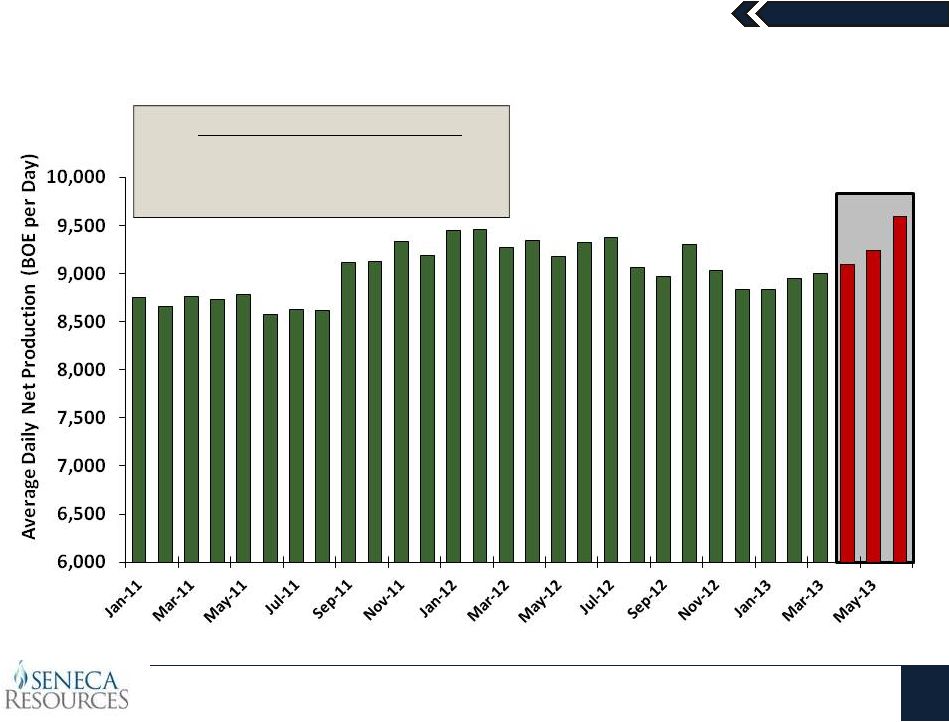
Operational Efficiencies Continue to Drive Production Growth
Ongoing efficiency allows for more activity with a flat rig count
(1)
RCS –
Reduced Cluster Spacing
(2)
Drilling pace represents the average feet drilled per day from the time the well is spud
until it reaches total depth (TD) |
 April
2013 Seneca Resources
14
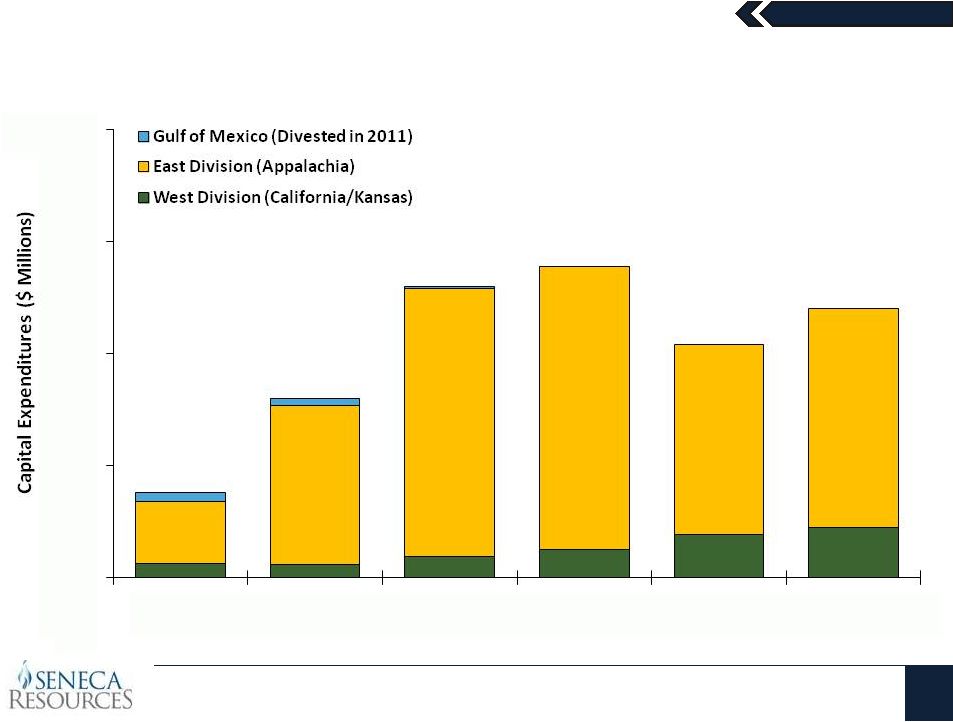
Increased Oil Spending and Tempered Marcellus Spending
(1)
Does not include the $34.9 MM acquisition of Ivanhoe’s U.S.-based assets in
California, as this was accounted for as an investment in subsidiaries on the
Statement of Cash Flows, and was not included in Capital Expenditures
$31
$28
$47
$63
$80-$110
$90-$130
$139
$356
$596
$631
$400-
$450
$460-
$520
$188
(1)
$398
$649
$694
$480-$560
$550-$650
$0
$250
$500
$750
$1,000
2009
2010
2011
2012
2013 Forecast
2014 Forecast
Fiscal Year |
 April
2013 Seneca Resources
15
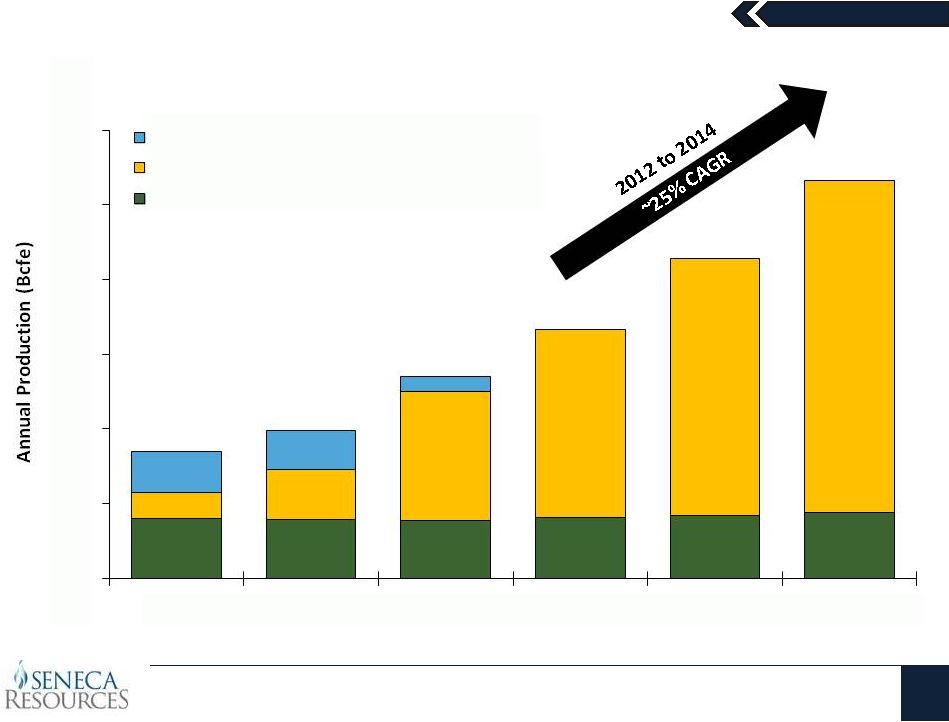
Production Continues to Grow
20.1
19.8
19.2
20.5
20-22
21-23
8.7
16.5
43.2
62.9
82-90
105–115
13.7
13.3
5.2
42.5
49.6
67.6
83.4
102-112
126-138
0
25
50
75
100
125
150
2009
2010
2011
2012
2013 Forecast
2014 Forecast
Fiscal Year
Gulf of Mexico (Divested in 2011)
East Division (Appalachia)
West Division (California/Kansas) |
 April
2013 Seneca Resources
16
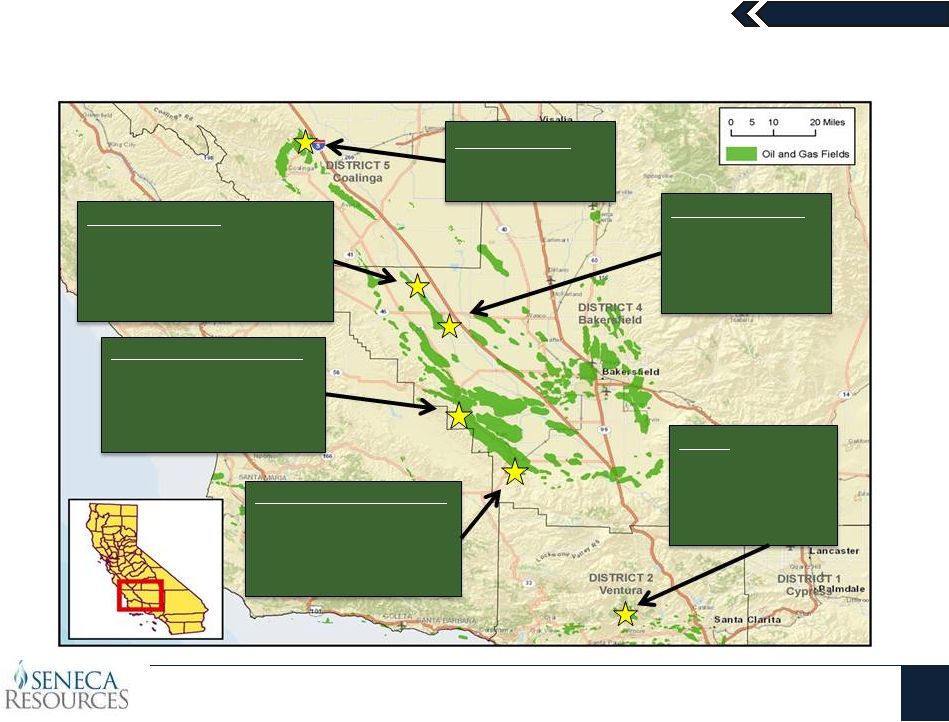
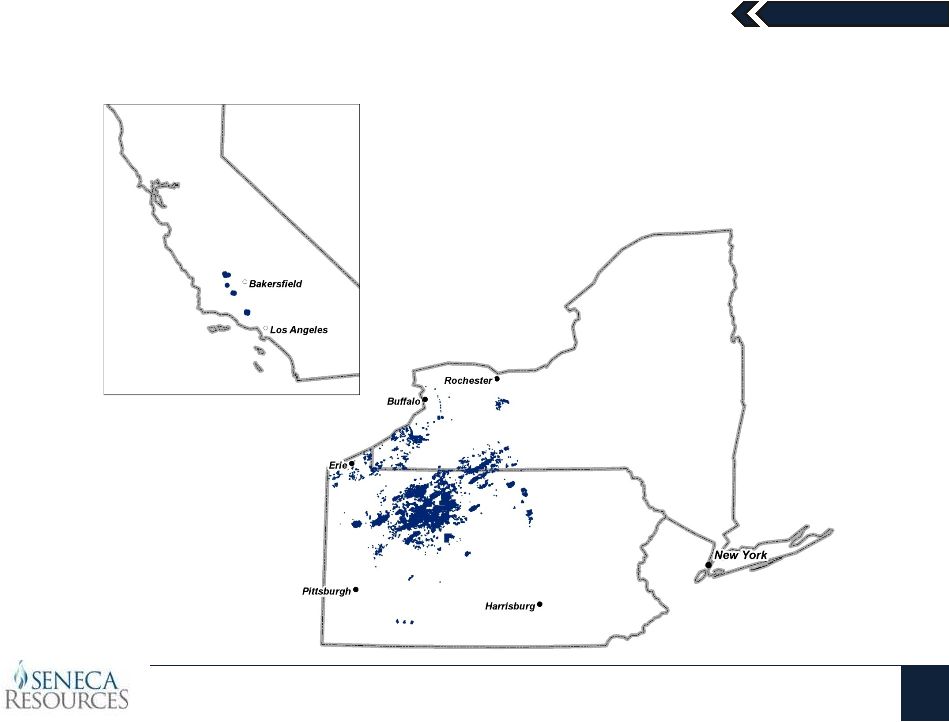
California: Stable Production Fields
South Lost Hills
~1,500 BOEPD
Monterey Shale
Primary
219 Active Wells
Sespe
~1,100 BOEPD
Sespe Formation
Primary
172 Active Wells
North Lost Hills
~1,200 BOEPD
Tulare & Etchegoin Formation
Primary & Steamflood
175 Active Wells
North Midway Sunset
~4,100 BOEPD
Potter & Tulare Formation
Steamflood
728 Active Wells
South Midway Sunset
~1,100 BOEPD
Antelope Formation
Steamflood
110 Active Wells
East Coalinga
Temblor Formation
Primary |
 April
2013 Seneca Resources
17
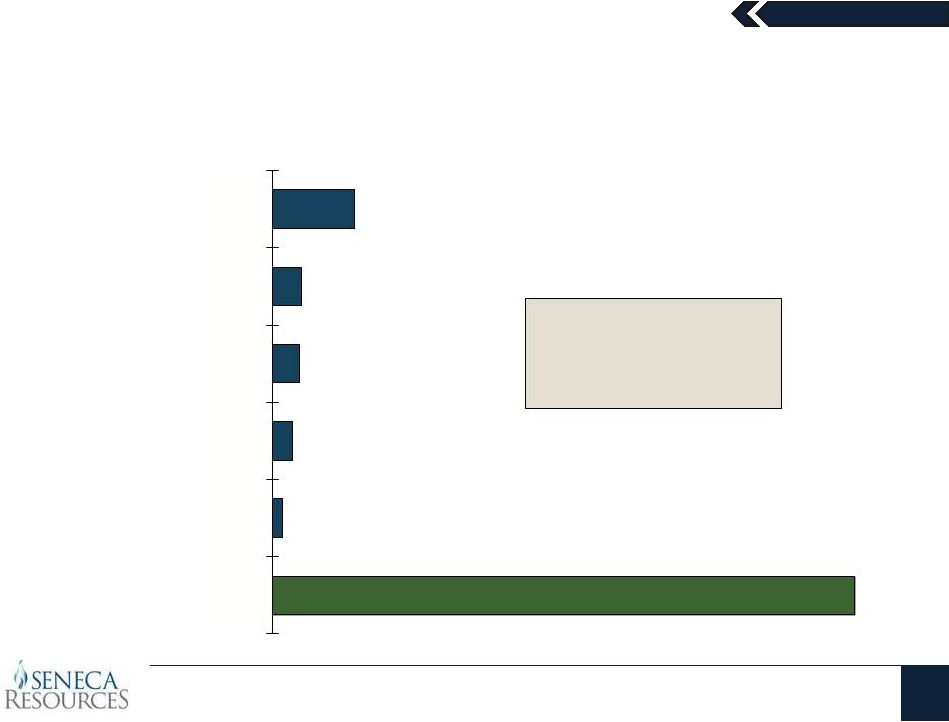
California: Strong Margins Support Significant Free Cash Flow
Average Revenue
(12 Months Ended 12/31/12)
$85.69 per BOE
$9.40
$3.35
$3.06
$2.32
$1.11
$66.45
Non
-
Steam Fuel LOE
Steam Fuel
G&A
Production & Other Taxes
Other Operating Costs
Adjusted EBITDA
Adjusted
EBITDA
per
BOE
(1)
(12 Months Ended December 31, 2012)
(1) Total production from the Exploration & Production segment’s properties in
California was 3,374 Mboe for the 12 months ended December 31, 2012.
Note: A reconciliation of Exploration & Production West Division Adjusted EBITDA to
Exploration & Production Segment Net Income is included at the end of this
presentation. |
 April
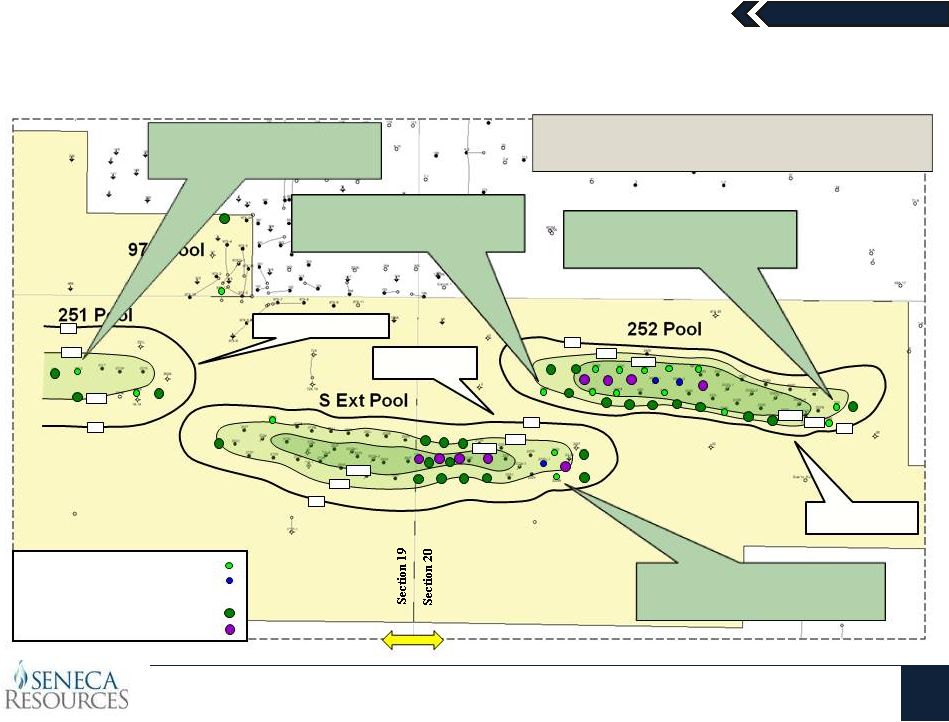
2013 California: Midway Sunset South Activity Update
Seneca Resources
18
500’
2012 Drill Program: 21 Wells / 3 Injectors
2013
Drill
Program:
17
-
23
Wells
/
5
-
9
Injectors
0 ft
50 ft
100 ft
100 ft
50 ft
50 ft
Antelope “A-1”
and “A-2”
Sands
Antelope “B”
and “C”
Sands
Antelope “A-1”
Sand
Seneca 232M
Extended 252 Pool to the West
Seneca 252I
Extended 252 Pool to the East
Seneca 222W
Extended S Ext Pool to the East
Seneca 251U
Extended 251 Pool to the West
100 ft
50 ft
100 ft
50 ft
0 ft
50 ft
0 ft
0 ft
0 ft
0 ft
2012 Drill Program
Injectors
2013 Drilling Locations
Producers
Injectors
Producers
? |
 19
Seneca Resources
California: Sespe Field –
Drilling Programs and Results
1 Mile
2011 Sespe Wells (5)
2012 Sespe Wells (6)
2013 Sespe Wells (6)
TG 53-29
90 BOEPD
1
Oil
3/13
TG 562-29
190 BOEPD
1
Oil
2/13
FA 502-33
75 BOEPD
1
Oil
1/13
FA 501-33
100 BOEPD
1
Oil 1/13
WS 48-33
80 BOEPD
1
Oil 09/12
Oak Flat 2-31
100 BOEPD
1
Oil 08/12
Oak Flat 1-31
110 BOEPD
1
Oil
08/12
“X”
SANDS ISOCHORE (Thickness)
April 2013 |
 April
2013 Seneca Resources
20
California: East Coalinga Overview
Seneca became operator on January 30, 2013
Previous Operator: Chevron
7,764 net acres
~170 wells (60 active)
~250 BOPD
$30 million capital commitment over first
three years
$100 million of potential opportunities over
the next five to seven years
2013 Plans
Drill ~12 evaluation wells across acreage
block
Place ~50% of currently idled wells back on
production
Upgrade surface facilities
Active Well
Idle Well |
 April
2013 Seneca Resources
21
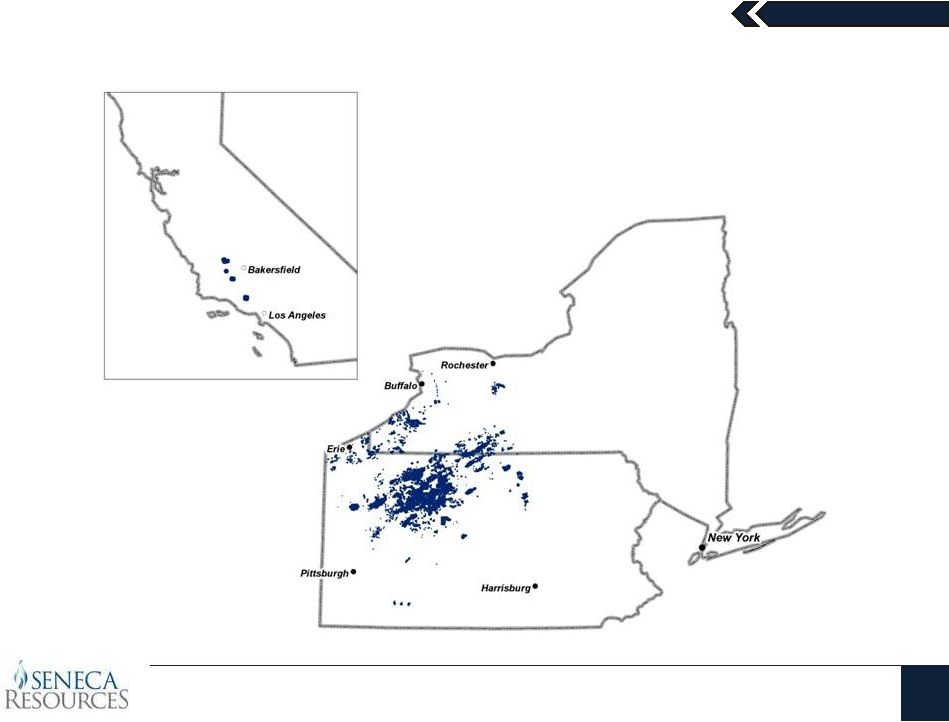
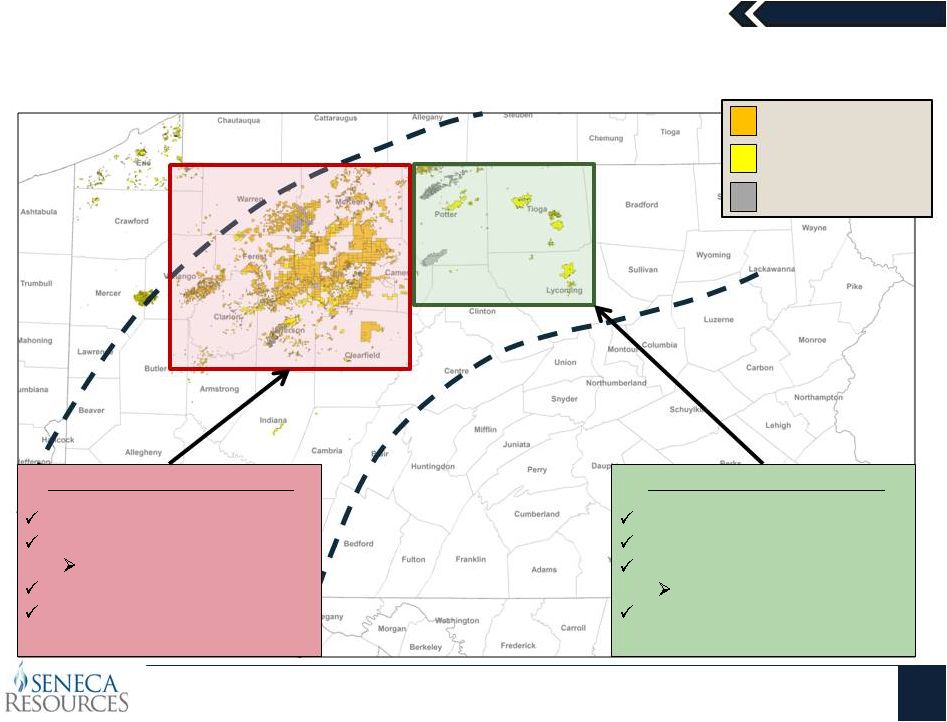
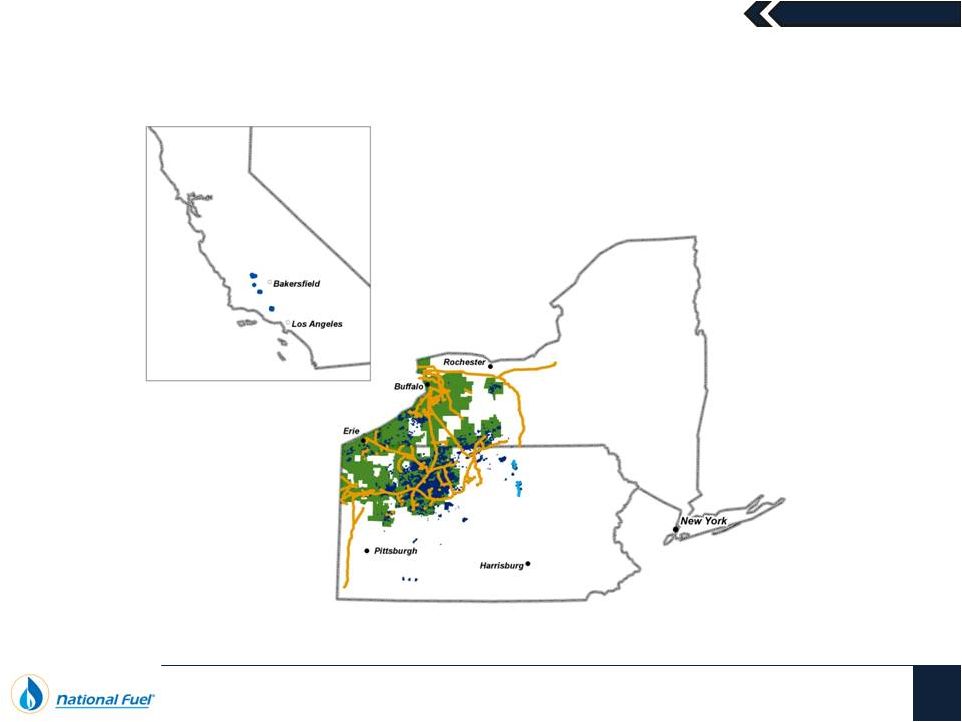
Expansive Pennsylvania Acreage Position
SRC Lease Acreage
SRC Fee Acreage
Eastern Development Area
Net Acreage: 55,000 acres
Mostly leased (16-18% royalty)
No near-term lease expiration
First large expiration: 2018
Ongoing development drilling
in Tioga and Lycoming Counties
Western Development Area
Net acreage:
~720,000 acres
Own most mineral rights
Minimal
royalty obligation
Minimal
lease expiration
Evaluating Marcellus rich-gas
and Utica Shale potential
NFG Storage Acreage |
 April
2013 Seneca Resources
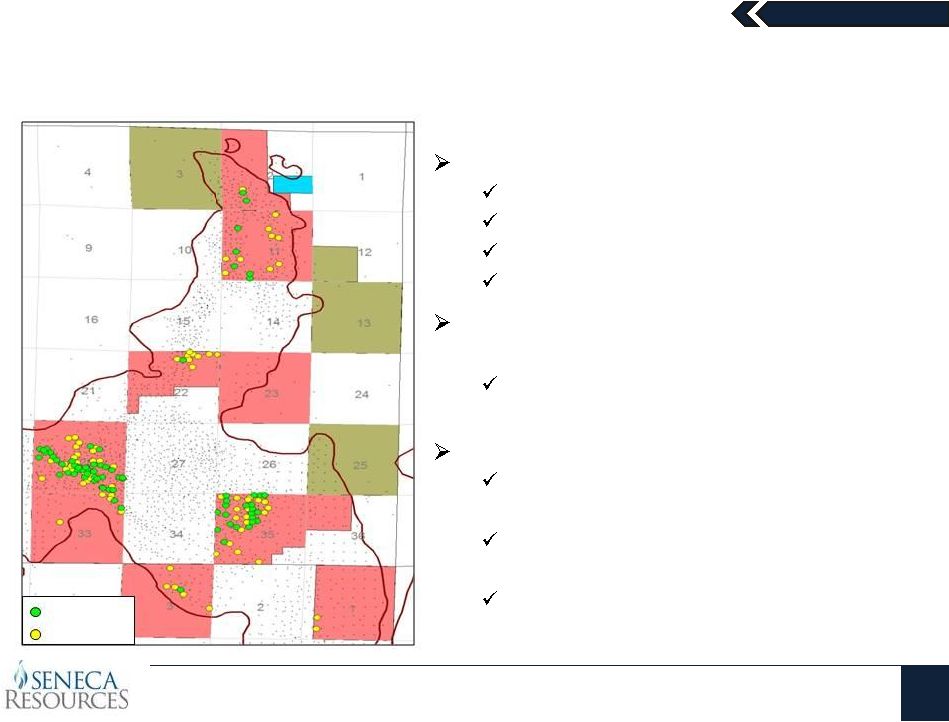
22
Eastern Development Area (EDA)
DCNR Tract 595
Gross Production: ~85 MMcf per Day
34 Wells Drilled
26 Wells Producing
Covington
–
Fully
Developed
Gross Production: ~65 MMcf per Day
47 Wells Drilled and Producing
DCNR Tract 100
Gross Production: ~165 MMcf per Day
31 Wells Drilled
21 Wells Producing
SRC Lease Acreage
SRC Fee Acreage |
 April
2013 Seneca Resources
23
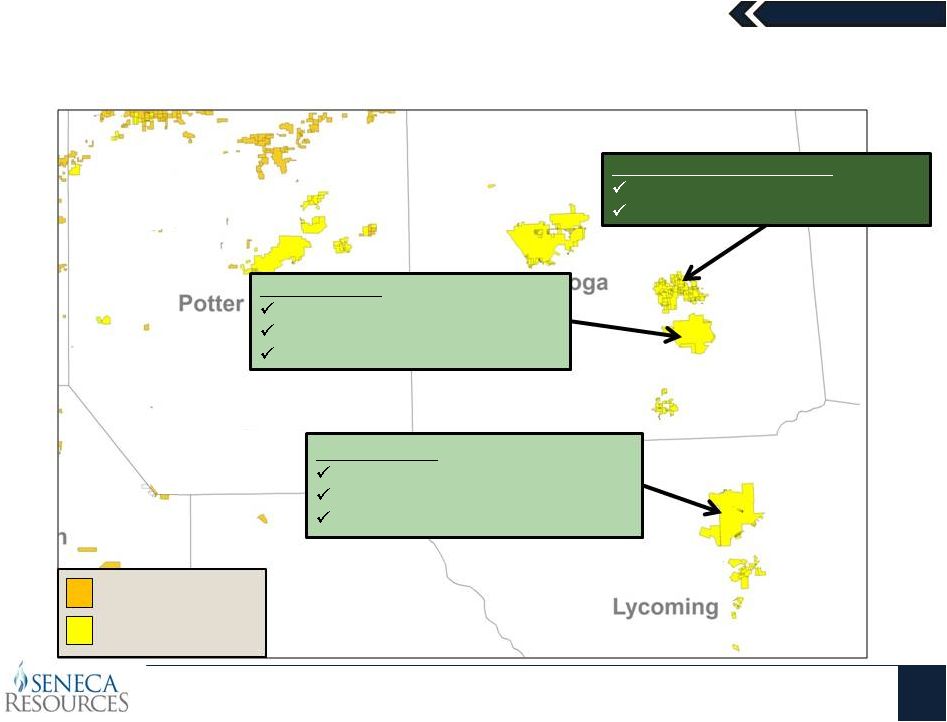
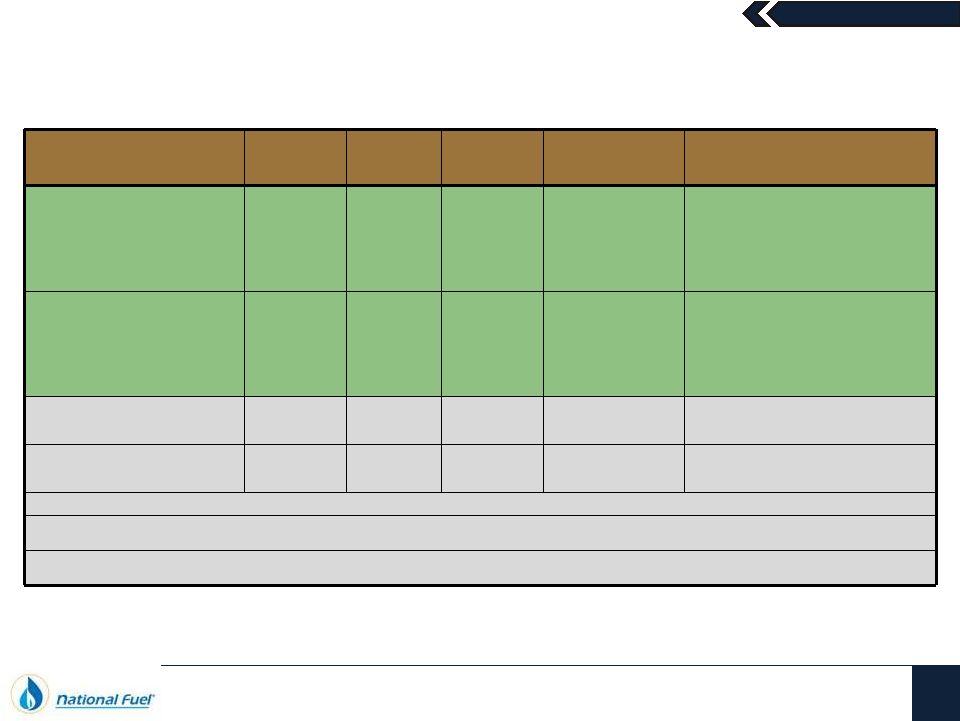
Lycoming and Tioga Counties Are Highly Productive Areas
Development Area
Producing
Well
Count
Average
IP Rate
(MMcf/d)
Average
7-Day
(MMcf/d)
Average
30-Day
(MMcf/d)
Average
EUR
per Well
(Bcf)
Average
Lateral
Length
EUR per
1,000’
of
Lateral
(Bcfe)
Covington
Tioga
County
47
5.2
4.7
4.1
5.3
4,049’
1.30
Tract 595
Tioga
County
19
(1)
6.9
6.0
5.1
7.7
4,455’
1.72
Tract 100
Lycoming
County
14
(2)
15.4
13.3
10.3
11.0
5,256’
2.09
(1)
Seven new wells on Tract 595 began production in February 2013 and are awaiting sufficient
production history to include within the table
(2)
Seven new wells on Tract 100 began production in March 2013 and are awaiting sufficient
production history to include within the table |
 April
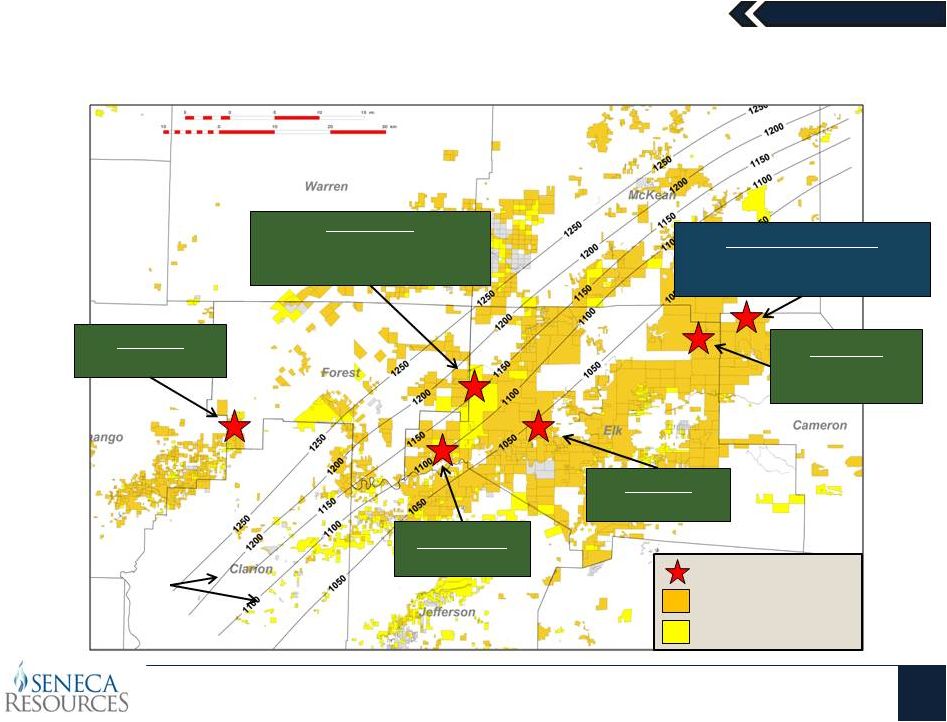
2013 Seneca Resources
24
Western Development Area Marcellus Delineation Program
Owl’s
Nest
2 Wells Drilled
3D Seismic Coverage Complete
Church Run
1 Well Drilled
Ridgway
1 Well Drilled
Clermont
Currently Drilling
the 2nd of 2 Wells
Tionesta
1 Well Planned
Rich Valley (1 Well)
Peak 7-Day IP: 7.8 MMcf per Day
Estimated EUR: 7 Bcf
SRC Lease Acreage
SRC Fee Acreage
Horizontal Well
BTU
Contours |
 April
2013 Seneca Resources
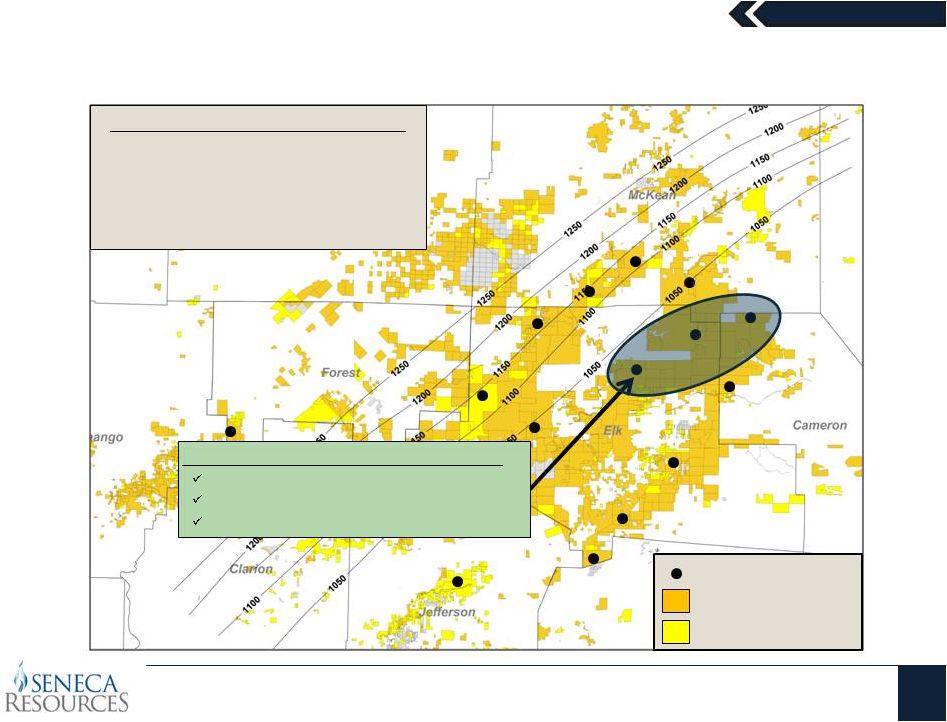
25
Rich Valley/Clermont Marcellus Development Area
Rich
Valley/Clermont
Development
Area
Area of high porosity and GIP
150-200 Horizontal Locations
Anticipated EURs: 5-8 Bcf
WDA Pilot Development Program
Upon completion of initial delineation
drilling, a pilot development program
will begin this summer. Full
development planned for 2014.
SRC Lease Acreage
SRC Fee Acreage
Delineation Well |
 April
2013 Seneca Resources
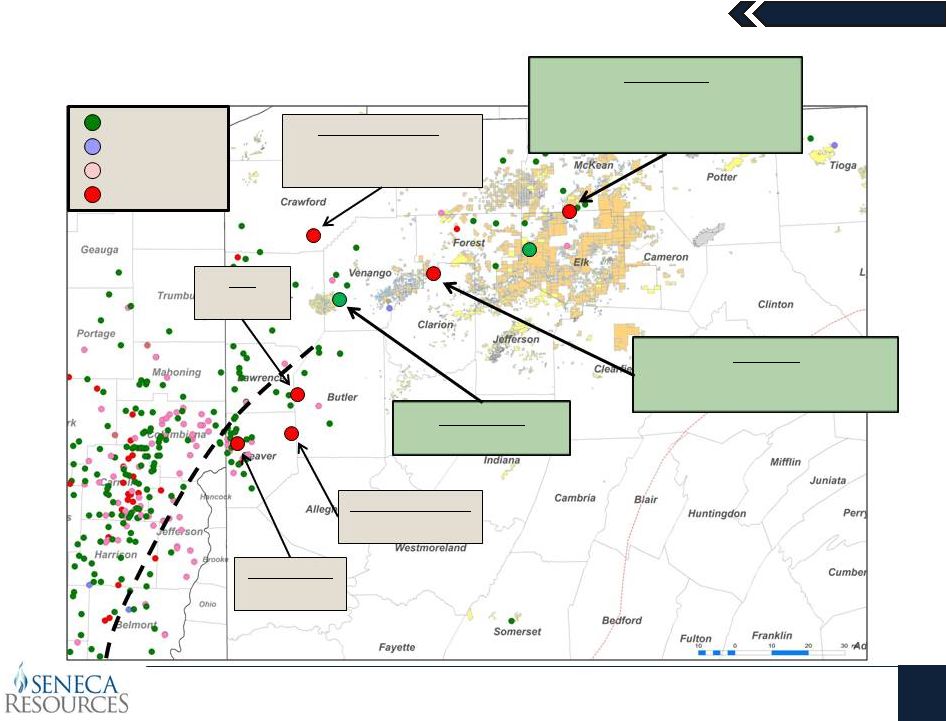
26
Utica Shale –
Activity Summary
Permitted
Drilled/Drilling
Completed
Producing
Mt. Jewett
Tested 3 Frac Stages at 1.6 MMcfd
(Typical Well: 17 Frac Stages)
2
nd
Horizontal: FY 2013
Henderson
Vertical Well: Tested
Tionesta
Horizontal: Completed Fall 2012
Peak 24-Hour Rate: 3.9 MMcfd
Rex
9.2 MMcfd
Chesapeake
6.4 MMcfd
Range Resources
4.4 MMcfd
Range Resources
1.4 MMcfd
“Not Effectively Stimulated” |
 April
2013 Seneca Resources
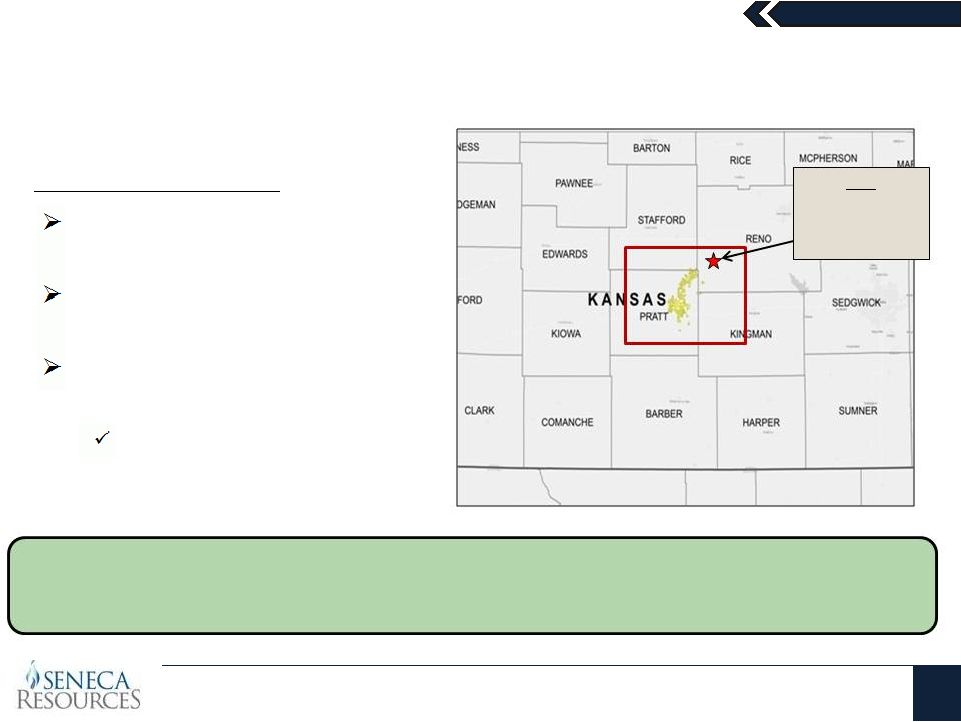
27
Initial Entry into the Mississippian Lime Play in Kansas
The initial entry into the Mississippian Lime play furthers the Company’s goal of
maintaining a significant contribution from oil-producing properties
Unit
30-day IP:
352 BOED
(92% Oil/NGLs)
100% working interest in 4,600 gross
acres
25% net working interest in 18,500
gross acres
2013: Participate in 3 to 5 gross
horizontal wells
Total Net Acres: 9,300
1
st
Well Spud: FY2013 –
Q3 |
 National Fuel Gas
Company 28
Capital Deployment Has Led to Significant Accomplishments
Note: A reconciliation of Adjusted EBITDA to Net Income as presented on the Consolidated
Statement of Income and Earnings is included at the end of this presentation. 136%
Increase in Proved Reserves Since 2009 •
Total oil and gas proved reserves reached 1,246 Bcfe at September 30, 2012, with a
3-year average F&D cost of $1.87/Mcfe
•
Despite the 2011 sale of its offshore Gulf of Mexico properties, Seneca has increased
production from 42.5 Bcfe in 2009 to 83.4 Bcfe in 2012
96% Production Growth Since 2009
31% Increase in Pipeline & Storage Adjusted EBITDA since Fiscal 2011
44.3 Bcfe in 2012 NFG Midstream Gathering Volumes
•
As a result of major Appalachian pipeline expansions, Adjusted EBITDA reached $146
million for the last 12 months and new projects will continue to drive growth beyond
fiscal 2013 •
NFG Midstream gathered more than 44 Bcfe of volumes for Seneca Resources, eliminating
the need to rely upon and provide payment to third party infrastructure operators
April 2013 |
 National Fuel Gas
Company Appendix
April 2013
29 |
 National Fuel Gas
Company Fiscal Year 2013 Earnings Guidance Drivers
30
2013 Forecast
$2.75 -
$3.00
102 -
112
$2.10 -
$2.25
$0.90 -
$1.10
$58 -
$62 MM
+3%
$255 -
$265 MM
+3%
$5 -
$10 MM
GAAP Earnings per Share
Exploration & Production Drivers
Total Production (Bcfe)
DD&A Expense
LOE Expense
G&A Expense
Pipeline & Storage Drivers
O&M Expense
Revenue
Utility Drivers
O&M Expense
Normal Weather in PA
Energy Marketing Drivers
Operating Income
April 2013 |
 National Fuel Gas
Company 31
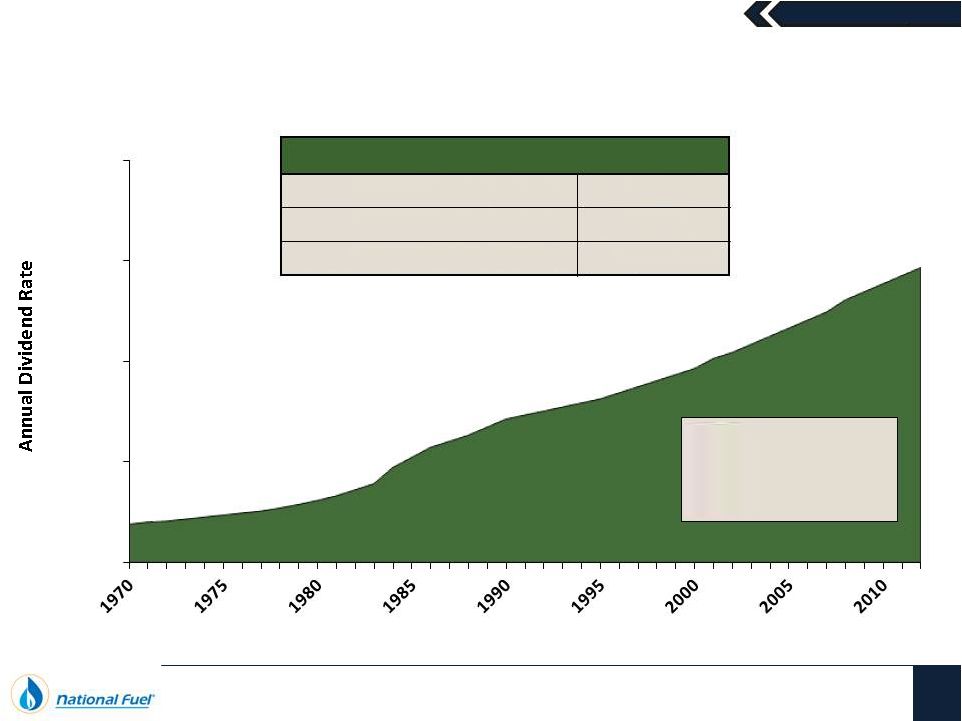
Dividend Track Record
(1) As of March 12, 2013
Dividend Consistency
Consecutive Dividend Payments
Consecutive Dividend Increases
Current Annualized Dividend Rate
110 Years
42 Years
$1.46 per Share
Current
Dividend Yield
(1)
2.5%
$2.00
$1.50
$1.00
$0.00
$0.50
April 2013
Annual Rate at Fiscal Year End |
 National Fuel Gas
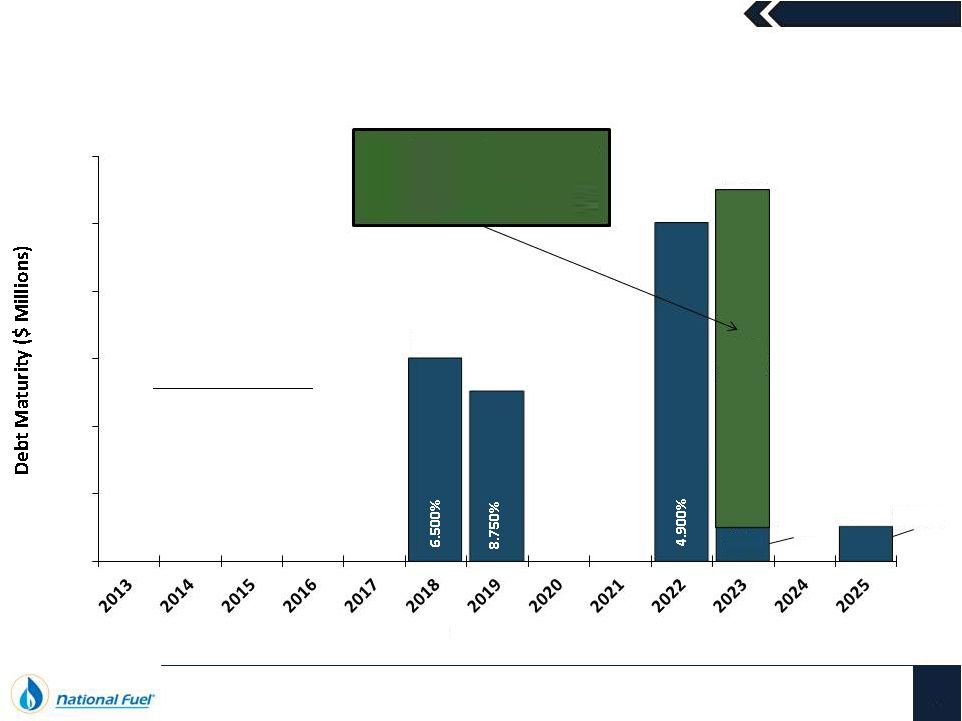
Company No Debt Maturities Until Fiscal 2018
Embedded Cost of
Long-Term Debt
5.58%
In February, the Company
Issued $500 million in
10-year notes at 3.75%
$600
$500
$400
$300
$200
$100
$0
$300
$250
$500
$549
$50
7.395%
7.375%
$49
$500
3.750%
Fiscal Year
April 2013
32 |
 Midstream
Businesses 33
Appendix
April 2013 |
 Midstream
Businesses 34
A Closer Look at the Expansion Progress
COVINGTON
GATHERING
SYSTEM
(In-Service)
TROUT RUN
GATHERING SYSTEM
(In-Service)
TIOGA
COUNTY
EXTENSION
(In-Service)
LINE “N”
EXPANSION
(In-Service)
NORTHERN ACCESS
EXPANSION
(In-Service)
CENTRAL TIOGA
COUNTY EXTENSION
(2015/2016)
LINE “N”
2012
EXPANSION
(In-Service)
MERCER
EXPANSION
PROJECT
(Nov. 2014)
LINE “N”
2013
EXPANSION
(Nov. 2013)
WEST SIDE
EXPANSION
(2013 to 2015)
TIONESTA
GATHERING
SYSTEM
(Under Construction)
MT. JEWETT
GATHERING SYSTEM
(Under
Construction)
April 2013 |
    Midstream
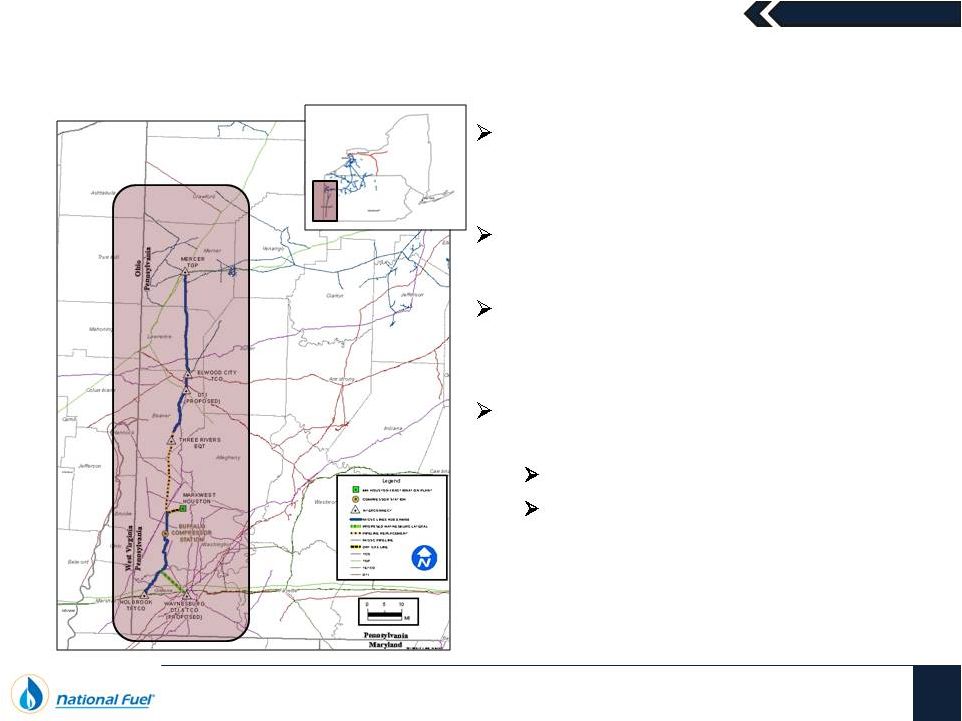
Businesses Pursuing Additional Opportunities Near the Line N Corridor
Line N
Focus Area
April 2013
35
Activity in the Marcellus and Utica shales
along the Pennsylvania/Ohio border
continues to remain robust
NFG Supply Corporation’s Line N system is
well-positioned for continued expansion
NFG Midstream Corporation is focused on
building new high-pressure wet and dry gas
gathering systems
Significant expansion opportunities may be
present in the next few years
2013:
Smaller pipeline expansions
2014+:
Larger expansion projects, possibly
including an integrated wet gas solution,
with NFG Midstream focused on the high-
pressure wet gas gathering systems and
NFG Supply transporting dry gas on its
interstate system |
 Midstream
Businesses Regulated Interstate Expansion Initiatives (Pipeline & Storage)
Project Name
Capacity
(Dth/D)
Est.
CapEx
In-Service
Market
Status
Lamont Compressor Station
90,000
$14 MM
2010/2011
Fully Subscribed
Completed –
Two Phases
Line “N”
Expansion
160,000
$22 MM
10/2011
Fully Subscribed
Completed
Tioga County Extension
350,000
$58 MM
11/2011
Fully Subscribed
Completed
Northern Access Expansion
320,000
$77 MM
11/2012
Fully Subscribed
Completed
Line “N”
2012 Expansion
163,000
$41 MM
11/2012
Fully Subscribed
Completed
Line “N”
2013 Expansion
30,000
~$5 MM
11/2013
Fully Subscribed
Executed Precedent Agreement
Mercer Expansion Project
105,000
~$30 MM
11/2014
Fully Subscribed
Executed Precedent Agreement
West Side Expansion
95,000+
TBD
2013 to
2015
OS Concluded
Negotiating Precedent Agreements
Central Tioga County
Extension
260,000
~$150 MM
2015/2016
OS Concluded
Discussions with anchor shipper
West to East
~425,000
~$290 MM
~2016
29% Subscribed
Marketing continues with producers in
various stages of exploratory drilling
Total Firm Capacity: ~1,998,000+ Dth/D
Capital Investment: ~$687+ MM
36
April 2013 |
 Midstream
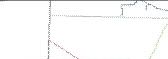
Businesses NFG Midstream is Focused on Serving Appalachian Producers
37
April 2013
Midstream’s gathering systems are
critical to unlock remote, but highly
productive Marcellus acreage
History of operational success and
efficiency within Pennsylvania
Current focus is on developing and
expanding gathering infrastructure
for both Seneca and other producers
in the Appalachian Basin |
 (1)
Footnote #1 goes here
April 2013
Midstream Businesses
38
Gathering Expansion Initiatives (NFG Midstream)
Project Name
Capacity
(Mcf/D)
Est.
CapEx
In-Service
Date
Market
Comments
Covington Gathering System
220,000
$40 MM
Multiple
Phases -
Most
In-Service
Capacity
Available
[Marketing to
Third Parties]
Completed
–
Flowing
into
TGP
300
Line. This includes ~$10 million of
current and future spending to
build pipeline to connect additional
wells
Trout Run Gathering System
466,000
$185 MM
May 2012
Capacity
Available
[Marketing to
Third Parties]
Completed
–
Flowing
into
Transco
Leidy Line. This includes ~$90
million of current and future
spending to build compression and
pipeline to connect additional wells
Tionesta Gathering System
10,000
$2.1 MM
FY2013
Q2
Fully Subscribed
Under Construction
Mt. Jewett Gathering System
10,000
$3.9 MM
FY2013
Q2
Fully Subscribed
Under Construction
Total Firm Capacity: ~706,000 Mcf/D
Capital Investment: ~$231 MM |
 April
2013 Exploration & Production
39
Appendix |
 April
2013 Seneca Resources
40
Hedge Positions and Strategy
Natural Gas
Swaps
Volume
(Bcf)
Average
Hedge Price
Fiscal 2013
51.4
$4.55 / Mcf
Fiscal 2014
62.7
$4.28 / Mcf
Fiscal 2015
31.9
$4.21 / Mcf
Fiscal 2016
19.7
$4.11 / Mcf
Fiscal 2017
17.9
$4.07 / Mcf
Oil Swaps
Volume
(MMBbl)
Average
Hedge Price
Fiscal 2013
1.3
$94.68 / Bbl
Fiscal 2014
1.6
$100.26 / Bbl
Fiscal 2015
0.6
$93.66 / Bbl
Fiscal 2016
0.4
$88.39 / Bbl
Most hedges executed at sales point to eliminate basis risk
Seneca has hedged approximately 72% of its
forecasted production for Fiscal 2013
Note: Fiscal 2013 hedge positions are for the remaining nine months of the fiscal year
|
 April
2013 Seneca Resources
41
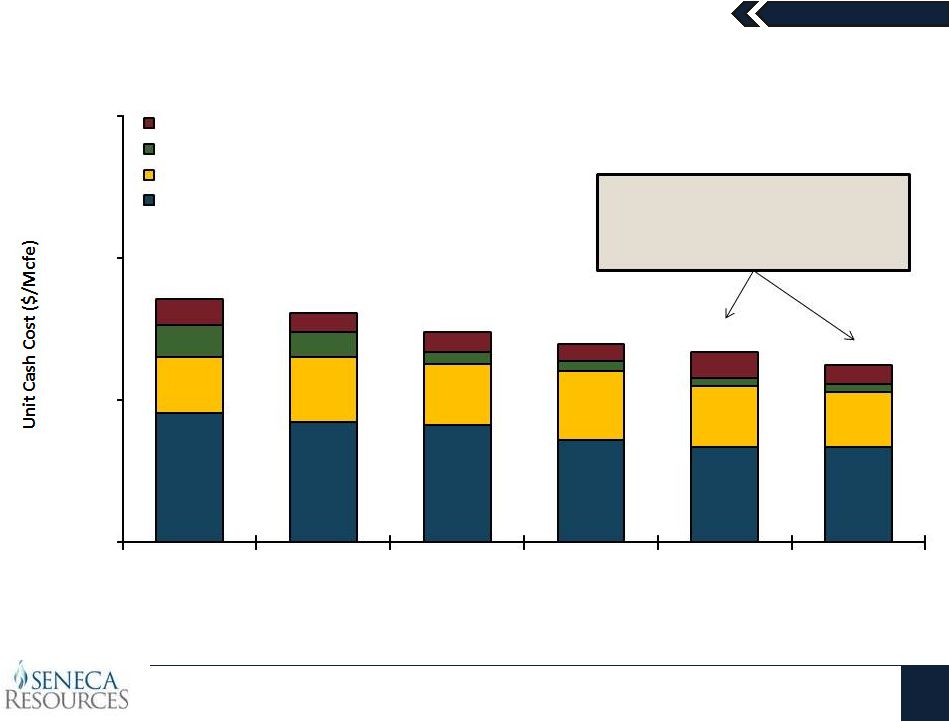
Continuing to Focus on Improving Its Cost Structure
Even after the new Pennsylvania Impact
Fee, 2012 unit cash costs decreased
from the prior year. We expect this
trend to continue in Fiscal 2013.
$1.36
$1.27
$1.24
$1.08
$1.00
1.00
$0.60
$0.69
$0.64
$0.73
$0.65
0.62
$2.57
$2.42
$2.22
$2.09
$2.01
$1.87
$0.00
$1.50
$3.00
$4.50
2008
2009
2010
2011
2012
2013 Forecast
Fiscal Year
Property, Franchise & Other Taxes
Other O&M Expense
General & Administrative Expense
Lease Operating Expense
$
(2)
$
(1)
(1)
Represents the midpoint of current General & Administrative Expense guidance of $58 to
$62 million, divided by the midpoint of current production guidance of 95 to 107 Bcfe (2)
Represents the midpoint of current Lease Operating Expense Guidance of $0.90 to
$1.10 per Mcfe |
 April
2013 Seneca Resources
42
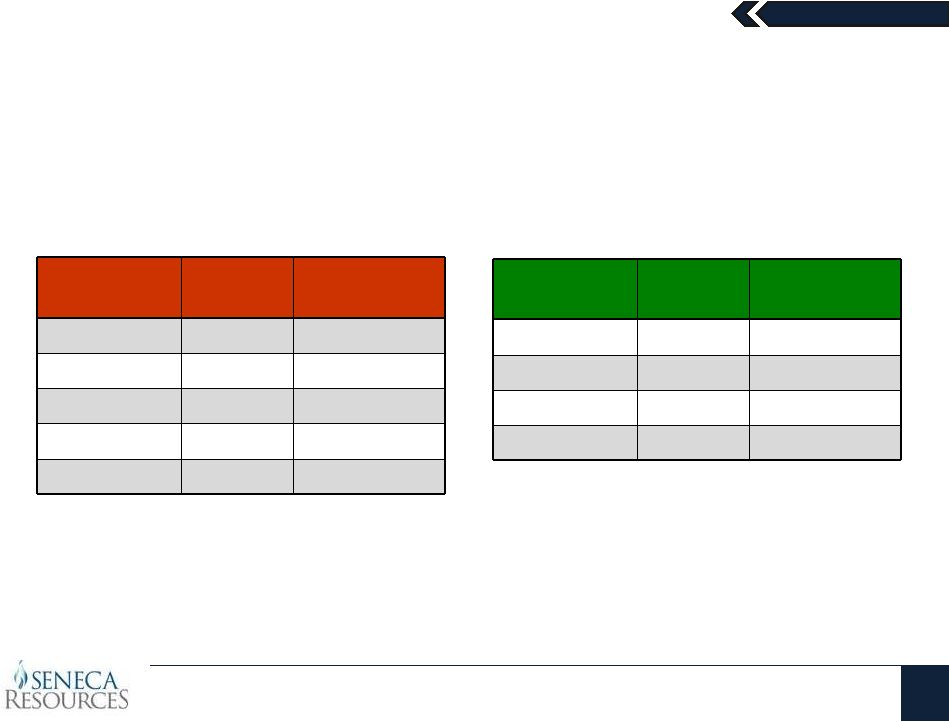
California: Stable Production and Increasing Cash Flows
Net Acreage: 18,418 Acres
Net Wells: 1,478
Oil Gravity: 12 –
37°
Api
NRI: 87.64
Rank
Company
California
2011
BOEPD
1
Occidental
164,796
2
Chevron
163,153
3
Aera (Shell/Exxon)
149,974
4
Plains Exploration
36,775
5
Venoco Inc.
18,988
6
Berry Petroleum
18,872
7
Seneca Resources
9,209
8
Macpherson Oil
9,022
9
E&B Natural Resources
5,992
10
ExxonMobil
3,238 |
 April
2013 Seneca Resources
43
California: Recent Initiatives Driving Near-Term Growth
Key Areas of Focus in 2013
1.
South Midway Sunset Field Extensions
2.
Sespe Infill Drill Program
3.
East Coalinga Evaluation
Forecast |
 April
2013 Seneca Resources
44
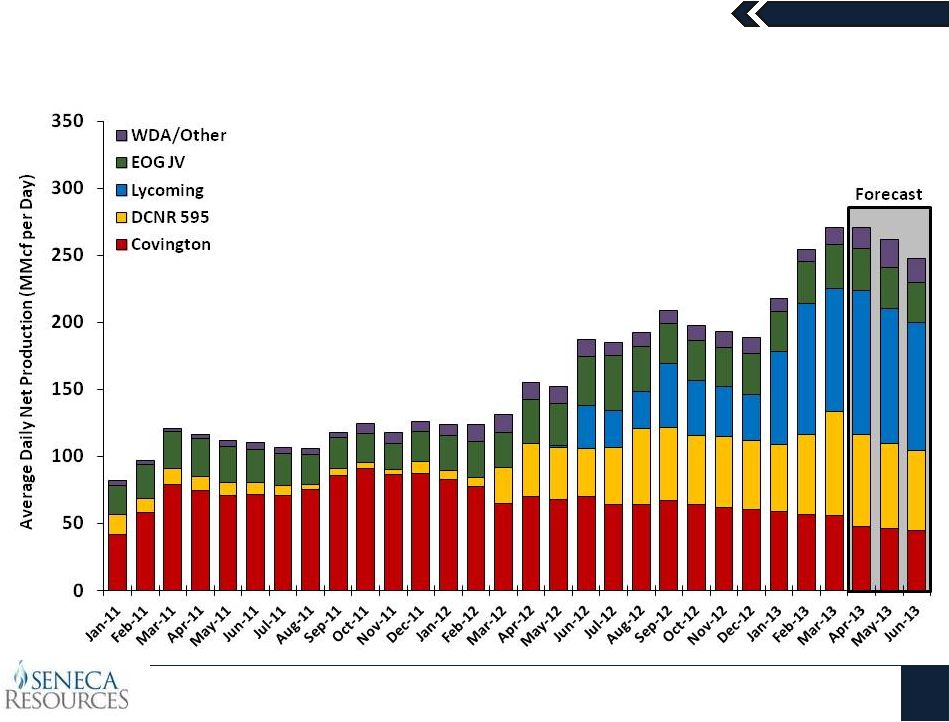
Ramping Marcellus Shale Production |
 April
2013 Marcellus Shale
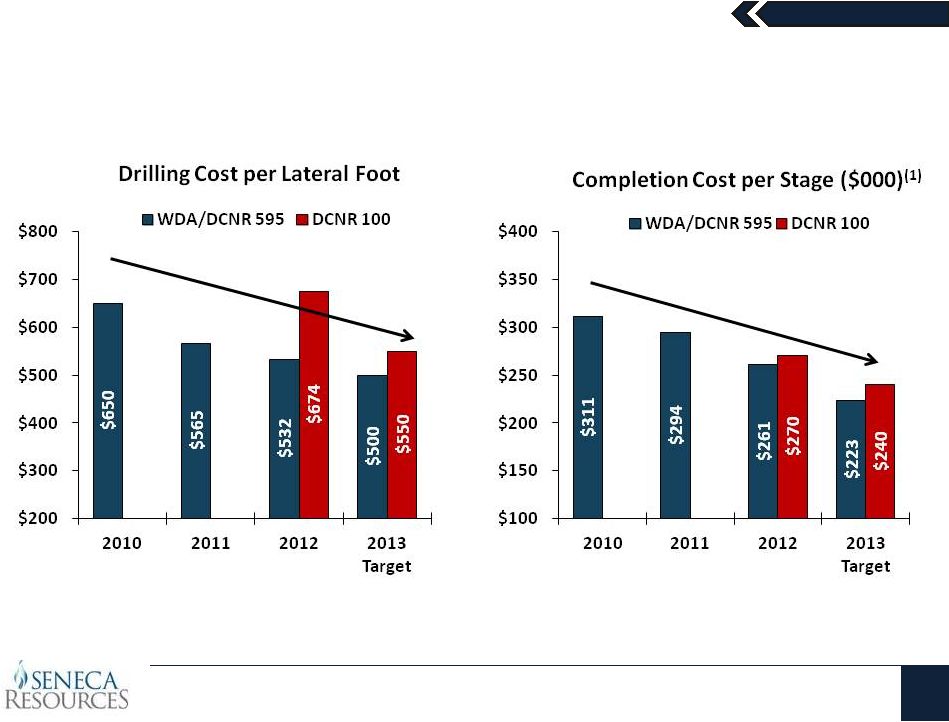
45
Targeting Continued Cost Reductions
(1) Completion Cost per Stage is for horizontal wells completed utilizing a standard
completion design, not a Reduced Cluster Spacing (RCS) completion design. |
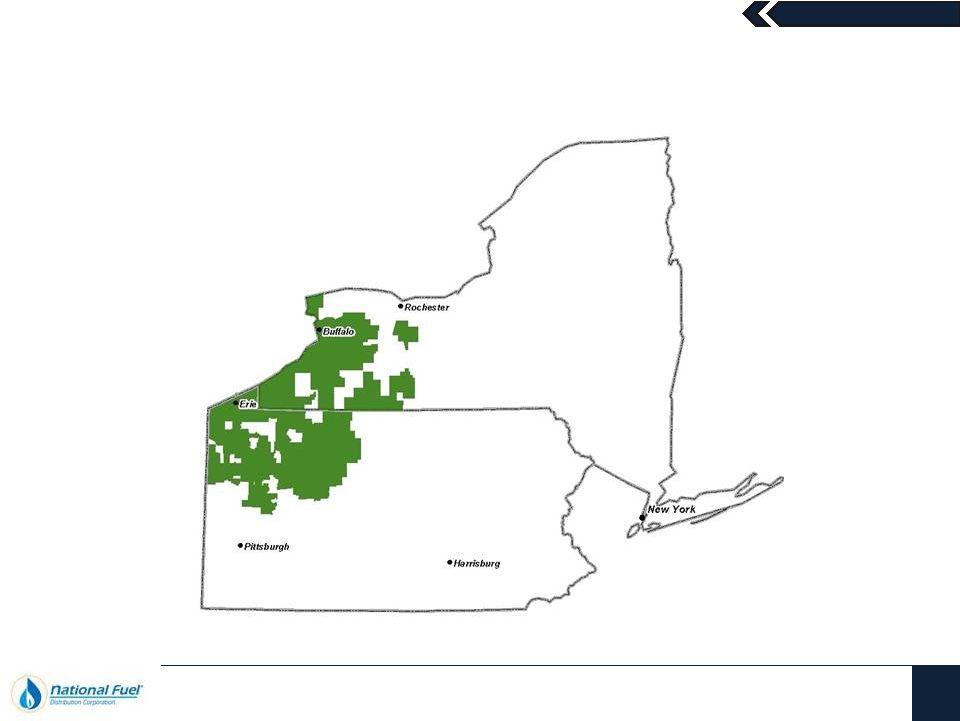 April
2013 Utility
46 |
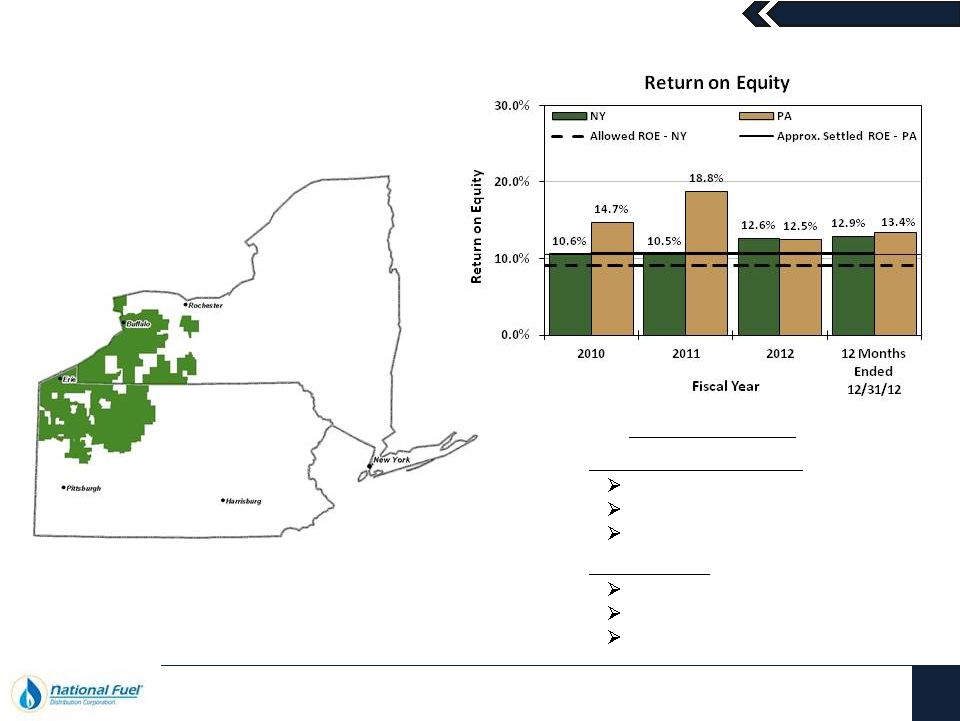 April
2013 New York & Pennsylvania
Low Income Rates
Choice Program/POR
Merchant Function Charge
New York only
Revenue Decoupling
90/10 Sharing
Weather Normalization
Utility
47
Providing Financial Stability
Rate Mechanisms |
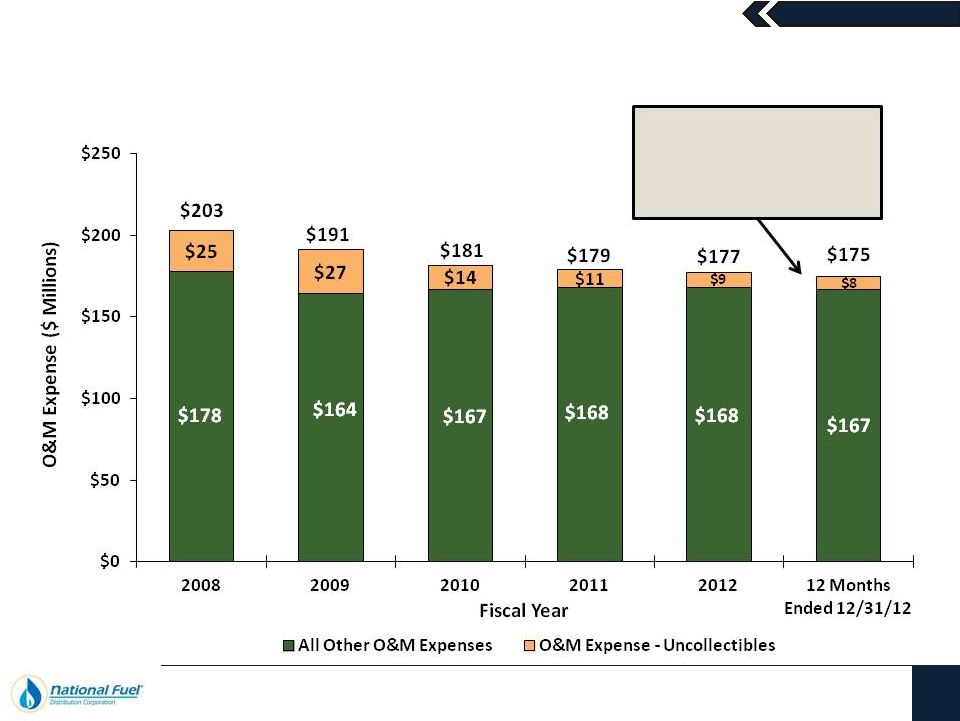 April
2013 Utility
48
Continued Cost Control Helps Provide Earnings Stability
Low natural gas prices,
combined with a focus on
cost control, continue to
help reduce expenses |
 April
2013 Utility
49
Strong Commitment to Safety
The anticipated increase in 2013
capital expenditures is largely due
to the implementation of a new
Customer Information System
The Utility remains
focused on consistent
spending to maintain
the ongoing safety and
reliability of its system |
 April
2013 National Fuel Gas Company
50
Comparable GAAP Financial Measure Slides and Reconciliations
This presentation contains certain non-GAAP financial measures. For pages
that contain non-GAAP financial measures, pages containing the most directly
comparable GAAP financial measures and reconciliations are provided in the
slides that follow.
The Company believes that its non-GAAP financial measures are useful to
investors because they provide an alternative method for assessing the
Company’s operating results in a manner that is focused on the performance
of the Company’s ongoing operations, or on earnings absent the effect of
certain credits and charges, including interest, taxes, and depreciation,
depletion and amortization. The Company’s management uses these non-
GAAP financial measures for the same purpose, and for planning and
forecasting purposes. The presentation of non-GAAP financial measures is not
meant to be a substitute for financial measures prepared in accordance with
GAAP. |
 April
2013 51
Reconciliation of Exploration & Production West Division Adjusted EBITDA
to Exploration & Production Segment Net Income
($ Thousands)
12 Months Ended
December 31, 2012
Exploration & Production -
West Division Adjusted EBITDA
224,201
$
Exploration & Production -
All Other Divisions Adjusted EBITDA
180,063
Total Exploration & Production Adjusted EBITDA
404,264
$
Minus:
Pennsylvania Impact Fee Related to Prior Fiscal Years (6,206)
Minus: Exploration & Production Net Interest Expense
(31,020)
Minus: Exploration & Production Income Tax Expense
(76,111)
Minus: Exploration & Production Depreciation, Depletion &
Amortization (198,064)
Exploration & Production Net Income
92,863
$
Exploration & Production Net Income
92,863
$
Pipeline & Storage Net Income
67,500
Utility Net Income
62,115
Energy Marketing Net Income
4,235
Corporate & All Other Net Income
609
Consolidated Net Income
227,322
$
|
 April
2013 52
Reconciliation of Adjusted EBITDA to Consolidated Net Income
($ Thousands)
FY 2009
FY 2010
FY 2011
FY 2012
Exploration & Production - West Division Adjusted EBITDA
171,572
$
187,838
$
187,603
$
226,897
$
224,201
$
Exploration & Production - All Other Divisions Adjusted EBITDA
108,139
139,624
189,854
170,232
180,063
Total Exploration & Production Adjusted EBITDA
279,711
$
327,462
$
377,457
$
397,129
$
404,264
$
Total Adjusted EBITDA
Exploration & Production Adjusted EBITDA
279,711
$
327,462
$
377,457
$
397,129
$
404,264
$
Utility Adjusted EBITDA
164,443
167,328
168,540
159,986
164,386
Pipeline & Storage Adjusted EBITDA
130,857
120,858
111,474
136,914
146,147
Energy Marketing Adjusted EBITDA
11,589
13,573
13,178
5,945
6,065
Corporate & All Other Adjusted EBITDA
(5,575)
2,429
(2,960)
4,140
5,849
Total Adjusted EBITDA
581,025
$
631,650
$
667,689
$
704,114
$
726,711
$
Total Adjusted EBITDA
581,025
$
631,650
$
667,689
$
704,114
$
726,711
$
Minus: Net Interest Expense
(81,013)
(90,217)
(75,205)
(82,551)
(85,375)
Plus: Other Income
9,762
6,126
5,947
5,133
5,212
Minus: Income Tax Expense
(52,859)
(137,227)
(164,381)
(150,554)
(153,379)
Minus: Depreciation, Depletion & Amortization
(170,620)
(191,199)
(226,527)
(271,530)
(281,314)
Minus: Impairment of Oil and Gas Properties (E&P)
(182,811)
-
-
-
-
Plus/Minus: Income/(Loss) from Discontinued
Operations, Net of Tax (Corp. & All Other) (2,776)
6,780
-
-
-
Plus: Gain on Sale of Unconsolidated
Subsidiaries (Corp. & All Other) -
-
50,879
-
-
Plus: Elimination of Other Post-Retirement
Regulatory Liability (P&S) -
-
-
21,672
21,672
Minus: Pennsylvania Impact Fee Related to Prior Fiscal Years (E&P)
-
-
-
(6,206)
(6,206)
Rounding
-
-
-
(1)
2
Consolidated Net
Income 100,708
$
225,913
$
258,402
$
220,077
$
227,322
$
12-Months Ended
12/31/12 |
 April
2013 53
Reconciliation of Segment Capital Expenditures to
Consolidated Capital Expenditures
($ Thousands)
FY 2013
FY 2009
FY 2010
FY 2011
FY 2012
Forecast
Capital Expenditures from Continuing Operations
Exploration & Production Capital Expenditures
188,290
$
398,174
$
648,815
$
693,810
$
$480,000-560,000
Pipeline & Storage Capital Expenditures - Expansion
52,504
37,894
129,206
144,167
$70,000-90,000
Utility Capital Expenditures
56,178
57,973
58,398
58,284
$65,000-70,000
Marketing, Corporate & All Other Capital Expenditures
9,829
7,311
17,767
81,133
$50,000-75,000
Total Capital Expenditures from Continuing Operations
306,801
$
501,352
$
854,186
$
977,394
$
$665,000-795,000
Capital Expenditures from Discountinued Operations
All Other Capital Expenditures
216
150
$
-
$
-
$
-
$
Plus (Minus) Accrued Capital Expenditures
Exploration & Production FY 2012 Accrued Capital Expenditures
-
$
-
$
-
$
(38,861)
$
-
$
Exploration & Production FY 2011 Accrued Capital Expenditures
-
-
(103,287)
103,287
-
Exploration & Production FY 2010 Accrued Capital Expenditures
-
(78,633)
78,633
-
-
Exploration & Production FY 2009 Accrued Capital Expenditures
(9,093)
19,517
-
-
-
Pipeline & Storage FY 2012 Accrued Capital Expenditures
-
-
-
(2,696)
-
Pipeline & Storage FY 2011 Accrued Capital Expenditures
-
-
(7,271)
7,271
-
Pipeline & Storage FY 2008 Accrued Capital Expenditures
16,768
-
-
-
-
All Other FY 2012 Accrued Capital Expenditures
-
-
-
(11,000)
-
All Other FY 2011 Accrued Capital Expenditures
-
-
(1,389)
1,389
-
All Other FY 2009 Accrued Capital Expenditures
(715)
715
-
-
-
Total Accrued Capital Expenditures
6,960
$
(58,401)
$
(33,314)
$
59,390
$
-
$
Eliminations
(344)
$
-
$
-
$
-
$
-
$
Total Capital Expenditures per Statement of Cash Flows
313,633
$
443,101
$
820,872
$
1,036,784
$
$665,000-795,000 |