Attached files
| file | filename |
|---|---|
| EX-1.1 - EX-1.1 - Performant Financial Corp | d516896dex11.htm |
| EX-23.1 - EX-23.1 - Performant Financial Corp | d516896dex231.htm |
Table of Contents
As filed with the Securities and Exchange Commission on April 10, 2013
Registration No. 333-
UNITED STATES SECURITIES AND EXCHANGE COMMISSION
Washington, D.C. 20549
Form S-1
REGISTRATION STATEMENT
Under
THE SECURITIES ACT OF 1933
PERFORMANT FINANCIAL CORPORATION
(Exact name of registrant as specified in its charter)
| Delaware | 7389 | 20-0484934 | ||
| (State or other jurisdiction of incorporation or organization) |
(Primary Standard Industrial Classification Code Number) |
(I.R.S. Employer Identification No.) |
333 North Canyons Parkway
Livermore, California 94551
(925) 960-4800
(Address, including zip code, and telephone number, including area code, of registrant’s principal executive offices)
Lisa Im
Chief Executive Officer
333 North Canyons Parkway
Livermore, California 94551
(925) 960-4800
(Name, address, including zip code, and telephone number, including area code, of agent for service)
Copies to:
| Blair W. White, Esq. | Joshua N. Korff, Esq. | |
| David E. Lillevand, Esq. | Michael Kim, Esq. | |
| Matthew Hallinan, Esq. | Kirkland & Ellis LLP | |
| Pillsbury Winthrop Shaw Pittman LLP | 601 Lexington Avenue | |
| Four Embarcadero Center, 22nd Floor | New York, New York 10022 | |
| San Francisco, California 94111 | (212) 446-4800 | |
| (415) 983-1000 |
Approximate date of commencement of proposed sale to the public: As soon as practicable after this Registration Statement becomes effective.
If any of the securities being registered on this Form are to be offered on a delayed or continuous basis pursuant to Rule 415 under the Securities Act of 1933, check the following box. ¨
If this Form is filed to register additional securities for an offering pursuant to Rule 462(b) under the Securities Act, please check the following box and list the Securities Act registration statement number of the earlier effective registration statement for the same offering. ¨
If this Form is a post-effective amendment filed pursuant to Rule 462(c) under the Securities Act, check the following box and list the Securities Act registration statement number of the earlier effective registration statement for the same offering. ¨
If this Form is a post-effective amendment filed pursuant to Rule 462(d) under the Securities Act, check the following box and list the Securities Act registration statement number of the earlier effective registration statement for the same offering. ¨
Indicate by check mark whether the registrant is a large accelerated filer, an accelerated filer, a non-accelerated filer, or a smaller reporting company. See the definitions of “large accelerated filer,” “accelerated filer” and “smaller reporting company” in Rule 12b-2 of the Exchange Act. (Check one):
| Large accelerated filer ¨ | Accelerated filer ¨ | Non-accelerated filer x | Smaller reporting company ¨ | |||
| (Do not check if a smaller reporting company) | ||||||
CALCULATION OF REGISTRATION FEE
|
| ||||||||
| Title of each class of securities to be registered |
Amount to be Registered(1) |
Proposed Maximum Offering Price Per Share(2) |
Proposed maximum aggregate offering price(2) |
Amount of registration fee | ||||
| Common Stock, $.0001 par value per share |
6,000,000 | $12.78 | $76,680,000 | $10,460 | ||||
|
| ||||||||
|
| ||||||||
| (1) | Includes shares that the underwriters have the option to purchase, if any. |
| (2) | Estimated solely for purposes of calculating the amount of the registration fee pursuant to Rule 457(a) of the Securities Act of 1933, as amended. In accordance with Rule 457(c) of the Securities Act of 1933, as amended, the price shown is the average of the high and low selling prices of the Common Stock on April 9, 2013, as reported on the NASDAQ Global Select Market. |
The Registrant hereby amends this Registration Statement on such date or dates as may be necessary to delay its effective date until the Registrant shall file a further amendment which specifically states that this Registration Statement shall thereafter become effective in accordance with Section 8(a) of the Securities Act of 1933 or until the Registration Statement shall become effective on such date as the Commission, acting pursuant to said Section 8(a), may determine.
Table of Contents
The information in this preliminary prospectus is not complete and may be changed. The selling stockholders may not sell these securities until the registration statement filed with the Securities and Exchange Commission is effective. This preliminary prospectus is not an offer to sell these securities and the selling stockholders are not soliciting offers to buy these securities in any state where the offer or sale is not permitted.
PROSPECTUS (Subject to Completion)
Issued April 10, 2013
Shares

COMMON STOCK
The selling stockholders are offering shares of common stock. We will not receive any proceeds from the sale of shares by the selling stockholders.
Our common stock is listed on The NASDAQ Global Select Market under the symbol “PFMT.” On , 2013, the last sale of our common stock as reported on The NASDAQ Global Select Market was $ per share.
Investing in our common stock involves risks. See “Risk Factors” beginning on page 12.
PRICE $ A SHARE
| Price to Public | Underwriting Discounts and Commissions |
Proceeds to Selling Stockholders |
||||||||||
| Per Share |
$ | $ | $ | |||||||||
| Total |
$ | $ | $ | |||||||||
The selling stockholders identified in this prospectus have granted the underwriters an option for a period of 30 days to purchase, on the same terms and conditions as set forth above, up to an additional shares of our common stock. We will not receive any of the proceeds from the sale of shares by these selling stockholders if the underwriters exercise their option to purchase additional shares of common stock.
The Securities and Exchange Commission and state securities regulators have not approved or disapproved these securities, or determined if this prospectus is truthful or complete. Any representation to the contrary is a criminal offense.
The underwriters expect to deliver the shares of common stock to purchasers on , 2013.
| GOLDMAN, SACHS & CO. | MORGAN STANLEY | |
| WELLS FARGO SECURITIES | CREDIT SUISSE |
| WILLIAM BLAIR | COMPASS POINT |
, 2013
Table of Contents
You should rely only on the information contained in this prospectus and any free writing prospectus we may specifically authorize to be delivered or made available to you. We have not, and the selling stockholders and the underwriters have not, authorized anyone to provide you with additional or different information. The information contained in this prospectus or any free writing prospectus is accurate only as of its date, regardless of its time of delivery or of any sale of shares of our common stock. Our business, financial condition, results of operations and prospects may have changed since that date.
This prospectus is an offer to sell only the shares offered hereby but only under circumstances and in jurisdictions where it is lawful to do so.
Table of Contents
This summary highlights information contained elsewhere in this prospectus and does not contain all of the information you should consider before investing in our common stock. You should read this entire prospectus carefully, including our consolidated financial statements and the related notes and the information set forth under the headings “Risk Factors” and “Management’s Discussion and Analysis of Financial Condition and Results of Operations,” in each case included elsewhere in this prospectus. Unless expressly indicated or the context otherwise requires, in this prospectus, “Performant,” “we,” “us,” “our,” and the “Company” refer to Performant Financial Corporation and, where appropriate, its subsidiaries.
Overview
We provide technology-enabled recovery and related analytics services in the United States. Our services help identify and recover delinquent or defaulted assets and improper payments for both government and private clients in a broad range of markets. Our clients typically operate in complex and regulated environments and outsource their recovery needs in order to reduce losses on billions of dollars of defaulted student loans, improper healthcare payments and delinquent state tax and federal treasury receivables. We generally provide our services on an outsourced basis, where we handle many or all aspects of our clients’ recovery processes.
We believe we have a leading position in our markets based on our proprietary technology-enabled services platform, long-standing client relationships and the large volume of funds we have recovered for our clients. Our clients include 11 of the 31 public sector participants in the student loan industry and these relationships average more than 10 years in length, including a 22-year relationship with the Department of Education. In the healthcare market, we are currently one of four prime Medicare Recovery Audit Contractors, or RACs, in the United States for the Centers for Medicare and Medicaid Services, or CMS.
We utilize our technology platform to efficiently provide recovery and analytics services in the markets we serve. We have continuously developed and refined our technology platform for almost two decades by using our extensive domain and data processing expertise. We believe our technology platform allows us to achieve higher workforce productivity versus more traditional labor-intensive outsourcing business models, as we generated in excess of $150,000 of revenues per employee during 2012, based on the average number of employees during the year. In addition, we believe that our platform is easily adaptable to new markets and processes. For example, we utilized the same basic platform previously used primarily for student loan recovery activities to enter the healthcare market.
Our revenue model is generally success-based as we earn fees based on a percentage of the aggregate amount of funds that we enable our clients to recover. Our services do not require any significant upfront investments by our clients and we offer our clients the opportunity to recover significant funds otherwise lost. Furthermore, our business model does not require significant capital expenditures for us and we do not purchase loans or obligations. We believe we benefit from a significant degree of revenue visibility due to reasonably predictable recovery outcomes in a substantial portion of our business. For the year ended December 31, 2012, we generated approximately $210.1 million in revenues, $23.0 million in net income, $69.6 million in adjusted EBITDA and $30.6 million in adjusted net income. See “Adjusted EBITDA and Adjusted Net Income” below for a definition of adjusted EBITDA and adjusted net income and reconciliations of adjusted EBITDA and adjusted net income to net income determined in accordance with generally accepted accounting principles.
Our Markets
We operate in markets characterized by strong growth, a complex regulatory environment and a significant amount of delinquent, defaulted or improperly paid assets.
1
Table of Contents
Student Lending
According to the Department of Education, total government-supported student loan originations were estimated to be approximately $115 billion in the year ended September 30, 2012, and the aggregate dollar amount of these loans has grown at a compound annual growth rate of 11% from 2002 through 2012. The “cohort default rate,” which is the measure utilized by the Department of Education to track the percentage of government-supported loan borrowers that enter repayment in a certain year ended September 30 and default by the end of the next year ended September 30, has risen from approximately 5% in 2006 to approximately 9% in 2010, the last year for which data is available.
Healthcare
According to CMS, U.S. healthcare spending reached $2.7 trillion in 2011 and is forecast to grow at a 6% annual rate through 2021. CMS indicates that government-related healthcare spending for 2011 totaled approximately $1.2 trillion. This government-related spending included approximately $554 billion of payments under Medicare, of which $43 billion, or 8%, was estimated to be improper. Medicare improper payments generally involve incorrect coding, procedures performed which were not medically necessary, incomplete documentation or claims submitted based on outdated fee schedules, among other issues.
Other Markets
We believe that the demand for recovery of delinquent state taxes will grow as state governments struggle with revenue generation and face significant budget deficits. According to the Center on Budget and Policy Priorities, an independent think tank, 43 U.S. states faced budget shortfalls totaling $107 billion in the year ended September 30, 2012, with at least 31 states anticipating deficits for fiscal year 2013. The federal agency market consists of government debt subrogated to the Department of the Treasury. For the year ended September 30, 2011, federal agency recoveries in this market totaled more than $6.2 billion, a significant portion of which were made by private firms on behalf of the Department of Financial Management Service, a bureau of the Department of the Treasury.
Our Platform
Our technology-enabled services platform is based on over two decades of experience in recovering large amounts of funds on behalf of our clients across several markets. The components of our platform include our data management expertise, analytics capabilities and technology-based workflow processes. Our platform integrates these components to allow us to achieve optimized outcomes for our clients in the form of increased efficiency and productivity and high recovery rates. We believe our platform and workflow processes are also intuitive and easy to use for our recovery and claims specialists and allow us to increase our employee retention and productivity.
Our Competitive Strengths
We believe that our business is difficult to replicate, as it incorporates a combination of several important and differentiated elements, including:
| • | Scalable and flexible technology-enabled services platform. We have built a proprietary technology platform that is highly flexible, intuitive and easy to use for our recovery and claims specialists. Our platform is easily configurable and deployable across multiple markets and processes. |
| • | Advanced, technology-enabled workflow processes. Our technology-enabled workflow processes, developed over many years of operational experience in recovery services, disaggregate otherwise complex recovery processes into a series of simple, efficient and consistent steps that are easily configurable and applicable to different types of recovery-related applications. |
2
Table of Contents
| • | Enhanced data and analytics capabilities. Our data and analytics capabilities allow us to achieve strong recovery rates for our clients. We have collected recovery-related data for over two decades, which we combine with large volumes of client and third-party data to effectively analyze our clients’ delinquent or defaulted assets and improper payments. We have also developed a number of analytics tools that we use to score our clients’ recovery inventory, determine the optimal recovery process and allocation of resources, and achieve higher levels of recovery results for our clients. |
| • | Long-standing client relationships. We believe our long-standing focus on achieving superior recovery performance for our clients and the significant value our clients derive from this focus have helped us achieve long-tenured client relationships, strong contract retention and better access to new clients and future growth opportunities. |
| • | Extensive domain expertise in complex and regulated markets. We have extensive experience and domain expertise in providing recovery services for government and private institutions that generally operate in complex and regulated markets. We have demonstrated our ability to develop domain expertise in new markets such as healthcare and state tax and federal Treasury receivables. |
| • | Proven and experienced management team. Our management team has significant industry experience and has successfully grown our revenue base and service offerings beyond the original student loan market into healthcare and delinquent state tax and private financial institutions receivables. |
Our Growth Strategy
Key elements of our growth strategy include the following:
| • | Expand our student loan recovery volume. We have long-standing relationships with some of the largest participants in the government-supported student loan market, and we believe there are significant opportunities within this growing market to increase the volume of student loans placed with us by existing and new clients. |
| • | Expand our recovery services in the healthcare market. As healthcare spending grows, we expect the need for recovery services to increase in the public and private healthcare markets. We intend to expand our recovery services for existing clients, such as CMS, and offer analytics services to potential clients in the private healthcare market. |
| • | Pursue strategic alliances and acquisitions. We intend to selectively consider opportunities to grow through strategic alliances or acquisitions that are complementary to our business. |
Recent Developments (Unaudited)
Three-months ended March 31, 2013
Our consolidated financial statements for the three-months ended March 31, 2013 are not yet available. Our expectations with respect to our unaudited results for the period discussed below are based upon management estimates. The preliminary financial results presented below are subject to the completion of our financial closing procedures and any adjustments that may result from the completion of the audit of our 2013 consolidated financial statements. Accordingly, these results may change and those changes may be material. This summary is not meant to be a comprehensive statement of our unaudited financial results for this period and our actual results may differ from these estimates. For additional information regarding the various risks and uncertainties inherent in estimates of this type, see “Information Regarding Forward-Looking Statements” elsewhere in this prospectus.
3
Table of Contents
We are providing the following preliminary estimates of our financial results and operating metrics for the three-months ended March 31, 2013:
GAAP
| • | Revenues are expected to be between $47.5 million and $50.5 million, representing an increase of approximately 7% at the midpoint of the range compared to the three-months ended March 31, 2012. The estimated increase was primarily due to increased revenues from the student lending market. Revenues from the student lending market are estimated to be between $33.0 million and $33.5 million, representing an increase of approximately 14% at the midpoint of the range compared to the three months ended March 31, 2012. This estimated increase was due to the resolution of the Department of Education’s technology system upgrade, which adversely affected our revenues in the 2012 period. Revenues from the healthcare market are estimated to be between $9.2 million and $11.2 million, representing a decrease of approximately 16% at the midpoint of the range compared to the three months ended March 31, 2012. This estimated decrease was primarily due to our inability to audit certain healthcare providers in the fourth quarter of 2012 following Hurricane Sandy, as well as a temporary interruption in our client’s claim processing that delayed revenue recognition until after quarter end. We expect to recognize these revenues in the second quarter of 2013. Revenues from other markets are estimated to be between $5.3 million and $5.8 million. |
| • | Net income is estimated to be between $1.3 million and $1.9 million, representing a decrease of approximately 36% at the midpoint of the range compared to the three-months ended March 31, 2012. This estimated decrease was due to the delays in revenue recognition described above, as well as increased operating expenses consistent with the growth of our recovery activities under our RAC contract. In addition, we had expenses of approximately $1.6 million associated with our public offering completed in February 2013, and these expenses were not deductible for tax purposes. This resulted in an effective tax rate of approximately 50%; absent these expenses we believe that our effective tax rate would have been approximately 40%. |
Non-GAAP
| • | Adjusted EBITDA is expected to be between $10.3 million and $11.8 million, representing a decrease of approximately 19% at the midpoint of the range compared to the three months ended March 31, 2012, primarily due to the increase in operating expenses and our inability to recognize certain revenues as described above. |
| • | Adjusted net income is estimated to be between $2.7 million and $3.4 million, representing a decrease of approximately 46% at the midpoint of the range compared to the three months ended March 31, 2012, primarily due to the increase in our operating expenses and our inability to recognize certain revenues as described above. |
See “—Summary Consolidated Financial Data—Adjusted EBITDA and Adjusted Net Income” for a definition of adjusted EBITDA and adjusted net income, the reasons for providing these financial measures and the limitations of these measures, which do not reflect all items of income and expense as reported under generally accepted accounting principles in the United States, or GAAP. Also, see below for reconciliations of the estimated and actual adjusted EBITDA and adjusted net income amounts set forth above to estimated or actual net income determined in accordance with GAAP.
Operating Metrics
| • | Student Loan Placement Volume is estimated to be between $1.5 billion and $1.8 billion and Placement Revenue as a Percentage of Placement Volume is estimated to be between 1.8% and 2.0%. |
4
Table of Contents
| • | Healthcare Net Claim Recovery Volume is estimated to be between $80.0 million and $95.0 million and Claim Recovery Fee Rate is estimated to be approximately 11.3%. |
See “Management’s Discussion and Analysis of Financial Condition and Results of Operations—Operating Metrics” for the definition of the operating metrics used above and the purposes for which management uses these metrics.
Reconciliation of Non-GAAP Financial Information
The following tables present a reconciliation of estimated adjusted EBITDA and estimated adjusted net income for the three-months ended March 31, 2013 to estimated net income for this period and adjusted EBITDA and adjusted net income for the three-months ended March 31, 2012, to actual net income for this period:
| Three Months Ended | ||||||||
| March 31, 2013 |
March 31, 2012 |
|||||||
| (in thousands) | ||||||||
| Reconciliation of Adjusted EBITDA: |
||||||||
| Net income |
$ | 1,270 to 1,935 | $ | 2,516 | ||||
| Provision for income taxes |
1,264 to 2,099 | 1,742 | ||||||
| Interest expense |
2,966 | 3,190 | ||||||
| Interest income |
— | (31 | ) | |||||
| Debt extinguishment costs(1) |
— | 3,679 | ||||||
| Depreciation and amortization |
2,509 | 2,214 | ||||||
| Non-core operating expenses(2) |
— | 29 | ||||||
| Advisory fee(3) |
— | 309 | ||||||
| Deal expenses(4) |
1,579 | — | ||||||
| Stock based compensation |
712 | 52 | ||||||
|
|
|
|
|
|||||
| Adjusted EBITDA |
$ | 10,300 to 11,800 | $ | 13,700 | ||||
| Three Months Ended | ||||||||
| March 31, 2013 |
March 31, 2012 |
|||||||
| (in thousands) | ||||||||
| Reconciliation of Adjusted Net Income: |
||||||||
| Net income |
$ | 1,270 to 1,935 | $ | 2,516 | ||||
| Debt extinguishment costs(1) |
— | 3,679 | ||||||
| Non–core operating expenses(2) |
— | 29 | ||||||
| Advisory fee(3) |
— | 309 | ||||||
| Deal expenses(4) |
1,579 | — | ||||||
| Stock based compensation |
712 | 52 | ||||||
| Amortization of intangibles(5) |
933 | 875 | ||||||
| Deferred financing amortization costs(6) |
285 | 282 | ||||||
| Tax adjustments(7) |
(2,061) | (2,090 | ) | |||||
|
|
|
|
|
|||||
| Adjusted net income |
$ | 2,717 to 3,382 | $ | 5,652 | ||||
| (1) | Represents debt extinguishment costs comprised of approximately $3.3 million of fees paid to lenders in connection with our new credit facility and approximately $0.3 million of unamortized debt issuance costs in connection with our old credit facility. |
| (2) | Represents professional fees and settlement costs related to strategic corporate development activities and a $1.2 million legal settlement in 2011. |
| (3) | Represents expenses incurred under an advisory services agreement with Parthenon Capital Partners, which was terminated in April 2012. See Note 11 “Related Party Transactions” to our consolidated financial statements included elsewhere in this prospectus. |
5
Table of Contents
| (4) | Represents costs associated with our public offering completed in February 2013. |
| (5) | Represents amortization of capitalized expenses related to the acquisition of Performant by Parthenon Capital Partners in 2004 and an acquisition in the first quarter of 2012 to enhance our analytics capabilities. |
| (6) | Represents amortization of capitalized financing costs related to debt offerings conducted in 2009, 2010 and 2012. |
| (7) | Represents tax adjustments assuming a marginal tax rate of 40%. |
Risks Associated With Our Business
Our business is subject to numerous risks and uncertainties including those highlighted in the section titled “Risk Factors” immediately following the prospectus summary. Some of these risks include, among others, that:
| • | Revenues generated from our five largest clients represented 81% of our revenues for the year ended December 31, 2012, and any termination of or deterioration in our relationship with any of these clients would result in a decline in our revenues; |
| • | Many of our contracts with our clients for the recovery of student loans and other receivables are subject to periodic renewal or re-bidding processes, are not exclusive and do not commit our clients to provide specified volumes of business. In addition, the terms of these contracts may be changed unilaterally and on short notice by our clients. As a consequence, there is no assurance that we will be able to maintain our revenues and operating results; |
| • | We face significant competition in connection with obtaining, retaining and performing under our existing client contracts, including our contracts with the Department of Education and CMS, and an inability to compete effectively in the future could harm our relationships with our clients, which would impact our ability to maintain our revenues and operating results; |
| • | The U.S. federal government accounts for a significant portion of our revenues, and any loss of business from, or change in our relationship with, the U.S. federal government would result in a significant decrease in our revenues and operating results; |
| • | Future legislative or regulatory changes affecting the markets in which we operate could impair our business and operations; |
| • | Our business relationship with the Department of Education has accounted for a significant portion of our revenues and will take on increasing importance as a result of the Student Aid and Fiscal Responsibility Act of 2010, or SAFRA. Our failure to maintain this relationship would significantly decrease our revenues; |
| • | We could lose clients as a result of consolidation among the Guaranty Agencies, or GAs, which would decrease our revenues; |
| • | Our ability to derive revenues under our RAC contract will depend in part on the number and types of potentially improper claims that we are allowed to pursue by CMS, and our results of operations may be harmed if the scope of claims that we are allowed to pursue and be compensated for is limited; |
| • | A failure of our operating systems or technology infrastructure, or those of our third-party vendors and subcontractors, could disrupt the operation of our business; |
| • | If our security measures are breached or fail and unauthorized access is obtained to our clients’ confidential data, our services may be perceived as insecure, the attractiveness of our recovery services to current or potential clients may be reduced, and we may incur significant liabilities; |
| • | We are subject to extensive regulations regarding our recovery practices and the use and disclosure of confidential personal and healthcare information and failure to comply with these regulations could cause us to incur liabilities and expenses; and |
6
Table of Contents
| • | Our recovery business is subject to extensive regulation and consumer protection laws and our failure to comply with those regulations and laws may subject us to liability and result in significant costs. |
Corporate Information
We commenced our operations in 1976 under the corporate name Diversified Collection Services, Inc., or DCS. We were incorporated in Delaware on October 8, 2003 under the name DCS Holdings, Inc. and subsequently changed our name to Performant Financial Corporation in 2005. Our principal executive offices are located at 333 North Canyons Parkway, Livermore, California 94551 and our telephone number is (925) 960-4800. Our website address is www.performantcorp.com. The information on or accessible through our website is not part of this prospectus.
Our Principal Stockholder
Our principal stockholder, an affiliate of Parthenon Capital Partners, which we refer to as Parthenon Capital Partners, acquired its interest in us in 2004 and prior to this offering beneficially owned approximately 48.6% of our outstanding common stock as of March 31, 2013. Parthenon Capital Partners is a private equity investment firm with approximately $2 billion of capital under management. Parthenon Capital Partners was founded in March of 1998 and focuses on investing in select middle-market companies. The firm invests in a variety of industry sectors with particular expertise in business and financial services, healthcare, distribution/logistics, and technology-enabled services.
7
Table of Contents
THE OFFERING
| Common stock offered by the selling stockholders |
shares |
| Common stock to be outstanding after this offering |
45,392,224 shares |
| Option to purchase additional shares offered by the selling stockholders |
shares |
| Use of proceeds |
We will not receive any of the proceeds from the sale of shares in this offering. See “Use of Proceeds” and “Principal and Selling Stockholders.” |
| NASDAQ Global Select Market symbol |
“PFMT” |
The number of shares of common stock that will be outstanding after this offering is based on the number of shares outstanding as of December 31, 2012, and excludes:
| • | 7,909,724 shares of common stock issuable upon the exercise of options outstanding as of December 31, 2012, at a weighted-average exercise price of approximately $3.85 per share; and |
| • | 1,864,636 shares of common stock reserved for future issuance under our 2012 Stock Incentive Plan. |
Unless expressly indicated or the context otherwise requires, all information in this prospectus assumes:
| • | no exercise by the underwriters of their right to purchase up to an additional shares of common stock from the selling stockholders to cover over-allotments; and |
| • | no exercise of options outstanding as of December 31, 2012. |
8
Table of Contents
SUMMARY CONSOLIDATED FINANCIAL DATA
We have derived the summary consolidated statement of operations data for 2012, 2011 and 2010 and the summary consolidated balance sheet data as of December 31, 2012 from our audited consolidated financial statements included elsewhere in this prospectus. Our historical results are not necessarily indicative of the results that may be expected in the future. The following summary consolidated financial data should be read together with “Management’s Discussion and Analysis of Financial Condition and Results of Operations” and our consolidated financial statements and related notes included elsewhere in this prospectus.
| Year Ended December 31, | ||||||||||||
| 2012 | 2011 | 2010 | ||||||||||
| (in thousands) | ||||||||||||
| Consolidated Statement of Operations Data: | ||||||||||||
| Revenues |
$ | 210,073 | $ | 162,974 | $ | 123,519 | ||||||
| Operating expenses: |
||||||||||||
| Salaries and benefits |
83,002 | 67,082 | 58,113 | |||||||||
| Other operating expense |
71,305 | 49,199 | 33,655 | |||||||||
| Impairment of trade name |
— | 13,400 | — | |||||||||
|
|
|
|
|
|
|
|||||||
| Total operating expenses |
154,307 | 129,681 | 91,768 | |||||||||
|
|
|
|
|
|
|
|||||||
| Income from operations |
55,766 | 33,293 | 31,751 | |||||||||
| Debt extinguishment costs(1) |
(3,679) | — | — | |||||||||
| Interest expense |
(12,414) | (13,530) | (15,230) | |||||||||
| Interest income |
64 | 125 | 118 | |||||||||
|
|
|
|
|
|
|
|||||||
| Income before provision for income taxes |
39,737 | 19,888 | 16,639 | |||||||||
| Provision for income taxes |
16,786 | 7,516 | 6,664 | |||||||||
|
|
|
|
|
|
|
|||||||
| Net income |
$ | 22,951 | $ | 12,372 | $ | 9,975 | ||||||
|
|
|
|
|
|
|
|||||||
| Accrual for preferred stock dividends |
2,038 | 6,495 | 5,771 | |||||||||
|
|
|
|
|
|
|
|||||||
| Net income (loss) available to common shareholders |
$ | 20,913 | $ | 5,877 | $ | 4,204 | ||||||
| Net income (loss) per share attributable to common shareholders(2) |
||||||||||||
| Basic |
$ | 0.48 | $ | 0.14 | $ | 0.10 | ||||||
|
|
|
|
|
|
|
|||||||
| Diluted |
$ | 0.44 | $ | 0.13 | $ | 0.09 | ||||||
|
|
|
|
|
|
|
|||||||
| Weighted average shares (in thousands) |
||||||||||||
| Basic |
43,985 | 42,962 | 42,962 | |||||||||
|
|
|
|
|
|
|
|||||||
| Diluted |
47,599 | 45,742 | 45,019 | |||||||||
|
|
|
|
|
|
|
|||||||
| (1) | Represents debt extinguishment costs comprised of approximately $3.3 million of fees paid to lenders in connection with our new credit facility and approximately $0.3 million of unamortized debt issuance costs in connection with our old credit facility. |
| (2) | Please see Note 1 to our consolidated financial statements for an explanation of the calculations of our basic and diluted net income per share of common stock. |
| As of December
31, 2012 |
||||
| (in thousands) | ||||
| Consolidated Balance Sheet Data: |
||||
| Cash and cash equivalents |
$ | 37,843 | ||
| Total assets |
211,745 | |||
| Total debt |
147,769 | |||
| Total liabilities |
187,672 | |||
| Redeemable preferred stock |
— | |||
| Total stockholders’ (deficit) equity |
24,073 | |||
9
Table of Contents
Adjusted EBITDA and Adjusted Net Income
To provide investors with additional information regarding our financial results, we have disclosed in the table below and within this prospectus adjusted EBITDA and adjusted net income, both of which are non-GAAP financial measures. We have provided a reconciliation below of adjusted EBITDA to net income and adjusted net income to net income, the most directly comparable GAAP financial measure to these non-GAAP financial measures.
We have included adjusted EBITDA and adjusted net income in this prospectus because they are key measures used by our management and board of directors to understand and evaluate our core operating performance and trends and to prepare and approve our annual budget. Accordingly, we believe that adjusted EBITDA and adjusted net income provide useful information to investors and analysts in understanding and evaluating our operating results in the same manner as our management and board of directors.
Our use of adjusted EBITDA and adjusted net income has limitations as an analytical tool, and you should not consider them in isolation or as a substitute for analysis of our results as reported under GAAP. Some of these limitations are:
| • | although depreciation and amortization are non-cash charges, the assets being depreciated and amortized may have to be replaced in the future, and adjusted EBITDA does not reflect cash capital expenditure requirements for such replacements or for new capital expenditure requirements; |
| • | adjusted EBITDA does not reflect interest expense on our indebtedness; |
| • | adjusted EBITDA does not reflect changes in, or cash requirements for, our working capital needs; |
| • | adjusted EBITDA does not reflect tax payments; |
| • | adjusted EBITDA and adjusted net income do not reflect the potentially dilutive impact of equity-based compensation; |
| • | adjusted EBITDA and adjusted net income do not reflect the impact of certain non-operating expenses resulting from matters we do not consider to be indicative of our core operating performance; and |
| • | other companies may calculate adjusted EBITDA and adjusted net income differently than we do, which reduces its usefulness as a comparative measure. |
Because of these limitations, you should consider adjusted EBITDA and adjusted net income alongside other financial performance measures, including net income and our other GAAP results.
10
Table of Contents
The following tables present a reconciliation of adjusted EBITDA and adjusted net income for the years ended December 31, 2012, 2011 and 2010 to net income for these periods:
| Year
Ended December 31, |
||||||||||||
| 2012 | 2011 | 2010 | ||||||||||
| (in thousands) | ||||||||||||
| Reconciliation of Adjusted EBITDA: |
||||||||||||
| Net income |
$ | 22,951 | $ | 12,372 | $ | 9,975 | ||||||
| Provision for income taxes |
16,786 | 7,516 | 6,664 | |||||||||
| Interest expense |
12,414 | 13,530 | 15,230 | |||||||||
| Interest income |
(64 | ) | (125 | ) | (118 | ) | ||||||
| Debt extinguishment costs(1) |
3,679 | — | — | |||||||||
| Depreciation and amortization |
9,505 | 7,766 | 7,213 | |||||||||
| Impairment of trade name(2) |
— | 13,400 | — | |||||||||
| Non-core operating expenses(3) |
47 | 2,548 | 1,108 | |||||||||
| Advisory fee(4) |
2,641 | 634 | 759 | |||||||||
| Stock based compensation |
1,614 | 120 | 629 | |||||||||
|
|
|
|
|
|
|
|||||||
| Adjusted EBITDA |
$ | 69,573 | $ | 57,761 | $ | 41,460 | ||||||
| Year Ended December 31, |
||||||||||||
| 2012 | 2011 | 2010 | ||||||||||
| (in thousands) | ||||||||||||
| Reconciliation of Adjusted Net Income: |
||||||||||||
| Net income |
$ | 22,951 | $ | 12,372 | $ | 9,975 | ||||||
| Debt extinguishment costs(1) |
3,679 | — | — | |||||||||
| Impairment of trade name(2) |
— | 13,400 | — | |||||||||
| Non–core operating expenses(3) |
47 | 2,548 | 1,108 | |||||||||
| Advisory fee(4) |
2,641 | 634 | 759 | |||||||||
| Stock based compensation |
1,614 | 120 | 629 | |||||||||
| Amortization of intangibles(5) |
3,676 | 3,043 | 3,043 | |||||||||
| Deferred financing amortization costs(6) |
1,161 | 1,254 | 1,997 | |||||||||
| Tax adjustments(7) |
(5,126 | ) | (8,400 | ) | (3,014 | ) | ||||||
|
|
|
|
|
|
|
|||||||
| Adjusted net income |
$ | 30,643 | $ | 24,971 | $ | 14,497 | ||||||
| (1) | Represents debt extinguishment costs comprised of approximately $3.3 million of fees paid to lenders in connection with our new credit facility and approximately $0.3 million of unamortized debt issuance costs in connection with our old credit facility. |
| (2) | Represents impairment expenses to write off the carrying amount of the trade name intangible asset due to the plan to retire the Diversified Collection Services, Inc. trade name. |
| (3) | Represents professional fees and settlement costs related to strategic corporate development activities and a $1.2 million legal settlement in 2011. |
| (4) | Represents expenses incurred under an advisory services agreement with Parthenon Capital Partners, which was terminated in April 2012. See Note 11 “Related Party Transactions” to our consolidated financial statements included elsewhere in this prospectus. |
| (5) | Represents amortization of capitalized expenses related to the acquisition of Performant by Parthenon Capital Partners in 2004 and an acquisition in the first quarter of 2012 to enhance our analytics capabilities. |
| (6) | Represents amortization of capitalized financing costs related to debt offerings conducted in 2009, 2010 and 2012. |
| (7) | Represents tax adjustments assuming a marginal tax rate of 40%. |
11
Table of Contents
Investing in our common stock involves substantial risks. In addition to the other information in this prospectus, you should carefully consider the following factors before investing in our common stock. Any of the risk factors we describe below could adversely affect our business, financial condition and results of operations. The market price of our common stock could decline if one or more of these risks and uncertainties actually occurs, causing you to lose all or part of your investment in our shares. Certain statements in “Risk Factors” are forward-looking statements. See “Information Regarding Forward-Looking Statements” included elsewhere in this prospectus.
Risks Related to Our Business
Revenues generated from our five largest clients represented 81% of our revenues for the year ended December 31, 2012, and any termination of or deterioration in our relationship with any of these clients would result in a decline in our revenues.
We derive a substantial majority of our revenues from a limited number of clients, including the Department of Education, CMS and three GAs. Revenues from our five largest clients represented 81% of our revenues for the year ended December 31, 2012. We expect that our revenues will become increasingly concentrated with our major clients as a result of rising business volumes under our RAC contract, which accounted for approximately 26% of our revenues for the year ended December 31, 2012, compared to approximately 13% of our revenues for the year ended December 31, 2011. If we lose one of these clients or if the terms of our relationships with any of these clients become less favorable to us, our revenues would decline, which would harm our business, financial condition and results of operations.
Many of our contracts with our clients for the recovery of student loans and other receivables are subject to periodic renewal or re-bidding processes, are not exclusive and do not commit our clients to provide specified volumes of business. In addition, the terms of these contracts may be changed unilaterally and on short notice by our clients. As a consequence, there is no assurance that we will be able to maintain our revenues and operating results.
Substantially all of our existing contracts for the recovery of student loan and other receivables, which represented approximately 63% of our revenues in 2012, enable our clients to unilaterally terminate their contractual relationship with us at any time without penalty, potentially leading to loss of business or renegotiation of terms. Our contracts generally are subject to a periodic rebidding process at the end of the contract term. Further, most of our contracts in these markets allow our clients to unilaterally change the volume of loans and other receivables that are placed with us at any given time. In addition, most of our contracts are not exclusive, with our clients retaining multiple service providers with whom we must compete for placements of loans or other obligations. Therefore, despite our contractual relationships with our clients, our contracts do not provide assurance that we will generate a minimum amount of revenues or that we will receive a specific volume of placements.
Our revenues and operating results would be negatively affected if our student loan and receivables clients, which include four of our five largest clients in 2012, do not renew their agreements with us upon contract expiration, reduce the volume of student loan placements provided to us, modify the terms of service, including the success fees we are able to earn upon recovery of defaulted student loans, or any of these clients establish more favorable relationships with our competitors. For example, our contractual arrangement with the Department of Education has recently changed as a result of the Department of Education’s decision to have its recovery vendors promote income-based repayment, or IBR, to defaulted student loans. The IBR program provides flexibility on the required monthly payment for student loan borrowers at an amount intended to be affordable based on a borrower’s income and family size. As a result of the increased application of the IBR program to defaulted student loans, we expect that there will be an increase in the number of loans that become
12
Table of Contents
eligible for rehabilitation because more defaulted student loan borrowers will be able to make qualifying payments. In connection with the implementation of the IBR program, the Department of Education has reduced the contingency fee rate that we will receive for rehabilitating student loans by approximately 13% effective as of March 1, 2013. Any changes in the contingency fee percentages or other compensation terms that we are paid under existing and future contracts could have a significant impact on our revenues and operating results.
We face significant competition in connection with obtaining, retaining and performing under our existing client contracts, including our contracts with the Department of Education and CMS, and an inability to compete effectively in the future could harm our relationships with our clients, which would impact our ability to maintain our revenues and operating results.
We operate in very competitive markets. In providing our services to the student loan and other receivables markets, we face competition from many other companies. Initially, we compete with these companies to be one of typically several firms engaged to provide recovery services to a particular client and, if we are successful in being engaged, we then face continuing competition from the client’s other retained firms based on the client’s benchmarking of the recovery rates of its several vendors. One of our largest clients, Department of Education, is expected to initiate a contract re-compete process during the first half of 2013. In addition, those recovery vendors who produce the highest recovery rates from a client often will be allocated additional placements and in some cases additional success fees. Accordingly, maintaining high levels of recovery performance, and doing so in a cost-effective manner, are important factors in our ability to maintain and grow our revenues and net income and the failure to achieve these objectives could harm our business, financial condition and results of operations.
Similarly, we faced a highly competitive bidding process to become one of the four prime RAC contractors that provide recovery services for improper Medicare payments and we are currently participating in a competitive bidding process for this contract. CMS issued a request for quotes in connection with the re-bidding for the RAC contracts in February 2013. Although our RAC contract is currently set to expire in 2014, CMS may terminate our RAC contract as early as August 2013 in connection with the re-bidding process for new RAC contracts. The failure to retain this contract or a significant adverse change in the terms of this contract, which generated approximately 26% of our revenues in the year ended December 31, 2012, would seriously harm our revenues and operating results.
Some of our current and potential competitors in the markets in which we operate may have greater financial, marketing, technological or other resources than we do. The ability of any of our competitors and potential competitors to adopt new and effective technology to better serve our markets may allow them to gain market strength. Increasing levels of competition in the future may result in lower recovery fees, lower volumes of contracted recovery services or higher costs for resources. Any inability to compete effectively in the markets that we serve could adversely affect our business, financial condition and results of operations.
The U.S. federal government accounts for a significant portion of our revenues, and any loss of business from, or change in our relationship with, the U.S. federal government would result in a significant decrease in our revenues and operating results.
We have historically derived and are likely to continue to derive a significant portion of our revenues from the U.S. federal government. For the year ended December 31, 2012, revenues under contracts with the U.S. federal government accounted for approximately 42% of our total revenues, compared to 27% for the year ended December 31, 2011. In addition, fees payable by the U.S. federal government are expected to become a larger percentage of our total revenues over the next several years as a result of legislation that has transferred responsibility for all new student loan origination to the Department of Education. The continuation and exercise of renewal options on existing government contracts and any new government contracts are, among other things, contingent upon the availability of adequate funding for the applicable federal government agency. Changes in federal government spending could directly affect our financial performance. For example, the Obama Administration’s proposed budget for the year ending September 30, 2013, like its proposed budget for fiscal 2012, includes a proposal designed to redirect federal government spending to an alternative federal program by
13
Table of Contents
decreasing the amount that GAs are compensated when they rehabilitate defaulted loans. The loss of business from the U.S. federal government, or significant policy changes or financial pressures within the agencies of the U.S. federal government that we serve would result in a significant decrease in our revenues, which would adversely affect our business, financial condition and results of operations.
Future legislative or regulatory changes affecting the markets in which we operate could impair our business and operations.
The two principal markets in which we provide our recovery services, government-supported student loans and the Medicare program, are a subject of significant legislative and regulatory focus and we cannot anticipate how future changes in government policy may affect our business and operations. For example, SAFRA significantly changed the structure of the government-supported student loan market by assigning responsibility for all new government-supported student loan originations to the Department of Education, rather than originations by private institutions and backed by one of 31 government-supported GAs. This legislation, and any future changes in the legislation and regulations that govern these markets, may require us to adapt our business to the new circumstances and we may be unable to do so in a manner that does not adversely affect our business and operations.
Our business relationship with the Department of Education has accounted for a significant portion of our revenues and will take on increasing importance to our business as a result of SAFRA. Our failure to maintain this relationship would significantly decrease our revenues.
The majority of our historical revenues from the student loan market have come from our relationships with the GAs. As a result of SAFRA, the Department of Education will ultimately become the sole source of revenues in this market, although the GAs will continue to service their existing student loan portfolios for many years to come. As a result, over time, defaults on student loans originated by the Department of Education will predominate and our ability to maintain the revenues we had previously received from a number of GA clients will depend on our relationship with a single client, the Department of Education. While we have 22 years of experience in performing student loan recovery services for the Department of Education, we are one of 17 unrestricted recovery service providers on the current Department of Education contract. In the year ended December 31, 2012, student loan recovery work for the Department of Education generated revenues of $29.0 million, or approximately 14% of our total revenues. The Department of Education is expected to initiate a contract re-compete process during the first half of 2013. If our relationship with the Department of Education terminates or deteriorates or if the Department of Education, ultimately as the sole holder of defaulted student loans, requires its contractors to agree to less favorable terms, our revenues would significantly decrease, and our business, financial condition and results of operations would be harmed.
We could lose clients as a result of consolidation among the GAs, which would decrease our revenues.
As a result of SAFRA, which terminated the ability of the GAs to originate government-supported student loans, some have speculated that there may be consolidation among the 31 GAs. If GAs that are our clients are combined with GAs with whom we do not have a relationship, we could suffer a loss of business. We currently have relationships with 11 of the 31 GAs and three of our GA clients were each responsible for more than 10% of our total revenues in the year ended December 31, 2012. The consolidation of our GA clients with others and the failure to provide recovery services to the consolidated entity could decrease our revenues, which could negatively impact our business, financial condition and results of operations.
Our ability to derive revenues under our RAC contract will depend in part on the number and types of potentially improper claims that we are allowed to pursue by CMS, and our results of operations may be harmed if the scope of claims that we are allowed to pursue and be compensated for is limited.
While we are the prime contractor responsible for review of Medicare records for all Part A and Part B claims in our region pursuant to the terms of our RAC contract with CMS, we are not permitted to seek the recovery of an improper claim unless that particular type of claim has been pre-approved by CMS to ensure
14
Table of Contents
compliance with applicable Medicare payment policies, as well as national and local coverage determinations. While the revenues we earn under our contract with CMS are determined primarily by the aggregate volume of Medicare claims in our region and our ability to successfully identify improper payments within these claims, the long-term growth of the revenues we derive under our RAC contract will also depend in part on CMS expanding the scope of potentially improper claims that we are allowed to pursue under our RAC contract. If we are unable to continue to identify improper claims within the types of claims that we are permitted to pursue from time to time or if CMS does not expand the scope of potentially improper claims that we are allowed to pursue, our results of operations could be adversely affected.
In addition, healthcare providers have taken various actions aimed at limiting Medicare audit and recovery activities. For example, in November 2012 the American Hospital Association and four hospitals filed a lawsuit against Kathleen Sebelius, the Secretary of the Department of Health and Human Services. The lawsuit claims, among other things, that CMS is acting improperly in completely denying payment for claims initially made under Medicare Part A (inpatient) that should have been made under Medicare Part B (outpatient), rather than remitting the difference between the Part A and Part B payments. A bill has been introduced in the U.S. Congress that would permit healthcare providers to resubmit such claims for payment for Part B services and CMS has recently proposed rules that would permit healthcare providers to resubmit certain of these claims for payment for Part B services. This type of improper claim has accounted for a substantial portion of the claims that we have identified under our RAC contract.
Our results of operations may fluctuate on a quarterly or annual basis and cause volatility in the price of our stock.
Our revenues and operating results could vary significantly from period-to-period and may fail to match our past performance because of a variety of factors, some of which are outside of our control. Any of these factors could cause the price of our common stock to fluctuate. Factors that could contribute to the variability of our operating results include:
| • | the amount of defaulted student loans and other receivables that our clients place with us for recovery; |
| • | the timing of placements of student loans and other receivables which are entirely in the discretion of our clients; |
| • | our ability to successfully identify improper Medicare claims and the number and type of potentially improper claims that CMS authorizes us to pursue under our RAC contract; |
| • | the loss or gain of significant clients or changes in the contingency fee rates or other significant terms of our business arrangements with our significant clients; |
| • | technological and operational issues that may affect our clients and regulatory changes in the markets we service; and |
| • | general industry and macroeconomic conditions. |
For example, a technology system upgrade at the Department of Education caused fluctuations in our operating results. This upgrade significantly decreased the volume of student loan placements by the Department of Education to all recovery vendors, including us, during 2011 and through September 30, 2012. While we and the other recovery vendors received substantially larger placement volume in the fourth quarter of 2012 as a result of the completion of this technology system upgrade, the majority of the revenues from these placements will be delayed until the third quarter of 2013 because we do not begin to earn rehabilitation revenues from a given placement until at least nine months after receipt of a placement. In addition, for approximately twelve
15
Table of Contents
months beginning in September 2011, this technology system upgrade prevented the Department of Education from processing a portion of rehabilitated student loans and accordingly we were not able to recognize certain revenues associated with rehabilitation of loans for this client. However, the Department of Education continued to pay us based on invoices submitted and we recorded these cash receipts as deferred revenues on our balance sheet.
Further, our claim recovery volume is currently impacted by a system adjustment that is being implemented by CMS for its Periodic Interim Payment, or PIP, providers. PIP providers are reimbursed for Medicare claims through different processes than other healthcare providers, and CMS is in the process of making certain system adjustments in order to allow these claims to be processed. Prior to April 2012, we were not permitted to audit Medicare claims for these PIP providers, which we estimate to account for approximately 20% of Medicare claims in our region. The improper payments to PIP providers that we have identified were not processed by CMS from April 2012 until January 2013, when a small portion of such payments began to be processed manually. As a result, we will not recognize any revenues from identified improper payments to PIP providers as of December 31, 2012, but we have incurred expenses related to these claims. We estimate that this delayed our recognition of approximately $6 million in revenues in 2012, although we began to recognize a portion of these revenues as a result of the manual claims processing that began in the first quarter of 2013. CMS remains in the process of implementing the necessary changes to its systems that would allow these claims to be processed automatically and allow us to recognize the significant majority of these revenues. It is expected that the necessary upgrade will be completed in the second quarter of 2013, although this is outside of our control and the failure of CMS to process these and future claims on a timely basis will delay our recognition of the related revenues. Because our revenues are dependent on many factors, some of which are outside of our control, we may experience significant fluctuations in our results of operations and as a result volatility in our stock price.
Downturns in domestic or global economic conditions and other macroeconomic factors could harm our business and results of operations.
Various macroeconomic factors influence our business and results of operations. These include the volume of student loan originations in the United States, together with tuition costs and student enrollment rates, the default rate of student loan borrowers, which is impacted by domestic and global economic conditions, rates of unemployment and similar factors, and the growth in Medicare expenditures resulting from changes in healthcare costs. For example, during the global financial crisis beginning in 2008, the market for securitized student loan portfolios was disrupted, resulting in delays in the ability of some GA clients to resell rehabilitated student loans and, as a result, delayed our ability to recognize revenues from these rehabilitated loans. Changes in these factors could lead to a reduction in overall recovery rates by our clients, which in turn could adversely affect our business, financial condition and results of operations.
We may not be able to maintain or increase our profitability, and our recent financial results may not be indicative of our future financial results.
We may not succeed in maintaining our profitability on a quarterly or annual basis and could incur quarterly or annual losses in future periods. We have incurred additional operating expenses associated with being a public company and we intend to continue to increase our operating expenses as we grow our business. We also expect to continue to make investments in our proprietary technology platform and hire additional employees and subcontractors as we expand our healthcare recovery and other operations, thus incurring additional expenses. If our revenues do not increase to offset these increases in expenses, our operating results could be adversely affected. Our historical revenues and net income growth rates are not indicative of future growth rates.
16
Table of Contents
We may not be able to manage our growth effectively and our results of operations could be negatively affected.
Our business has expanded significantly, especially in recent years with the expansion of our services in the healthcare market, and we intend to maintain our focus on growth. However, our continued focus on growth and the expansion of our business may place additional demands on our management, operations and financial resources and will require us to incur additional expenses. We cannot be sure that we will be able to manage our growth effectively. In order to successfully manage our growth, our expenses will increase to recruit, train and manage additional qualified employees and subcontractors and to expand and enhance our administrative infrastructure and continue to improve our management, financial and information systems and controls. If we cannot manage our growth effectively, our expenses may increase and our results of operations could be negatively affected.
A failure of our operating systems or technology infrastructure, or those of our third-party vendors and subcontractors, could disrupt the operation of our business.
A failure of our operating systems or technology infrastructure, or those of our third-party vendors and subcontractors, could disrupt our operations. Our operating systems and technology infrastructure are susceptible to damage or interruption from various causes, including acts of God and other natural disasters, power losses, computer systems failures, Internet and telecommunications or data network failures, operator error, computer viruses, losses of and corruption of data and similar events. The occurrence of any of these events could result in interruptions, delays or cessations in service to our clients, reduce the attractiveness of our recovery services to current or potential clients and adversely impact our financial condition and results of operations. While we have backup systems in many of our operating facilities, an extended outage of utility or network services may harm our ability to operate our business. Further, the situations we plan for and the amount of insurance coverage we maintain for losses as result of failures of our operating systems and infrastructure may not be adequate in any particular case.
If our security measures are breached or fail and unauthorized access is obtained to our clients’ confidential data, our services may be perceived as insecure, the attractiveness of our recovery services to current or potential clients may be reduced, and we may incur significant liabilities.
Our recovery services involve the storage and transmission of confidential information relating to our clients and their customers, including health, financial, credit, payment and other personal or confidential information. Although our data security procedures are designed to protect against unauthorized access to confidential information, our computer systems, software and networks may be vulnerable to unauthorized access and disclosure of our clients’ confidential information. Further, we may not effectively adapt our security measures to evolving security risks, address the security and privacy concerns of existing or potential clients as they change over time, or be compliant with federal, state, and local laws and regulations with respect to securing confidential information. Unauthorized access to confidential information relating to our clients and their customers could lead to reputational damage which could deter our clients and potential clients from selecting our recovery services, or result in termination of contracts with those clients affected by any such breach, regulatory action, and claims against us.
In the event of any unauthorized access to personal or other confidential information, we may be required to expend significant resources to investigate and remediate vulnerabilities in our security procedures, and we may be subject to fines, penalties, litigation costs, and financial losses that are either not insured against or not fully covered through any insurance maintained by us. If one or more of such failures in our security and privacy measures were to occur, our business, financial condition and results of operations could suffer.
17
Table of Contents
Our business may be harmed if we lose members of our management team or other key employees.
We are highly dependent on members of our management team and other key employees and our future success depends in part on our ability to retain these people. Our inability to continue to attract and retain members of our management team and other key employees could adversely affect our business, financial condition and results of operations.
The growth of our healthcare business will require us to hire and retain employees with specialized skills and failure to do so could harm our ability to grow our business.
The growth of our healthcare business will depend in part on our ability to recruit, train and manage additional qualified employees. Our healthcare-related operations require us to hire registered nurses and experts in Medicare coding. Finding, attracting and retaining employees with these skills is a critical component of providing our healthcare-related recovery and audit services, and our inability to staff these operations appropriately represents a risk to our healthcare service offering and associated revenues. An inability to hire qualified personnel, particularly to serve our healthcare clients, may restrain the growth of our business.
We rely on subcontractors to provide services to our clients and the failure of subcontractors to perform as expected could harm our business operations and our relationships with our clients.
We engage subcontractors to provide certain services to our clients. These subcontractors participate to varying degrees in our recovery activities with regards to all of the services we provide. While most of our subcontractors provide specific services to us, we engage one subcontractor to provide all of the audit and recovery services under our contract with CMS within a portion of our region. According to CMS, the geographic area allocated to this subcontractor accounted for approximately 17% of total Medicare spending in our region in 2009. While we believe that we perform appropriate due diligence before we hire subcontractors, our subcontractors may not provide adequate service or otherwise comply with the terms set forth in their agreements. In the event a subcontractor provides deficient performance to one or more of our clients, any such client may reduce the volume of services we are providing under an existing contract or may terminate the relevant contract entirely and we may face claims for breach of contract. Any such disruption in our relations with our clients as a result of services provided by any of our subcontractors could adversely affect our revenues and operating results.
If our software vendors or utility and network providers fail to deliver or perform as expected our business operations could be adversely affected.
Our recovery services depend in part on third-party providers, including software vendors and utility and network providers. Our ability to service our clients depends on these third-party providers meeting our expectations and contractual obligations in a timely and effective manner. Our business could be materially and adversely affected, and we might incur significant additional liabilities, if the services provided by these third-party providers do not meet our expectations or if they terminate or refuse to renew their relationships with us on similar contractual terms.
We are subject to extensive regulations regarding the use and disclosure of confidential personal information and failure to comply with these regulations could cause us to incur liabilities and expenses.
We are subject to a wide array of federal and state laws and regulations regarding the use and disclosure of confidential personal information and security. For example, the federal Health Insurance Portability and Accountability Act of 1996, as amended, or HIPAA, and related state laws subject us to substantial restrictions and requirements with respect to the use and disclosure of the personal health information that we obtain in connection with our audit and recovery services under our contract with CMS and we must establish administrative, physical and technical safeguards to protect the confidentiality of this information. Similar
18
Table of Contents
protections extend to the type of personal financial and other information we acquire from our student loan, state tax and federal receivables clients. We are required to notify affected individuals and government agencies of data security breaches involving protected health and certain personally identifiable information. These laws and regulations also require that we develop, implement and maintain written, comprehensive information security programs containing safeguards that are appropriate to protect personally identifiable information or health information against unauthorized access, misuse, destruction or modification. Federal law generally does not preempt state law in the area of protection of personal information, and as a result we must also comply with state laws and regulations. Regulation of privacy, data use and security requires that we incur significant expenses, which could increase in the future as a result of additional regulations, all of which adversely affects our results of operations. Failure to comply with these laws and regulations can result in penalties and in some cases expose us to civil lawsuits.
Our student loan recovery business is subject to extensive regulation and consumer protection laws and our failure to comply with these regulations and laws may subject us to liability and result in significant costs.
Our student loan recovery business is subject to regulation and oversight by various state and federal agencies, particularly in the area of consumer protection. The Fair Debt Collection Practices Act, or FDCPA, and related state laws provide specific guidelines that we must follow in communicating with holders of student loans and regulates the manner in which we can recover defaulted student loans. Some state attorney generals have been active in this area of consumer protection regulation. We are subject, and may be subject in the future, to inquiries and audits from state and federal regulators, as well as frequent litigation from private plaintiffs regarding compliance under the FDCPA and related state regulations. We are also subject to the Fair Credit Reporting Act, or FCRA, which regulates consumer credit reporting and may impose liability on us to the extent adverse credit information reported to a credit bureau is false or inaccurate. Our compliance with the FDCPA, FCRA and other federal and state regulations that affect our student loan recovery business may result in significant costs, including litigation costs. We may also become subject to regulations promulgated by the United States Consumer Financial Protection Bureau, or CFPB, which was established in July 2011 as part of the Dodd-Frank Act to, among other things, establish regulations regarding consumer financial protection laws. Changes to existing regulations or the adoption of new regulations could adversely affect our business and results of operations if we are not able to adapt our services and client relationships to meet the new regulatory structure.
The requirements of being a public company may strain our resources, divert management’s attention and affect our ability to attract and retain executive management and qualified board members.
As a public company, we are subject to the reporting requirements of the Securities Exchange Act of 1934, or the Exchange Act, the Sarbanes-Oxley Act of 2002, or the Sarbanes-Oxley Act, the Dodd-Frank Act and other applicable securities rules and regulations. Compliance with these rules and regulations has increased our legal and financial compliance costs, made some activities more difficult, time-consuming or costly and increased or will continue to increase demand on our systems and resources, particularly after we are no longer an “emerging growth company.” The Exchange Act requires, among other things, that we file annual, quarterly and current reports with respect to our business and operating results. The Sarbanes-Oxley Act requires, among other things, that we maintain effective disclosure controls and procedures and internal control over financial reporting. In order to maintain and, if required, improve our disclosure controls and procedures and internal control over financial reporting to meet this standard, significant resources and management oversight may be required. As a result, management’s attention may be diverted from other business concerns, which could adversely affect our business and operating results. Although we have already hired additional employees to comply with these requirements, we may need to hire more employees in the future or engage outside consultants, which will increase our costs and expenses.
In addition, changing laws, regulations and standards relating to corporate governance and public disclosure are creating uncertainty for public companies, increasing legal and financial compliance costs and making some activities more time consuming. These laws, regulations and standards are subject to varying interpretations, in many cases due to their lack of specificity, and, as a result, their application in practice may
19
Table of Contents
evolve over time as new guidance is provided by regulatory and governing bodies. This could result in continuing uncertainty regarding compliance matters and higher costs necessitated by ongoing revisions to disclosure and governance practices. We will continue to invest resources to comply with evolving laws, regulations and standards, and this investment may result in increased general and administrative expenses and a diversion of management’s time and attention from revenue-generating activities to compliance activities. If our efforts to comply with new laws, regulations and standards differ from the activities intended by regulatory or governing bodies due to ambiguities related to their application and practice, regulatory authorities may initiate legal proceedings against us and our business may be adversely affected.
However, for as long as we remain an “emerging growth company” as defined in the Jumpstart Our Business Startups Act of 2012, or the JOBS Act, we may take advantage of certain exemptions from various reporting requirements that are applicable to other public companies that are not “emerging growth companies,” including, but not limited to, not being required to comply with the auditor attestation requirements of Section 404 of the Sarbanes-Oxley Act, reduced disclosure obligations regarding executive compensation in our periodic reports and proxy statements, and exemptions from the requirements of holding a nonbinding advisory vote on executive compensation and shareholder approval of any golden parachute payments not previously approved. We may take advantage of these reporting exemptions until we are no longer an “emerging growth company.”
We will remain an “emerging growth company” for up to five years following our initial public offering in August 2012, although if the market value of our common stock that is held by non-affiliates exceeds $700 million as of any June 30 before that time, our revenues exceed $1 billion, or we issue more than $1 billion in non-convertible debt in a three-year period, we would cease to be an “emerging growth company” as of the following December 31.
As a result of disclosure of information as a public company, our business and financial condition have become more visible, which we believe may result in threatened or actual litigation, including by competitors and other third parties. If such claims are successful, our business operations and financial results could be adversely affected, and even if the claims do not result in litigation or are resolved in our favor, these claims, and the time and resources necessary to resolve them, could divert the resources of our management and adversely affect our business operations and financial results. These factors could also make it more difficult for us to attract and retain qualified employees, executive officers and members of our board of directors.
Failure to achieve and maintain effective internal controls in accordance with Section 404 of Sarbanes-Oxley would impair our ability to produce accurate and reliable financial statements, which would harm our stock price.
We are subject to reporting obligations under Section 404 of the Sarbanes-Oxley Act that require us to include a management report on our internal control over financial reporting in our annual report, which contains management’s assessment of the effectiveness of our internal control over financial reporting. These requirements will first apply to our annual report on Form 10-K for the year ending December 31, 2013 and complying with these requirements can be difficult. For example, in June 2012, our independent registered public accounting firm determined that we had incorrectly accounted for our mandatorily redeemable preferred stock, which required audit adjusting entries for the three-year period ended December 31, 2011. Our failure to detect this error was deemed to be a deficiency in internal control and this deficiency was considered to be a material weakness. To address this situation, our independent registered public accounting firm recommended that the Company emphasize the importance of thoroughly researching all new accounting policies and revisiting accounting policies set for existing transactions when changes in the business or reporting requirements occur or are expected to occur. To prevent issues like these in the future, we have bolstered our technical accounting expertise and, where appropriate, engaged outside consultants with specialized knowledge.
Our management may conclude that our internal control over our financial reporting is not effective. As we only recently became a public company following the completion of our initial public offering on
20
Table of Contents
August 15, 2012, we have limited accounting personnel and other resources with which to address our internal controls and procedures. If we fail to timely achieve and maintain the adequacy of our internal control over financial reporting, we may not be able to produce reliable financial reports or help prevent fraud. Our failure to achieve and maintain effective internal control over financial reporting could prevent us from filing our periodic reports on a timely basis, which could result in the loss of investor confidence in the reliability of our financial statements, harm our business and negatively impact the trading price of our common stock.
We are required to disclose changes made in our internal controls and procedures on a quarterly basis. However, our independent registered public accounting firm is not required to formally attest to the effectiveness of our internal control over financial reporting pursuant to Section 404 until the later of the year following our first annual report required to be filed with the SEC, or the date we are no longer an “emerging growth company” as defined in the JOBS Act, if we continue to take advantage of the exemptions contained in the JOBS Act. At such time, our independent registered public accounting firm may issue a report that is adverse in the event it is not satisfied with the level at which our controls are documented, designed or operating. Our remediation efforts may not enable us to avoid a material weakness in the future.
Litigation may result in substantial costs of defense, damages or settlement, any of which could subject us to significant costs and expenses.
We are party to lawsuits in the normal course of business, particularly in connection with our student loan recovery services. For example, we are regularly subject to claims that we have violated the guidelines and procedures that must be followed under federal and state laws in communicating with consumer debtors. We may not ultimately prevail or otherwise be able to satisfactorily resolve any pending or future litigation, which may result in substantial costs of defense, damages or settlement. In the future, we may be required to alter our business practices or pay substantial damages or settlement costs as a result of litigation proceedings, which could adversely affect our business operations and results of operations.
We typically face a long period to implement a new contract which may cause us to incur expenses before we receive revenues from new client relationships.
If we are successful in obtaining an engagement with a new client or a new contract with an existing client, we typically have a subsequent long implementation period in which the services are planned in detail and we integrate our technology, processes and resources with the client’s operations. If we enter into a contract with a new client, we typically will not receive revenues until implementation is completed and work under the contract actually begins. Our clients may also experience delays in obtaining approvals or delays associated with technology or system implementations, such as the delays experienced with the implementation of our RAC contract with CMS due to an appeal by competitors who were unsuccessful in bidding on the contract. Because we generally begin to hire new employees to provide services to a new client once a contract is signed, we may incur significant expenses associated with these additional hires before we receive corresponding revenues under any such new contract. If we are not successful in maintaining contractual commitments after the expenses we incur during our typically long implementation cycle, our results of operations could be adversely affected.
If we are unable to adequately protect our proprietary technology, our competitive position could be harmed or we could be required to incur significant costs to enforce our rights.
The success of our business depends in part upon our proprietary technology platform. We rely on a combination of copyright, patent, trademark, and trade secret laws, as well as on confidentiality procedures and non-compete agreements, to establish and protect our proprietary technology rights. The steps we have taken to deter misappropriation of our proprietary technology may be insufficient to protect our proprietary information. Any infringement or misappropriation of our patents, trademarks, trade secrets, or other intellectual property rights could adversely affect any competitive advantage we currently derive or may derive from our proprietary technology platform and we may incur significant costs associated with litigation that may be necessary to enforce our intellectual property rights.
21
Table of Contents
Claims by others that we infringe their intellectual property could force us to incur significant costs or revise the way we conduct our business.
Our competitors protect their proprietary rights by means of patents, trade secrets, copyrights, trademarks and other intellectual property. Any party asserting that we infringe, misappropriate or violate their intellectual property rights may force us to defend ourselves, and potentially our clients, against the alleged claim. These claims and any resulting lawsuit, if successful, could be time-consuming and expensive to defend, subject us to significant liability for damages or invalidation of our proprietary rights, prevent us from operating all or a portion of our business or force us to redesign our services or technology platform or cause an interruption or cessation of our business operations, any of which could adversely affect our business and operating results. In addition, any litigation relating to the infringement of intellectual property rights could harm our relationships with current and prospective clients. The risk of such claims and lawsuits could increase if we increase the size and scope of our services in our existing markets or expand into new markets.
We may make acquisitions that prove unsuccessful, strain or divert our resources and harm our results of operations and stock price.
We may consider acquisitions of other companies in our industry or in new markets. We may not be able to successfully complete any such acquisition and, if completed, any such acquisition may fail to achieve the intended financial results. We may not be able to successfully integrate any acquired businesses with our own and we may be unable to maintain our standards, controls and policies. Further, acquisitions may place additional constraints on our resources by diverting the attention of our management from other business concerns. Moreover, any acquisition may result in a potentially dilutive issuance of equity securities, the incurrence of additional debt and amortization of expenses related to intangible assets, all of which could adversely affect our results of operations and stock price.
Our current or future indebtedness could adversely affect our business and financial condition and reduce the funds available to us for other purposes, and our failure to comply with the covenants contained in our credit agreement could result in an event of default that could adversely affect our results of operations.
As of December 31, 2012, our total debt was $147.8 million. For the year ended December 31, 2012, our consolidated interest expense was $12.4 million. Our ability to make scheduled payments or to refinance our debt obligations and to fund our other liquidity needs depends on our financial and operating performance, which is subject to prevailing economic and competitive conditions and to certain financial, business and other factors beyond our control. We cannot make assurances that we will maintain a level of cash flows from operating activities sufficient to permit us to pay the principal and interest on our indebtedness and to fund our other liquidity needs. If our cash flows and capital resources are insufficient to fund our debt service obligations and allow us to maintain compliance with the covenants under our credit agreement or to fund our other liquidity needs, we may be forced to reduce or delay capital expenditures, sell assets or operations, seek additional capital or restructure or refinance our indebtedness. We cannot ensure that we would be able to take any of these actions, that these actions would be successful and permit us to meet our scheduled debt service obligations or that these actions would be permitted under the terms of our existing or future debt agreements, including our credit agreement. If we cannot make scheduled payments on our debt, we will be in default and, as a result, our debt holders could declare all outstanding principal and interest to be due and payable, the lenders under our credit agreement could terminate their commitments to lend us money and foreclose against the assets securing our borrowings and we could be forced into bankruptcy or liquidation.
Our debt agreements contain, and any agreements to refinance our debt likely will contain, financial and restrictive covenants that limit our ability to incur additional debt, including to finance future operations or other capital needs, and to engage in other activities that we may believe are in our long-term best interests, including to dispose of or acquire assets. Our failure to comply with these covenants may result in an event of default,
22
Table of Contents
which, if not cured or waived, could accelerate the maturity of our indebtedness or result in modifications to our credit terms. If our indebtedness is accelerated, we may not have sufficient cash resources to satisfy our debt obligations and we may not be able to continue our operations as planned.
If securities analysts do not publish research or if securities analysts or other third parties publish inaccurate or unfavorable research about us, the price of our common stock could decline.
The trading market for our common stock relies in part on the research and reports that securities analysts and other third parties choose to publish about us. We do not control whether these analysts or other third parties provide research regarding our company. The price of our common stock could decline if one or more securities analysts downgrade our common stock or if one or more securities analysts or other third parties publish inaccurate or unfavorable research about us or cease publishing reports about us.
Risks Related to This Offering and Our Common Stock
We are subject to certain phase-in provisions of the NASDAQ Marketplace Rules and, as a result, we will not immediately be subject to certain corporate governance provisions. As a result, you do not have the same protections afforded to stockholders of companies that are subject to such requirements.
Because of our public offering in February 2013, Parthenon Capital Partners no longer controls a majority of our common stock. As a result, we ceased to be a “controlled company” within the meaning of the corporate governance standards of the NASDAQ Global Select Market, or NASDAQ. However, we currently rely on phase-in provisions under the NASDAQ rules that exempt us until February 5, 2014 from certain stock exchange corporate governance requirements, including:
| • | the requirement that a majority of the board of directors consists of independent directors; |
| • | the requirement that nominating and corporate governance matters be decided solely by independent directors; and |
| • | the requirement that employee and officer compensation matters be decided solely by independent directors. |
As a result, we currently do not have a majority of independent directors and our nominating and corporate governance and compensation functions are not decided solely by independent directors. Accordingly, you do not have the same protections afforded to stockholders of companies that are subject to all of the stock exchange corporate governance requirements.
The price of our common stock could be volatile, and you may not be able to sell your shares at or above the public offering price.
Since our initial public offering in August 2012, the price of our common stock, as reported by NASDAQ, has ranged from a low sales price of $7.55 on November 27, 2012 to a high sales price of $14.09 on March 4, 2013. The trading price of our common stock may be significantly affected by various factors, including: quarterly fluctuations in our operating results; the financial projections we may provide to the public, any changes in those projections or our failure to meet those projections; changes in investors’ and analysts’ perception of the business risks and conditions of our business; our ability to meet the earnings estimates and other performance expectations of financial analysts or investors; unfavorable commentary or downgrades of our stock by equity research analysts; termination of lock-up agreements or other restrictions on the ability of our existing stockholders to sell their shares after this offering or our public offering in February 2013; changes in our capital structure, such as future issuances of debt or equity securities; lawsuits threatened or filed against us; strategic actions by us or our competitors, such as acquisitions or restructurings; new legislation or regulatory actions; changes in our relationship with any of our significant clients; fluctuations in the stock prices of our peer companies or in stock markets in general; and general economic conditions.
23
Table of Contents
Future sales, or the perception of future sales, of our common stock may lower our stock price.
If our existing stockholders sell a large number of shares of our common stock following this offering, the market price of our common stock could decline significantly. In addition, the perception in the public market that our existing stockholders might sell shares of common stock could depress the market price of our common stock, regardless of the actual plans of our existing stockholders. Upon the completion of this offering, a total of 45,392,224 shares of common stock will be outstanding, assuming that there are no exercises of options after December 31, 2012. Of these shares, shares will be eligible for sale beginning May 2, 2013 following the expiration of the lock-up agreement from our public offering in February 2013, and shares are subject to lock-up agreements restricting the sale of those shares for 60 days from the date of this prospectus. The underwriters may waive the lock-up restriction and allow any of the stockholders subject to this restriction to sell their shares at any time. See “Shares Eligible for Future Sale.”
Our significant stockholder is the principal selling stockholder in this offering and will receive substantial benefits from its sale of shares in this offering
Our significant stockholder, Parthenon Capital Partners, is offering shares of our common stock in this offering (or shares of our common stock if the underwriters exercise their over-allotment option in full) and accordingly Parthenon Capital Partners will receive gross proceeds before underwriting discounts and commissions of approximately $ million (or gross proceeds of approximately $ million if the underwriters exercise their over-allotment option in full). The interests of Parthenon Capital Partners, which will beneficially own approximately % of our outstanding common stock after the offering (assuming no exercise of the underwriters’ over-allotment option), may not be consistent with our interests or the interests of our other stockholders.
Our significant stockholder has the ability to influence significant corporate activities and our significant stockholder’s interests may not coincide with yours.
Parthenon Capital Partners beneficially owned approximately 48.6% of our common stock as of March 31, 2013. As a result of its ownership, Parthenon Capital Partners has the ability to influence the outcome of matters submitted to a vote of stockholders and, through our board of directors, the ability to influence decision-making with respect to our business direction and policies. Parthenon Capital Partners may have interests different from our other stockholders’ interests, and may vote in a manner adverse to those interests. Matters over which Parthenon Capital Partners can, directly or indirectly, exercise influence include:
| • | the election of our board of directors and the appointment and removal of our officers; |
| • | mergers and other business combination transactions, including proposed transactions that would result in our stockholders receiving a premium price for their shares; |
| • | other acquisitions or dispositions of businesses or assets; |
| • | incurrence of indebtedness and the issuance of equity securities; |
| • | repurchase of stock and payment of dividends; and |
| • | the issuance of shares to management under our equity incentive plans. |
In addition, Parthenon Capital Partners has a contractual right to designate a number of directors proportionate to its stock ownership. Further, under our amended and restated certificate of incorporation, Parthenon Capital Partners does not have any obligation to present to us, and Parthenon Capital Partners may separately pursue, corporate opportunities of which it becomes aware, even if those opportunities are ones that we would have pursued if granted the opportunity.
24
Table of Contents
Anti-takeover provisions contained in our certificate of incorporation and bylaws could impair a takeover attempt that our stockholders may find beneficial.
Our amended and restated certificate of incorporation and amended and restated bylaws contain provisions that could have the effect of rendering more difficult or discouraging an acquisition deemed undesirable by our board of directors. Our corporate governance documents include the following provisions: establishing a classified board of directors so that not all members of our board are elected at one time; providing that directors may be removed by stockholders only for cause; authorizing blank check preferred stock, which could be issued with voting, liquidation, dividend and other rights superior to our common stock; limiting the ability of our stockholders to call and bring business before special meetings and to take action by written consent in lieu of a meeting; limiting our ability to engage in certain business combinations with any “interested stockholder,” other than Parthenon Capital Partners, for a three-year period following the time that the stockholder became an interested stockholder; requiring advance notice of stockholder proposals for business to be conducted at meetings of our stockholders and for nominations of candidates for election to our board of directors; requiring a super majority vote for certain amendments to our amended and restated certificate of incorporation and amended and restated bylaws; and limiting the determination of the number of directors on our board of directors and the filling of vacancies or newly created seats on the board to our board of directors then in office. These provisions, alone or together, could have the effect of delaying or deterring a change in control, could limit the opportunity for our stockholders to receive a premium for their shares of our common stock, and could also affect the price that some investors are willing to pay for our common stock.
Because we do not intend to pay cash dividends in the foreseeable future, you may not receive any return on investment unless you are able to sell your common stock for a price greater than your purchase price.
For the foreseeable future, we intend to retain any earnings to finance the development and expansion of our business, and we do not anticipate paying any cash dividends on our common stock. In addition, our ability to pay dividends is subject to restrictive covenants contained in our credit agreement. As a result, you may not receive any return on investment unless you are able to sell your common stock for a price greater than your purchase price.
25
Table of Contents
INFORMATION REGARDING FORWARD-LOOKING STATEMENTS
This prospectus includes forward-looking statements. All statements other than statements of historical fact contained in this prospectus, including statements regarding our future results of operations and financial position, strategy and plans, and our expectations for future operations, are forward-looking statements. The words “believe,” “may,” “will,” “estimate,” “continue,” “anticipate,” “design,” “intend,” “expect” and similar expressions are intended to identify forward-looking statements. We have based these forward-looking statements largely on our current expectations and projections about future events and trends that we believe may affect our financial condition, results of operations, strategy, short-term and long-term business operations and objectives, and financial needs. These forward-looking statements are subject to a number of risks, uncertainties and assumptions, including those described in “Risk Factors.” In light of these risks, uncertainties and assumptions, the forward-looking events and circumstances discussed in this prospectus may not occur, and actual results could differ materially and adversely from those anticipated or implied in the forward-looking statements. Forward-looking statements include, but are not limited to, statements about:
| • | our expected financial results and operating metrics for the three months ended March 31, 2013; |
| • | our opportunities and expectations for growth in the student lending, healthcare and other markets; |
| • | anticipated trends and challenges in our business and competition in the markets in which we operate; |
| • | our client relationships and future growth opportunities; |
| • | the adaptability of our technology platform to new markets and processes; |
| • | our ability to invest in and utilize our data and analytics capabilities to expand our capabilities; |
| • | our belief that we benefit from a significant degree of revenue visibility; |
| • | our growth strategy of expanding in our existing markets and considering strategic alliances or acquisitions; |
| • | our ability to meet our liquidity and working capital needs; |
| • | maintaining, protecting and enhancing our intellectual property; |
| • | our expectations regarding future expenses; |
| • | expected future financial performance; and |
| • | our ability to comply with and adapt to industry regulations and compliance demands. |
Although we believe that the expectations reflected in the forward-looking statements are reasonable, we cannot guarantee future results, level of activity, performance or achievements. In addition, neither we nor any other person assumes responsibility for the accuracy and completeness of any of these forward-looking statements. We disclaim any duty to update any of these forward-looking statements after the date of this prospectus to conform these statements to actual results or revised expectations.
You should rely only on the information contained in this prospectus and any free writing prospectus we may specifically authorize to be delivered or made available to you. We have not, and the selling stockholders and the underwriters have not, authorized anyone to provide you with additional or different information. The information contained in this prospectus or any free writing prospectus is accurate only as of its date, regardless of its time of delivery or of any sale of shares of our common stock. Our business, financial condition, results of operations and prospects may have changed since that date.
26
Table of Contents
This prospectus also contains statistical data and estimates, including those relating to market size and growth rates of the markets in which we participate, that we obtained from government and industry publications. These publications typically indicate that they have obtained their information from sources they believe to be reliable, but do not guarantee the accuracy and completeness of their information. Although we have assessed the information in the publications and found it to be reasonable and believe the publications are reliable, we have not independently verified their data.
27
Table of Contents
We will not receive any of the proceeds from the sale of shares by the selling stockholders in this offering. See “Principal and Selling Stockholders.”
MARKET PRICE OF OUR COMMON STOCK
Our common stock began trading on the NASDAQ Global Select Market under the symbol “PFMT” on August 10, 2012. Prior to that, there was no public market for our common stock. The table sets forth, for the periods indicated below, the high and low sales prices per share of our common stock as reported by NASDAQ since August 10, 2012.
| 2012 |
High | Low | ||||||
| Third Quarter (beginning August 10, 2012) |
12.18 | 9.20 | ||||||
| Fourth Quarter |
11.84 | 7.55 | ||||||
| 2013 |
High | Low | ||||||
| First Quarter |
14.09 | 10.02 | ||||||
| Second Quarter (through April 9, 2013) |
13.16 | 11.95 | ||||||
On April 9, 2013, the closing price as reported by NASDAQ of our common stock was $12.89 per share. As of April 9, 2013, we had approximately 27 holders of record of our common stock.
Our board of directors does not currently intend to pay regular dividends on our common stock. However, we expect to reevaluate our dividend policy on a regular basis following this offering and may, subject to compliance with the covenants in our credit agreement and other considerations, determine to pay dividends in the future. Our ability to pay dividends is subject to restrictive covenants contained in our credit agreement.
28
Table of Contents
The following table sets forth our cash and cash equivalents and capitalization as of December 31, 2012. You should read the information in this table together with the sections titled “Use of Proceeds,” “Selected Consolidated Financial Data” and “Management’s Discussion and Analysis of Financial Condition and Results of Operations” and our consolidated financial statements and related notes included elsewhere in this prospectus.
| As of December 31, 2012 |
||||
| (in thousands, except share data) |
||||
| Cash and cash equivalents |
$ | 37,843 | ||
|
|
|
|||
| Debt: |
||||
| Revolving credit facility |
$ | — | ||
| Term A loan |
49,463 | |||
| Term B loan |
98,306 | |||
|
|
|
|||
| Total debt |
147,769 | |||
|
|
|
|||
| Stockholders’ equity (deficit): |
||||
| Common stock, $.0001 par value, 500,000,000 shares authorized, 45,392,224 shares issued and outstanding |
4 | |||
| Preferred stock, $.0001 par value, 50,000,000 shares authorized, no shares issued and outstanding |
— | |||
| Additional paid-in capital |
35,970 | |||
| Accumulated deficit |
(11,901) | |||
|
|
|
|||
| Total stockholders’ equity |
24,073 | |||
|
|
|
|||
| Total capitalization |
$ | 171,842 | ||
|
|
|
|||
The number of shares of common stock issued and outstanding in the table above excludes:
| • | 7,909,724 shares of common stock issuable upon the exercise of options outstanding as of December 31, 2012, at a weighted-average exercise price of approximately $3.85 per share; and |
| • | 1,864,636 shares of common stock reserved for future issuance under our 2012 Stock Incentive Plan. |
29
Table of Contents
SELECTED CONSOLIDATED FINANCIAL DATA
We derived the selected consolidated statement of operations data for 2012, 2011 and 2010 and the consolidated balance sheet data as of December 31, 2012 and 2011 from our audited consolidated financial statements included elsewhere in this prospectus. We have derived the selected consolidated statement of operations data for the years ended December 31, 2009 and 2008 and the consolidated balance sheet data as of December 31, 2010, 2009 and 2008 from our audited consolidated financial statements not included elsewhere in this prospectus. Historical results are not necessarily indicative of future results. You should read the following selected consolidated historical financial data below in conjunction with the section titled “Management’s Discussion and Analysis of Financial Condition and Results of Operations” and the consolidated financial statements, related notes, and other financial information included in this prospectus. The selected consolidated financial data in this section is not intended to replace the consolidated financial statements and is qualified in its entirety by the consolidated financial statements and related notes and schedule included in this prospectus.
| Year Ended December 31, |
||||||||||||||||||||
| 2012 | 2011 | 2010 | 2009 | 2008 | ||||||||||||||||
| (in thousands) | ||||||||||||||||||||
| Consolidated Statement of Operations Data: |
|
|||||||||||||||||||
| Revenues |
$ | 210,073 | $ | 162,974 | $ | 123,519 | $ | 109,832 | $ | 98,967 | ||||||||||
| Operating expenses: |
||||||||||||||||||||
| Salaries and benefits |
83,002 | 67,082 | 58,113 | 53,728 | 49,109 | |||||||||||||||
| Other operating expense |
71,305 | 49,199 | 33,655 | 32,110 | 26,730 | |||||||||||||||
| Impairment of trade name |
— | 13,400 | — | — | — | |||||||||||||||
|
|
|
|
|
|
|
|
|
|
|
|||||||||||
| Total operating expenses |
154,307 | 129,681 | 91,768 | 85,838 | 75,839 | |||||||||||||||
|
|
|
|
|
|
|
|
|
|
|
|||||||||||
| Income from operations |
55,766 | 33,293 | 31,751 | 23,994 | 23,128 | |||||||||||||||
| Debt extinguishment costs(1) |
(3,679 | ) | — | — | — | — | ||||||||||||||
| Interest expense |
(12,414 | ) | (13,530 | ) | (15,230 | ) | (16,017 | ) | (16,361 | ) | ||||||||||
| Interest income |
64 | 125 | 118 | 104 | 217 | |||||||||||||||
|
|
|
|
|
|
|
|
|
|
|
|||||||||||
| Income before provision for income taxes |
39,737 | 19,888 | 16,639 | 8,081 | 6,984 | |||||||||||||||
| Provision for income taxes |
16,786 | 7,516 | 6,664 | 3,071 | 3,113 | |||||||||||||||
|
|
|
|
|
|
|
|
|
|
|
|||||||||||
| Net income |
$ | 22,951 | $ | 12,372 | $ | 9,975 | $ | 5,010 | $ | 3,871 | ||||||||||
|
|
|
|
|
|
|
|
|
|
|
|||||||||||
| Accrual for preferred stock dividends |
2,038 | 6,495 | 5,771 | 5,128 | 4,556 | |||||||||||||||
|
|
|
|
|
|
|
|
|
|
|
|||||||||||
| Net income (loss) available to common shareholders |
$ | 20,913 | $ | 5,877 | $ | 4,204 | $ | (118 | ) | $ | (685 | ) | ||||||||
|
|
|
|
|
|
|
|
|
|
|
|||||||||||
| Net income (loss) per share attributable to common shareholders(2) |
||||||||||||||||||||
| Basic |
$ | 0.48 | $ | 0.14 | $ | 0.10 | $ | (0.00 | ) | $ | (0.02 | ) | ||||||||
|
|
|
|
|
|
|
|
|
|
|
|||||||||||
| Diluted |
$ | 0.44 | $ | 0.13 | $ | 0.09 | $ | (0.00 | ) | $ | (0.02 | ) | ||||||||
|
|
|
|
|
|
|
|
|
|
|
|||||||||||
| Weighted average shares (in thousands) |
||||||||||||||||||||
| Basic |
43,985 | 42,962 | 42,962 | 42,962 | 42,653 | |||||||||||||||
|
|
|
|
|
|
|
|
|
|
|
|||||||||||
| Diluted |
47,599 | 45,742 | 45,019 | 42,962 | 42,653 | |||||||||||||||
|
|
|
|
|
|
|
|
|
|
|
|||||||||||
| (1) | Represents debt extinguishment costs comprised of approximately $3.3 million of fees paid to lenders in connection with our new credit facility and approximately $0.3 million of unamortized debt issuance costs in connection with our old credit facility. |
30
Table of Contents
| (2) | Please see Note 1 to our consolidated financial statements for an explanation of the calculations of our basic and diluted net income per share of common stock. |
| As of December 31, | ||||||||||||||||||||
| 2012 | 2011 | 2010 | 2009 | 2008 | ||||||||||||||||
| (in thousands) | ||||||||||||||||||||
| Consolidated Balance Sheet Data: |
||||||||||||||||||||
| Cash and cash equivalents |
$ | 37,843 | $ | 20,004 | $ | 11,078 | $ | 8,924 | $ | 9,108 | ||||||||||
| Total assets |
211,745 | 182,299 | 181,390 | 180,735 | 183,783 | |||||||||||||||
| Total debt |
147,769 | 103,383 | 117,331 | 127,298 | 134,215 | |||||||||||||||
| Total liabilities |
187,672 | 139,756 | 151,231 | 161,077 | 167,617 | |||||||||||||||
| Redeemable preferred stock |
— | 58,248 | 51,753 | 45,982 | 40,854 | |||||||||||||||
| Total stockholders’ (deficit) equity |
24,073 | (15,705 | ) | (21,594 | ) | (26,324 | ) | (26,688 | ) | |||||||||||
31
Table of Contents
MANAGEMENT’S DISCUSSION AND ANALYSIS OF FINANCIAL CONDITION
AND RESULTS OF OPERATIONS
The following discussion and analysis of our financial condition and results of operations should be read in conjunction with our consolidated financial statements and related notes included elsewhere in this prospectus. This discussion contains forward-looking statements that involve risks and uncertainties. See “Information Regarding Forward-Looking Statements” included elsewhere in this prospectus. Our actual results could differ materially from those discussed below. Factors that could cause or contribute to such differences include, but are not limited to, those identified below and those discussed in the section entitled “Risk Factors” included elsewhere in this prospectus.
Overview
We provide technology-enabled recovery and related analytics services in the United States. Our services help identify and recover delinquent or defaulted assets and improper payments for both government and private clients in a broad range of markets. Our clients typically operate in complex and regulated environments and outsource their recovery needs in order to reduce losses on billions of dollars of defaulted student loans, improper healthcare payments and delinquent state tax and federal treasury and other receivables. We generally provide our services on an outsourced basis, where we handle many or all aspects of our clients’ recovery processes.
Our revenue model is generally success-based as we earn fees based on a percentage of the aggregate amount of funds that we enable our clients to recover. Our services do not require any significant upfront investments by our clients and we offer our clients the opportunity to recover significant funds otherwise lost. Because our model is based upon the success of our efforts and the dollars we enable our clients to recover, our business objectives are aligned with those of our clients and we are generally not reliant on their spending budgets. Furthermore, our business model does not require significant capital expenditures for us and we do not purchase loans or obligations.
Sources of Revenues
We derive our revenues from services for clients in a variety of different markets. These markets include our two largest markets, student lending and healthcare, as well as our other markets which include but are not limited to delinquent state taxes and federal Treasury and other receivables.
| Year Ended December 31, |
||||||||||||
| 2012 | 2011 | 2010 | ||||||||||
| (in thousands) | ||||||||||||
| Student Lending |
$ | 132,445 | $ | 122,253 | $ | 103,672 | ||||||
| Healthcare |
54,747 | 21,549 | 1,821 | |||||||||
| Other |
22,881 | 19,172 | 18,026 | |||||||||
|
|
|
|
|
|
|
|||||||
| Total Revenues |
$ | 210,073 | $ | 162,974 | $ | 123,519 | ||||||
|
|
|
|
|
|
|
|||||||
Student Lending
We derive the majority of our revenues from the recovery of student loans. These revenues are contract-based and consist primarily of contingency fees based on a specified percentage of the amount we enable our clients to recover. Our contingency fee percentage for a particular recovery depends on the type of recovery facilitated. We also receive incremental performance incentives based upon our performance as compared to other contractors with the Department of Education, which are comprised of additional inventory allocation volumes and incentive fees.
Based on data compiled from over two decades of experience with the recovery of defaulted student loans, at the time we receive a placement of student loans, we are able to make a reasonably accurate estimate of the recovery outcomes likely to be derived from such placement and the revenues we are likely able to generate based on the anticipated recovery outcomes.
32
Table of Contents
There are five potential outcomes to the student loan recovery process from which we generate revenues. These outcomes include: full repayment, recurring payments, rehabilitation, loan restructuring and wage garnishment. Of these five potential outcomes, our ability to rehabilitate defaulted student loans is the most significant component of our revenues in this market. Generally, a loan is considered successfully rehabilitated after the student loan borrower has made nine consecutive qualifying monthly payments and our client has notified us that it is recalling the loan. Once we have structured and implemented a repayment program for a defaulted borrower, we (i) earn a percentage of each periodic payment collected up to and including the final periodic payment prior to the loan being considered “rehabilitated” by our clients, and (ii) if the loan is “rehabilitated,” then we are paid a one-time percentage of the total amount of the remaining unpaid balance. The fees we are paid vary by recovery outcome as well as by contract. For non-government-supported student loans we are generally only paid contingency fees on two outcomes: full repayment or recurring repayments. The table below describes our typical fee structure for each of these five outcomes.
Student Loan Recovery Outcomes
| Full Repayment | Recurring Payments | Rehabilitation | Loan Restructuring | Wage Garnishment | ||||||||
| •Repayment in full of the loan |
•Regular structured payments, typically according to a renegotiated payment plan |
•After a defaulted borrower has made nine consecutive recurring payments, the loan is eligible for rehabilitation |
•Restructure and consolidate a number of outstanding loans into a single loan, typically with one monthly payment and an extended maturity |
•If we are unable to obtain voluntary repayment, payments may be obtained through wage garnishment after certain administrative requirements are met | ||||||||
| •We are paid a percentage of the full payment that is made |
•We are paid a percentage of each payment |
•We are paid based on a percentage of the overall value of the rehabilitated loan |
•We are paid based on a percentage of overall value of the restructured loan |
•We are paid a percentage of each payment | ||||||||
For certain GA clients, we have entered into Master Service Agreements, or MSAs. Under these agreements, clients provide their entire inventory of outsourced loans or receivables to us for recovery on an exclusive basis, rather than just a portion, as with traditional contracts that are split among various service providers. In certain circumstances, we engage subcontractors to assist in the recovery of a portion of the client’s portfolio. We also receive success fees for the recovery of loans under MSAs and our revenues under MSA arrangements include fees earned by the activities of our subcontractors. As of December 31, 2012, we had three MSA clients in the student loan market.
Healthcare
We derive revenues from the healthcare market primarily from our RAC contract, under which we are the prime contractor responsible for detecting improperly paid Part A and Part B Medicare claims in 12 states in the Northeastern United States. Revenues earned under the RAC contract are driven by the identification of improperly paid Medicare claims through both automated and manual review of such claims. We are paid contingency fees by CMS based on a percentage of the dollar amount of claims recovered by CMS as a result of our efforts. We recognize revenue when the provider pays CMS or incurs an offset against future Medicare claims. The revenues we recognize are net of our estimate of claims that will be overturned by appeal following payment by the provider.
33
Table of Contents
To accelerate our ability to provide Medicare audit and recovery services across our region following our award of the RAC contract, we outsourced certain aspects of our healthcare recovery process to three different subcontractors. Two of these subcontractors provide a specific service to us in connection with our claims recovery process, and one subcontractor is engaged to provide all of the audit and recovery services for claims within a portion of our region. According to CMS, the geographic area allocated to this subcontractor represented approximately 17% of the total Medicare spending in our region in 2009. We recognize all of the revenues generated by the claims recovered through these subcontractor relationships, and we recognize the fees that we pay to these subcontractors in our expenses.
Other
We also derive revenues from the recovery of delinquent state taxes, and federal Treasury and other receivables, default aversion services for certain clients including financial institutions and the licensing of hosted technology solutions to certain clients. For our hosted technology services, we license our system and integrate our technology into our clients’ operations, for which we are paid a licensing fee. Our revenues for these services include contingency fees, fees based on dedicated headcount to our clients and hosted technology licensing fees.
Operating Metrics
We monitor a number of operating metrics in order to evaluate our business and make decisions regarding our corporate strategy. These key metrics include Placement Volume, Placement Revenue as a Percentage of Placement Volume, Net Claim Recovery Volume and Claim Recovery Fee Rate.
| Year Ended December 31, |
||||||||||||
| 2012 | 2011 | 2010 | ||||||||||
| (dollars in thousands) | ||||||||||||
| Student Lending: |
||||||||||||
| Placement Volume |
$ | 5,768,945 | $ | 6,241,483 | $ | 5,294,971 | ||||||
| Placement Revenue as a percentage of Placement Volume |
2.30 | % | 1.96 | % | 1.96 | % | ||||||
| Healthcare: |
||||||||||||
| Net Claim Recovery Volume |
$ | 482,202 | $ | 188,573 | $ | 15,494 | ||||||
| Claim Recovery Fee Rate |
11.35 | % | 11.43 | % | 11.76 | % | ||||||
Placement Volume. Our Placement Volume represents the dollar volume of defaulted student loans first placed with us during the specified period by public and private clients for recovery. Placement Volume allows us to measure and track trends in the amount of inventory our clients in the student lending market are placing with us during any period. The revenues associated with the recovery of a portion of these loans may be recognized in subsequent accounting periods, which assists management in estimating future revenues and in allocating resources necessary to address current Placement Volumes.
Placement Revenue as a Percentage of Placement Volume. Placement Revenue as a Percentage of Placement Volume is calculated by dividing revenues recognized during the specified period by Placement Volume first placed with us during that same period. This metric is subject to some level of variation from period to period based upon certain timing differences including, but not limited to, the timing of placements received by us within a period and the fact that a significant portion of revenues recognized in a current period is often generated from the Placement Volume received in prior periods. However, we believe that this metric provides a useful indication of the revenues we are generating from Placement Volumes on an ongoing basis and provides management with an indication of the relative efficiency of our recovery operations from period to period.
Net Claim Recovery Volume. Our Net Claim Recovery Volume measures the dollar volume of improper Medicare claims that we have recovered for CMS during the applicable period net of any amount that we have reserved to cover appeals by healthcare providers. We are paid recovery fees as a percentage of this recovered
34
Table of Contents
claim volume. We calculate this metric by dividing our claim recovery revenues by our Claim Recovery Fee Rate. This metric shows trends in the volume of improper payments within our region and allows management to measure our success in finding these improper payments, over time.
Claim Recovery Fee Rate. Our Claim Recovery Fee Rate represents the weighted-average percentage of our fees compared to amounts recovered by CMS. This percentage primarily depends on the method of recovery and, in some cases, the type of improper payment that we identify. This metric helps management measure the amount of revenues we generate from Net Claim Recovery Volume.
Costs and Expenses
We generally report two categories of operating expenses: salaries and benefits and other operating expense. Salaries and benefits expenses consist primarily of salaries and performance incentives paid and benefits provided to our employees. Other operating expense includes expenses related to our use of subcontractors, other production related expenses, including costs associated with data processing, retrieval of medical records, printing and mailing services, amortization and other outside services, as well as general corporate and administrative expenses. In addition to our main components of operating expenses, in 2011 we incurred a $13.4 million impairment expense to write off the carrying amount of the trade name intangible asset due to our plan to retire our Diversified Collection Services, Inc. trade name, which we report as impairment of trade name. We expect a significant portion of our expenses to increase as we grow our business. However, we expect certain expenses, including our corporate and general administrative expenses, to grow at a slower rate than our revenues. As a result, and over the long term, we expect our overall expenses to modestly decline as a percentage of revenues.
We also expect to incur additional professional fees and other expenses resulting from future expansion and the compliance requirements of operating as a public company, including increased audit and legal expenses, investor relations expenses, increased insurance expenses, particularly for directors’ and officers’ liability insurance, and the costs of complying with Section 404 of the Sarbanes-Oxley Act. While these costs may initially increase as a percentage of our revenues, we expect that in the future these expenses will increase at a slower rate than our overall business volume, and that they will eventually represent a smaller percentage of our revenues.
Factors Affecting Our Operating Results
Our results of operations are influenced by a number of factors, including allocation of placement volume, claim recovery volume, contingency fees, regulatory matters, effects of client concentration and macroeconomic factors.
Allocation of Placement Volume
Our clients have the right to unilaterally set and increase or reduce the volume of defaulted student loans or other receivables that we service at any given time. In addition, many of our recovery contracts for student loans and other receivables are not exclusive, with our clients retaining multiple service providers to service portions of their portfolios. Accordingly, the number of delinquent student loans or other receivables that are placed with us may vary from time to time, which may have a significant effect on the amount and timing of our revenues. We believe the major factors that influence the number of placements we receive from our clients in the student loan market include our performance under our existing contracts and our ability to perform well against competitors for a particular client. To the extent that we perform well under our existing contracts and differentiate our services from those of our competitors, we may receive a relatively greater number of placements under these existing contracts and may improve our ability to obtain future contracts from these clients and other potential clients. Further, delays in placement volume, as well as acceleration of placement volume, from any of our large clients may cause our revenues and operating results to vary from quarter to quarter.
35
Table of Contents
Typically we are able to anticipate with reasonable accuracy the timing and volume of placements of defaulted student loans and other receivables based on historical patterns and regular communication with our clients. Occasionally, however, placements are delayed due to factors outside of our control. For example, a technology system upgrade at the Department of Education significantly decreased the volume of student loan placements by the Department of Education to all recovery vendors, including us. While we and the other recovery vendors have recently received substantially larger placement volume in the fourth quarter of 2012 as a result of the completion of this technology system upgrade, the majority of the revenues from these placements will be delayed until the third quarter of 2013 because we do not begin to earn rehabilitation revenues from a given placement until at least nine months after receipt of a placement. In addition, for approximately twelve months beginning in September 2011, the Department of Education was not able to process a portion of rehabilitated student loans and accordingly we were not able to recognize certain revenues associated with rehabilitation of loans for this client. However, the Department of Education continued to pay us based on invoices submitted and we recorded these cash receipts as deferred revenues on our balance sheet. The amount of placement volume that we receive is also dependent on the client relationships that we maintain. We analyze the profitability of each of our student lending clients, and sometimes determine that our resources servicing a specific client should be allocated elsewhere. As a result of this process, we decided to terminate an unprofitable contract with a commercial bank, which we do not expect will have a significant effect on revenues or net income in future periods. Our decision to terminate this contract, as discussed above, accounts for a substantial portion of the 7.6% decrease in Placement Volume in the year ended December 31, 2012, compared to the prior year period.
Claim Recovery Volume
While we are entitled to review Medicare records for all Part A and Part B claims in our region, we are not permitted to identify an improper claim unless that particular type of claim has been pre-approved by CMS to ensure compliance with applicable Medicare payment policies, as well as national and local coverage determinations. The growth of our revenues is determined primarily by the aggregate volume of Medicare claims in our region and our ability to identify improper payments within these claims. However, the long-term growth of these revenues will also be affected by the scope of the issues pre-approved by CMS.
Further, our claim recovery volume is currently impacted by a system adjustment that is being implemented by CMS for its PIP providers. PIP providers are reimbursed for Medicare claims through different processes than other healthcare providers, and CMS is in the process of making certain system adjustments in order to allow these claims to be processed. Prior to April 2012, we were not permitted to audit Medicare claims for these PIP providers, which we estimate to account for approximately 20% of Medicare claims in our region. The improper payments to PIP providers that we have identified were not processed by CMS from April 2012 until January 2013, when a small portion of such payments began to be processed manually. As a result, we will not recognize any revenues from identified improper payments to PIP providers as of December 31, 2012, but we have incurred expenses related to these claims. We estimate that this delayed our recognition of approximately $6 million in revenues in 2012, although we began to recognize a portion of these revenues as a result of the manual claims processing that began in the first quarter of 2013. CMS remains in the process of implementing the necessary changes to its systems that would allow these claims to be processed automatically and allow us to recognize the significant majority of these revenues. It is expected that the necessary upgrade will be complete in the second quarter of 2013. We can make no assumptions as to when the necessary upgrade will be complete and automatic processing will begin.
In addition, healthcare providers have taken various actions aimed at limiting Medicare audit and recovery activities. For example, in November 2012 the American Hospital Association and four hospitals filed a lawsuit against Kathleen Sebelius, the Secretary of the Department of Health and Human Services. The lawsuit claims, among other things, that CMS is acting improperly in completely denying payment for claims initially made under Medicare Part A (inpatient) that should have been made under Medicare Part B (outpatient), rather than remitting the difference between the Part A and Part B payments. A bill has also been introduced in the U.S. Congress that would also permit healthcare providers to resubmit such claims for payment for Part B services. CMS has recently proposed rules that would permit healthcare providers to resubmit certain of these claims for
36
Table of Contents
payment for Part B services and we do not expect that recovery auditors will be compensated on a complete denial for Part A claims under the new RAC contract. This type of improper claim has accounted for a substantial portion of the claims that we have identified under our RAC contract.
Contingency Fees
Our revenues consist primarily of contract-based contingency fees. The contingency fee percentages that we earn are set by our clients or agreed upon during the bid process, and may change from time to time either under the terms of existing contracts or pursuant to the terms of contract renewals. For example, our contractual arrangement with the Department of Education has recently changed as a result of the Department of Education’s decision to have its recovery vendors promote IBR to defaulted student loans. The IBR program provides flexibility on the required monthly payment for student loan borrowers at an amount intended to be affordable based on a borrower’s income and family size. As a result of the increased application of the IBR program to defaulted student loans, we expect that there will be an increase in the number of loans that become eligible for rehabilitation because more defaulted student loan borrowers will be able to make qualifying payments. In connection with the implementation of the IBR program, the Department of Education has reduced the contingency fee rate that we will receive for rehabilitating student loans by approximately 13% effective as of March 1, 2013. We expect that revenues derived from the increased volume of rehabilitated students loans will offset the decrease in contingency fee rates that we receive from the Department of Education.
Regulatory Matters
Each of the markets which we serve is highly regulated. Accordingly, changes in regulations that affect the types of loans, receivables and claims that we are able to service or the manner in which any such delinquent loans, receivables and claims can be recovered will affect our revenues and results of operations. For example, the passage of the Student Aid and Fiscal Responsibility Act, or SAFRA, in 2010 had the effect of transferring the origination of all government-supported student loans to the Department of Education, thereby ending all student loan originations guaranteed by the GAs. Loans guaranteed by the GAs represented approximately 70% of government-supported student loans originated in 2009. While the GAs will continue to service existing outstanding student loans for years to come, this legislation will over time shift the portfolio of student loans that we manage toward the Department of Education, and further concentrate our sources of revenues and increase our reliance on our relationship with the Department of Education. In addition, our entry into the healthcare market was facilitated by passage of the Tax Relief and Health Care Act of 2006, which mandated CMS to contract with private firms to audit Medicare claims in an effort to increase the recovery of improper Medicare payments. Any changes to the regulations that affect the student loan industry or the recovery of defaulted student loans or the Medicare program generally or the audit and recovery of Medicare claims could have a significant impact on our revenues and results of operations.
Client Concentration
Our revenues from the student loan market depend on our ability to maintain our contracts with some of the largest providers of student loans. In 2012, four providers of student loans each accounted for more than 10% of our revenues during such period and they collectively accounted for 55% of our total revenues during this period. Our contracts with these clients entitle them to unilaterally terminate their contractual relationship with us at any time without penalty. If we lose one of our significant clients, including if one of our significant clients is consolidated by an entity that does not use our services, if the terms of compensation for our services change or if there is a reduction in the level of placements provided by any of these clients, our revenues could decline.
Our contract with CMS for the recovery of improper Medicare payments began generating significant revenues during 2011 and represented 25.8% of our total revenues in the year ended December 31, 2012. CMS issued a request for quotes in connection with the re-bidding for the RAC contract in February 2013. Although our RAC contract is currently set to expire in 2014, CMS may terminate our RAC contract as early as August 2013 in connection with the re-bidding process for new RAC contracts. While we believe our performance under
37
Table of Contents
the existing agreement and the experience we have gained in performing this contract position us well to renew the agreement, failure to renew the agreement or renewal on substantially less favorable terms could significantly harm our revenues and results of operations.
Macroeconomic Factors
Certain macroeconomic factors influence our business and results of operations. These include the increasing volume of student loan originations in the U.S. as a result of increased tuition costs and student enrollment, the default rate of student loan borrowers, the growth in Medicare expenditures resulting from increasing healthcare costs, as well as the fiscal budget tightening of federal, state and local governments as a result of general economic weakness and lower tax revenues.
Critical Accounting Policies
Our consolidated financial statements are prepared in accordance with generally accepted accounting principles in the United States, or GAAP. The preparation of these consolidated financial statements requires us to make estimates and assumptions that affect the reported amounts of assets, liabilities, revenues, costs and expenses and related disclosures. We base our estimates on historical experience and on various other assumptions that we believe to be reasonable under the circumstances. In many instances, we could have reasonably used different accounting estimates, and in other instances changes in the accounting estimates are reasonably likely to occur from period-to-period. Accordingly, actual results could differ significantly from the estimates made by our management. To the extent that there are material differences between these estimates and actual results, our future financial statement presentation, financial condition, results of operations and cash flows will be affected. We believe that the accounting policies discussed below are critical to understanding our historical and future performance, as these policies relate to the more significant areas involving management’s judgments and estimates.
Revenue Recognition
The majority of our contracts are contingency fee based. We recognize revenues on these contingency fee based contracts when third-party payors remit payments to our clients or remit payments to us on behalf of our clients, and, consequently, the contingency is deemed to have been satisfied. Under our RAC contract with CMS, we recognize revenues when the healthcare provider has paid CMS for a given claim or incurs an offset against future Medicare claims. Providers have the right to appeal a claim and may pursue additional appeals if the initial appeal is found in favor of CMS. We accrue an estimated liability for appeals based on the amount of commissions received which are subject to appeal and which we estimate are probable of being returned to providers following successful appeal. This estimated liability for appeals is an offset to revenues on our income statement. Our estimates are based on our historical experience with appeals activity under our CMS contract since January 2010. During the year ended December 31, 2012, we reserved an amount equal to 14% of gross revenues from our CMS contract. We have increased our estimated liability for appeal in 2012 due to recent trends in our historical data related to the likelihood of successful appeals. Commencing on December 31, 2011, we established a separate line item in the current liabilities section of our balance sheet entitled “Estimated liability for appeals” to reflect our estimate of this liability. The $4.4 million balance as of December 31, 2012, represents our best estimate of the probable amount of losses related to appeals of claims for which commissions were previously collected. We estimate that it is reasonably possible that we could be required to pay up to an additional approximately $1.5 million as a result of potentially successful appeals. To the extent that required payments by us related to successful appeals exceed the amount accrued, revenues in the applicable period would be reduced by the amount of the excess. We similarly accrue an allowance against accounts receivable related to commissions yet to be collected, which was $1.2 million as of December 31, 2012, based on the same estimates used to establish the estimated liability for appeals of commissions received. Our inability to correctly estimate the estimated liabilities and allowance against accounts receivable could adversely affect our revenues in future periods.
38
Table of Contents
Goodwill
We periodically review the carrying value of intangible assets not subject to amortization, including goodwill, to determine whether an impairment may exist. GAAP requires that goodwill and certain intangible assets not subject to amortization be assessed annually for impairment using fair value measurement techniques.
Specifically, goodwill impairment is determined using a two-step test. The first step of the goodwill impairment test is used to identify potential impairment by comparing the fair value of a reporting unit with its book value, including goodwill. If the fair value of the reporting unit exceeds its book value, goodwill is considered not impaired and the second step of the impairment test is unnecessary. If the book value of the reporting unit exceeds its fair value, the second step of the goodwill impairment test is performed to measure the amount of impairment loss, if any. The second step of the goodwill impairment test compares the implied fair value of the reporting unit’s goodwill with the book value of that goodwill. If the book value of the reporting unit’s goodwill exceeds the implied fair value of that goodwill, an impairment loss is recognized in an amount equal to that excess. The implied fair value of goodwill is determined in the same manner as the amount of goodwill recognized in a business combination. That is, the fair value of the reporting unit is allocated to all of the assets and liabilities of that unit as if the reporting unit had been acquired in a business combination and the fair value of the reporting unit was the purchase price paid to acquire the reporting unit. In September 2011, the Financial Accounting Standards Board, or FASB, issued Accounting Standards Update, or ASU, 2011-08, Intangibles—Goodwill and Other (Topic 350): Testing Goodwill for Impairment. This ASU permits an entity to make a qualitative assessment of whether it is more likely than not that a reporting unit’s fair value is less than its carrying amount before applying the two-step goodwill impairment test. If an entity concludes it is not more likely than not that the fair value of a reporting unit is less than its carrying amount, it need not perform the two-step impairment test. The ASU permits early adoption, and based on our qualitative assessment we concluded that we are not required to perform the two-step impairment test at December 31, 2011 and 2012.
Impairments of Depreciable Intangible Assets
We evaluate depreciable intangible assets for impairment whenever events or changes in circumstances indicate that the carrying amount of such assets may not be recoverable. Depreciable intangible assets consist of client contracts and related relationships, and are being amortized over their estimated useful life, which is generally 20 years. We evaluate the client contracts intangible at the individual contract level. The recoverability of such assets is measured by a comparison of the carrying amount of the assets to future undiscounted net cash flows expected to be generated by the assets. If the assets are considered to be impaired, the impairment to be recognized is measured by the amount by which the carrying amount of the assets exceeds the fair value of the assets. There was no impairment expense for depreciable intangible assets in 2012, 2011 or 2010.
39
Table of Contents
Results of Operations
Year Ended December 31, 2012 compared to the Year Ended December 31, 2011
The following table represents our historical operating results for the periods presented:
| Year Ended December 31, | $ Change | % Change | ||||||||||||||
| 2012 | 2011 | |||||||||||||||
| (dollars in thousands) | ||||||||||||||||
| Consolidated Statement of Operations Data: |
||||||||||||||||
| Revenues |
$ | 210,073 | $ | 162,974 | $ | 47,099 | 29 | % | ||||||||
| Operating expenses: |
||||||||||||||||
| Salaries and benefits |
83,002 | 67,082 | 15,920 | 24 | % | |||||||||||
| Other operating expense |
71,305 | 49,199 | 22,106 | 45 | % | |||||||||||
| Impairment of trade name |
— | 13,400 | (13,400 | ) | -100 | % | ||||||||||
|
|
|
|
|
|
|
|
|
|||||||||
| Total operating expenses |
154,307 | 129,681 | 24,626 | 19 | % | |||||||||||
|
|
|
|
|
|
|
|
|
|||||||||
| Income from operations |
55,766 | 33,293 | 22,473 | 68 | % | |||||||||||
| Debt extinguishment costs |
(3,679 | ) | — | (3,679 | ) | 0 | % | |||||||||
| Interest expense |
(12,414 | ) | (13,530 | ) | 1,116 | -8 | % | |||||||||
| Interest income |
64 | 125 | (61 | ) | -49 | % | ||||||||||
|
|
|
|
|
|
|
|
|
|||||||||
| Income before provision for income taxes |
39,737 | 19,888 | 19,849 | 100 | % | |||||||||||
| Provision for income taxes |
16,786 | 7,516 | 9,270 | 123 | % | |||||||||||
|
|
|
|
|
|
|
|
|
|||||||||
| Net income |
$ | 22,951 | $ | 12,372 | $ | 10,579 | 86 | % | ||||||||
|
|
|
|
|
|
|
|
|
|||||||||
| Accrual for preferred stock dividends |
2,038 | 6,495 | (4,457 | ) | -69 | % | ||||||||||
| Net income available to common shareholders |
$ | 20,913 | $ | 5,877 | $ | 15,036 | 256 | % | ||||||||
|
|
|
|
|
|
|
|
|
|||||||||
Revenues
Total revenues were $210.1 million for the year ended December 31, 2012, an increase of $47.1 million or 28.9%, compared to total revenues of $163.0 million for the year ended December 31, 2011. This increase in revenues is primarily due to an increase of $33.2 million in revenues received from CMS under our RAC contract as a result of higher claim recovery volume and an increase of $4.8 million generated from a new default-aversion service contract that commenced in May 2012 for a new service offering we provide in other markets we serve. Revenues from student lending increased by 8.3% in 2012 to $132.4 million from $122.2 million in the prior year period.
Salaries and Benefits
Salaries and benefits expense was $83.0 million for the year ended December 31, 2012, an increase of $15.9 million, or 23.7%, compared to salaries and benefits expense of $67.1 million for the year ended December 31, 2011. This increase is primarily due to hiring of new employees to provide services under our RAC contract with CMS, an increase in expenses associated with the engagement of additional software engineers to assist in the integration of a recently acquired software license and an increase in expenses associated with the hiring of additional administrative employees.
Other Operating Expense
Other operating expense was $71.3 million for the year ended December 31, 2012, an increase of $22.1 million, or 44.9%, compared to other operating expense of $49.2 million for the year ended December 31, 2011. This increase is primarily due to (i) an additional $10 million of subcontractor fees incurred in connection with increased services provided under the RAC contract and MSA contracts and (ii) $1.3 million paid to Parthenon Capital Partners in connection with the termination of an advisory services agreement, and an additional $0.9 million paid to Parthenon Capital Partners at the closing of our initial public offering also as a result of the termination of the advisory agreement.
40
Table of Contents
Impairment of Trade Name
We did not recognize an impairment expense for intangible assets in 2012. In 2011, we recorded $13.4 million of impairment expense to write off the carrying value of our former trade name, Diversified Collection Services Inc., due to our decision to retire that trade name.
Income from Operations
As a result of the factors described above, income from operations was $55.8 million for the year ended December 31, 2012, compared to $33.3 million for the year ended December 31, 2011, representing an increase of $22.5 million, or 67.5%.
Debt Extinguishment Costs
As a result of the entry into our new credit facility and the repayment of all amounts owed under our then existing credit facility in March 2012, we incurred debt extinguishment costs of $3.7 million, comprised of approximately $3.3 million in fees paid to the lenders in connection with our new credit facility and approximately $0.3 million of unamortized debt issuance costs associated with our old credit facility. We did not incur a similar expense in the year ended December 31, 2011.
Interest Expense
Interest expense was $12.4 million for the year ended December 31, 2012 compared to $13.5 million for the year ended December 31, 2011, representing a decrease of 8.2% due to lower interest rates under the new credit agreement as compared to the interest rates under our old credit agreement.
Income Taxes
Income tax expense was $16.8 million for the year ended December 31, 2012 compared to $7.5 million for the year ended December 31, 2011, representing an increase of 123.3% consistent with the increase in income before provision for income taxes. Our effective income tax rate increased to 42.2% for the year ended December 31, 2012 from 37.8% for the year ended December 31, 2011. Approximately 2.5% of the increase results from changes in the state tax rate, which include a 2011 one-time benefit from a change in California tax law of 2.3%. In addition, approximately 1.9% of the increase was due to the non-deductible termination of an advisory services agreement in 2012.
Net Income
As a result of the factors described above, net income was $23.0 million for the year ended December 31, 2012, which represented an increase of $10.6 million compared to net income of $12.4 million for the year ended December 31, 2011.
41
Table of Contents
Year Ended December 31, 2011 compared to the Year Ended December 31, 2010
The following table presents our historical operating results for the periods presented:
| Year Ended December 31, | $ Change | % Change | ||||||||||||||
| 2011 | 2010 | |||||||||||||||
| (dollars in thousands) | ||||||||||||||||
| Consolidated Statement of Operations Data: |
||||||||||||||||
| Revenues |
$ | 162,974 | $ | 123,519 | $ | 39,455 | 32 | % | ||||||||
| Operating expenses: |
||||||||||||||||
| Salaries and benefits |
67,082 | 58,113 | 8,969 | 15 | % | |||||||||||
| Other operating expense |
49,199 | 33,655 | 15,544 | 46 | % | |||||||||||
| Impairment of trade name |
13,400 | — | 13,400 | 0 | % | |||||||||||
|
|
|
|
|
|
|
|
|
|||||||||
| Total operating expenses |
129,681 | 91,768 | 37,913 | 41 | % | |||||||||||
|
|
|
|
|
|
|
|
|
|||||||||
| Income from operations |
33,293 | 31,751 | 1,542 | 5 | % | |||||||||||
| Interest expense |
(13,530 | ) | (15,230 | ) | 1,700 | -11 | % | |||||||||
| Interest income |
125 | 118 | 7 | 6 | % | |||||||||||
|
|
|
|
|
|
|
|
|
|||||||||
| Income before provision for income taxes |
19,888 | 16,639 | 3,249 | 20 | % | |||||||||||
| Provision for income taxes |
7,516 | 6,664 | 852 | 13 | % | |||||||||||
|
|
|
|
|
|
|
|
|
|||||||||
| Net income |
$ | 12,372 | $ | 9,975 | 2,397 | 24 | % | |||||||||
|
|
|
|
|
|
|
|
|
|||||||||
Revenues
Total revenues were $163.0 million for the year ended December 31, 2011, an increase of $39.5 million, or 31.9%, compared to total revenues of $123.5 million for the year ended December 31, 2010. Of this increase, $19.7 million is attributable to increased recovery activity on our RAC contract with CMS and reflects the first full-year of our recovery activity related to this contract. The remaining increase was primarily a result of an increase in revenues from our student lending markets, due largely to an approximately 17.9% increase in placement volume from 2010 to 2011.
Salaries and Benefits
Salaries and benefits was $67.1 million for the year ended December 31, 2011, an increase of $9.0 million, or 15.4%, compared to salaries and benefits expense of $58.1 million for the year ended December 31, 2010. This increase is primarily due to an increase in employee headcount associated with hiring to staff our operations under the RAC contract. Our employee headcount was 1,280 as of December 31, 2011, an increase of 160, or 14.3%, over the employee headcount of 1,120 as of December 31, 2010.
Other Operating Expense
Other operating expense was $49.2 million for the year ended December 31, 2011, an increase of $15.5 million, or 46.2%, compared to other operating expense of $33.7 million for the year ended December 31, 2010. This increase is primarily due to the use of subcontractors as we expand our operations in our healthcare market to help address the new and significant claims activity, along with increases in payments to healthcare providers for the transfer of medical records as required under the RAC contract. In addition, we recorded a $1.2 million expense in 2011 related to a legal settlement that was paid out in the first quarter of 2012.
Income From Operations
As a result of the factors described above, income from operations was $33.3 million, for the year ended December 31, 2011, as compared to $31.8 million for the year ended December 31, 2010. This reflects an expense of $13.4 million related to impairment expenses to write off the carrying amount of the trade name intangible assets due to the retirement of a former trade name. Income from operations excluding this expense totaled $46.7 million for the year ended December 31, 2011, which represents an increase of $14.9 million, or 47.1%, as compared to income from operations for the year ended December 31, 2010.
42
Table of Contents
Interest Expense
Interest expense was $13.5 million for the year ended December 31, 2011, a decrease of $1.7 million from $15.2 million for the year ended December 31, 2010. The reduction in interest expense is due primarily to lower notes payable balances resulting from principal repayments.
Income Taxes
Income tax expense of $7.5 million for the year ended December 31, 2011, represented an effective tax rate of 37.8% of income before provision for income tax. Income tax expense of $6.7 million was recorded for the year ended December 31, 2010, and represented an effective tax rate of 40%.
Net Income
As a result of the factors described above, net income was $12.4 million for the year ended December 31, 2011, which represented an increase of $2.4 million over net income of $10.0 million for the year ended December 31, 2010. Excluding the impairment expenses to write off the carrying amount of the trade name, net income would have been $20.7 million for the year ended December 31, 2011.
Selected Quarterly Financial Data
The following table sets forth selected unaudited consolidated quarterly operating data for each of the twelve quarters during the period from January 1, 2010 to December 31, 2012. In our management’s opinion, the data has been prepared on the same basis as the audited consolidated financial statements included in this prospectus and reflect all necessary adjustments, consisting only of normal recurring adjustments, necessary for a fair presentation of these data. You should read this information together with our consolidated financial statements and the related notes appearing elsewhere in this prospectus. Operating results for any fiscal quarter are not necessarily indicative of results for the full year. Historical results are not necessarily indicative of the results to be expected in future periods.
| Three Months Ended | ||||||||||||||||||||||||||||||||||||||||||||||||
| Dec 31, 2012 |
Sep 30, 2012 |
Jun 30, 2012 |
Mar 31, 2012 |
Dec 31, 2011 |
Sep 30, 2011 |
Jun 30, 2011 |
Mar 31, 2011 |
Dec 31, 2010 |
Sept 30, 2010 |
Jun 30, 2010 |
Mar 31, 2010 |
|||||||||||||||||||||||||||||||||||||
| (in thousands) | ||||||||||||||||||||||||||||||||||||||||||||||||
| Revenues |
$ | 55,974 | $ | 53,400 | $ | 54,821 | $ | 45,878 | $ | 42,641 | $ | 42,009 | $ | 43,244 | $ | 35,080 | $ | 33,703 | $ | 29,362 | $ | 31,319 | $ | 29,135 | ||||||||||||||||||||||||
| Operating expenses: |
||||||||||||||||||||||||||||||||||||||||||||||||
| Salaries and benefits |
23,576 | 21,003 | 19,782 | 18,641 | 16,645 | 16,456 | 17,252 | 16,729 | 14,981 | 14,185 | 14,232 | 14,715 | ||||||||||||||||||||||||||||||||||||
| Other operating expense |
18,252 | 18,240 | 18,672 | 16,141 | 14,006 | 13,613 | 11,507 | 10,073 | 9,680 | 8,414 | 8,330 | 7,231 | ||||||||||||||||||||||||||||||||||||
| Impairment of trade name(1) |
— | — | — | — | 13,400 | — | — | — | — | — | — | — | ||||||||||||||||||||||||||||||||||||
|
|
|
|
|
|
|
|
|
|
|
|
|
|
|
|
|
|
|
|
|
|
|
|
|
|||||||||||||||||||||||||
| Total operating expenses |
41,828 | 39,243 | 38,454 | 34,782 | 44,051 | 30,069 | 28,759 | 26,802 | 24,661 | 22,599 | 22,562 | 21,946 | ||||||||||||||||||||||||||||||||||||
|
|
|
|
|
|
|
|
|
|
|
|
|
|
|
|
|
|
|
|
|
|
|
|
|
|||||||||||||||||||||||||
| Income from operations |
14,146 | 14,157 | 16,367 | 11,096 | (1,410 | ) | 11,940 | 14,485 | 8,278 | 9,042 | 6,763 | 8,757 | 7,189 | |||||||||||||||||||||||||||||||||||
| Debt extinguishment costs(2) |
— | — | — | (3,679 | ) | — | — | — | — | — | — | — | — | |||||||||||||||||||||||||||||||||||
| Interest expense |
(3,085 | ) | (3,175 | ) | (2,964 | ) | (3,190 | ) | (3,317 | ) | (3,366 | ) | (3,404 | ) | (3,443 | ) | (3,601 | ) | (3,667 | ) | (3,971 | ) | (3,991 | ) | ||||||||||||||||||||||||
| Interest income |
— | 2 | 31 | 31 | 31 | 31 | 31 | 32 | 31 | 34 | 28 | 25 | ||||||||||||||||||||||||||||||||||||
|
|
|
|
|
|
|
|
|
|
|
|
|
|
|
|
|
|
|
|
|
|
|
|
|
|||||||||||||||||||||||||
| Income before provision for income taxes |
11,061 | 10,984 | 13,434 | 4,258 | (4,696 | ) | 8,605 | 11,112 | 4,867 | 5,472 | 3,130 | 4,814 | 3,223 | |||||||||||||||||||||||||||||||||||
| Provision for income taxes |
5,088 | 4,601 | 1,254 | 1,742 | (2,323 | ) | 3,439 | 4,451 | 1,949 | 2,191 | 1,254 | 1,928 | 1,291 | |||||||||||||||||||||||||||||||||||
|
|
|
|
|
|
|
|
|
|
|
|
|
|
|
|
|
|
|
|
|
|
|
|
|
|||||||||||||||||||||||||
| Net income (loss) |
$ | 5,973 | $ | 6,383 | $ | 1,876 | $ | 2,516 | $ | (2,373 | ) | $ | 5,166 | $ | 6,661 | $ | 2,918 | $ | 3,281 | $ | 1,876 | $ | 2,886 | $ | 1,932 | |||||||||||||||||||||||
|
|
|
|
|
|
|
|
|
|
|
|
|
|
|
|
|
|
|
|
|
|
|
|
|
|||||||||||||||||||||||||
| (1) | Represents impairment expense to write off the carrying amount of the trade name intangible asset due to the plan to retire the Diversified Collection Services, Inc. trade name. |
| (2) | Represents debt extinguishment costs comprised of approximately $3.3 million of fees paid to lenders in connection with our new credit facility and approximately $0.3 million of unamortized debt issuance costs in connection with our old credit facility. |
43
Table of Contents
Liquidity and Capital Resources
Our principal sources of liquidity are cash flows from operations, term loans, and the proceeds received from our initial public offering in August 2012. Cash and cash equivalents, which totaled $37.8 million as of December 31, 2012, consist primarily of cash on deposit with banks. We expect that operating cash flows will continue to be a primary source of liquidity for our operating needs. There are currently no borrowings outstanding under our revolving credit facility other than a $1.4 million letter of credit. Due to our operating cash flows, our existing cash and cash equivalents and availability under our revolving credit facility, we believe that we have the ability to meet our working capital and capital expenditure needs for the foreseeable future.
The following table presents information regarding our cash flows for the years ended December 31, 2012, 2011 and 2010:
| Year Ended December 31, |
||||||||||||
| 2012 | 2011 | 2010 | ||||||||||
| (in thousands) | ||||||||||||
| Net cash provided by operating activities |
$ | 37,005 | $ | 28,985 | $ | 18,214 | ||||||
| Net cash used in investing activities |
(12,193 | ) | (6,111 | ) | (4,921 | ) | ||||||
| Net cash used in financing activities |
(6,973 | ) | (13,948 | ) | (11,139 | ) | ||||||
Cash flows from operating activities
Operating activities provided $37.0 million of cash during the year ended December 31, 2012, an increase of $8.0 million, compared to cash provided by operating activities of $29.0 million for the year ended December 31, 2011, primarily due to the increase in net income for the year ended December 31, 2012 to $23.0 million compared to $12.4 million for 2011. Cash used to pay accrued salary and benefits totaled $9.3 million in 2012, as compared to the $7.1 million in accrued salaries and benefits payable in 2011. Accounts payable increased $1.3 million in 2012 compared to 2011, primarily due to timing. The estimated liability for appeals for revenue received from CMS totaled $4.4 million in 2012, compared to $0.5 million in 2011, due to higher claim recovery volumes under our RAC contract with CMS.
We generated $29.0 million of cash from operating activities during the year ended December 31, 2011, primarily resulting from our net income of $12.4 million, non-cash depreciation and amortization of $7.8 million, an impairment expense of $13.4 million to write off the carrying amount of the trade name intangible asset due to the retirement of the Diversified Collection Services, Inc. trade name and changes in operating assets and liabilities of $3.8 million, offset by non-cash deferred income taxes of $9.6 million.
We generated $18.2 million of cash from operating activities during the year ended December 31, 2010, primarily resulting from our net income of $10.0 million, non-cash depreciation, amortization and impairment of intangible assets of $7.2 million and interest expense from debt issuance costs of $2.0 million, partially offset by non-cash changes in operating assets and liabilities of $1.5 million.
Cash flows from investing activities
Investing activities resulted in cash outflow of $12.2 million during the year ended December 31, 2012. The primary uses of cash associated with investing activities in 2012 were $11.4 million for property, equipment and leasehold improvements, to enhance our proprietary technology platform, improve our telecommunications systems, upgrade our IT infrastructure for storage and operating activities, and $0.8 million for the purchase of a perpetual software license. We used $6.1 million and $4.9 million of cash in investing activities for the purchase of property, equipment and leasehold improvements during the years ended December 31, 2011 and 2010, primarily for investments in information technology systems and infrastructure to support increased business volumes.
44
Table of Contents
Cash flows from financing activities
For the year ended December 31, 2012, our primary financing activities were $156 million in proceeds from term loans, $12.8 million of net proceeds from our initial public offering, which was completed in August 2012, and $4.5 million in revolving credit facility borrowings. These proceeds were offset by $103.4 million used for the repayment of our old notes payable and repayment of principal on our new term loans, $12.7 million used for the repayment of our old and new lines of credit, $60.3 million used to redeem 5.3 million shares of preferred stock, and $3.1 million used for debt issuance costs. We used $13.9 million of cash in financing activities for the repayment of notes payable during the year ended December 31, 2011. We used $11.1 million of cash in financing activities during the year ended December 31, 2010, comprised of $10.0 million used for the repayment of notes payable and $1.2 million used for debt issuance costs.
Long-term Debt
On March 19, 2012, we, through our wholly owned subsidiary, entered into a $147.5 million credit agreement with Madison Capital Funding LLC as administrative agent, ING Capital LLC as syndication agent, and other lenders party thereto. The senior credit facility consists of (i) a $57.0 million term A loan that matures in March 2017, (ii) a $79.5 million term B loan that matures in March 2018 , and (iii) a $11.0 million revolving credit facility that expires in March 2017, which had a borrowing capacity of $9.6 million as of December 31, 2012. On June 28, 2012, we increased the amount of our borrowings under our term B loan by $19.5 million. We may also request the lenders to increase the size of the term B loan or other term loans by up to an additional $10.5 million at any time prior to March 19, 2014.
All borrowings under the credit agreement bear interest at a rate per annum equal to an applicable margin plus, at our option, either (i) a base rate determined by reference to the highest of (a) the prime rate published in the Wall Street Journal or another national publication, (b) the federal funds rate plus 0.5%, and (c) 2.5% or (ii) a London Interbank Offered Rate, or Libor, rate determined by reference to the highest of (a) a Libor rate published in Reuters or another national publication and (b) 1.5%. The term A loan and the revolving credit facility have an applicable margin of 4.25% for base rate loans and 5.25% for Libor rate loans. The term B loan has an applicable margin of 4.75% for base rate loans and 5.75% for Libor rate loans. The minimum per annum interest rate that we are required to pay is 6.75% for the term A loan and revolving credit facility and 7.25% for the term B loan. Interest is due at the end of each month for base rate loans and at the end of each Libor period for Libor rate loans unless the Libor period is greater than 3 months, in which case interest is due at the last day of each 3-month interval of such Libor period.
The credit agreement requires us to prepay the two term loans on a prorated basis and then to prepay the revolving credit facility under certain circumstances: (i) with 100% of the net cash proceeds of any asset sale or other disposition of assets by us or our subsidiaries where the net cash proceeds exceed $1 million, (ii) with a percentage of our annual excess cash flow each year where such percentage ranges from 25%-75% depending on our total debt to EBITDA ratio reduced by any voluntary prepayments that are made on our term loans during the same period and (iii) with any net cash proceeds from a qualified initial public offering by us, less net proceeds applied to redeem any outstanding preferred equity or convertible debt, to pay a common shareholder dividend not to exceed $20 million or, if we comply with an adjusted EBITDA ratio set forth in the agreement, to our cash balances in an amount not to exceed $75 million. We applied the proceeds from our initial public offering to our cash balances.
We have to abide by certain negative covenants for our credit agreement, which limit the ability for our subsidiaries and us to:
| • | incur additional indebtedness; |
| • | create or permit liens; |
| • | pay dividends or other distributions to our equity holders; |
45
Table of Contents
| • | purchase or redeem certain equity interests of our equity holders, including any warrants, options and other security rights; |
| • | pay management fees or similar fees to any of our equity holders; |
| • | make any redemption, prepayment, defeasance, repurchase or any other payment with respect to any subordinated debt; |
| • | consolidate or merge; |
| • | sell assets, including the capital stock of our subsidiaries; |
| • | enter into transactions with our affiliates; |
| • | enter into different business lines; and |
| • | make investments. |
The credit agreement also requires us to meet certain financial covenants, including maintaining a fixed charge coverage ratio and a total debt to EBITDA ratio as such terms are defined in our credit agreement. These financial covenants are tested at the end of each quarter beginning on December 31, 2012. The table below further describes these financial covenants, as well as our status under these covenants as of December 31, 2012.
| Financial Covenant |
Covenant Requirement |
Actual Ratio at December 31, 2012 |
||||||
| Fixed charge coverage ratio (minimum) |
1.20 to 1.0 | 1.93 | ||||||
| Total debt to EBITDA ratio (maximum) |
3.25 to 1.0 | 2.11 | ||||||
Contractual Obligations
The following summarizes our contractual obligations as of December 31, 2012:
| Payments Due by Period | ||||||||||||||||||||
| Contractual Obligations | Total | Less Than 1 Year |
1-3 Years |
3-5 Years |
More Than 5 Years |
|||||||||||||||
| Long-Term Debt Obligations |
$ | 147,769 | $ | 11,040 | $ | 22,080 | $ | 21,293 | $ | 93,356 | ||||||||||
| Interest Payments |
45,785 | 10,446 | 18,611 | 15,255 | 1,473 | |||||||||||||||
| Operating Lease Obligations |
6,754 | 1,740 | 3,178 | 1,771 | 65 | |||||||||||||||
| Purchase Obligations |
3,698 | 3,650 | 48 | — | — | |||||||||||||||
|
|
|
|
|
|
|
|
|
|
|
|||||||||||
| Total |
$ | 204,006 | $ | 26,876 | $ | 43,917 | $ | 38,319 | $ | 94,894 | ||||||||||
|
|
|
|
|
|
|
|
|
|
|
|||||||||||
Off-Balance Sheet Arrangements
We have no off-balance sheet arrangements.
Quantitative and Qualitative Disclosures about Market Risk
We do not hold or issue financial instruments for trading purposes. We conduct all of our business in U.S. currency and therefore do not have any direct foreign currency risk. We do have exposure to changes in interest rates with respect to the borrowings under our senior secured credit facility, which bear interest at a variable rate based on the prime rate or LIBOR. For example, if the interest rate on our borrowings increased 100 basis points (1%) from the credit facility floor of 1.5%, our annual interest expense would increase by
46
Table of Contents
approximately $1.5 million. In July 2012, we entered into an interest rate cap agreement per the terms of our senior secured credit agreement. The interest rate cap agreement is effective beginning in October 2012, and matures in October 2014, with a total notional amount of $75 million and a cap on LIBOR at 2.0%. If the LIBOR rate were to increase by 100 basis points (1.0%) above the credit facility floor of 1.5% for a year, we would receive a payment from the interest rate cap of approximately $0.4 million.
While we currently hold our excess cash in an operating account, in the future we may invest all or a portion of our excess cash in short-term investments, including money market accounts, where returns may reflect current interest rates. As a result, market interest rate changes impact our interest expense and interest income. This impact will depend on variables such as the magnitude of interest rate changes and the level of our borrowings under our credit facility or excess cash balances.
Recent Accounting Pronouncements
Under the JOBS Act, emerging growth companies can delay adopting new or revised accounting standards until such time as those standards apply to private companies. However, we do not intend to elect to take advantage of this extended transition period provided in Section 7(a)(2)(B) of the Securities Act of 1933, or the Securities Act, as allowed by Section 107(b)(1) of the JOBS Act.
In December 2011, FASB issued ASU No. 2011-11, Balance Sheet (Topic 210): Disclosures about Offsetting Assets and Liabilities. ASU 2011-11 requires an entity to disclose information about offsetting and related arrangements to enable users of financial statements to understand the effect of those arrangements on its financial position, and to allow investors to better compare financial statements prepared under GAAP with financial statements prepared under International Financial Reporting Standards (IFRS). The new standards are effective for annual periods beginning January 1, 2013, and interim periods within those annual periods. Retrospective application is required. We have implemented the provisions of ASU 2011-11 as of January 1, 2013. We do not believe our adoption of the new guidance will have an impact on our consolidated financial statements.
In June 2011, the FASB issued ASU 2011-05, Comprehensive Income (Topic 220): Presentation of Comprehensive Income. Under this ASU, an entity will have the option to present the components of net income and comprehensive income in either one or two consecutive financial statements. The ASU eliminates the option in GAAP to present other comprehensive income in the statement of changes in equity. An entity should apply the ASU retrospectively. For a nonpublic entity, the ASU is effective for fiscal years ending after December 15, 2012, and interim and annual periods thereafter. Early adoption is permitted. In December 2011, the FASB decided to defer the effective date of those changes in ASU 2011-05 that relate only to the presentation of reclassification adjustments in the statement of income by issuing ASU 2011-12, Comprehensive Income (Topic 220): Deferral of the Effective Date for Amendments to the Presentation of Reclassifications of Items Out of Accumulated Other Comprehensive income in Accounting Standards Update 2011-05. We adopted this new guidance with no impact to our consolidated financial statements.
In May 2011, the FASB issued ASU 2011-04, Fair Value Measurement (Topic 820): Amendments to Achieve Common Fair Value Measurement and Disclosure Requirements in U.S. GAAP and IFRS. The new standards do not extend the use of fair value but, rather, provide guidance about how fair value should be applied where it already is required or permitted under IFRS or GAAP. For GAAP, most of the changes are clarifications of existing guidance or wording changes to align with IFRS. A nonpublic entity is required to apply the ASU prospectively for annual periods beginning after December 15, 2011. We adopted this new guidance with no impact to our consolidated financial statements.
47
Table of Contents
Overview
We provide technology-enabled recovery and related analytics services in the United States. Our services help identify and recover delinquent or defaulted assets and improper payments for both government and private clients in a broad range of markets. Our clients typically operate in complex and regulated environments and outsource their recovery needs in order to reduce losses on billions of dollars of defaulted student loans, improper healthcare payments and delinquent state tax and federal treasury receivables. We generally provide our services on an outsourced basis, where we handle many or all aspects of our clients’ recovery processes.
We believe we have a leading position in our markets based on our proprietary technology-enabled services platform, long-standing client relationships and the large volume of funds we have recovered for our clients. In 2012, we provided recovery services on approximately $8.2 billion of combined student loans and other delinquent federal and state receivables and recovered approximately $482 million in improper Medicare payments. Our clients include 11 of the 31 public sector participants in the student loan industry and these relationships average more than 10 years in length, including a 22-year relationship with the Department of Education. According to the Department of Education, total government-supported student loan originations were estimated to be approximately $115 billion in 2012, and, as of September 30, 2012, approximately $78 billion of government-supported student loans were in default. In the healthcare market, we are currently one of four prime RACs, in the United States for CMS. According to the Government Accountability Office, Medicare paid $554 billion of claims in 2011, of which approximately $43 billion were estimated to be improper payments.
We utilize our technology platform to efficiently provide recovery and analytics services in the markets we serve. We have continuously developed and refined our technology platform for almost two decades by using our extensive domain and data processing expertise. Our technology platform allows us to disaggregate otherwise complex recovery processes into a series of simple, efficient and consistent component steps, which we refer to as workflows, for our recovery and healthcare claims review specialists. This approach enables us to continuously refine our recovery processes to achieve higher rates of recovery with greater efficiency. By optimizing what traditionally have been manually-intensive processes, we believe we achieve higher workforce productivity versus more traditional labor-intensive outsourcing business models. For example, we generated in excess of $150,000 of revenues per employee during 2012, based on the average number of employees during the year.
We believe that our platform is easily adaptable to new markets and processes. Over the past several years, we have successfully extended our platform into additional markets with significant recovery opportunities. For example, we utilized the same basic platform previously used primarily for student loan recovery activities to enter the healthcare market. We have enhanced our platform through investment in new data and analytics capabilities, which we believe will enable us to provide additional services such as services relating to the detection of fraud, waste and abuse.
Our revenue model is generally success-based as we earn fees based on a percentage of the aggregate amount of funds that we enable our clients to recover. Our services do not require any significant upfront investments by our clients and we offer our clients the opportunity to recover significant funds otherwise lost. Because our model is based upon the success of our efforts and the dollars we enable for our clients to recover, our business objectives are aligned with those of our clients and we are generally not reliant on their spending budgets. Further, our business model does not require significant capital expenditures and we do not purchase loans or obligations.
We believe we benefit from a significant degree of revenue visibility due to reasonably predictable recovery outcomes in a substantial portion of our business. For the year ended December 31, 2012, we generated approximately $210.1 million in revenues, $23.0 million in net income, $69.6 million in adjusted EBITDA and $30.6 million in adjusted net income. See “Prospectus Summary—Summary Consolidated Financial Data—
48
Table of Contents
Adjusted EBITDA and Adjusted Net Income” for a definition of adjusted EBITDA and adjusted net income, the reasons for providing these financial measures and the limitations of these measures, which do not reflect all items of income and expense as reported under GAAP.
We commenced our operations in 1976 under the corporate name Diversified Collection Services, Inc., or DCS. We were incorporated in Delaware on October 8, 2003 under the name DCS Holdings, Inc. and subsequently changed our name to Performant Financial Corporation in 2005.
Our Markets
We operate in markets characterized by strong growth, a complex regulatory environment and a significant amount of delinquent, defaulted or improperly paid assets.
Student Lending
Student lending is a large and critically-important market in the United States. According to the Department of Education, total government-supported student loan originations were estimated to be approximately $115 billion in the year ended September 30, 2012, and the aggregate dollar amount of these loans has grown at a compound annual growth rate of 11% from 2002 through 2012. This growth has been supported by general demographic trends, increased enrollment, and rising costs of tuition and other expenses that increase the need for borrowed funds among students. In addition to strong underlying origination growth, the default rates among student loan borrowers have increased in recent years. The “cohort default rate,” which is the measure utilized by the Department of Education to track the percentage of government-supported loan borrowers that enter repayment in a certain year ended September 30 and default by the end of the next year ended September 30, has risen from approximately 5% in 2006 to approximately 9% in 2010, the last year for which data is available.
Government-supported student loans are authorized under Title IV of the Higher Education Act of 1965. Historically, there have been two distribution channels for student loans: (i) the Federal Direct Student Loan Program, or FDSLP, which represents loans made and managed directly by the Department of Education; and (ii) the Federal Family Education Loan Program, or FFELP, which represents loans made by private institutions and currently backed by any of the 31 GAs.
In July 2010, the government-supported student loan sector underwent a structural change with the passage of SAFRA. This legislation transitioned all new government-supported student loan originations to the FDSLP, and away from originations made by private institutions within the FFELP that had previously utilized the GAs to guarantee, manage and service loans. The GAs are non-profit 501(c)(3) public benefit corporations operating under contract with the U.S. Secretary of Education, pursuant to the Higher Education Act of 1965, as amended, solely for the purpose of guaranteeing and managing student loans originated by lenders participating in the FFELP. Consequently, while the original distribution channels for student loans have been consolidated into one channel, the Department of Education, this does not impact the volume of government-supported student loan origination, which is a key driver of the volume of defaulted student loan inventory. In addition, despite this transition of all new loan originations to the FDSLP, GAs will continue to manage a significant amount of defaulted student loans for some period of time, due to their large outstanding portfolios of loans originated prior to July 2010. The outstanding portfolios of defaulted FFELP loans will, therefore, require recovery for the foreseeable future.
The Department of Education estimates that the balance of defaulted loans was approximately $44.7 billion in the FDSLP and approximately $32.7 billion in the FFELP as of September 30, 2012. These programs collectively guaranteed approximately $706 billion of federal government-supported student loans according to the Congressional Budget Office as of September 30, 2011. Given the operational and logistical complexity involved in managing the recovery of defaulted student loans, the Department of Education and the GAs generally choose to outsource these services to third parties.
49
Table of Contents
The tables below show government-supported student loan originations and government-supported default inventory for the years ended 2007 through 2012 as reported by the Department of Education.
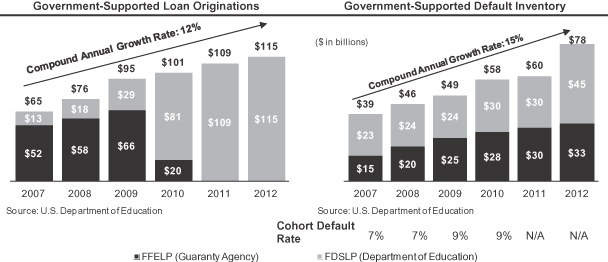
Healthcare
The healthcare industry represents a significant portion of the U.S. GDP. According to CMS, U.S. healthcare spending reached $2.7 trillion in 2011 and is forecast to grow at a 6% annual rate through 2021. In particular, CMS indicates that federal government-related healthcare spending for 2011 totaled approximately $1.2 trillion. This government-related spending included approximately $554 billion for Medicare, which provides a range of healthcare coverage primarily to elderly and disabled Americans, and $408 billion for Medicaid, which provides federal matching funds for states to finance healthcare for individuals at or below the public assistance level.
The tables below show total U.S. healthcare expenditures from 2011 through 2021 and total Medicare spending from 2011 through 2021 as estimated by CMS.
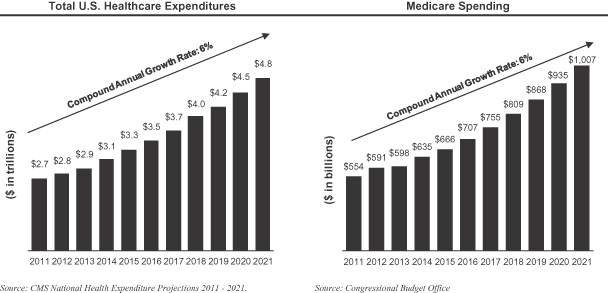
50
Table of Contents
Medicare was initially established as part of the Social Security Act of 1965 and consists of four parts: Part A covers hospital and other inpatient stays; Part B covers hospital outpatient, physician and other services; Part C is known as Medicare Advantage, under which beneficiaries receive benefits through private health plans; and Part D is the Medicare outpatient prescription drug benefit.
Of the $554 billion of 2011 Medicare spending, the Department of Health and Human Services estimated that approximately $43 billion, or 8%, was improper, and it is the federal program with the largest amount of improper payments. Medicare improper payments generally involve incorrect coding, procedures performed which were not medically necessary, incomplete documentation or claims submitted based on outdated fee schedules, among other issues. Likewise, Medicaid improper payments were estimated to be $22 billion, or 5%, of total Medicaid payments for 2011. The following table illustrates the proportion of improper payments among federal programs in the year ended September 30, 2011, according to the Office of Management and Budget.
| Top Federal Programs with Improper Payments in the Year Ended September 30, 2011 |
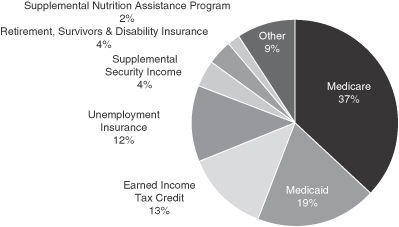
|
| Total = $115 billion |
| (1) | Other includes National School Lunch, Pell Grant and 67 additional programs. |
In accordance with the Medicare Prescription Drug, Improvement, and Modernization Act of 2003, a demonstration program was conducted from March 2005 to March 2008 in six states to determine if the RAC program could be effectively used to identify improper payments for claims paid under Medicare Part A and Part B. Due to the success of this demonstration, under The Tax Relief and Health Care Act of 2006, the U.S. Congress authorized the expansion of the RAC program nationwide. CMS relies on third-party contractors to execute the RAC program to analyze millions of Medicare claims annually for improper payments that have been paid to healthcare providers. The program was implemented by designating one prime contractor in each of the four major regions in the United States: West, Midwest, South, and Northeast.
In addition to government-related healthcare spending, significant growth is expected in the private healthcare market. According to CMS’ National Health Expenditures Projections, the private healthcare market accounted for approximately $1.5 trillion in spending in 2011 and private expenditures are projected to grow more than 5% annually through 2021.
51
Table of Contents
Other Markets
State Tax Market
We believe that the demand for recovery of delinquent state taxes will grow as state governments struggle with revenue generation and face significant budget deficits. According to the Center on Budget and Policy Priorities, an independent think tank, 43 U.S. states faced budget shortfalls totaling $107 billion in the year ended September 30, 2012, with at least 31 states anticipating deficits for fiscal year 2013. The economic recession has led to lower income and sales taxes from both individuals and corporations, reducing overall tax revenues and leading to large budget deficits at the state government level. While many states have received federal aid, most have cut services and increased taxes to help close the budget shortfall and have evaluated outsourcing at least some aspect of delinquent tax recovery.
Federal Agency Market
The federal agency market consists of government debt subrogated to the Department of the Treasury by numerous different federal agencies, comprising a mix of commercial and individual obligations and a diverse range of receivables. These debts are managed by the Department of Financial Management Service, a bureau of the Department of the Treasury, or FMS. Since 1996, the FMS has recovered more than $54 billion in delinquent federal debt. For the year ended September 30, 2011, federal agency recoveries in this market totaled more than $6.2 billion, an increase of more than $700 million over 2010. A significant portion of these collections are processed by private collection firms on behalf of the FMS.
Our Competitive Strengths
We believe that our business is difficult to replicate, as it incorporates a combination of several important and differentiated elements, including:
| • | Scalable and flexible technology-enabled services platform. We have built a proprietary technology platform that is highly flexible, intuitive and easy to use for our recovery and claims specialists. Our platform is easily configurable and deployable across multiple markets and processes. For example, we have successfully extended our platform from the student loan market to the state tax, federal treasury receivables and the healthcare recovery markets, each having its own industry complexities and specific regulations. |
| • | Advanced, technology-enabled workflow processes. Our technology-enabled workflow processes, developed over many years of operational experience in recovery services, disaggregate otherwise complex recovery processes into a series of simple, efficient and consistent steps that are easily configurable and applicable to different types of recovery-related applications. We believe our workflow software is highly intuitive and helps our recovery and claims specialists manage each step of the recovery process, while automating a series of otherwise manually-intensive and document-intensive steps in the recovery process. We believe our streamlined workflow technology drives higher efficiencies in our operations, as illustrated by our ability to generate in excess of $150,000 of revenues per employee during 2012, based on the average number of employees during the year. We believe our streamlined workflow technology also improves recovery results relative to more labor-intensive outsourcing models. |
| • | Enhanced data and analytics capabilities. Our data and analytics capabilities allow us to achieve strong recovery rates for our clients. We have collected recovery-related data for over two decades, which we combine with large volumes of client and third-party data to effectively analyze our clients’ delinquent or defaulted assets and improper payments. We have also developed a number of analytics tools that we use to score our clients’ recovery inventory, determine the optimal recovery process and allocation of resources, and achieve higher levels of recovery results for our clients. In addition, we utilize analytics tools to continuously measure and test our recovery workflow |
| processes to drive refinements and further enhance the quality and effectiveness of our capabilities. |
52
Table of Contents
| Finally, through a strategic investment, we have acquired enhanced data analytics capabilities, which we refer to as Performant Insight. This investment allows us to expand our capabilities into several new areas including the detection of fraud, waste and abuse in various markets and has assisted in our recovery activities for CMS. |
| • | Long-standing client relationships. We believe our long-standing focus on achieving superior recovery performance for our clients and the significant value our clients derive from this focus have helped us achieve long-tenured client relationships, strong contract retention and better access to new clients and future growth opportunities. We have business relationships with 11 of the 31 public sector participants in the student loan market and these relationships average more than 10 years in length, including an approximate 22-year relationship with the Department of Education. In the healthcare market, we have a seven-year relationship with CMS and are currently one of only four prime Medicare RAC contractors. |
| • | Extensive domain expertise in complex and regulated markets. We have extensive experience and domain expertise in providing recovery services for government and private institutions that generally operate in complex and regulated markets. We have demonstrated our ability to develop domain expertise in new markets such as healthcare and state tax and federal Treasury receivables. We believe we have the necessary organizational experience to understand and adapt to evolving public policy and how it shapes the regulatory environment and objectives of our clients. We believe this helps us identify and anticipate growth opportunities. For example, we successfully identified government healthcare as a potential growth opportunity that has thus far led to the award of three contracts to us by CMS. Together with our flexible technology platform, we have the ability to adapt our business strategy, to allocate resources and to respond to changes in our regulatory environment to capitalize on new growth opportunities. |
| • | Proven and experienced management team. Our management team has significant industry experience and has demonstrated strong execution capabilities. Our senior management team, led by Lisa Im, has been with us for an average of approximately 10 years. This team has successfully grown our revenue base and service offerings beyond the original student loan market into healthcare and delinquent state tax and private financial institutions receivables. Our management team’s industry experience, combined with deep and specialized understanding of complex and highly regulated industries, has enabled us to maintain long-standing client relationships and strong financial results. |
Our Growth Strategy
Key elements of our growth strategy include the following:
| • | Expand our student loan recovery volume. According to the Department of Education, total government-supported student loan originations were estimated to be approximately $115 billion in 2012, and have grown at a 11% compound annual growth rate from 2002 through 2012. The balance of defaulted government-supported student loans was estimated to be approximately $78 billion as of September 30, 2012. While we have long-standing relationships with some of the largest participants in the government-supported student loan market, we believe there are significant opportunities within this growing market to increase the volume of student loans placed with us by existing and new clients. For example, under our contract with the Department of Education, we believe there is an opportunity to grow our placement volume through strong performance. Further, as a result of our relationships with five of the seven largest GAs, we believe we are well-positioned to benefit as a result of any consolidation of smaller GAs over the coming years. |
| • | Expand our recovery services in the healthcare market. According to CMS, Medicare spending totaled approximately $554 billion in 2011 and is expected to increase to $1 trillion in 2021, representing a compound annual growth rate of 6%. In the private healthcare market, spending |
53
Table of Contents
| totaled $1.5 trillion in 2011 and is expected to grow more than 6% annually through 2021, according to CMS’ National Health Expenditures Projections. As these large markets continue to grow, we expect the need for recovery services to increase in the public and private healthcare markets. In the public healthcare space, we intend to utilize the experience gained through our contracts with CMS to pursue additional recovery opportunities in areas such as Medicare Secondary Payor Recovery and state Medicaid recovery. In addition, through our enhanced analytics capabilities, we intend to pursue opportunities to find and eliminate losses prior to payment for healthcare services including the detection of fraud, waste and abuse in the public and private healthcare markets. |
| • | Pursue strategic alliances and acquisitions. We intend to selectively consider opportunities to grow through strategic alliances or acquisitions that are complementary to our business. These opportunities may enhance our existing capability or enable us to enter new markets or provide new products or services, such as our licensing of new applied data modeling analytics capabilities that can be used to identify fraudulent or erroneous healthcare claims prior to payment. |
Our Platform
Our technology-enabled services platform is based on over two decades of experience in recovering large amounts of funds on behalf of our clients across several markets. The components of our platform include our data management expertise, analytics capabilities and technology-based workflow processes. Our platform integrates these components to allow us to achieve optimized outcomes for our clients in the form of increased efficiency and productivity and high recovery rates. Our platform and workflow processes are also intuitive and easy to use for our recovery and claims specialists and allow us to increase our employee retention and productivity.
The components of our platform include the following:
Data Management Expertise
Our platform manages and stores large amounts of data throughout the workflow process. This includes both proprietary data we have compiled over two decades as well as third-party data which we can integrate efficiently and in real-time to reduce errors, reduce cycle time processing and, ultimately, improve recovery rates. The strength of our data management expertise augments our analytics capabilities and provides our recovery and claims specialists with powerful workflow processes.
Data Analytics Capabilities
Our data analytics capabilities efficiently screen and allocate massive volumes of recovery inventory. For example, upon receipt of each placement of student loans, we utilize our proprietary algorithms to assist us in determining the most efficient recovery process and the optimal allocation of recovery specialist resources for each loan. In the healthcare market, we analyze millions of Medicare claims to find potential correlations between claims data and improper payments, which enhance our future recovery rates. Across all of our current markets, we utilize our proprietary analytics tools to continuously and rigorously test our workflow processes in real-time to drive greater process efficiency and improvement in recovery rates.
Furthermore, we believe our enhanced analytics capabilities will extend our potential markets, permitting us to pursue significant new business opportunities. We intend to accelerate the use of our data analytics capabilities in the healthcare sector to offer a variety of services from post and pre-payment audit of healthcare claims in both the public and private healthcare sector, to detection of fraud, waste and abuse of healthcare claims, to coordination of benefits and pharmacy fraud detection.
Workflow Processes
Over many years, we have developed and refined our recovery workflow processes, which we believe drive higher efficiency and productivity and reduce our reliance on labor-intensive methods relative to more traditional recovery outsourcing models. We refer to the patented technology that supports our proprietary
54
Table of Contents
workflows as “Smart Bins.” Smart Bins disaggregate otherwise complex recovery processes into a series of simple, efficient and consistent steps that are easily configurable and applicable to different types of recovery-related applications. Our workflow processes integrate a broad range of functions that encompass each stage of a recovery process.
Smart Bins have been designed to be highly intuitive and help our recovery and claims specialists manage each step in the recovery process and enhance their productivity to high levels, regardless of skill differences among specialists. Smart Bins direct specialists toward the most efficient and effective action, or step with respect to the management and recovery of a defaulted student loan, with some input by specialists. Our technology places expert system rules into the workflow engine, allowing employees at different skill levels to manage the more complex work steps that highly experienced workers would perform, while automating document management and compliance functionality as industry regulations and compliance demands change.
The following recovery diagram illustrates how the various components of our platform work together to solve a typical client workflow:
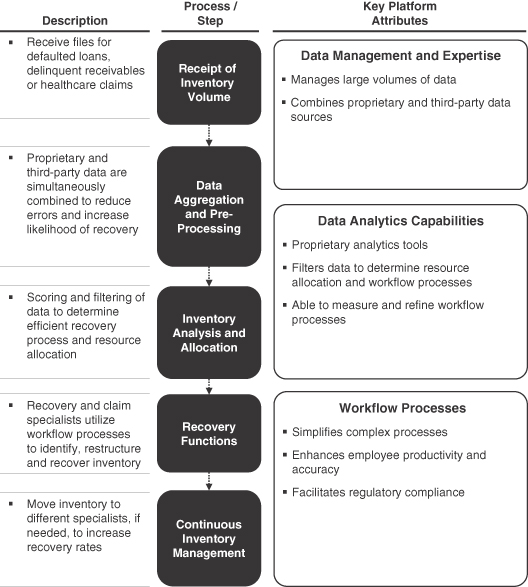
55
Table of Contents
Our Services
We use our technology-enabled services platform to provide recovery and analytics services in a broad range of markets for the identification and recovery of student loans, improper healthcare payments and delinquent state tax and federal treasury receivables. The table below summarizes our recovery services and related analytics capabilities and the markets we serve.
| Recovery Services |
Analytics Capabilities | |||||
| Student Loans | Healthcare | Other Markets | ||||
|
|
| |||||
| •Provide recovery services to the Department of Education, GAs and private institutions
•Identify and track defaulted borrowers across our clients’ portfolios of student loans
•Utilize our proprietary technology, our history of borrower data and our analytics capabilities to rehabilitate and recover past due student loans
•Earn contingent, success-based fees calculated as a percentage of funds that we enable our clients to recover |
•Provide recovery services to identify improper healthcare payments
•Analyze millions of Medicare Parts A and B claims as the prime contractor for recovery services for improper payments in the Northeast region of the United States
•Identify improper payments typically resulting from incorrect coding, procedures that were not medically necessary, incomplete documentation or claims submitted based on outdated fee schedules
•Earn contingent, success-based fees based on a percentage of claim amounts recovered |
•Provide tax recovery services to state and municipal agencies
•Recover government debt for numerous different federal agencies under a contract with the Treasury and provide recovery and audit services for the Department of Education
•Enable financial institutions to proactively manage loan portfolios and reduce the incidence of defaulted loan assets
•Earn contingent, success-based fees calculated as a percentage of the amounts recovered, fees based on dedicated headcount and hosted technology licensing fees |
•Provide claims audit, pharmacy management and coordination of benefits functions for one of the nation’s largest health care organizations
•We use our enhanced data analytics capabilities, which we refer to as Performant Insight, to offer a variety of services from post- and pre-payment audit of healthcare claims to detection of fraud, waste and abuse of healthcare claims, to coordination of benefits and pharmacy fraud detection | |||
Recovery Services
Student Loans
We provide recovery services primarily to the government-supported student loan industry, and our clients include the Department of Education and several of the largest GAs, as well as private financial institutions. We use our proprietary technology to identify, track and communicate with defaulted borrowers on behalf of our clients to implement suitable recovery programs for the repayment of outstanding student loan balances.
Our clients contract with us to provide recovery services for large pools of student loans generally representing a portion of the total outstanding defaulted balances they manage, which they provide to us as “placements” on a periodic basis. Generally, the volume of placements that we receive from our clients is influenced by our performance under our contracts and our ability to recover funds from defaulted student loans,
56
Table of Contents
as measured against the performance of competitors who may service a similar pool of defaulted loans for the same client. To the extent we perform well under our existing contracts and differentiate our services from those of our competitors, we may receive a relatively greater number of student loan placements under these contracts and may improve our ability to obtain future contracts from these clients and other potential clients.
We use algorithms derived from over two decades of experience with defaulted student loans to make reasonably accurate estimates of the recovery outcomes likely to be derived from a placement of defaulted student loans.
We also restructure and recover student loans issued directly by banks to students outside of federal lending programs. These types of loans typically supplement government-supported student loans to meet any shortfall in supply of student loan needs that cannot be met by grants or federal loans. Unlike government-supported student loans, private student loans do not have capped interest rates and, accordingly, involve higher instances of default relative to federally-backed student loans.
Healthcare
We provide recovery services related to improper payments in the healthcare market. In 2009 we were awarded the role as one of four prime RAC contractors in the United States, with exclusive responsibility for the Northeast region. Under our RAC contract, we identify and facilitate the recovery of improper Parts A and B Medicare payments. Our geographical region accounted for approximately 23% of all Medicare spending in 2009 according to CMS. Our relationship with CMS began in 2005 with an initial demonstration contract to recover improper payments for Medicare Secondary Payor claims.
We utilize our technology-enabled services platform to screen Medicare claims against several criteria, including coding procedures and medical necessity standards, to determine whether a claim should be further investigated for recoupment or adjustment by CMS. We conduct automated and, where appropriate, detailed medical necessity reviews. If we determine that the likelihood of finding potential improper payment warrants further investigation, we request and review healthcare provider medical records related to the claim, utilizing experts in Medicare coding and registered nurses. We interact and communicate with healthcare providers and other administrative entities, and ultimately submit the claim to CMS for correction.
To accelerate our ability to provide Medicare audit and recovery services across our region following our award of the RAC contract, we outsource certain aspects of our healthcare recovery process to three different subcontractors. Two of these subcontractors provide a specific service to us in connection with our claims recovery process, and one subcontractor is engaged to provide all of the audit and recovery services for claims within a portion of our region. According to CMS, the geographic area allocated to this subcontractor represented approximately 17% of the total Medicare spending in our region in 2009.
Other Markets
We also provide recovery services to several state and municipal tax authorities, the Department of the Treasury, the Department of Education and a number of financial institutions.
For state and municipal tax authorities, we analyze a portfolio of delinquent tax and other receivables placed with us, develop a recovery plan and execute a recovery process designed to maximize the recovery of funds. In some instances, we have also run state tax amnesty programs, which provide one-time relief for delinquent tax obligations, and other debtor management services for our clients. We currently have relationships with ten state and municipal governments. Delinquent obligations are placed with us by our clients and we utilize a process that is similar to the student loan recovery process for recovering these obligations.
For the Department of the Treasury, we recover government debt subrogated to it by numerous different federal agencies. The placements we are provided represent a mix of commercial and individual obligations. We are one of four contractors for the most recent Treasury contract.
57
Table of Contents
We also provide risk management advisory services that enable these clients to proactively manage loan portfolios and reduce the incidence of defaulted loan assets over time. Our experience suggests that proactive default prevention practices produce significant net yield and earnings gains for our clients. We deliver these services in two forms. First, we contact and consult with borrowers to implement a repayment program, including payment through automatic debit arrangements, prior to the beginning of the repayment period in order to increase the likelihood that payments begin on time. Second, we offer a service that involves contacting delinquent borrowers in an effort to cure the delinquency prior to the loan entering default.
Analytics Capabilities
For several years, we have leveraged our data analytics tools to help filter, identify and recover delinquent and defaulted assets and improper payments as part of our core recovery services platform. Through a strategic investment, we acquired enhanced data analytics capabilities, which we refer to as Performant Insight. Performant Insight added new capabilities in data warehousing and data processing tools that accelerated our ability to review, aggregate, and synthesize very large volumes of structured and unstructured data, at high speeds, from the initial intake of disparate data sources, to the warehousing of the data, to the analysis and reporting of the data. We believe we have built a differentiated, next-generation “end-to-end” data processing solution that will maximize value for current and future customers.
Performant Insight provides numerous benefits for our recovery services platform. Performant Insight has not only enhanced our existing recovery services under our RAC contract by analyzing significantly higher volumes of healthcare claims at faster rates and reducing our cycle time to review and assess healthcare claims, but has also enabled us to develop improved and more sophisticated business intelligence rules that can be applied to our audit processes. We believe our enhanced analytics capabilities will extend our potential markets, permitting us to pursue significant new business opportunities. We intend to accelerate the use of our data analytics capabilities in the healthcare sector to offer a variety of services from post and pre-payment audit of healthcare claims in both the public and private healthcare sector, to detection of fraud, waste and abuse of healthcare claims, to coordination of benefits and pharmacy fraud detection. For example, in February 2013, we announced a strategic relationship to offer recovery services to identify improper coding, billing and payments for the specialty pharmacy customers of Magellan Health Services Inc.
While our revenues from analytics services are limited to date, we believe these services represent a meaningful future opportunity. We currently offer analytics services to one of the largest national healthcare organizations where our analytics services provide real-time financial and operational cost analyses to help support a broad range of compliance and fiscal management functions across the organization, including claims audit, pharmacy management and coordination of benefits. In addition, we are developing strategies to deploy these services in markets other than healthcare.
Our Clients
We provide our services across a broad range of government and private clients in several markets.
Department of Education
We have provided student loan recovery services to the Department of Education for approximately 22 years. We restructure and recover defaulted student loans distributed directly by the Department of Education as part of the FDSLP. Due to its limited resources and recovery capabilities, the Department of Education outsources much of its defaulted student loan portfolio to third-party vendors for recovery. Recovery fees are entirely contingency-based, and our fee for a particular recovery depends on the type of recovery facilitated. We also receive incremental performance incentives based upon our performance as compared to other contractors with the Department of Education, which are comprised of additional inventory allocation volumes and incentive fees. To participate in the Department of Education contracts, firms must follow a highly competitive selection process. For the latest Department of Education contract, the fourth major contract the Department of Education has outsourced to selected vendors, we were selected as one of 17 unrestricted vendors and initiated work on this
58
Table of Contents
contract in the fourth quarter of 2009. Because all federally-supported student loans are being originated by the Department of Education as a result of SAFRA, our relationship with the Department of Education will become increasingly more important over time. The Department of Education was responsible for approximately 14% of our revenues for the year ended December 31, 2012.
In addition, we were awarded a contract in January 2013 with the Department of Education to conduct a payment recapture of goods and services, which excludes grants and student loans, contracted for by the department. Under this contract, we identify, evaluate and report the causes for contract overpayments and provide recovery services to assist the Department of Education in recovering these improper payments.
Guaranty Agencies
We restructure and recover defaulted student loans issued by private lenders and backed by GAs under the FFELP. Despite the transition from FFELP to FDSLP, we believe GA default volumes will continue to rise for several years as there is a lag between originations and defaults of at least three to four years. When a borrower stops making regular payments on a FFELP loan, the GA is obligated to reimburse the lender approximately 97% of the loan’s principal and accrued interest. GAs then seek to recover and restructure these obligations. The GAs with which we contract generally structure one to three-year initial term contracts with multiple renewal periods, and the fees that we receive are generally similar to the fees we receive from the Department of Education contract. For some GA clients, we provide services through MSAs, under which we manage a GA’s entire portfolio of defaulted student loans and, for certain clients, engage subcontractors to provide a portion of the recovery services associated with a GA’s student loan portfolio.
We have a relationship with 11 of the 31 active GAs in the U.S., including Great Lakes Higher Education Guaranty Corporation, American Student Assistance Corporation and American Education Services, each of which was responsible for 18.7%, 12.1% and 10.7%, respectively, of our revenues for the year ended December 31, 2012. We have had relationships with GA clients for over 25 years.
CMS
We have a seven-year relationship with CMS. Under our RAC contract with CMS awarded in 2009, we identify and facilitate the recovery of improper Parts A and B Medicare payments in the Northeast region of the United States and which accounted for approximately 26% of our revenues for the year ended December 31, 2012. The fees that we receive for identifying these improper payments from CMS are entirely contingency-based, and the contingency-fee percentage depends on the methods of recovery, and, in some cases, the type of improper payment that we identify.
U.S. Department of the Treasury
We have assisted the Department of the Treasury for 15 years in the recovery of delinquent receivables owed to a number of different federal agencies. The debt obligations we help to recover on behalf of the Department of the Treasury include commercial and individual debt obligations. We are one of the four firms servicing the current Department of the Treasury contract. Similar to our other recovery contracts, our fees under this contract are contingency-based. We view this as an important strategic relationship, as it provides us valuable insight into other business opportunities within the federal government.
State Tax and Municipal Agencies
We provide outsourced recovery services for individuals’ delinquent state tax and other municipal obligations on a hosted model and under MSAs. We currently have relationships with ten state and municipal governments.
Private Lenders
We provide recovery services for private student loans, that supplement federally guaranteed loans, and home mortgages to private lenders.
59
Table of Contents
Sales and Marketing
Our new business opportunities have historically been driven largely by referrals and natural extensions of our existing client relationships, as well as a targeted outreach by senior management. Our sales cycles are often lengthy, and demand high levels of attention from our senior management. At any point in time, we are typically focused on a limited number of potentially significant new business opportunities. As a result, to date, we have operated with a small staff of experienced individuals with responsibility for developing new sales, relying heavily upon our executive staff, including a Senior Vice President of Sales and Marketing and a sales team covering various markets.
Technology Operations
Our technology center is based in Livermore, California, with a redundant capacity in our Grants Pass, Oregon office. Additionally, Performant Insight, our new data analytics business, is supported by staff in Miami Lakes, Florida. We have designed our infrastructure for scalability and redundancy, which allows us to continue to operate in the event of an outage at either datacenter. We maintain an information systems environment with advanced network security intrusion detection and prevention with 24x7 monitoring and security incident response capabilities. We utilize encryption technologies to protect sensitive data on our systems, all data during transmission and all data on redundancy or backup media. We also maintain a comprehensive enterprise-wide information security system based upon recognized standards, including the NIST800 53 and ISO 27002 Code of Practice for Information Security Program Management, to uphold high security standards needed for the protection of sensitive information.
Competition
We face significant competition in all aspects of our business.
In recovery services for delinquent and defaulted assets, we face competition from a number of companies. Holders of these delinquent and defaulted assets typically engage several firms simultaneously to provide recovery services on different portions of their portfolios. The number of recovery firms engaged varies by client. For example, we are one of 17 unrestricted providers of recovery services on the current Department of Education contract, while some of the GAs may only engage a few recovery vendors at any time. Initially, we compete to be one of the retained firms in a competitive bidding process and, if we are successful, we then face continuing competition from the client’s other retained firms based on the client’s benchmarking of the recovery performance of its several vendors. Clients such as the Department of Education typically will allocate additional placements to those recovery vendors producing the highest recovery rates. We believe that we primarily compete on the basis of recovery rate performance, as well as maintenance of high standards of recovery practices and data security capabilities. We believe that we compete favorably with respect to most of these factors as evidenced by our long-standing relationships with our clients in these markets. Pricing is not usually a major competitive factor as all recovery services vendors in these markets typically receive the same contingency-based fee rate.
In the recovery of improper healthcare payments, we faced a highly competitive process, involving a large number of bidders, to become one of the four prime RAC contractors in the United States. CMS issued a request for quotes in connection with the re-bidding for the RAC contract in February 2013. Although our RAC contract is currently set to expire in 2014, CMS may terminate our RAC contract as early as August 2013 in connection with this re-bidding process. We expect that our competition will include the other three RAC service providers: Health Management Systems, Inc., Connolly Consulting, Inc. and CGI Group. We also may face competition from the subcontractors of the current prime RAC contractors, who may seek to use their experience as subcontractors to become prime contractors, and a variety of healthcare consulting and healthcare information services companies are potential competitors. Some of these potential competitors for the second RAC contract may have greater financial and other resources than we do. According to the request for quotes, the competitive factors for this new RAC contract are demonstrated experience in effective recovery services in the healthcare market, sufficient capacity to address claims volumes, maintenance of high standards of recovery practices,
60
Table of Contents
financial capability to perform under the RAC contract and recovery fee rates. We believe that our seven year relationship with CMS and our related experience in providing recovery services to identify improper payments allows us to compete favorably with respect to many of these factors. We expect that our performance in identifying claims, managing the claims processes under the current RAC contract, and established systems integration with CMS and related Medicare administrative contractors will also be key factors in determining our continued service to CMS.
Government Regulation
The nature of our business requires that we adhere to a complex array of federal and state laws and regulations. These include HIPAA, the FDCPA, the FCRA, and related state laws. We are also governed by a variety of state laws that regulate the collection, use, disclosure and protection of personal information. We have implemented and maintain physical, technical and administrative safeguards intended to protect all personal data and we have processes in place to assist us in complying with applicable laws and regulations regarding the protection of this data. Our compliance efforts include training of personnel and monitoring our systems and personnel.
HIPAA and Related State Laws
Our Medicare recovery business subjects us to compliance with HIPAA and various related state laws that contain substantial restrictions and requirements with respect to the use and disclosure of an individual’s protected health information. HIPAA prohibits us from using or disclosing an individual’s protected health information unless the use or disclosure is authorized by the individual or is specifically required or permitted under HIPAA. Under HIPAA, we must establish administrative, physical and technical safeguards to protect the confidentiality, integrity and availability of electronic protected health information maintained or transmitted by us or by others on our behalf. We are required to notify affected individuals and government authorities of data security breaches involving unsecured protected health information. The Department of Health and Human Services Office of Civil Rights enforces HIPAA privacy violations; CMS enforces HIPAA security violations and the Department of Justice enforces criminal violations of HIPAA. We are subject to statutory penalties for violations of HIPAA.
Most states have enacted patient confidentiality laws that protect against the unauthorized disclosure of confidential medical information, and many states have adopted or are considering further legislation in this area, including privacy safeguards, security standards and data security breach notification requirements. These state laws, if more stringent than HIPAA requirements, are not preempted by the federal requirements, and we must comply with them even though they may be subject to different interpretations by various courts and other governmental authorities. In addition, numerous other state laws govern the collection, dissemination, use, access to and confidentiality of individually identifiable health and healthcare provider information.
Our compliance efforts include the encryption of protected health information that we hold and the development of procedures to detect, investigate and provide appropriate notification if protected health information is compromised. Our employees and contractors receive initial and periodic supplemental training and are tested to ensure compliance. As part of our certification and accreditation process, we must undergo audits by federal agencies as noted below. CMS regularly audits us for, among other items, compliance with their security standards.
Privacy Act of 1974
The Privacy Act of 1974 governs the collection, use, storage, destruction and disclosure of personal information about individuals by a government agency and extends to government contractors who have access to agency records performing services for government agencies. The Act requires maintenance of a code of conduct for employees with access to the agency records addressing the obligations under the Privacy Act, training of employees and discipline procedures for noncompliance. The Act also requires adopting and maintaining appropriate administrative, technical and physical safeguards to insure the security and confidentiality of records and to protect against any anticipated threats or hazards to their security or integrity.
61
Table of Contents
As a contractor to federal government agencies we are required to comply with the Privacy Act of 1974. Our compliance effort includes initial and ongoing training of employees and contractors in their obligations under the Act. In addition we have implemented and maintain physical, technical and administrative safeguards and processes intended to protect all personal data consistent with or exceeding our obligations under the Privacy Act.
Certification, Accreditation and Security
Business services that collect, store, transmit or process information for United States government agencies and organizations are required to undergo a rigorous certification and accreditation process to ensure that they operate at an acceptable level of security risk. As a government contractor, we currently have Authority to Operate, or ATO, licenses from both the Department of Education and CMS.
We maintain a comprehensive enterprise-wide information security system based upon recognized standards, including the NIST800 53 and ISO 27002 Code of Practice for Information Security Program Management, to uphold high security standards needed for the protection of sensitive information. In addition, we hold SSAE – SOC 1 Type II certification, which provides assurance to auditors of third parties that we maintain the necessary controls and procedures to effectively manage third party data. We undergo an independent audit by our government agency clients on the award of the contract and periodically thereafter. We also conduct periodic self-assessments.
Our regulatory compliance group is charged with the responsibility of ensuring our regulatory compliance and security. All our facilities have security perimeter controls with segregated access by security clearance level. The information systems environment maintains advanced network security intrusion detection and prevention with 24x7 monitoring and security incident response capabilities. We utilize encryption technologies to protect sensitive data on our systems, all data during transmission and all data on redundancy or backup media. Employees undergo background and security checks appropriate to their position. This can include security clearances by the Federal Bureau of Investigation. We also maintain compliant disaster recovery and business continuity plans, conduct an annually two table top disaster exercises, conduct routine security risk assessments and maintain a continuous improvement process as part of our security risk mitigation and management activity.
FDCPA and Related State Laws
The FDCPA regulates persons who regularly collect or attempt to collect, directly or indirectly, consumer debts owed or asserted to be owed to another person. Certain of our debt recovery and loan restructuring activities may be subject to the FDCPA. The FDCPA establishes specific guidelines and procedures that debt recovery firms must follow in communicating with consumer debtors, including the time, place and manner of such communications. Further, it prohibits harassment or abuse by debt recovery firms, including the threat of violence or criminal prosecution, obscene language or repeated telephone calls made with the intent to abuse or harass. The FDCPA also places restrictions on communications with individuals other than consumer debtors in connection with the collection of any consumer debt and sets forth specific procedures to be followed when communicating with such third parties for purposes of obtaining location information about the consumer. In addition, the FDCPA contains various notice and disclosure requirements and prohibits unfair or misleading representations by debt recovery firms. Finally, the FDCPA imposes certain limitations on lawsuits to collect debts against consumers.
Debt recovery activities are also regulated at state level. Most states have laws regulating debt recovery activities in ways that are similar to, and in some cases more stringent than, the FDCPA. In addition, some states require debt recovery firms to be licensed.
Our compliance efforts include written procedures for compliance with the FDCPA and related state laws, employee training and monitoring, auditing client calls, periodic review, testing and retraining of
62
Table of Contents
employees, and procedures for responding to client complaints. In all states where we operate, we believe that we currently hold all required state licenses or are exempt from licensing. Violations of the FDCPA may be enforced by the U.S. Federal Trade Commission, or FTC, or by a private action by an individual or class. Violations of the FDCPA are deemed to be an unfair or deceptive act under the Federal Trade Commission Act, which can be punished by fines for each violation. Class action damages can total up to one percent of the net worth of the entity violating the statute. Attorney fees and costs are also recoverable. In the ordinary course of business we are sued for alleged violations of the FDCPA and comparable state laws, although the amounts involved in the disposition of settlement of any such claims have not been significant.
FCRA
We are also subject to the Fair Credit Reporting Act, or FCRA, which regulates consumer credit reporting and which may impose liability on us to the extent that the adverse credit information reported on a consumer to a credit bureau is false or inaccurate. State law, to the extent it is not preempted by the FCRA, may also impose restrictions or liability on us with respect to reporting adverse credit information. Our compliance efforts include initial and ongoing training of employees working with consumer credit reports, monitoring of performance, and periodic review and risk assessments. Violations of FCRA, which are deemed to be unfair or deceptive acts under the Federal Trade Commission Act, are enforced by the FTC or by a private action by an individual or class. Civil actions by consumers may seek damages per violation, with punitive damages, attorneys fees and costs also recoverable. Under the Federal Trade Commission Act, penalties for engaging in unfair or deceptive acts can be punished by fines for each violation.
State Law Compliance and Security Breach Response
Many states impose an obligation on any entity that holds personally identifiable information or health information to adopt appropriate security to protect such data against unauthorized access, misuse, destruction, or modification. Many states have enacted laws requiring holders of personal information to take certain actions in response to data breach incidents, such as providing prompt notification of the breach to affected individuals and government authorities. In many cases, these laws are limited to electronic data, but states are increasingly enacting or considering stricter and broader requirements. Massachusetts has enacted a regulation that requires any entity that holds, transmits or collects certain personal information about its residents to adopt a written data security plan meeting the requirements set forth in the statute. We have implemented and maintain physical, technical and administrative safeguards intended to protect all personal data and have processes in place to assist us in complying with applicable laws and regulations regarding the protection of this data and properly responding to any security incidents. We have adopted a system security plan and security breach incident response plans to address our compliance with these laws.
Intellectual Property
Our intellectual property is a significant component of our business, most notably the intellectual property underlying our proprietary technology-enabled services platform through which we provide our defaulted asset recovery and other services. To protect our intellectual property, we rely on a combination of intellectual property rights, including patents, trade secrets, trademarks and copyrights. We also utilize customary confidentiality and other contractual protections, including employee and third-party confidentiality and invention assignment agreements.
As of December 31, 2012, we had two U.S. patents, both covering aspects of the workflow management systems and methods incorporated into our technology-enabled services platform. These patents will expire in December 2019. We routinely assess appropriate occasions for seeking additional patent protection for those aspects of our platform and other technologies that we believe may provide competitive advantages to our business. We also rely on certain unpatented proprietary expertise and other know-how, licensed and acquired third-party technologies, and continuous improvements and other developments of our various technologies, all intended to maintain our leadership position in the industry.
63
Table of Contents
As of December 31, 2012, we owned five trademarks registered with the U.S. Patent and Trademark office: Performant, Performant Recovery, Performant Technologies, Discovery Analytics and Performant Business Services. We are in the process of registering additional trademarks supporting our business, and we claim common law trademark rights in numerous additional trademarks.
We have registered copyrights covering various copyrighted material relevant to our business. We also have unregistered copyrights in many components of our software systems. We may not be able to use these unregistered copyrights to prevent misappropriation of such content by unauthorized parties in the future; however, we rely on our extensive information technology security measures and contractual arrangements with employees and third-party contractors to minimize the opportunities for any such misuse of this content.
We are not subject to any material intellectual property claims alleging that we infringe, misappropriate or otherwise violate the intellectual property rights of any third party, nor have we asserted any material intellectual property infringement claim against any third party.
Employees
As of December 31, 2012, we had approximately 1,500 full-time employees. None of our employees is a member of a labor union and we consider our employee relations to be good.
Facilities
As of December 31, 2012, we operated five separate office locations throughout the United States. The largest of these facilities is in Livermore, California and serves as our corporate headquarters, as well as a data center and production location. Our Livermore facility represents approximately 50,291 square feet and has a lease expiration of September 2017. We also lease production centers in California, Oregon, Florida and Texas and own a production/data center in Oregon.
We believe that our facilities are adequate for current operations and that additional space will be available as required. See Note 6 to our consolidated financial statements included elsewhere in this prospectus for information regarding our lease obligations.
Legal Proceedings
We are involved in various legal proceedings that arise from our normal business operations. These actions generally derive from our student loan recovery services, and generally assert claims for violations of the Fair Debt Collection Practices Act or similar federal and state consumer credit laws. While litigation is inherently unpredictable, we believe that none of these legal proceedings, individually or collectively, will have a material adverse effect on our financial condition or our results of operations.
64
Table of Contents
Executive Officers and Directors
Our executive officers and directors, and their ages and positions as of March 31, 2012, are as set forth below:
| Name |
Age | Position | ||||
| Lisa C. Im |
48 | Chief Executive Officer and Director | ||||
| Dr. Jon D. Shaver |
62 | Chairman of the Board of Directors | ||||
| Harold T. Leach, Jr. |
54 | Chief Operating Officer | ||||
| Hakan L. Orvell |
55 | Chief Financial Officer | ||||
| John Y. Paik |
44 | Senior Vice President of Sales and Marketing | ||||
| Bruce L. Calvin |
63 | Senior Vice President of Corporate Services | ||||
| Todd R. Ford(1)(3) |
46 | Director | ||||
| Brian P. Golson(2)(3) |
42 | Director | ||||
| William D. Hansen(1)(2) |
53 | Director | ||||
| William C. Kessinger(2)(3) |
46 | Director | ||||
| Jeffrey S. Stein(1)(2)(3) |
48 | Director | ||||
| (1) | Member of the audit committee |
| (2) | Member of the compensation committee |
| (3) | Member of the nominating and governance committee |
Executive Officers
Lisa C. Im has served as our Chief Executive Officer since April 2004 and as a member of our board of directors since January 2004. From 2002 to 2004, she was Managing Director and Chief Financial Officer of our predecessor before the acquisition by Parthenon Capital Partners. Prior to that, Ms. Im was at Bestfoods Corporation, a food products manufacturer, from 1996 to 2002 with a body of experience including general management as well as executive financial positions for various regions of Bestfoods Corporation. Ms. Im received a Bachelor of Business Administration in Marketing from Loma Linda University, and a Masters in Business Administration, Finance from California State University, East Bay. Ms. Im’s experiences and perspectives as our Chief Executive Officer led to the conclusion that she should serve as a member of our board of directors.
Dr. Jon D. Shaver has been Chairman of our board of directors and a director since June 2007. Since 2004, he has served in various board and executive roles in Performant and its subsidiaries. From 2000 to 2004, he was chief operating officer of our predecessor before the acquisition by Parthenon Capital Partners. He was senior executive vice president of Great Lakes Higher Education Corporation from 1999 to 2000, was chief executive officer of EdFund from 1997 to 1999 while also serving as executive director of the California Student Aid Commission from 1995 through 1998. Dr. Shaver received and Associate’s degree from Monroe Community College, Bachelor’s and Master’s degrees from the State University of New York at Brockport, a Doctor of Education degree from the University of California, Los Angeles, and a Master’s degree in Business Administration from Pepperdine University. Dr. Shaver’s role as our Chairman benefits from his extensive expertise in educational finance, public policy development in education finance, tax policy, healthcare payment integrity, and federal and state government relations, and led to the conclusion the he should serve as a member of our board of directors. He is a board leadership fellow of the National Association of Corporate Directors.
Harold T. Leach, Jr. has served as Chief Operating Officer of the Company and our predecessor since May 1982. In this role, Mr. Leach was a key participant in the development of our recovery processes. He also serves as a director of each of our subsidiary corporations. Mr. Leach is responsible for operational strategy,
65
Table of Contents
production, and technology across all of our businesses. During his tenure, Mr. Leach led the development of our proprietary technology platform and has served as subject matter expert on key Congressional initiatives related to improving the efficacy of government debt management. Mr. Leach also led the development and implementation of our audit and recovery technology operations.
Hakan L. Orvell has served as our Chief Financial Officer since November 2006. He is responsible for the company’s corporate finance, accounting, financial planning and analysis. Mr. Orvell has over 20 years of experience from various industries and previous experience includes service as chief financial officer of Neopost, Inc., a manufacturer of office equipment. He has also held various financial leadership positions with Corporate Express (currently known as Staples), a large business-to-business distributor of office and computer products, including vice president and controller in both a division and regional capacity. He received his Certified Public Accountant accreditation in Illinois and received an MBA from the University of Stockholm.
John Y. Paik has been our Senior Vice President of Sales and Marketing since November 2011. From November 2007 to November 2011, Mr. Paik held various leadership positions at Pfizer Inc., including Vice President, Customer Marketing and Innovation across all global business units for account management and sales. Prior to that, Mr. Paik served in various capacities at Aetna, Inc. including vice president, head of strategic marketing and planning for national businesses and vice president, head of strategic marketing, national accounts from April 2004 to October 2007. Mr. Paik received his Bachelor’s degree in Biology from the University of Pennsylvania.
Bruce L. Calvin has served as our Senior Vice President of Corporate Services since August 2007 and also serves as our Compliance Officer. From April 2007 to August 2007, Mr. Calvin served as our Vice President of Human Resources. Mr. Calvin has over 30 years of administration and global business management experience. He holds a Bachelor’s degree in Business Administration from Troy University and a J.D. from John F. Kennedy University School of Law.
Board of Directors
Todd R. Ford has served as a member of our board of directors since October 2011. Since June 2012, Mr. Ford has served as the co-chief executive officer and chief operating officer of IntelliBatt, Inc. Mr. Ford has also served as the managing director of Broken Arrow Capital, a venture capital firm, since he founded the firm in July 2007. From December 2002 to May 2007, Mr. Ford held various leadership positions at Rackable Systems, Inc., a manufacturer of server and storage products for large-scale data center deployments that subsequently changed its name to Silicon Graphics International Corp., including president and chief financial officer. Mr. Ford received a Bachelor’s degree in Accounting from Santa Clara University. Mr. Ford’s executive experience with public companies, as well as his expertise in growing technology companies, provides valuable insight for the members of our board of directors.
Brian P. Golson has served as a member of our board of directors since January 2008. Since February 2002, Mr. Golson has served as the managing partner of Parthenon Capital Partners. Mr. Golson received a Bachelor’s degree in Economics from the University of North Carolina, Chapel Hill and an M.B.A. from Harvard University. Mr. Golson’s investment experience provides valuable insight for the members of our board of directors.
William D. Hansen has served as a member of our board of directors since December 2011. Since July 2011, Mr. Hansen has served as the chief executive officer of Madison Education Group, LLC, an education-related consulting firm. From July 2009 to December 2010, he served as the president of Scantron Corporation, a provider of assessment and survey solutions. Mr. Hansen also served as the chairman of Scantron Corporation from September 2010 to July 2011. Prior to that, Mr. Hansen held various leadership positions at Chartwell Education Group, LLC, an education-related consulting firm, from July 2005 to July 2009, including chief executive officer and senior managing director. Mr. Hansen served as the Deputy Secretary at the United States Department of Education from May 2001 to July 2003. Mr. Hansen also serves on the board of
66
Table of Contents
directors of First Marblehead Corporation, a student loan company. Mr. Hansen received a Bachelor’s degree in Economics from George Mason University. Mr. Hansen’s extensive experience in the education market provides valuable insight for the members of our board of directors.
William C. Kessinger has served as a member of our board of directors since October 2003. Since October 2001, Mr. Kessinger has served as the managing partner, chief investment officer, of Parthenon Capital Partners. He has concurrently served as the managing partner of Vformation LLC, a venture capital fund, since June 2009. He received Bachelor’s and Master’s degrees in industrial engineering from Stanford University and an MBA from Harvard University. Mr. Kessinger’s investment experience provides valuable insight for the members of our board of directors.
Jeffrey S. Stein has served as a member of our board of directors since January 2004. Since September 2002, Mr. Stein has served as the Executive in Residence at Parthenon Capital Partners. Mr. Stein received a Bachelor’s degree in Accounting from Boston College Carroll School of Management. Mr. Stein’s financial and accounting expertise provides valuable insight for the members of our board of directors.
Board Composition
Our amended and restated certificate of incorporation provides that our board shall consist of not fewer than five and not more than fifteen directors as the board of directors may from time to time determine. Our board of directors currently consists of seven directors. The authorized number of directors may be changed by resolution of our board of directors. Vacancies on our board of directors can be filled by resolution of our board of directors. Our board of directors is currently divided into three classes, each serving staggered, three-year terms:
| • | Our Class I directors are Todd R. Ford and Brian P. Golson and their terms will expire at our annual meeting of stockholders in 2013; |
| • | Our Class II directors are Jon D. Shaver and William D. Hansen and their terms will expire at our annual meeting of stockholders in 2014; and |
| • | Our Class III directors are Lisa C. Im, Jeffrey S. Stein and William C. Kessinger and their terms will expire at our annual meeting of stockholders in 2015. |
As a result, only one class of directors will be elected at each annual meeting of stockholders, with the other classes continuing for the remainder of their respective terms.
Our board of directors has determined that Mr. Ford and Mr. Hansen are “independent directors” as defined under the rules of NASDAQ.
We previously availed ourselves of the “controlled company” exception under the NASDAQ rules that exempted us from certain requirements, including the requirements that we have a majority of independent directors on our board of directors and that we have compensation and nominating and governance committees composed entirely of independent directors. We ceased to be a “controlled company” on February 5, 2013. In accordance with the phase-in provisions under the NASDAQ rules, we will no longer be exempted from such requirements on the one year anniversary of the date on which we were no longer a “controlled company.” In addition, we remain subject to the requirement that we have an audit committee of at least three members composed entirely of independent directors by the first anniversary of our initial public offering that was completed in August 2012.
In July 2012, we entered into a Director Nomination Agreement with Parthenon Capital Partners that provides Parthenon Capital Partners the right to designate nominees for election to our board of directors for so long as Parthenon Capital Partners owns 10% or more of the total number of shares of common stock
67
Table of Contents
outstanding. The number of nominees that Parthenon Capital Partners is entitled to designate under this agreement shall bear the same proportion to the total number of members of our board of directors as the number of shares of common stock beneficially owned by Parthenon Capital Partners bears to the total number of shares of common stock outstanding, rounded up to the nearest whole number. In addition, Parthenon Capital Partners shall be entitled to designate the replacement for any of its board designees whose board service terminates prior to the end of the director’s term regardless of Parthenon Capital Partners’ beneficial ownership at such time. Parthenon Capital Partners shall also have the right to have its designees participate on committees of our board of directors proportionate to its stock ownership, subject to compliance with applicable law and stock exchange rules. This agreement will terminate at such time as Parthenon Capital Partners owns less than 10% of our outstanding common stock.
Board Committees
Audit Committee
Our audit committee consists of Messrs. Hansen, Ford and Stein. Mr. Ford serves as the chairperson of this committee. Our board of directors has determined that Mr. Ford is an audit committee financial expert, as defined by the rules promulgated by the Securities and Exchange Commission, or the SEC. Pursuant to the phase-in provisions of the NASDAQ rules and Rule 10A-3 promulgated by the SEC under the Exchange Act, our audit committee is composed of three directors, of which two are independent. By August 15, 2013, our audit committee will have at least three members, all of whom will be independent.
Our audit committee provides assistance to the board of directors in fulfilling its legal and fiduciary obligations in matters involving our accounting, auditing, financial reporting, internal control and legal compliance functions by approving the services performed by our independent registered public accounting firm and reviewing their reports regarding our accounting practices and systems of internal accounting controls. The audit committee also oversees the audit efforts of our independent registered public accounting firm and takes those actions as it deems necessary to satisfy itself that the independent registered public accounting firm is independent of management.
Compensation Committee
Our compensation committee consists of Messrs. Golson, Hansen, Kessinger and Stein. Mr. Hansen serves as chairperson of this committee. Our compensation committee determines our general compensation policies and the compensation provided to our directors and officers. The compensation committee also reviews and determines bonuses for our officers and other employees. In addition, the compensation committee reviews and determines equity-based compensation for our directors, officers, employees and consultants and administers our stock option plans and employee stock purchase plan. We currently rely on certain phase-in provisions available under the NASDAQ rules that exempt us until February 5, 2014 from the requirement that we have a compensation committee composed entirely of independent directors.
Nominating and Governance Committee
Our nominating and governance committee consists of Messrs. Ford, Golson, Kessinger and Stein. Mr. Golson serves as chairperson of this committee. The nominating and governance committee is responsible for making recommendations to the board of directors regarding candidates for directorships and the size and composition of the board. In addition, the nominating and governance committee is responsible for overseeing our corporate governance guidelines and reporting and making recommendations to the board of directors concerning corporate governance matters. We currently rely on certain phase-in provisions available under the NASDAQ rules that exempt us until February 5, 2014 from the requirement that we have a nominating and governance committee composed entirely of independent directors.
68
Table of Contents
Role of Our Board of Directors in Risk Oversight
One of the key functions of our board of directors is informed oversight of our risk management process. Our board of directors administers this oversight function directly through our board of directors as a whole, as well as through various standing committees of our board of directors that address risks inherent in their respective areas of oversight. In particular, our board of directors is responsible for monitoring and assessing strategic risk exposure, and our audit committee has the responsibility to consider and discuss with management our major financial risk exposures and the steps our management has taken to monitor and control these exposures. The audit committee also has the responsibility to oversee management’s assessment of major legal and regulatory risk exposures and management’s implementation of policies and procedures to address these risks. Our nominating and governance committee is responsible for periodically evaluating the Company’s risk management process and system in light of the material risks that the Company faces and the adequacy of the Company’s policies and procedures designed to address risk. Our compensation committee assesses and monitors whether any of our compensation policies and programs are reasonably likely to have a material adverse effect on the Company.
Compensation Committee Interlocks and Insider Participation
No interlocking relationship exists between our board of directors or compensation committee and the board of directors or compensation committee of any other entity, nor has any interlocking relationship existed in the past.
Director Compensation
The table below summarizes the compensation paid by the Company to our non-employee directors for the fiscal year ended December 31, 2012. Messrs. Golson, Kessinger and Stein did not receive compensation paid by the Company for service as a director in the fiscal year ended December 31, 2012.
| Name | Fees Earned or Paid in Cash |
Option Awards |
Total | |||||||||
| William D. Hansen |
$ | 26,000 | — | $ | 26,000 | |||||||
| Todd R. Ford |
$ | 28,500 | — | $ | 28,500 | |||||||
Executive Compensation
Compensation Philosophy and Objectives
Our compensation philosophy is to align executive compensation with the interests of our stockholders and therefore to financial objectives that our board of directors believes are primary determinants of long-term stockholder value. The primary goal of our executive compensation program is to ensure that we hire and retain talented and experienced executives who are motivated to achieve or exceed our short-term and long-term corporate goals. Our executive compensation programs are designed to reinforce a strong pay-for-performance orientation and to serve the following purposes:
| • | to reward our named executive officers for sustained financial and operating performance and leadership excellence; |
| • | to align their interests with those of our stockholders; and |
| • | to encourage our named executive officer to remain with us for the long-term. |
69
Table of Contents
Elements of Compensation
Base Salary
We pay our named executive officers a base salary based on the experience, skills, knowledge and responsibilities required of each officer. We believe base salaries are an important element in our overall compensation program because base salaries provide a fixed element of compensation that reflects job responsibilities and value to us.
Annual Incentive Plan
To date, our board of directors has not adopted a formal plan or set of formal guidelines with respect to annual incentive or bonus payments, and has rather relied on an annual assessment of the performance of our executives during the preceding year to make annual incentive and bonus determinations. In connection with our efforts to formalize our compensation practices, our board of directors intends to adopt an annual incentive plan to which our named executive officers will be eligible to participate. Our board of directors may retain the discretion to pay any amounts due under such incentive plan in cash or equity or a combination of both.
Long-Term Equity Compensation
Prior to our initial public offering in August 2012, we provided our named executive officers with long-term equity compensation through our 2004 Equity Incentive Plan, 2004 Stock Option Plan and 2007 Stock Option Plan. In July 2012, we adopted a new equity incentive plan, our 2012 Stock Incentive Plan, under which all current equity compensation to our named executive officers is awarded. We believe that providing our named executive officers with an equity interest brings their interests in line with those of our stockholders and that including a vesting component to those equity interests encourages named executive officers to remain with us for the long-term.
Other Supplemental Benefits
Our named executive officers are eligible for the following benefits on a similar basis as other eligible employees:
| • | health, dental and vision insurance; |
| • | vacation, personal holidays and sick days; |
| • | life insurance and supplemental life insurance; |
| • | short-term and long-term disability; and |
| • | 401(k) plan. |
Summary Compensation Table
The following table presents information concerning the total compensation of our named executive officers, or Named Executive Officers, for services rendered to us in all capacities for the fiscal years ended December 31, 2012 and 2011:
| Name and Principal Position |
Year | Salary | Bonus | Option Awards(2) |
All other Compensation |
Total | ||||||||||||||||||
| Lisa C. Im |
2012 | $ | 401,543 | $ | 444,444 | (1)(2) | $ | 4,189,410 | $ | 1,197,337 | (3) | $ | 6,232,734 | |||||||||||
| Chief Executive Officer |
2011 | $ | 400,005 | $ | 128,000 | — | $ | 21,807 | (4) | $ | 549,812 | |||||||||||||
| Dr. Jon D. Shaver |
2012 | $ | 336,745 | $ | 65,000 | $ | 1,396,472 | $ | 615,092 | (5) | $ | 2,348,309 | ||||||||||||
| Chairman of the Board of Directors |
2011 | $ | 325,014 | $ | 119,000 | — | $ | 27,758 | (6) | $ | 471,772 | |||||||||||||
| Harold T. Leach, Jr. |
2012 | $ | 352,694 | $ | 222,222 | (1)(2) | $ | 1,396,472 | $ | 24,024 | (7) | $ | 1,995,412 | |||||||||||
| Chief Operating Officer |
2011 | $ | 350,002 | $ | 120,000 | — | $ | 23,811 | (8) | $ | 493,813 | |||||||||||||
70
Table of Contents
| (1) | Ms. Im and Mr. Leach received options to purchase 60,000 and 30,000 shares, respectively, of our common stock in lieu of a cash bonus for services rendered in 2012. |
| (2) | The value of the equity awards is based on the fair value of the award as of the grant date calculated in accordance with Accounting Standards Codification 718, Stock Compensation (ASC 718), excluding any estimate of future forfeitures. Regardless of the value on the grant date, the actual value that may be recognized by the executive officers will depend on the market value of our common stock on a date in the future when a stock award vests or a stock option is exercised. |
| (3) | Includes payments for vehicle allowance ($18,000), life insurance benefits ($5,096) and an amount paid pursuant to a deferred compensation agreement entered into in connection with the acquisition of the company by Parthenon Capital Partners ($1,174,241). |
| (4) | Includes payments for vehicle allowance ($18,000) and life insurance benefits ($3,807). |
| (5) | Includes payments for vehicle allowance ($20,400), life insurance benefits ($7,571) and an amount paid pursuant to a deferred compensation agreement entered into in connection with the acquisition of the company by Parthenon Capital Partners ($587,121). |
| (6) | Includes payments for vehicle allowance ($20,400) and life insurance benefits ($7,358). |
| (7) | Includes payments for vehicle allowance ($20,400) and life insurance benefits ($3,624). |
| (8) | Includes payments for vehicle allowance ($20,400) and life insurance benefits ($3,411). |
Outstanding equity awards at fiscal year-end
The following table presents certain plan information of equity awards held by our Named Executive Officers as of December 31, 2012:
| Name |
Number of Securities Underlying Unexercised Options – Exercisable |
Number of Securities Underlying Unexercised Options – Unexercisable |
Exercise Price of Options ($/share) |
Expiration Date of Options | ||||||||||
| Lisa C. Im |
356,250 | — | 0.500 | 01/08/2014 | ||||||||||
| 131,250 | — | 0.500 | 01/25/2018 | |||||||||||
| 69,817 | (1) | 1,183 | 0.500 | 01/25/2018 | ||||||||||
| 130,000 | (1) | 70,000 | 1.175 | 09/15/2019 | ||||||||||
| — | 824,687 | 10.600 | 08/10/2022 | |||||||||||
| Dr. Jon D. Shaver |
375,000 | — | 0.500 | 01/08/2014 | ||||||||||
| 700,000 | (1) | — | 0.500 | 10/17/2017 | ||||||||||
| — | 274,896 | 10.600 | 08/10/2022 | |||||||||||
| Harold T. Leach, Jr. |
280,000 | (1) | — | 0.500 | 10/17/2017 | |||||||||
| 130,000 | (1) | 70,000 | 1.175 | 09/15/2019 | ||||||||||
| — | 274,896 | 10.600 | 08/10/2022 | |||||||||||
| (1) | The option award vests as to 1/5th of the total number of shares subject to the option 12 months after the vesting commencement date, and the remaining shares vest at a rate of 1/60th of the total number of shares subject to the option each month thereafter. |
Employment Agreements
The section below describes the employment agreements that we have entered into with our Chief Executive Officer and the Chairman of our board of directors, as well as the form of employment agreement that each of our other executive officers entered into.
Lisa C. Im
We entered into an employment agreement with Lisa C. Im, our Chief Executive Officer, on April 2, 2002, and this agreement has been subsequently amended. As amended, the agreement grants Ms. Im a salary of $33,333 per month, as well as employee benefits including a life insurance plan. This agreement also contains confidential information and invention assignment provisions.
In connection with the acquisition of the Company by Parthenon Capital Partners, Ms. Im entered into a deferred compensation agreement pursuant to which Ms. Im received a payment of $1,174,241 upon the filing of the registration statement for our initial public offering.
71
Table of Contents
Dr. Jon D. Shaver
We entered into employment agreements with Dr. Jon D. Shaver, our Chairman of our board of directors on March 31, 2003 and this agreement has subsequently been amended. As amended, this agreement grants Dr. Shaver a salary of $18,750 per month and additional salary payments of $25,000 per quarter, as well as employee benefits including a life insurance plan. This agreement also contains confidential information and invention assignment provisions and also provides Mr. Shaver a severance payment of $100,000 if he is terminated without cause.
In connection with the acquisition of the Company by Parthenon Capital Partners, Dr. Shaver entered into a deferred compensation agreement pursuant to which Dr. Shaver received a payment of $587,121 upon the filing of the registration statement for our initial public offering.
Employment Agreements
Each of our named executive officers, other than our Chief Executive Officer and our Chairman of the board of directors, has entered into our standard employment agreement. Our standard employment agreement provides for the named executive officer’s initial salary at the time of the agreement and grants the named executive officer the right to participate in our standard benefit plans. This agreement also contains confidential information and invention assignment provisions and does not provide for severance.
Potential Payments Upon Change of Control
We have also entered into change of control agreements with Ms. Im and Mr. Shaver. These agreements, as amended, provide that upon a triggering termination which follows a change of control by no more than two years, each executive is entitled to receive payment equal to his or her highest annual salary in effect during any period of 12 consecutive months within the 60 months immediately preceding the date of the triggering termination. As of December 31, 2012, this amount would be equal to $400,005 and $325,014 for Ms. Im and Mr. Shaver, respectively.
For purposes of these agreements:
| • | A Change of control occurs (i) if any person or group becomes the beneficial owner of 50% of the voting securities, (ii) if certain changes of the individuals who constitute the board of directors occur during any period of two consecutive years, or (iii) upon consummation of a reorganization, merger or consolidation unless certain conditions are met. |
| • | Triggering termination is defined as the executive’s termination for any reason other than (i) the executive’s death, (ii) the executive’s disability that entitles the executive to receive long-term disability benefits from the Company, (iii) the retirement of the executive after the age of 65, (iv) the executive’s termination for cause, or (v) the executive terminates his or her employment for good reason. |
| • | Cause is defined as (i) the criminal conviction of an embezzlement from the Company, (ii) the violation of a felony committed in connection with employment, (iii) the willful refusal to perform the reasonable duties of his or her position with the Company, (iv) the willful violation of the policies of the Company which is determined in good faith by the board of directors to be materially injurious to the employees, directors, property, or financial condition of the Company, or (v) the willful violation of the provisions of a confidentiality or non-competition agreement with the Company. |
| • | Good reason is defined as (i) a reduction in the executive’s salary that was in effect immediately prior to a change of control, (ii) the relocation of the Company’s office that would add 15 miles or more to the executive’s commute, or (iii) if the Company reduces certain benefits or vacation days that the executive received prior to the change of control. |
72
Table of Contents
Retirement Plans
Except as described below, we currently have no plans that provide for the payment of retirement benefits, or benefits that will be paid primarily following retirement, including but not limited to tax-qualified defined benefit plans, supplemental executive retirement plans, tax-qualified defined contribution plans and nonqualified defined contribution plans.
We do maintain a 401(k) plan that is tax-qualified for our employees, including its executive officers. We do not offer employer matching or other employer contribution to the 401(k) plan.
Employee Benefit Plans
2004 Equity Incentive Plan
Our board of directors adopted our 2004 Equity Incentive Plan, which provides for the grant of options. As of December 31, 2012, options to purchase a total of 995,653 shares of common stock were outstanding thereunder. Our 2004 Equity Incentive Plan was terminated on the completion of our initial public offering in August 2012. No shares of our common stock will remain available under our 2004 Equity Incentive Plan other than for satisfying exercises of stock options granted under this plan prior to termination.
2004 Stock Option Plan
Our board of directors adopted our 2004 Stock Option Plan, which provides for the grant of options. As of December 31, 2012, options to purchase a total of 731,250 shares of common stock were outstanding thereunder. Our 2004 Stock Option Plan was terminated on the completion of our initial public offering in August 2012. No shares of our common stock are available under our 2004 Stock Option Plan other than for satisfying exercises of stock options granted under this plan prior to termination.
2007 Stock Option Plan
Our board of directors adopted our 2007 Stock Option Plan, which provides for the grant of options. As of December 31, 2012, options to purchase 2,435,364 shares of common stock were outstanding thereunder. Our 2007 Stock Option Plan was terminated on the completion of our initial public offering in August 2012. No shares of our common stock are available under our 2007 Stock Option Plan other than for satisfying exercises of stock options granted under this plan prior to termination.
2012 Stock Incentive Plan
General
Our board of directors and stockholders approved our 2012 Stock Incentive Plan in July 2012. Our 2012 Stock Incentive Plan became effective on August 10, 2012 and will expire on July 19, 2022, unless extended by approval of our board of directors and our stockholders.
Our 2012 Stock Incentive Plan provides for the granting of incentive stock options within the meaning of Section 422 of the Code to employees and the granting of nonstatutory stock options, restricted stock, stock appreciation rights, stock unit awards and cash-based awards to employees, non-employee directors and consultants. Awards under our 2012 Stock Incentive Plan may be subject to performance goals and other terms in order to qualify as “performance based compensation” under Section 162(m) of the Code.
Administration
Our board of directors may elect to act as the plan administrator of our 2012 Stock Incentive Plan but may also elect to appoint a committee to administer our 2012 Stock Incentive Plan. The administration of our 2012 Stock Incentive Plan includes the determination of the recipient of an award, the number of shares subject to each award, whether an option is to be classified as an incentive stock option or nonstatutory option, and the terms and conditions of each award, including the exercise and purchase prices and the vesting or duration of the award.
73
Table of Contents
At the discretion of our board of directors, if appointed this committee would consist solely of two or more “non-employee directors.” To the extent required by our board of directors, the composition of this committee would satisfy the requirements for plans intended to qualify for exemption under Rule 16b-3 of the Exchange Act and Section 162(m) of the Code. Our board of directors may appoint one or more separate committees of our board of directors, each consisting of one or more members of our board of directors, to administer our 2012 Stock Incentive Plan with respect to employees who are not subject to Section 16 of the Exchange Act. Subject to applicable law, our board of directors may also authorize one or more officers to designate employees, other than employees who are subject to Section 16 of the Exchange Act, to receive awards under our 2012 Stock Incentive Plan or determine the number of such awards to be received by such employees subject to limits specified by our board of directors.
Authorized shares
Under our 2012 Stock Incentive Plan, we reserved 4,300,000 shares of our common stock. The number of shares of our common stock that may be delivered in the aggregate pursuant to the exercise of incentive stock options under Section 422 of the Code granted under our 2012 Stock Incentive Plan will not exceed 4,300,000.
In addition, if awards are forfeited or terminate for any reason before being exercised or settled, or an award is settled in cash without the delivery of shares to the holder, then any shares subject to the award shall again become available for awards under our 2012 Stock Incentive Plan. Only the number of shares (if any) actually issued in settlement of awards (and not forfeited) shall reduce the number available and the balance shall again become available for awards under our 2012 Stock Incentive Plan. Any shares withheld to satisfy the grant or exercise price or tax withholding obligation pursuant to any award shall again become available for awards under our 2012 Stock Incentive Plan. However, shares that have actually been issued shall not again become available for awards, except for shares that are forfeited and do not become vested.
With respect to awards intended to qualify as “performance-based compensation” under Section 162(m) of the Code, no participant may receive options or stock appreciation rights that relate to an aggregate of more than 2,000,000 shares in any calendar year, or performance based restricted stock or stock unit awards that relate to an aggregate of more than 2,000,000 shares in any calendar year, and the maximum aggregate amount of cash that may be payable under cash-based performance awards granted to a participant in any calendar year is $10,000,000.
Stock options
A stock option is the right to purchase a certain number of shares of stock, at a certain exercise price, in the future. Under our 2012 Stock Incentive Plan, incentive stock options and nonstatutory options must be granted with an exercise price of at least 100% of the fair market value of our common stock on the date of grant, subject to limited exceptions. Incentive stock options granted to any holder of more than 10% of the voting shares of our company must have an exercise price of at least 110% of the fair market value of our common stock on the date of grant. No incentive stock option can be granted to an employee if as a result of the grant, the employee would have the right in any calendar year to exercise for the first time one or more incentive stock options for shares having an aggregate fair market value in excess of $100,000. The stock option agreement specifies the date when all or any installment of the option is to become exercisable. Each stock option agreement sets forth the term of the options, which is prohibited from exceeding 10 years (five years in the case of an incentive stock option granted to any holder of more than 10% of our voting shares), and the extent to which the optionee will have the right to exercise the option following termination of the optionee’s service with the company. Payment of the exercise price may be made in cash or cash equivalents or, if provided for in the stock option agreement evidencing the award, (a) by surrendering, or attesting to the ownership of, shares which have already been owned by the optionee, (b) by delivery of an irrevocable direction to a securities broker to sell shares and to deliver all or part of the sale proceeds to us in payment of the aggregate exercise price, (c) by delivery of an irrevocable direction to a securities broker or lender to pledge shares and to deliver all or part of the loan proceeds to us in payment of the aggregate exercise price, (d) by a “net exercise” arrangement, (e) by delivering a full-recourse promissory note or (f) by any other form that is consistent with applicable laws, regulations and rules.
74
Table of Contents
Restricted stock
Restricted stock is a share award that may be subject to vesting conditioned upon continued service, the achievement of performance objectives or the satisfaction of any other condition as specified in a restricted stock agreement. Participants who are granted restricted stock awards generally have all of the rights of a stockholder with respect to such stock, other than the right to transfer such stock prior to vesting. Subject to the terms of our 2012 Stock Incentive Plan, the plan administrator will determine the terms and conditions of any restricted stock award, including any vesting arrangement, which will be set forth in a restricted stock agreement to be entered into between us and each recipient. Restricted stock may be awarded for such consideration as the plan administrator may determine, including without limitation cash, cash equivalents, full-recourse promissory notes, future services or services rendered prior to the award, without cash payment by the recipient.
Stock units
Stock units give recipients the right to acquire a specified number of shares of stock at a future date upon the satisfaction of certain conditions, including any vesting arrangement, established by the plan administrator and as set forth in a stock unit agreement. Unlike restricted stock, the stock underlying stock units will not be issued until the stock units have vested and are settled, and recipients of stock units generally will have no voting or dividend rights prior to the time the vesting conditions are satisfied and the award is settled. However, at the discretion of the plan administrator, any stock unit may entitle the holder to be credited with an amount equal to all cash dividends paid on one share of our common stock while the stock unit is outstanding. The plan administrator may elect to settle vested stock units in cash or in common stock or in a combination of cash and common stock. Subject to the terms of our 2012 Stock Incentive Plan, the plan administrator will determine the terms and conditions of any stock unit award, which will be set forth in a stock unit agreement to be entered into between us and each recipient.
Stock appreciation rights
Stock appreciation rights typically will provide for payments to the recipient based upon increases in the price of our common stock over the exercise price of the stock appreciation right. The exercise price of a stock appreciation right will be determined by the plan administrator, which shall not be less than the fair market value of our common stock on the date of grant. The plan administrator may elect to pay stock appreciation rights in cash or in common stock or in a combination of cash and common stock.
Cash-based awards
Cash-based awards shall specify a cash-denominated payment amount, formula or payment rages as determined by the board of directors. Payment, if any, shall be made in accordance with the terms of the cash-based award and may be made in cash or in shares of common stock. The plan administrator may elect to grant cash-based awards in such number or amount and upon such terms as the board of directors shall determine.
Other plan features
Under our 2012 Stock Incentive Plan:
| • | Unless the agreement evidencing an award expressly provides otherwise, no award granted under the plan may be transferred in any manner (prior to the vesting and lapse of any and all restrictions applicable to shares issued under such award), other than by will or the laws of descent and distribution. |
| • | In the event of a recapitalization, stock split or similar capital transaction, the plan administrator will make appropriate and equitable adjustments to the number of shares reserved for issuance under our 2012 Stock Incentive Plan, including the limitation regarding the total number of shares underlying incentive stock option awards and the limitations on awards given to an individual participant in any calendar year and other adjustments in order to preserve the benefits of outstanding awards under our 2012 Stock Incentive Plan. |
75
Table of Contents
| • | Generally, if we merge with or into another corporation, we will provide for full exercisability or vesting and accelerated expiration of outstanding awards or settlement of the intrinsic value of the outstanding awards in cash or cash equivalents followed by cancellation of such awards unless the awards are continued if we are the surviving entity, or assumed or substituted for by any surviving entity or a parent or subsidiary of the surviving entity. |
| • | If we are involved in an asset acquisition, stock acquisition, merger or similar transaction with another entity, the plan administrator may make awards under our 2012 Stock Incentive Plan by the assumption, substitution or replacement of awards granted by another entity. The terms of such assumed, substituted or replaced awards will be determined by the plan administrator in its discretion. |
| • | Awards under our 2012 Stock Incentive Plan may be made subject to the attainment of performance criteria including cash flows, earnings per share, earnings before interest, taxes and amortization, return on equity, total stockholder return, share price performance, return on capital, return on assets or net assets, revenues, income or net income, operating income or net operating income, operating profit or net operating profit, operating margin or profit margin, return on operating revenues, return on invested capital, market segment shares, costs, expenses, regulatory body approval for commercialization of a product or implementation or completion of critical projects. |
| • | Our 2012 Stock Incentive Plan terminates on July 19, 2022, unless terminated earlier by our board of directors. Our board of directors may amend or terminate the plan at any time, subject to stockholder approval where required by applicable law. Any amendment or termination may not materially impair the rights of holders of outstanding awards without their consent. |
Limitation on Liability and Indemnification Matters
Our amended and restated certificate of incorporation contains provisions that limit the personal liability of our directors for monetary damages to the fullest extent permitted by Delaware law. Consequently, our directors will not be personally liable to us or our stockholders for monetary damages for any breach of fiduciary duties as directors, except liability for:
| • | any breach of the director’s duty of loyalty to us or our stockholders; |
| • | any act or omission not in good faith or that involves intentional misconduct or a knowing violation of law; |
| • | unlawful payments of dividends or unlawful stock repurchases or redemptions as provided in Section 174 of the Delaware General Corporation Law; or |
| • | any transaction from which the director derived an improper personal benefit. |
Our amended and restated certificate of incorporation provides that we have the power to indemnify our directors, officers, employees and agents and our bylaws provide that we are required to indemnify our directors and officers, in each case to the fullest extent permitted by Delaware law. Our bylaws also provide that we shall advance expenses incurred by a directors and officers in advance of the final disposition of any action or proceeding, and permit us to secure insurance on behalf of any officer, director, employee or other agent for any liability arising out of his or her actions in that capacity regardless of whether we would otherwise be permitted to indemnify him or her under the provisions of Delaware law. We have entered and expect to continue to enter into agreements to indemnify our directors and executive officers. With certain exceptions, these agreements provide for indemnification for related expenses including, among other things, attorneys’ fees, judgments, fines and settlement amounts incurred by any of our directors and executive officers in any action or proceeding. We believe that these bylaw provisions and indemnification agreements are necessary to attract and retain qualified persons as directors and executive officers. We also maintain directors’ and officers’ liability insurance.
76
Table of Contents
The limitation of liability and indemnification provisions in our certificate of incorporation and bylaws may discourage stockholders from bringing a lawsuit against our directors for breach of their fiduciary duty of care. They may also reduce the likelihood of derivative litigation against our directors and officers, even though an action, if successful, might benefit us and other stockholders. Further, a stockholder’s investment may be adversely affected to the extent that we pay the costs of settlement and damage awards against directors and officers. At present, there is no pending litigation or proceeding involving any of our directors, officers or employees for which indemnification is sought, and we are not aware of any threatened litigation that may result in claims for indemnification.
77
Table of Contents
CERTAIN RELATIONSHIPS AND RELATED PARTY TRANSACTIONS
In addition to the cash and equity compensation arrangements of our directors and executive officers discussed above under “Management—Director Compensation” and “—Executive Compensation,” the following is a description of transactions since January 1, 2010, to which we have been a party in which the amount involved exceeded or will exceed $120,000 and in which any of our directors, executive officers, beneficial holders of more than 5% of our capital stock, or entities affiliated with them, had or will have a direct or indirect material interest.
Related Party Transaction Policy
We adopted a formal policy, effective upon the closing of our initial public offering in August 2012, that our executive officers, directors, holders of more than 5% of any class of our voting securities, and any member of the immediate family of and any entity affiliated with any of the foregoing persons, are not permitted to enter into a related party transaction with us without the prior consent of our audit committee, or other independent members of our board of directors in the event it is inappropriate for our audit committee to review such transaction due to a conflict of interest. Any request for us to enter into a transaction with an executive officer, director, principal stockholder, or any of their immediate family members or affiliates, in which the amount involved exceeds $120,000 must first be presented to our audit committee for review, consideration and approval. In approving or rejecting any such proposal, our audit committee is required to conduct a review of all relevant facts reasonably available to our audit committee, including, but not limited to, whether the transaction is on terms no less favorable than terms generally available to an unaffiliated third-party under the same or similar circumstances and the extent of the related party’s interest in the transaction. All of the transactions described below were entered into prior to the adoption of such policy.
Arrangements with Our Investors
On January 8, 2004, in connection with the consummation of our acquisition by investment funds controlled by Parthenon Capital Partners and certain other stockholders, or the Acquisition, we entered into an investment agreement, a stockholders agreement and a registration agreement. These agreements contain agreements among the parties with respect to election of directors, preemptive rights, restrictions on transfer of shares, “drag along” obligations, registration rights and covenants regarding the conduct and operation of our business. In addition, we entered into an advisory services agreement with Parthenon Capital Partners for the provision of certain advisory services to us.
Stockholders Agreement
In connection with the Acquisition, we entered into a stockholders agreement with Parthenon Capital Partners and certain other holders of series A preferred stock under which Parthenon Capital Partners was granted certain rights to elect members of our board of directors and the stockholders were granted preemptive rights over future issuances of securities by us and became subject to certain transfer restrictions and drag along obligations. All provisions of the stockholders agreement terminated upon the closing of our initial public offering in August 2012.
Registration Agreement
In connection with the Acquisition, we entered into a registration agreement with Parthenon Capital Partners and certain other stockholders. This agreement was amended, effective upon the closing of our initial public offering in August 2012. The registration agreement, as amended, provides the stockholders party thereto with certain demand registration rights in respect of the shares of our common stock held by them. In addition, following the closing of our initial public offering in August 2012, if we register additional shares of common stock for sale to the public, we are required to give notice of such registration to the stockholders who are party to the registration agreement of our intention to effect such a registration, and, subject to certain limitations, such holders will have piggyback registration rights providing them with the right to require us to include shares of common stock held by them in such registration. We will be required to bear the registration expenses, other than
78
Table of Contents
underwriting discounts and commissions and transfer taxes, associated with any registration of shares by the stockholders described above. The registration rights agreement includes lock up obligations that restrict the sale of securities during the initial 180 day period, or in certain circumstances 90 day period, following the effective date of any demand registration or piggyback registration effected pursuant to the terms of the registration agreement. We are also restricted from engaging in any public sale of equity securities during the initial 180 day period, or in certain circumstances 90 day period, following the effective date of any demand registration or piggyback registration effected pursuant to the terms of the registration agreement. The registration agreement includes customary indemnification provisions in favor of the stockholders who are parties and any person who is or might be deemed a controlling person of the stockholders within the meaning of the Securities Act and related parties against liabilities under the Securities Act incurred in connection with the registration of any of our securities. These provisions provide indemnification against certain liabilities arising under the Securities Act and certain liabilities resulting from violations of other applicable laws in connection with any filing or other disclosure made by us under the securities laws relating to any such registrations. We have agreed to reimburse such persons for any legal or other expenses incurred in connection with investigating or defending any such liability, action or proceeding, except that we will not be required to indemnify any such person or reimburse related legal or other expenses if such loss or expense arises out of or is based on any untrue statement or omission made in reliance upon and in conformity with written information provided by such person.
Investment Agreement
In connection with the Acquisition, we entered into an investment agreement with certain of our stockholders who initially purchased shares of our series A preferred stock. The investment agreement contained certain covenants regarding the delivery of financial statements and other information, inspection rights and restrictions on the conduct and operation of our business. The investment agreement terminated upon the closing of our initial public offering on August 15, 2012.
Advisory Services Agreement
In connection with the Acquisition, we entered into an advisory services agreement with Parthenon Capital Partners, pursuant to which Parthenon Capital Partners has provided us with certain advisory services. In exchange for these services, we agreed to pay Parthenon Capital Partners (i) a quarterly amount equal to the product of 0.25 multiplied by the cumulative amount of funds invested in us by Parthenon Capital Partners and its affiliates as of the start of each quarter, (ii) a one-time closing fee payable upon closing of the Acquisition equal to approximately $1.8 million and (iii) a placement fee in connection with any equity or debt financing by us following the Acquisition equal to 1% of the gross amount of any such financing. We also agreed to reimburse Parthenon Capital Partners for out-of-pocket expenses incurred by it, its members or its affiliates in connection with the provision of services pursuant to the advisory services agreement. In connection with a separate compensation arrangement with Parthenon Capital Partners, Jeffrey Stein, one of our directors, received a portion of certain of the fees received by Parthenon Capital Partners from us. During the year ended December 31, 2012, we paid Parthenon Capital Partners fees of approximately $4,208,822, which represented approximately $2,078,622 in fees payable to Parthenon Capital Partners accrued for the six months ended June 30, 2012, as well as approximately $2,130,200 in fees payable to Parthenon Capital Partners that were accrued in prior years.
Pursuant to a letter agreement dated April 13, 2012, between us and Parthenon Capital Partners, under which the advisory services agreement was terminated, we agreed to pay Parthenon Capital Partners an aggregate amount of $1,300,000, payable in equal quarterly installments of $108,622, which have been paid in April 2012 and July 2012 in addition to the fees described above and the remaining balance was paid immediately upon the closing of our initial public offering in August 2012.
Expense Reimbursement and Indemnification Agreement
In connection with the termination of the advisory services agreement entered into on April 13, 2012, we also entered into an expense reimbursement and indemnification letter agreement with Parthenon Capital Partners under which we agreed to reimburse Parthenon Capital Partners for (i) reasonable out-of-pocket
79
Table of Contents
expenses incurred in connection with the provision of any services Parthenon Capital Partners provides to us, notwithstanding the termination of the advisory services agreement, (ii) any legal, accounting or consulting fees incurred by Parthenon Capital Partners in the continuing provision of any services to us and (iii) any out-of-pocket expenses incurred by Parthenon Capital Partners in connection with any acquisitions or financings completed by us or our affiliates. Further, we agreed to indemnify Parthenon Capital Partners and its affiliates against liabilities and expenses arising out of, or in connection with, Parthenon Capital Partners’ former engagement under the advisory services agreement and the termination thereof or any continuing services provided by Parthenon Capital Partners to us.
Nomination of our Directors
In July 2012, we entered into a Director Nomination Agreement with Parthenon Capital Partners that provides Parthenon Capital Partners the right to designate nominees for election to our board of directors for so long as Parthenon Capital Partners owns 10% or more of the total number of shares of common stock outstanding. The number of nominees that Parthenon Capital Partners is entitled to designate under this agreement shall bear the same proportion to the total number of members of our board of directors as the number of shares of common stock beneficially owned by Parthenon Capital Partners bears to the total number of shares of common stock outstanding, rounded up to the nearest whole number. In addition, Parthenon Capital Partners shall be entitled to designate the replacement for any of its board designees whose board service terminates prior to the end of the director’s term regardless of Parthenon Capital Partners’ beneficial ownership at such time. Parthenon Capital Partners shall also have the right to have its designees participate on committees of our board of directors proportionate to its stock ownership, subject to compliance with applicable law and stock exchange rules. This agreement will terminate at such time as Parthenon Capital Partners owns less than 10% of our outstanding common stock.
Arrangements with our Directors and Officers
Indemnification Agreements
We have entered into indemnification agreements with each of our directors and our executive officers in connection with the consummation of our initial public offering in August 2012. The indemnification agreements and our amended and restated bylaws require us to indemnify these individuals to the fullest extent permitted by Delaware law, subject to certain exceptions. See “Management—Limitation on Liability and Indemnification Matters.”
Promissory Notes
On January 8, 2004 in connection with the Acquisition, we loaned $1 million and $500,000 to each of Lisa C. Im and Dr. Jon D. Shaver, respectively, the proceeds of which were used for the purchase of shares of our series A preferred stock. The principal amount under these notes accrued interest at the rate of 5% per annum. The outstanding principal and accrued interest under these two promissory notes was originally due and payable on January 15, 2013. The outstanding principal and accrued interest under these two promissory notes as of July 3, 2012 was approximately $1.5 million and $0.8 million for Ms. Im and Dr. Shaver, respectively. The promissory notes were repaid by Ms. Im and Dr. Shaver on July 3, 2012 with after tax proceeds received under their respective deferred compensation agreements and with proceeds from the Company’s repurchase of 67,350 shares of common stock from Ms. Im and 30,670 shares of common stock from Dr. Shaver.
80
Table of Contents
PRINCIPAL AND SELLING STOCKHOLDERS
The following table sets forth information regarding the number of shares of common stock beneficially owned on March 31, 2013, immediately following consummation of this offering, by:
| • | Each person who is known by us to beneficially own 5% or more of our common stock; |
| • | Each of our directors and named executive officers; |
| • | All of our directors and executive officers as a group; and |
| • | Each selling stockholder. |
We have determined beneficial ownership in accordance with SEC rules. Except as indicated by the footnotes below, we believe, based on the information furnished to us, that the persons and entities named in the table below have sole voting and investment power with respect to all shares of common stock that they beneficially own, subject to applicable community property laws.
Applicable percentage ownership is based on 46,720,569 shares of common stock outstanding at March 31, 2013. For purposes of the table below, we have assumed that shares of common stock will be outstanding upon completion of this offering, which gives effect to the exercise of options to purchase shares of our common stock to be sold in the offering by the selling stockholders, assuming no exercise of the underwriters’ over-allotment option but does not give effect to the exercise of other options to purchase common stock subsequent to March 31, 2013. In computing the number of shares of common stock beneficially owned by a person and the percentage ownership of that person, we deemed to be outstanding all shares of common stock subject to options or other convertible securities held by that person or entity that are currently exercisable or exercisable within 60 days of March 31, 2013. We did not deem these shares outstanding, however, for the purpose of computing the percentage ownership of any other person unless such shares are to be sold in the offering. Beneficial ownership representing less than one percent is denoted with an “*.”
Except as otherwise set forth below, the address of each of the persons listed below is 333 North Canyons Parkway, Livermore, California 94551.
| Name of Beneficial Owner |
Shares Beneficially Owned Prior to this Offering |
Shares Being Offered |
Shares Subject to Over- allotment Option** |
Shares Beneficially Owned After this Offering |
Shares Beneficially Owned After this Offering (with Over- allotment**) | |||||||||||||||
| Number(1) | Percentage | Number(1) | Percentage | Number(1) | Percentage | |||||||||||||||
| 5% Stockholders: |
||||||||||||||||||||
| Parthenon DCS Holdings, LLC(2) |
22,729,424 | 48.6 | % | |||||||||||||||||
| Massachusetts Financial Services Company(3) |
2,579,049 | 5.5 | % | |||||||||||||||||
| Executive Officers and Directors: |
||||||||||||||||||||
| Lisa C. Im(4) |
2,062,988 | 4.4 | % | |||||||||||||||||
| Dr. Jon D. Shaver(5) |
1,294,104 | 2.7 | % | |||||||||||||||||
| Harold T. Leach, Jr.(6) |
408,689 | * | ||||||||||||||||||
| Hakan L. Orvell(7) |
250,929 | * | ||||||||||||||||||
| John Y. Paik(8) |
23,998 | * | ||||||||||||||||||
| Bruce Calvin(9) |
104,000 | * | ||||||||||||||||||
| Todd R. Ford(10) |
28,756 | * | ||||||||||||||||||
| Brian P. Golson(2) |
22,729,424 | 48.6 | % | |||||||||||||||||
| William D. Hansen(11) |
16,672 | * | ||||||||||||||||||
| William C. Kessinger(2) |
22,729,424 | 48.6 | % | |||||||||||||||||
| Jeffrey S. Stein(12) |
59,306 | * | ||||||||||||||||||
| All Executive Officers and Directors as a group(11 persons)(13) |
29,557,915 | 60.5 | % | |||||||||||||||||
| Other Selling Stockholders: |
||||||||||||||||||||
| * | Represents beneficial ownership of less than 1%. |
81
Table of Contents
| ** | If the underwriters do not exercise their option to purchase additional shares in full, then the shares to be sold by each selling stockholder will be reduced pro rata according to the portion of the option to purchase additional shares that is not exercised. |
| (1) | Unless otherwise indicated, includes shares owned by a spouse, minor children and relatives sharing the same home, as well as entities owned or controlled by the named person. Unless otherwise noted, shares are owned of record and beneficially by the named person. |
| (2) | The reported shares are owned of record by Parthenon DCS Holdings, LLC (“DCS Holdings”). Parthenon Investors II, L.P., as the manager of DCS Holdings; PCAP Partners II, LLC, as the general partner of Parthenon Investors II, L.P.; PCAP II, LLC, as the managing member of PCAP Partners II, LLC; PCP Managers, LLC, as the managing member of PCAP II, LLC; and each of Messrs. Kessinger and Golson and David Ament, as managing members of PCP Managers, LLC, may be deemed to beneficially own the securities owned of record by DCS Holdings. Messrs. Kessinger and Golson are Managing Directors of Parthenon Capital Partners, an affiliate of PCAP Partners II, LLC. Each of the foregoing persons disclaims beneficial ownership of the reported securities except to the extent of their pecuniary interest therein. The address for the foregoing persons is c/o Parthenon Capital Partners, Four Embarcadero Center, Suite 3610, San Francisco, California 94111. |
| (3) | Based on a Schedule 13G filed on February 12, 2013 with the SEC by Massachusetts Financial Services Company, or MFS, an investment adviser which is deemed to be the beneficial owner of 2,579,049 shares. MFS has sole voting power as to 2,452,369 shares and sole dispositive power as to all 2,579,049 shares. The principal business address of MFS is 111 Huntington Avenue, Boston, Massachusetts 02199. |
| (4) | Includes 460,273 shares subject to options exercisable within 60 days of March 31, 2013. |
| (5) | Includes 830,117 shares subject to options exercisable within 60 days of March 31, 2013. |
| (6) | Includes 406,656 shares subject to options exercisable within 60 days of March 31, 2013. |
| (7) | Includes 250,929 shares subject to options exercisable within 60 days of March 31, 2013. |
| (8) | Includes 23,998 shares subject to options exercisable within 60 days of March 31, 2013. |
| (9) | Includes 104,000 shares subject to options exercisable within 60 days of March 31, 2013. |
| (10) | Includes 18,756 shares subject to options exercisable within 60 days of March 31, 2013. |
| (11) | Includes 16,672 shares subject to options exercisable within 60 days of March 31, 2013. |
| (12) | The address for Mr. Stein is c/o Parthenon Capital Partners, One Federal Street, 21st Floor, Boston, Massachusetts 02110. |
| (13) | Includes 2,140,730 shares subject to options exercisable within 60 days of March 31, 2013. Also includes 22,729,424 shares held by DCS Holdings. |
82
Table of Contents
General
The following is a summary of the rights of our common stock and preferred stock and certain provisions of our amended and restated certificate of incorporation and amended and restated bylaws. The description is intended as a summary, and is qualified in its entirety by reference to our amended and restated certificate of incorporation and our amended and restated bylaws.
Our authorized capital stock consists of 550,000,000 shares, with a par value of $.0001 per share, of which:
| • | 500,000,000 shares are designated as common stock; and |
| • | 50,000,000 shares are designated as preferred stock. |
As of December 31, 2012, we had outstanding 45,392,224 shares of common stock and no shares of preferred stock. Our outstanding capital stock was held by 38 stockholders of record as of December 31, 2012. As of December 31, 2012, we also had outstanding options to acquire 7,909,724 shares of common stock.
Common Stock
Pursuant to our amended and restated certificate of incorporation, the holders of common stock are entitled to one vote per share for the election of directors and on all matters submitted to a vote of stockholders. The vote of the holders of a majority of the shares present in person or by proxy at a meeting of stockholders and entitled to vote shall decide any question submitted to a vote, except as otherwise required by law or provided for in our amended and restated certificate of incorporation or amended and restated bylaws. Directors shall be elected by a plurality of the votes of the shares present in person or by proxy at a meeting and entitled to vote. The amended and restated certificate of incorporation does not provide for cumulative voting in the election of directors. Subject to the rights, if any, of the holders of any outstanding series of preferred stock, the holders of common stock are entitled to receive such dividends, if any, as may be declared by the board of directors out of legally available funds, payable either in cash, property or shares of capital stock.
Upon liquidation, dissolution or winding-up of the company, subject to the rights, if any of the holders of our preferred stock, the holders of common stock are entitled to receive all of the remaining assets of the company of whatever kind available for distribution ratable in proportion to the number of shares held by them respectively.
The holders of common stock have no preemptive, subscription, redemption or conversion rights. The rights, preferences and privileges of holders of common stock are subject to, and may be adversely affected by, the rights of the holders of any series of preferred stock, which may be designated solely by action of the board of directors and issued in the future.
Preferred Stock
The board of directors is authorized, subject to any limitations prescribed by law, without further vote or action by the stockholders, to issue from time to time shares of preferred stock in one or more series without stockholder approval. Each such series of preferred stock shall have such number of shares, voting powers, designations, preferences and relative, participating, optional or other special rights, and the qualifications, limitations and restrictions, as shall be determined by the board of directors, which may include, among others, dividend rights, voting rights, liquidation preferences, conversion rights and preemptive rights.
Anti-Takeover Effects of Our Amended and Restated Certificate of Incorporation and Our Amended and Restated Bylaws
Certain provisions of our amended and restated certificate of incorporation and our amended and restated bylaws contain provisions that could have the effect of delaying, deferring or discouraging another party from acquiring control of us. These provisions, which are summarized below, are expected to discourage certain
83
Table of Contents
types of coercive takeover practices and inadequate takeover bids. These provisions are also designed, in part, to encourage persons seeking to acquire control of us to first negotiate with our board of directors. We believe that the benefits of increased protection of our potential ability to negotiate with an unfriendly or unsolicited acquirer outweigh the disadvantages of discouraging such proposals, including proposals that are priced above the then-current market value of our common stock, because, among other reasons, the negotiation of such proposals could result in an improvement of their terms.
These provisions include:
Classified Board
Our amended and restated certificate of incorporation provides that our board of directors shall be divided into three classes of directors, with the classes as nearly equal in number as possible. As a result, approximately one-third of our board of directors is elected each year. We believe that the classification of our board of directors facilitates the continuity and stability of our business strategies and policies. However, our classified board could have the effect of making the replacement of incumbent directors more time consuming and difficult. At least two annual meetings of stockholders, instead of one, will generally be required to effect a change in a majority of our board of directors.
Number of Directors; Removal of Directors and Filling of Vacancies
Our amended and restated certificate of incorporation provides that our board of directors has the authority to determine the number of directors within a range of between five and 15 directors. It also provides that (i) vacancies in our board of directors, including vacancies created by an increase in the number of directors, shall be filled solely by a majority vote of the directors then in office, and (ii) directors or the entire board may be removed only for cause.
Action by Written Consent; Special Meetings of Stockholders
Our amended and restated certificate of incorporation provides that stockholder action can be taken only at an annual or special meeting of stockholders and cannot be taken by written consent in lieu of a meeting. Our amended and restated certificate of incorporation and our amended and restated bylaws also provide that, except as otherwise required by law, special meetings of the stockholders can only be called pursuant to a resolution adopted by a majority of the board of directors or at the request of holders of 50% or more of our outstanding shares. Except as described above, stockholders are not permitted to call a special meeting or to require the board of directors to call a special meeting.
Advance Notice Procedures
Our amended and restated bylaws requires an advance notice procedure for stockholder proposals to be brought before an annual meeting of our stockholders, including proposed nominations of persons for election to the board of directors. Stockholders at an annual meeting are only able to consider proposals or nominations specified in the notice of meeting or brought before the meeting by or at the direction of the board of directors or by a stockholder who was a stockholder of record on the record date for the meeting, who is entitled to vote at the meeting and who has given our Secretary timely written notice, in proper form, of the stockholder’s intention to bring that business before the meeting. Although our amended and restated bylaws do not give the board of directors the power to approve or disapprove stockholder nominations of candidates or proposals regarding other business to be conducted at a special or annual meeting, our amended and restated bylaws may have the effect of precluding the conduct of certain business at a meeting if the proper procedures are not followed or may discourage or deter a potential acquiror from conducting a solicitation of proxies to elect its own slate of directors or otherwise attempting to obtain control of the Company.
84
Table of Contents
Super Majority Approval Requirements
The Delaware General Corporation Law, or the DGCL, generally provides that the affirmative vote of a majority of the shares entitled to vote on any matter is required to amend a corporation’s certificate of incorporation or bylaws, unless either a corporation’s certificate of incorporation or bylaws require a greater percentage. Our amended and restated certificate of incorporation and amended and restated bylaws provide that the affirmative vote of holders of at least 66 2/3% of the total votes eligible to be cast in the election of directors will be required to amend, alter, change or repeal our amended and restated bylaws or specified provisions of our amended and restated certificate of incorporation. This requirement of a super majority vote to approve amendments to our amended and restated bylaws and certain provisions of our amended and restated certificate of incorporation could enable a minority of our stockholders to exercise veto power over any such amendments.
Authorized but Unissued Shares
Our authorized but unissued shares of common stock and preferred stock are available for future issuance without stockholder approval. These additional shares may be utilized for a variety of corporate purposes, including future public offerings to raise additional capital, corporate acquisitions and employee benefit plans. In addition, preferred stock could be issued with voting, liquidation, dividend and other rights superior to our common stock. The existence of authorized but unissued shares of common stock and preferred stock could render more difficult or discourage an attempt to obtain control of a majority of our common stock by means of a proxy contest, tender offer, merger or otherwise.
Business Combinations with Interested Stockholders
We have elected in our certificate of incorporation not to be subject to Section 203 of the DGCL, an anti-takeover law. In general, Section 203 prohibits a publicly held Delaware corporation from engaging in a business combination, such as a merger, with a person or group owning 15% or more of the corporation’s voting stock for a period of three years following the date the person became an interested stockholder, unless (with certain exceptions) the business combination or the transaction in which the person became an interested stockholder is approved in a prescribed manner. Accordingly, we are not subject to any anti-takeover effects of Section 203. However, our amended and restated certificate of incorporation contains provisions that have the same effect as Section 203, except that they provide that Parthenon Capital Partners is not deemed to be an “interested stockholder,” regardless of the percentage of our voting stock owned by it and accordingly is not subject to such restrictions.
Corporate Opportunities
Our amended and restated certificate of incorporation provides that we renounce any interest or expectancy of the Company in the business opportunities that are from time to time presented to Parthenon Capital Partners and its officers, directors, agents, shareholders, members, partners, affiliates and subsidiaries, even if the opportunities are ones that the Company might have pursued or had the ability or desire to pursue if granted the opportunity, and each such person shall not have any obligation to offer to us those opportunities and shall not be liable for breach of any fiduciary or other duty, as a director or otherwise, if any such person pursues or acquires such opportunity, directs the opportunity to another person or fails to present the opportunity to us.
Choice of Forum
Our amended and restated certificate of incorporation provides that a state or federal court located within the State of Delaware is the sole and exclusive forum for any derivative action or proceeding brought on our behalf; any action asserting a breach of fiduciary duty; any action asserting a claim against us arising pursuant to the DGCL, our amended and restated certificate of incorporation or our amended and restated bylaws; or any action asserting a claim against us that is governed by the internal affairs doctrine.
85
Table of Contents
Limitation of Liability and Indemnification Matters
Our amended and restated certificate of incorporation limits the liability of our directors to the fullest extent permitted by the DGCL and our amended and restated bylaws provide that we shall indemnify our directors and officers to the fullest extent permitted by such law. We have entered into indemnification agreements with our current directors and executive officers and expect to enter into a similar agreement with any new directors or executive officers. Our amended and restated certificate of incorporation and amended and restated bylaws also permit us to purchase insurance on behalf of any officer, director, employee or other agent for any liability arising out of his or her actions as our officer, director, employee or agent, regardless of whether Delaware law would permit indemnification. We believe that the limitation of liability provision, indemnification agreements and provision of directors’ and officers’ liability insurance will facilitate our ability to continue to attract and retain qualified individuals to serve as directors and officers of the Company.
Transfer Agent and Registrar
The transfer agent and registrar for our common stock is American Stock Transfer & Trust Company, LLC. The transfer agent’s address is 6201 15th Avenue, Brooklyn, New York 11219.
Listing
The shares of our common stock are listed on the NASDAQ Global Select Market under the symbol “PFMT.”
86
Table of Contents
CERTAIN MATERIAL UNITED STATES FEDERAL INCOME AND ESTATE TAX
CONSIDERATIONS FOR NON-UNITED STATES HOLDERS
The following discussion summarizes certain material United States federal income and estate tax consequences of the ownership and disposition of our Common stock by certain non-United States holders (as defined below). This discussion only applies to non-United States holders who purchase and hold our Common stock as a capital asset for United States federal income tax purposes (generally property held for investment). This discussion does not describe all of the tax consequences that may be relevant to a non-United States holder in light of such holder’s particular circumstances.
For purposes of this discussion, a “non-United States holder” means a person that for United States federal income tax purposes is not a partnership and is not any of the following:
| • | an individual citizen or resident of the United States; |
| • | a corporation (or any other entity treated as a corporation for United States federal income tax purposes) created or organized in or under the laws of the United States, any state thereof or the District of Columbia; |
| • | an estate, the income of which is subject to United States federal income taxation regardless of its source; or |
| • | a trust (1) whose administration is subject to the primary supervision of a United States court and that has one or more United States persons who have the authority to control all substantial decisions of the trust, or (2) that has a valid election in effect under applicable Treasury regulations to be treated as a United States person. |
This discussion is based on provisions of the Internal Revenue Code of 1986, as amended, or the Code, and Treasury regulations, administrative rulings and judicial decisions as of the date hereof. These authorities may change, perhaps retroactively, which could result in United States federal income and estate tax consequences different from those summarized below. This discussion does not address all aspects of United States federal income and estate taxes, does not address any aspects of the unearned income Medicare contribution tax pursuant to the Health Care and Education Reconciliation Act of 2010 and does not describe any non-United States, state, local or other tax considerations that may be relevant to non-United States holders in light of their particular circumstances. In addition, this discussion does not describe the United States federal income and estate tax consequences applicable to a non-United States holder who is subject to special treatment under United States federal income tax laws (including, without limitation, certain former citizens and former long-term residents, a “controlled foreign corporation,” a “passive foreign investment company,” a corporation that accumulates earnings to avoid United States federal income tax, a partnership or other “pass through” entity or an investor in any such entity, a tax-exempt organization, a bank or other financial institution, a broker, dealer or trader in securities, commodities or currencies, a person holding our Common stock as part of a hedging, conversion, straddle, constructive sale or other risk reduction transaction or an insurance company). We cannot assure you that a change in law will not significantly alter the tax considerations that we describe in this discussion.
If a partnership (or any other entity treated as a partnership for United States federal income tax purposes) holds our Common stock, the United States federal income tax treatment of a partner of that partnership will generally depend upon the status of the partner and the activities of the partnership. If you are a partner of a partnership holding our Common stock, you should consult your tax advisors.
YOU SHOULD CONSULT YOUR OWN TAX ADVISOR REGARDING THE PARTICULAR UNITED STATES FEDERAL, STATE AND LOCAL AND FOREIGN INCOME AND OTHER TAX CONSEQUENCES TO YOU OF THE PURCHASE, OWNERSHIP AND DISPOSITION OF OUR COMMON STOCK.
87
Table of Contents
Distributions on Common Stock
In general, if distributions are made with respect to our Common stock, such distributions will be treated as dividends to the extent of our current and accumulated earnings and profits as determined for United States federal income tax purposes and will be subject to withholding as discussed below. Any portion of a distribution that exceeds our current and accumulated earnings and profits will first be applied to reduce the non-United States holder’s basis in the Common stock, but not below zero, and, to the extent such portion exceeds the non-United States holder’s basis, the excess will be treated as gain from the disposition of the Common stock, the tax treatment of which is discussed below under “Dispositions of Common Stock.”
Dividends paid to a non-United States holder of our Common stock generally will be subject to withholding of United States federal income tax at a rate of 30% of the gross amount of the dividend or such lower rate as may be specified by an applicable income tax treaty. However, dividends that are effectively connected with the conduct of a trade or business by the non-United States holder within the United States (and, where an income tax treaty applies, are attributable to a permanent establishment maintained by the non-United States holder in the United States) are not subject to the withholding tax, provided certain certification and disclosure requirements are satisfied. Instead, such dividends are subject to United States federal income tax on a net income basis in the same manner as if the non-United States holder were a United States person as defined under the Code. Any such effectively connected dividends received by a foreign corporation may be subject to an additional “branch profits tax” at a 30% rate or such lower rate as may be specified by an applicable income tax treaty.
A non-United States holder of our Common stock who wishes to claim the benefit of an applicable income tax treaty for dividends will be required to provide us with a valid Internal Revenue Service Form W-8BEN (or other applicable form) and certify under penalties of perjury that such holder is not a United States person as defined under the Code and is eligible for treaty benefits. If our Common stock is held through a foreign partnership or foreign intermediary, the foreign partnership or foreign intermediary will also be required to comply with additional certification requirements under applicable Treasury regulations.
A non-United States holder of our Common stock eligible for a reduced rate of United States withholding tax pursuant to an income tax treaty may obtain a refund of any excess amounts withheld by filing an appropriate claim for refund with the Internal Revenue Service.
Dispositions of Common Stock
Any gain realized by a non-United States holder on the disposition of our Common stock generally will not be subject to United States federal income tax unless:
| • | the gain is effectively connected with the non-United States holder’s conduct of a trade or business in the United States (and, if an income tax treaty applies, the gain is attributable to a permanent establishment maintained by the non-United States holder in the United States); |
| • | the non-United States holder is an individual who is present in the United States for 183 days or more in the calendar year of that disposition, and certain other conditions are met; or |
| • | we are or have been a United States real property holding corporation, as such term is defined in section 897(c) of the Code, during the shorter of the five-year period ending on the date of disposition or your holding period of our Common stock. |
Gain described in the first bullet point immediately above will be subject to tax on the net gain derived from the sale under regular graduated United States federal income tax rates. A non-United States holder that is a corporation may also be subject to a branch profits tax equal to 30%, or such lower rate as may be specified by an applicable income tax treaty, of its effectively connected earnings and profits for the taxable year, as adjusted for certain items. An individual non-United States holder described in the second bullet point immediately above will be required to pay (subject to applicable income tax treaties) a flat 30% tax on the gain derived from the sale, which may be offset by United States source capital losses, even though the individual is not considered a
88
Table of Contents
resident of the United States. As long as our Common stock is regularly traded on an established securities market, within the meaning of section 897(c)(3) of the Code, the rules described in the third bullet point above will apply to you only if you actually or constructively hold more than five percent of such regularly traded common stock at any time during the applicable period that is specified in the Code (the “regularly traded stock exception”). We believe we are not and do not expect to become a United States real property holding corporation. If, however, it turns out that we are or become a United States Real Property holding corporation, a non-United States holder for whom the regularly traded stock exception is not applicable or who is not otherwise exempt will be required to pay United States federal income tax under regular graduated United States federal income tax rates with respect to the gain recognized.
United States Federal Estate Tax
Our Common stock beneficially owned by an individual who is not a citizen or resident of the United States (as defined for United States federal estate tax purposes) at the time of death will generally be includable in the decedent’s gross estate for United States federal estate tax purposes, unless an applicable estate tax treaty provides otherwise.
Information Reporting and Backup Withholding
We must report annually to the Internal Revenue Service and to each non-United States holder the amount of dividends paid to such non-United States holder and the tax withheld with respect to such dividends, regardless of whether withholding was required. Copies of the information returns reporting such dividends and withholding may also be made available to the tax authorities in the country in which the non-United States holder resides under the provisions of an applicable income tax treaty or tax information exchange agreement.
Payments of dividends in respect of, or proceeds on the disposition within the United States (or conducted through certain U.S. related intermediaries) of, our Common stock made to a non-United States holder will be subject to additional information reporting and backup withholding unless such non-United States holder establishes an exemption, for example by properly certifying that such holder is not a United States person as defined under the Code on an Internal Revenue Service Form W-8BEN or another appropriate version of Form W-8 (and the payor does not have actual knowledge or reason to know that such non-United States holder is a United States person as defined under the Code).
Backup withholding is not an additional tax. Any amounts withheld under the backup withholding rules will reduce the non-United States holder’s United States federal income tax liability. If withholding results in an overpayment of taxes, a refund or credit may generally be obtained from the Internal Revenue Service provided the required information is timely furnished to the Internal Revenue Service.
Recent Legislative Developments
Legislation enacted in 2010 will generally impose a 30% withholding tax on dividends on our Common stock and the gross proceeds of a disposition of our Common stock paid after December 31, 2012 to (i) a foreign financial institution unless such institution enters into an agreement with the United States Treasury requiring, among other things, that such institution undertake to identify accounts held by certain United States persons or certain foreign entities wholly or partially owned by United States persons, annually report certain information about such accounts and withhold at a rate of 30% on payments to account holders whose actions prevent it from complying with these reporting and other requirements, and (ii) a non-financial foreign entity unless such entity provides the payor with a certification identifying the direct and indirect United States owners of the entity. Accordingly, the entity through which our Common stock is held will affect the determination of whether such withholding is required. Under implementing regulations, this new withholding tax will not apply (i) to dividend income on Common stock that is paid on or before December 31, 2013 or (ii) to gross proceeds from the disposition of Common stock paid on or before December 31, 2016. Under certain circumstances, a non-United States holder of our Common stock may be eligible for refunds or credits of such taxes. Investors are encouraged to consult with their own tax advisors regarding the possible implications of this legislation on their investment in our Common stock.
89
Table of Contents
SHARES ELIGIBLE FOR FUTURE SALE
Future sales of substantial amounts of shares of our common stock, including shares issued upon the exercise of outstanding options, in the public market after this offering, or the possibility of these sales occurring, could cause the prevailing market price for our common stock to fall or impair our ability to raise equity capital in the future.
Upon the completion of this offering, a total of 45,392,224 shares of common stock will be outstanding, assuming that there are no exercises of options after December 31, 2012.
For those shares that were not sold in our initial public offering, our February 2013 offering, or in this offering, and are subject to the lock-up agreements described below, such shares will be available for sale as described below:
| Date |
Number of Shares | |||
| On the date of this prospectus |
— | |||
| May 2, 2013 (the lock-up agreement from our February 2013 public offering expires on May 2, 2013) |
303,360 | |||
| At various times beginning more than 60 days after the date of this prospectus |
27,728,773 | |||
In addition, of the 7,909,724 shares of our common stock that were subject to stock options outstanding as of December 31, 2012, options to purchase 4,854,960 shares of common stock were vested as of December 31, 2012. Of such vested options to purchase shares of common stock, vested options to purchase common stock will be subject to the 60 day lock-up agreement discussed below. The remaining shares underlying vested options to purchase common stock are held by current employees who are subject to our insider trading policy. The insider trading policy prohibits employees from trading in our stock following the end of a quarter until two business days following our applicable earnings announcement. In connection with this offering on the date of this prospectus, approximately % of the outstanding non-public shares and vested options are not subject to either a lock-up agreement or our insider trading policy.
Lock-Up Agreements
In connection with this offering, we and our officers, directors, the selling stockholders and certain other holders of our common stock have agreed with the underwriters, subject to certain exceptions, not to dispose of or hedge any of our common stock or securities convertible into or exchangeable for shares of common stock, file or cause to be filed a registration statement covering shares of common stock or any securities that are convertible into, exchangeable for, or represent the right to receive, common stock or any substantially similar securities, or publicly disclose the intention to do any of the foregoing restrictions, during the period from the date of this prospectus continuing through the date 60 days after the date of this prospectus, except with the prior written consent of Goldman, Sachs & Co. and Morgan Stanley & Co. LLC. This agreement does not apply to the issuance by us of shares under any existing employee benefit plans. This agreement is subject to certain exceptions in certain circumstances. See “Underwriting” for a more complete description of the lock-up agreements.
90
Table of Contents
Under the terms and subject to the conditions in an underwriting agreement dated the date of this prospectus, the underwriters named below, for whom Goldman, Sachs & Co. and Morgan Stanley & Co. LLC are acting as representatives, have severally agreed to purchase, and the selling stockholders have agreed to sell to them, severally, the number of shares indicated below:
| Name |
Number of Shares | |
| Goldman, Sachs & Co. |
||
| Morgan Stanley & Co. LLC |
||
| Wells Fargo Securities, LLC |
||
| Credit Suisse Securities (USA) LLC |
||
| William Blair & Company, L.L.C. |
||
| Compass Point Research & Trading, LLC |
||
|
| ||
| Total |
||
|
|
The underwriters and the representatives are collectively referred to as the “underwriters” and the “representatives,” respectively. The underwriters are offering the shares of common stock subject to their acceptance of the shares from the selling stockholders and subject to prior sale. The underwriting agreement provides that the obligations of the several underwriters to pay for and accept delivery of the shares of common stock offered by this prospectus are subject to the approval of certain legal matters by their counsel and to certain other conditions. The underwriters are obligated to take and pay for all of the shares of common stock offered by this prospectus if any such shares are taken. However, the underwriters are not required to take or pay for the shares covered by the underwriters’ option to purchase additional shares described below. If an underwriter defaults, the underwriting agreement provides that the purchase commitments of the non-defaulting underwriters may be increased, or, in the case of a default with respect to the shares covered by the underwriters’ option to purchase additional shares described below, the underwriting agreement may be terminated.
The underwriters initially propose to offer part of the shares of common stock directly to the public at the offering price listed on the cover page of this prospectus and part to certain dealers at a price that represents a concession not in excess of $ per share under the public offering price. After the initial offering of the shares of common stock, the offering price and other selling terms may from time to time be varied by the representatives. The offering of the shares by the underwriters is subject to receipt and acceptance and subject to the underwriters’ right to reject any order in whole or in part.
The selling stockholders have granted to the underwriters an option, exercisable for 30 days from the date of this prospectus, to purchase up to additional shares of common stock at the public offering price listed on the cover page of this prospectus, less underwriting discounts and commissions. To the extent the option is exercised, each underwriter will become obligated, subject to certain conditions, to purchase the same percentage of the additional shares of common stock as the number listed next to the underwriter’s name in the preceding table bears to the total number of shares of common stock listed next to the names of all underwriters in the preceding table.
91
Table of Contents
The following table shows the per share and total public offering price, underwriting discounts and commissions, and proceeds before expenses to the selling stockholders. These amounts are shown assuming both no exercise and full exercise of the underwriters’ option to purchase up to an additional shares of common stock.
| Total | ||||||
| Per Share | No Exercise | Full Exercise | ||||
| Public offering price |
||||||
| Underwriting discounts and commissions to be paid by the selling stockholders |
||||||
| Proceeds, before expenses, to selling stockholders |
||||||
The estimated offering expenses payable by us are approximately $ million.
The underwriters have informed us that they do not intend sales to discretionary accounts to exceed 5% of the total number of shares of common stock offered by them. We will also reimburse the underwriters for an amount of up to $20,000 for filing fees and other reasonable expenses or fees incident to the review by the Financial Industry Regulatory Authority, Inc. at the terms of the same of common stock offered hereby.
Upon the completion of this offering, we will pay Financial Technology Partners LP and FTP Securities LLC, which we refer to as FT Partners, an estimated fee of $ in cash for financial advisory services in respect of this offering. We have agreed to reimburse FT Partners for reasonable out-of-pocket expenses, which shall not exceed $20,000, and we have also agreed to indemnify FT Partners against certain losses, claims, damages and liabilities in connection with FT Partners’ financial advisory services. FT Partners’ financial advisory services included assistance in financial and valuation modeling, advice with respect to the public offering process and equity capital market alternatives, assisting us in the drafting of this prospectus, assisting us in the negotiation of the valuation and other economic aspects of our proposed offering, providing overall process management and providing other services that we and FT Partners collectively deemed appropriate. FT Partners is selling shares of our common stock in this offering. None of Financial Technology Partners LP, FTP Securities LLC, or any of their affiliates is acting as an underwriter of this offering.
Our common stock is listed on the NASDAQ Global Select Market under the trading symbol “PFMT.”
In connection with our public offering in February 2013, we, the selling stockholders, all of our directors and officers and certain other stockholders agreed that, without the prior written consent of Goldman, Sachs & Co. and Morgan Stanley & Co. LLC on behalf of the underwriters, we and they will not, during the period ending May 1, 2013, or the restricted period:
| • | offer, pledge, sell, contract to sell, sell any option or contract to purchase, purchase any option or contract to sell, grant any option, right or warrant to purchase, lend or otherwise transfer or dispose of directly or indirectly, any shares of common stock beneficially owned or any other securities convertible into or exercisable or exchangeable for common stock; |
| • | file any registration statement with the SEC relating to the offering of any shares of common stock or any securities convertible into or exercisable or exchangeable for common stock; or |
| • | enter into any swap or other arrangement that transfers to another, in whole or in part, any of the economic consequences of ownership of the common stock; |
whether any such transaction described above is to be settled by delivery of common stock or such other securities, in cash or otherwise. In addition, we and each such person agreed that, without the prior written consent of Goldman, Sachs & Co. and Morgan Stanley & Co. LLC on behalf of the underwriters, we or such other person would not, during the restricted period, make any demand for, or exercise any right with respect to, the registration of any shares of common stock or any security convertible into or exercisable or exchangeable for common stock.
92
Table of Contents
The restrictions described in the immediately preceding paragraph do not apply to:
| • | the sale of shares to the underwriters; or |
| • | the issuance by the Company of shares of common stock upon the exercise of an option or a warrant or the conversion of a security outstanding on the date of this prospectus of which the underwriters have been advised in writing; or |
| • | the establishment of a trading plan pursuant to Rule 10b5-1 under the Exchange Act for the transfer of shares of common stock, provided that such plan does not provide for the transfer of common stock during the restricted period and no public announcement or filing under the Exchange Act, as amended, regarding the establishment of such plan shall be required or shall be voluntarily made. |
The restricted period will be extended if:
| • | during the last 17 days of the restricted period we issue an earnings release or material news or a material event relating to our company occurs, or |
| • | prior to the expiration of the restricted period, we announce that we will release earnings results during the 16-day period beginning on the last day of the restricted period, |
in which case the restrictions described in the preceding paragraphs will continue to apply until the expiration of the 18-day period beginning on the issuance of the earnings release or the occurrence of the material news or material event.
For the purposes of this offering, Goldman, Sachs & Co. and Morgan Stanley & Co. LLC intend to waive, solely with respect to the shares being sold in this offering, the restrictions under these lock-up agreements applicable to us and the selling stockholders.
In connection with this offering, we, the selling stockholders, all of our directors and officers and certain other stockholders have agreed to extend the restricted period for an additional period ending 60 days after the date of this prospectus, or the follow-on restricted period. The follow-on restricted period will be extended in the same circumstances and for the same periods as set forth above with respect to the restricted period.
In order to facilitate the offering of the common stock, the underwriters may engage in transactions that stabilize, maintain or otherwise affect the price of the common stock. Specifically, the underwriters may sell more shares than they are obligated to purchase under the underwriting agreement, creating a short position. A short sale is covered if the short position is no greater than the number of shares available for purchase by the underwriters under the option to purchase additional shares. The underwriters can close out a covered short sale by exercising the option to purchase additional shares or purchasing shares in the open market. In determining the source of shares to close out a covered short sale, the underwriters will consider, among other things, the open market price of shares compared to the price available under the option to purchase additional shares. The underwriters may also sell shares in excess of the option to purchase additional shares, creating a naked short position. The underwriters must close out any naked short position by purchasing shares in the open market. A naked short position is more likely to be created if the underwriters are concerned that there may be downward pressure on the price of the common stock in the open market after pricing that could adversely affect investors who purchase in this offering. As an additional means of facilitating this offering, the underwriters may bid for, and purchase, shares of common stock in the open market to stabilize the price of the common stock. These activities may raise or maintain the market price of the common stock above independent market levels or prevent or retard a decline in the market price of the common stock. The underwriters are not required to engage in these activities and may end any of these activities at any time. The underwriters may also impose a penalty bid. This occurs when a particular underwriter repays to the underwriters a portion of the underwriting discount received by it because the representatives have repurchased shares sold by or for the account of such underwriter in stabilizing or short covering transactions.
93
Table of Contents
We, the selling stockholders and the several underwriters have agreed to indemnify each other against certain liabilities, including liabilities under the Securities Act.
A prospectus in electronic format may be made available on websites maintained by one or more underwriters, or selling group members, if any, participating in this offering. The representatives may agree to allocate a number of shares of common stock to underwriters for sale to their online brokerage account holders. Internet distributions will be allocated by the representatives to underwriters that may make Internet distributions on the same basis as other allocations.
Other Relationships
The underwriters and their respective affiliates are full service financial institutions engaged in various activities, which may include securities trading, commercial and investment banking, financial advisory, investment management, principal investment, hedging, financing and brokerage activities. Certain of the underwriters and their respective affiliates may in the future perform various financial advisory and investment banking services for us, for which they will receive customary fees and expenses. In the ordinary course of their various business activities, the underwriters and their respective affiliates may make or hold a broad array of investments and actively trade debt and equity securities (or related derivative securities) and financial instruments (including bank loans) for their own account and for the accounts of their customers and may at any time hold long and short positions in such securities and instruments. Such investment and securities activities may involve our securities and instruments. Affiliates of certain of the underwriters, including Wells Fargo Securities, LLC, are among several lenders under our credit agreement.
Selling Restrictions
European Economic Area
In relation to each Member State of the European Economic Area which has implemented the Prospectus Directive, each, a “Relevant Member State,” an offer to the public of any shares of our common stock may not be made in that Relevant Member State, except that an offer to the public in that Relevant Member State of any shares of our common stock may be made at any time under the following exemptions under the Prospectus Directive, if they have been implemented in that Relevant Member State:
| (a) | to any legal entity which is a qualified investor as defined in the Prospectus Directive; |
| (b) | to fewer than 100 or, if the Relevant Member State has implemented the relevant provision of the 2010 PD Amending Directive, 150, natural or legal persons (other than qualified investors as defined in the Prospectus Directive), as permitted under the Prospectus Directive, subject to obtaining the prior consent of the representatives for any such offer; or |
| (c) | in any other circumstances falling within Article 3(2) of the Prospectus Directive, provided that no such offer of shares of our common stock shall result in a requirement for the publication by us or any underwriter of a prospectus pursuant to Article 3 of the Prospectus Directive. |
For the purposes of this provision, the expression an “offer to the public” in relation to any shares of our common stock in any Relevant Member State means the communication in any form and by any means of sufficient information on the terms of the offer and any shares of our common stock to be offered so as to enable an investor to decide to purchase any shares of our common stock, as the same may be varied in that Member State by any measure implementing the Prospectus Directive in that Member State, the expression “Prospectus Directive” means Directive 2003/71/EC (and amendments thereto, including the 2010 PD Amending Directive, to the extent implemented in the Relevant Member State), and includes any relevant implementing measure in the Relevant Member State, and the expression “2010 PD Amending Directive” means Directive 2010/73/EU.
94
Table of Contents
United Kingdom
Each underwriter has represented and agreed that:
| (a) | it has only communicated or caused to be communicated and will only communicate or cause to be communicated an invitation or inducement to engage in investment activity (within the meaning of Section 21 of the Financial Services and Markets Act 2000, or FSMA) received by it in connection with the issue or sale of the shares of our common stock in circumstances in which Section 21(1) of the FSMA does not apply to us; and |
| (b) | it has complied and will comply with all applicable provisions of the FSMA with respect to anything done by it in relation to the shares of our common stock in, from or otherwise involving the United Kingdom. |
Hong Kong
The shares may not be offered or sold by means of any document other than (i) in circumstances which do not constitute an offer to the public within the meaning of the Companies Ordinance (Cap.32, Laws of Hong Kong), or (ii) to “professional investors” within the meaning of the Securities and Futures Ordinance (Cap.571, Laws of Hong Kong) and any rules made thereunder, or (iii) in other circumstances which do not result in the document being a “prospectus” within the meaning of the Companies Ordinance (Cap.32, Laws of Hong Kong), and no advertisement, invitation or document relating to the shares may be issued or may be in the possession of any person for the purpose of issue (in each case whether in Hong Kong or elsewhere), which is directed at, or the contents of which are likely to be accessed or read by, the public in Hong Kong (except if permitted to do so under the laws of Hong Kong) other than with respect to shares which are or are intended to be disposed of only to persons outside Hong Kong or only to “professional investors” within the meaning of the Securities and Futures Ordinance (Cap. 571, Laws of Hong Kong) and any rules made thereunder.
Singapore
This prospectus has not been registered as a prospectus with the Monetary Authority of Singapore. Accordingly, this prospectus and any other document or material in connection with the offer or sale, or invitation for subscription or purchase, of the shares may not be circulated or distributed, nor may the shares be offered or sold, or be made the subject of an invitation for subscription or purchase, whether directly or indirectly, to persons in Singapore other than (i) to an institutional investor under Section 274 of the Securities and Futures Act, Chapter 289 of Singapore, or the SFA, (ii) to a relevant person, or any person pursuant to Section 275(1A), and in accordance with the conditions, specified in Section 275 of the SFA or (iii) otherwise pursuant to, and in accordance with the conditions of, any other applicable provision of the SFA.
Where the shares are subscribed or purchased under Section 275 by a relevant person which is: (a) a corporation (which is not an accredited investor) the sole business of which is to hold investments and the entire share capital of which is owned by one or more individuals, each of whom is an accredited investor; or (b) a trust (where the trustee is not an accredited investor) whose sole purpose is to hold investments and each beneficiary is an accredited investor, shares, debentures and units of shares and debentures of that corporation or the beneficiaries’ rights and interest in that trust shall not be transferable for 6 months after that corporation or that trust has acquired the shares under Section 275 except: (1) to an institutional investor under Section 274 of the SFA or to a relevant person, or any person pursuant to Section 275(1A), and in accordance with the conditions, specified in Section 275 of the SFA; (2) where no consideration is given for the transfer; or (3) by operation of law.
Japan
The securities have not been and will not be registered under the Financial Instruments and Exchange Law of Japan (the Financial Instruments and Exchange Law) and each underwriter has agreed that it will not offer or sell any securities, directly or indirectly, in Japan or to, or for the benefit of, any resident of Japan (which term as used herein means any person resident in Japan, including any corporation or other entity organized
95
Table of Contents
under the laws of Japan), or to others for re-offering or resale, directly or indirectly, in Japan or to a resident of Japan, except pursuant to an exemption from the registration requirements of, and otherwise in compliance with, the Financial Instruments and Exchange Law and any other applicable laws, regulations and ministerial guidelines of Japan.
96
Table of Contents
The validity of the shares of common stock offered hereby will be passed upon for us by Pillsbury Winthrop Shaw Pittman LLP, San Francisco, California. Kirkland & Ellis LLP, New York, New York, is representing the underwriters in this offering.
The consolidated financial statements and financial statement schedule of Performant Financial Corporation as of December 31, 2011 and 2012, and for each of the years in the three-year period ended December 31, 2012, have been included herein in reliance upon the report of KPMG LLP, independent registered public accounting firm, appearing elsewhere herein, and upon the authority of said firm as experts in accounting and auditing.
WHERE YOU CAN FIND ADDITIONAL INFORMATION
We have filed with the SEC a registration statement on Form S-1 under the Securities Act with respect to the shares of common stock offered hereby. This prospectus, which constitutes a part of the registration statement, does not contain all of the information set forth in the registration statement or the exhibits filed therewith. For further information about us and the common stock offered hereby, we refer you to the registration statement and the exhibits filed thereto. Statements contained in this prospectus regarding the contents of any contract or any other document that is filed as an exhibit to the registration statement are not necessarily complete, and each such statement is qualified in all respects by reference to the full text of such contract or other document filed as an exhibit to the registration statement. We are required to file periodic reports, proxy statements, and other information with the SEC pursuant to the Exchange Act. You may read and copy this information at the Public Reference Room of the SEC, 100 F Street, N.E., Room 1580, Washington D.C. 20549. You may obtain information on the operation of the public reference room by calling the SEC at 1-800-SEC-0330. The SEC also maintains an Internet website that contains reports, proxy statements and other information about issuers, like us, that file electronically with the SEC. The address of that site is www.sec.gov.
97
Table of Contents
INDEX TO CONSOLIDATED FINANCIAL STATEMENTS
| Page | ||||
| Consolidated Financial Statements of Performant Financial Corporation and Subsidiaries For the Years Ended December 31, 2012, 2011 and 2010 |
||||
| F-2 | ||||
| F-3 | ||||
| F-4 | ||||
| Consolidated Statements of Changes in Redeemable Preferred Stock and Stockholders’ Equity (Deficit) |
F-5 | |||
| F-6 | ||||
| F-7 | ||||
F-1
Table of Contents
Report of Independent Registered Public Accounting Firm
The Board of Directors and Stockholders
Performant Financial Corporation
We have audited the accompanying consolidated balance sheets of Performant Financial Corporation and subsidiaries as of December 31, 2012 and 2011, and the related consolidated statements of operations, changes in redeemable preferred stock and stockholders’ equity (deficit), and cash flows for each of the years in the three-year period ended December 31, 2012. These consolidated financial statements are the responsibility of the Company’s management. Our responsibility is to express an opinion on these consolidated financial statements based on our audits.
We conducted our audits in accordance with the standards of the Public Company Accounting Oversight Board (United States). Those standards require that we plan and perform the audit to obtain reasonable assurance about whether the financial statements are free of material misstatement. An audit includes examining, on a test basis, evidence supporting the amounts and disclosures in the financial statements. An audit also includes assessing the accounting principles used and significant estimates made by management, as well as evaluating the overall financial statement presentation. We believe that our audits provide a reasonable basis for our opinion.
In our opinion, the consolidated financial statements referred to above present fairly, in all material respects, the financial position of Performant Financial Corporation and subsidiaries as of December 31, 2012 and 2011, and the results of their operations and their cash flows for each of the years in the three-year period ended December 31, 2012, in conformity with U.S. generally accepted accounting principles.
/s/ KPMG LLP
San Francisco, California
March 21, 2013
F-2
Table of Contents
PERFORMANT FINANCIAL CORPORATION AND SUBSIDIARIES
(In thousands, except per share amounts)
| Assets | December 31, 2012 |
December 31, 2011 |
||||||
| Current assets: |
||||||||
| Cash and cash equivalents |
$ | 37,843 | $ | 20,004 | ||||
| Trade accounts receivable, net of allowance for doubtful accounts of $65 and $77, respectively and estimated allowance for appeals of $1,199 and $484, respectively |
23,044 | 19,398 | ||||||
| Deferred income taxes |
3,798 | 5,348 | ||||||
| Prepaid expenses and other current assets |
2,876 | 3,292 | ||||||
| Debt issuance costs, current portion |
1,125 | 595 | ||||||
|
|
|
|
|
|||||
| Total current assets |
68,686 | 48,637 | ||||||
| Property, equipment, and leasehold improvements, net |
20,669 | 14,915 | ||||||
| Identifiable intangible assets, net |
36,244 | 36,516 | ||||||
| Goodwill |
81,572 | 81,572 | ||||||
| Debt issuance costs |
3,844 | — | ||||||
| Other assets |
730 | 659 | ||||||
|
|
|
|
|
|||||
| Total assets |
$ | 211,745 | $ | 182,299 | ||||
|
|
|
|
|
|||||
| Liabilities, Redeemable Preferred Stock and Stockholders’ Equity (Deficit) |
||||||||
| Liabilities: |
||||||||
| Current liabilities: |
||||||||
| Current maturities of notes payable |
$ | 11,040 | $ | 8,134 | ||||
| Accrued salaries and benefits |
9,288 | 7,138 | ||||||
| Accounts payable |
1,403 | 60 | ||||||
| Other current liabilities |
8,252 | 8,475 | ||||||
| Income taxes payable |
430 | 470 | ||||||
| Deferred revenue |
2,187 | 2,214 | ||||||
| Estimated liability for appeals |
4,378 | 450 | ||||||
|
|
|
|
|
|||||
| Total current liabilities |
36,978 | 26,941 | ||||||
| Notes payable, net of current portion |
136,729 | 87,051 | ||||||
| Line of credit, drawn |
— | 8,198 | ||||||
| Deferred compensation |
— | 1,761 | ||||||
| Deferred income taxes |
11,271 | 14,647 | ||||||
| Other liabilities |
2,694 | 1,158 | ||||||
|
|
|
|
|
|||||
| Total liabilities |
187,672 | 139,756 | ||||||
|
|
|
|
|
|||||
| Commitments and contingencies |
||||||||
| Redeemable preferred stock |
||||||||
| Series A convertible preferred stock, $0.0001 par value. Authorized, 50,000 and 18,000 shares; issued and outstanding, 0 and 5,296 shares at December 31, 2012 and 2011, respectively |
— | 58,248 | ||||||
|
|
|
|
|
|||||
| Stockholders’ equity (deficit): |
||||||||
| Due from stockholders |
— | (2,266 | ) | |||||
| Common stock, $0.0001 par value. Authorized, 500,000 and 50,000 shares at December 31, 2012 and 2011, respectively; issued and outstanding 45,392 and 37,667 shares at December 31, 2012 and 2011, respectively |
4 | 4 | ||||||
| Additional paid-in capital |
35,970 | 19,371 | ||||||
| Accumulated deficit |
(11,901 | ) | (32,814 | ) | ||||
|
|
|
|
|
|||||
| Total stockholders’ equity (deficit) |
24,073 | (15,705 | ) | |||||
|
|
|
|
|
|||||
| Total liabilities, redeemable preferred stock, and stockholders’ equity (deficit) |
$ | 211,745 | $ | 182,299 | ||||
|
|
|
|
|
|||||
See accompanying notes to consolidated financial statements.
F-3
Table of Contents
PERFORMANT FINANCIAL CORPORATION AND SUBSIDIARIES
Consolidated Statements of Operations
(In thousands, except per share amounts)
| For the Years Ended December 31, | ||||||||||||
| 2012 | 2011 | 2010 | ||||||||||
| Revenues |
$ | 210,073 | $ | 162,974 | $ | 123,519 | ||||||
| Operating expenses: |
||||||||||||
| Salaries and benefits |
83,002 | 67,082 | 58,113 | |||||||||
| Other operating expenses |
71,305 | 49,199 | 33,655 | |||||||||
| Impairment of trade name |
— | 13,400 | — | |||||||||
|
|
|
|
|
|
|
|||||||
| Total operating expenses |
154,307 | 129,681 | 91,768 | |||||||||
|
|
|
|
|
|
|
|||||||
| Income from operations |
55,766 | 33,293 | 31,751 | |||||||||
| Debt extinguishment costs |
(3,679 | ) | — | — | ||||||||
| Interest expense |
(12,414 | ) | (13,530 | ) | (15,230 | ) | ||||||
| Interest income |
64 | 125 | 118 | |||||||||
|
|
|
|
|
|
|
|||||||
| Income before provision for income taxes |
39,737 | 19,888 | 16,639 | |||||||||
| Provision for income taxes |
16,786 | 7,516 | 6,664 | |||||||||
|
|
|
|
|
|
|
|||||||
| Net income |
$ | 22,951 | $ | 12,372 | $ | 9,975 | ||||||
|
|
|
|
|
|
|
|||||||
| Accrual for preferred stock dividends |
2,038 | 6,495 | 5,771 | |||||||||
| Net income available to common shareholders |
$ | 20,913 | $ | 5,877 | $ | 4,204 | ||||||
|
|
|
|
|
|
|
|||||||
| Net income per share attributable to common shareholders (see Note 1) |
||||||||||||
| Basic |
$ | 0.48 | $ | 0.14 | $ | 0.10 | ||||||
|
|
|
|
|
|
|
|||||||
| Diluted |
$ | 0.44 | $ | 0.13 | $ | 0.09 | ||||||
|
|
|
|
|
|
|
|||||||
| Weighted average shares (see Note 1) |
||||||||||||
| Basic |
43,985 | 42,962 | 42,962 | |||||||||
|
|
|
|
|
|
|
|||||||
| Diluted |
47,599 | 45,742 | 45,019 | |||||||||
|
|
|
|
|
|
|
|||||||
See accompanying notes to consolidated financial statements.
F-4
Table of Contents
PERFORMANT FINANCIAL CORPORATION AND SUBSIDIARIES
Consolidated Statements of Changes in Redeemable Preferred Stock and Stockholders’ Equity (Deficit)
For the Years Ended December 31, 2012, 2011 and 2010
(In thousands)
| Redeemable Preferred
Stock Series A Convertible Preferred Stock |
Due From Stockholders |
Common Stock | Additional Paid-In Capital |
Accumulated Deficit |
Total | |||||||||||||||||||||||||||
| Shares | Amount | Shares | Amount | |||||||||||||||||||||||||||||
| Balance, December 31, 2009 |
5,296 | $ | 45,982 | $ | (2,161 | ) | 37,667 | $ | 4 | $ | 18,728 | $ | (42,895 | ) | $ | (26,324 | ) | |||||||||||||||
| Increase in redemption value of Series A preferred stock |
— | 5,771 | — | — | — | — | (5,771 | ) | (5,771 | ) | ||||||||||||||||||||||
| Interest on notes receivable from stockholders |
— | — | (103 | ) | — | — | — | — | (103 | ) | ||||||||||||||||||||||
| Stock-based compensation expense |
— | — | 106 | — | — | 523 | — | 629 | ||||||||||||||||||||||||
| Net income |
— | — | — | — | — | — | 9,975 | 9,975 | ||||||||||||||||||||||||
|
|
|
|
|
|
|
|
|
|
|
|
|
|
|
|
|
|||||||||||||||||
| Balance, December 31, 2010 |
5,296 | 51,753 | (2,158 | ) | 37,667 | 4 | 19,251 | (38,691 | ) | (21,594 | ) | |||||||||||||||||||||
| Increase in redemption value of Series A preferred stock |
— | 6,495 | — | — | — | — | (6,495 | ) | (6,495 | ) | ||||||||||||||||||||||
| Interest on notes receivable from stockholders |
— | — | (108 | ) | — | — | — | — | (108 | ) | ||||||||||||||||||||||
| Stock-based compensation expense |
— | — | — | — | — | 120 | — | 120 | ||||||||||||||||||||||||
| Net income |
— | — | — | — | — | — | 12,372 | 12,372 | ||||||||||||||||||||||||
|
|
|
|
|
|
|
|
|
|
|
|
|
|
|
|
|
|||||||||||||||||
| Balance, December 31, 2011 |
5,296 | 58,248 | (2,266 | ) | 37,667 | 4 | 19,371 | (32,814 | ) | (15,705 | ) | |||||||||||||||||||||
| Increase in redemption value of Series A preferred stock |
— | 2,038 | — | — | — | — | (2,038 | ) | (2,038 | ) | ||||||||||||||||||||||
| Conversion of Series A preferred stock to Series B preferred stock which was immediately redeemed for cash |
— | (60,286 | ) | — | — | — | — | — | — | |||||||||||||||||||||||
| Conversion of Series B preferred stock to common |
(5,296 | ) | — | — | 5,296 | — | — | — | — | |||||||||||||||||||||||
| Exercise of stock options |
— | — | — | 284 | — | 175 | — | 175 | ||||||||||||||||||||||||
| Issuance of stock |
— | — | — | 2,243 | — | 15,420 | — | 15,420 | ||||||||||||||||||||||||
| Purchase of treasury stock |
— | — | — | (98 | ) | — | (1,225 | ) | — | (1,225 | ) | |||||||||||||||||||||
| Interest on notes receivable from stockholders |
— | — | (57 | ) | — | — | — | — | (57 | ) | ||||||||||||||||||||||
| Repayment of notes receivable from stockholders |
— | — | 2,323 | — | — | — | — | 2,323 | ||||||||||||||||||||||||
| Stock-based compensation expense |
— | — | — | — | — | 1,614 | — | 1,614 | ||||||||||||||||||||||||
| Income tax benefit from employee stock options |
— | — | — | — | — | 615 | — | 615 | ||||||||||||||||||||||||
| Net income |
— | — | — | — | — | — | 22,951 | 22,951 | ||||||||||||||||||||||||
|
|
|
|
|
|
|
|
|
|
|
|
|
|
|
|
|
|||||||||||||||||
| Balance, December 31, 2012 |
— | $ | — | $ | — | 45,392 | $ | 4 | $ | 35,970 | $ | (11,901 | ) | $ | 24,073 | |||||||||||||||||
|
|
|
|
|
|
|
|
|
|
|
|
|
|
|
|
|
|||||||||||||||||
See accompanying notes to consolidated financial statements.
F-5
Table of Contents
PERFORMANT FINANCIAL CORPORATION AND SUBSIDIARIES
Consolidated Statements of Cash Flows
(In thousands)
| For the Years Ended December 31, | ||||||||||||
| 2012 | 2011 | 2010 | ||||||||||
| Cash flows from operating activities: |
||||||||||||
| Net income |
$ | 22,951 | $ | 12,372 | $ | 9,975 | ||||||
| Adjustments to reconcile net income to net cash provided by operating activities: |
||||||||||||
| Loss on disposal of assets |
51 | — | — | |||||||||
| Impairment of intangible asset |
— | 13,400 | — | |||||||||
| Depreciation and amortization |
9,505 | 7,766 | 7,213 | |||||||||
| Write-off of unamortized debt issuance costs |
335 | — | — | |||||||||
| Deferred income taxes |
(1,826 | ) | (9,640 | ) | 32 | |||||||
| Stock-based compensation |
1,614 | 120 | 629 | |||||||||
| Interest expense from debt issuance costs and amortization of discount note payable |
1,272 | 1,254 | 1,997 | |||||||||
| Interest income on notes receivable from stockholders |
(57 | ) | (108 | ) | (103 | ) | ||||||
| Changes in operating assets and liabilities: |
||||||||||||
| Trade accounts receivable |
(3,646 | ) | (5,392 | ) | 1,610 | |||||||
| Prepaid expenses and other current assets |
416 | (94 | ) | (664 | ) | |||||||
| Other assets |
(71 | ) | 372 | (394 | ) | |||||||
| Accrued salaries and benefits |
2,150 | 2,542 | (69 | ) | ||||||||
| Accounts payable |
1,343 | (3 | ) | (255 | ) | |||||||
| Other current liabilities |
(1,223 | ) | 4,714 | (1,882 | ) | |||||||
| Income taxes payable |
(40 | ) | 470 | — | ||||||||
| Deferred revenue |
(27 | ) | 2,214 | — | ||||||||
| Estimated liability for appeals |
3,928 | 450 | — | |||||||||
| Other liabilities |
330 | (1,452 | ) | 125 | ||||||||
|
|
|
|
|
|
|
|||||||
| Net cash provided by operating activities |
37,005 | 28,985 | 18,214 | |||||||||
|
|
|
|
|
|
|
|||||||
| Cash flows from investing activities: |
||||||||||||
| Purchase of property, equipment, and leasehold improvements |
(11,356 | ) | (6,111 | ) | (4,921 | ) | ||||||
| Purchase of perpetual software license and computer equipment |
(837 | ) | — | — | ||||||||
|
|
|
|
|
|
|
|||||||
| Net cash used in investing activities |
(12,193 | ) | (6,111 | ) | (4,921 | ) | ||||||
|
|
|
|
|
|
|
|||||||
| Cash flows from financing activities: |
||||||||||||
| Borrowing under notes payable |
156,000 | — | — | |||||||||
| Borrowing under line of credit |
4,500 | — | — | |||||||||
| Redemption of preferred stock |
(60,286 | ) | — | — | ||||||||
| Repayment of notes payable |
(103,416 | ) | (13,948 | ) | (9,967 | ) | ||||||
| Repayment of line of credit |
(12,698 | ) | — | — | ||||||||
| Debt issuance costs paid |
(3,074 | ) | — | (1,172 | ) | |||||||
| Proceeds from exercise of stock options |
175 | — | — | |||||||||
| Proceeds from issuance of stock |
12,624 | — | — | |||||||||
| Repayment of promissory notes from stockholders |
2,323 | — | — | |||||||||
| Income tax benefit from employee stock options |
615 | — | — | |||||||||
| Payment to stockholders |
(1,761 | ) | — | — | ||||||||
| Purchase of treasury stock |
(1,225 | ) | — | — | ||||||||
| Payment of purchase obligation |
(750 | ) | — | — | ||||||||
|
|
|
|
|
|
|
|||||||
| Net cash used in financing activities |
(6,973 | ) | (13,948 | ) | (11,139 | ) | ||||||
|
|
|
|
|
|
|
|||||||
| Net increase in cash and cash equivalents |
17,839 | 8,926 | 2,154 | |||||||||
| Cash and cash equivalents at beginning of year |
20,004 | 11,078 | 8,924 | |||||||||
|
|
|
|
|
|
|
|||||||
| Cash and cash equivalents at end of year |
$ | 37,843 | $ | 20,004 | $ | 11,078 | ||||||
|
|
|
|
|
|
|
|||||||
| Supplemental disclosures of cash flow information: |
||||||||||||
| Cash paid for income taxes |
$ | 18,037 | $ | 15,830 | $ | 6,209 | ||||||
|
|
|
|
|
|
|
|||||||
| Cash paid for interest |
$ | 11,178 | $ | 12,246 | $ | 13,048 | ||||||
|
|
|
|
|
|
|
|||||||
| Cash paid as debt extinguisment |
$ | 3,344 | $ | — | $ | — | ||||||
|
|
|
|
|
|
|
|||||||
| Supplemental disclosure of non-cash investing and financing activities: |
||||||||||||
| Obligation to sellers of perpetual license |
$ | 3,250 | $ | — | $ | — | ||||||
|
|
|
|
|
|
|
|||||||
| Issuance of common stock as part of debt issuance costs |
$ | 2,796 | $ | — | $ | — | ||||||
|
|
|
|
|
|
|
|||||||
See accompanying notes to consolidated financial statements.
F-6
Table of Contents
PERFORMANT FINANCIAL CORPORATION AND SUBSIDIARIES
Notes To Consolidated Financial Statements
For the Years Ended December 31, 2012, 2011 and 2010
| 1. | Summary of Significant Accounting Policies |
| (a) | Organization and Nature of Business |
Performant Financial Corporation (the Company) is a leading provider of technology-enabled recovery and analytics services in the United States. Company services help identify, restructure and recover delinquent or defaulted assets and improper payments for both government and private clients in a broad range of markets. Company clients typically operate in complex and regulated environments and outsource their recovery needs in order to reduce losses on billions of dollars of defaulted student loans, improper healthcare payments and delinquent state tax and federal treasury receivables. The Company generally provides our services on an outsourced basis, where we handle many or all aspects of the clients’ recovery processes.
The Company’s consolidated financial statements include the operations of Performant Financial Corporation (PFC), its wholly owned subsidiary Performant Business Services, Inc., and its wholly owned subsidiaries Performant Recovery, Inc. (Recovery), and Performant Technologies, Inc. Effective August 13, 2012, we changed the name of our wholly owned subsidiary from DCS Business Services, Inc. (DCSBS) to Performant Business Services, Inc., and DCSBS’ wholly owned subsidiaries from Diversified Collection Services, Inc. (DCS), and Vista Financial, Inc. (VFI), to Performant Recovery, Inc., and Performant Technologies, Inc., respectively. PFC is a Delaware corporation headquartered in California and was formed in 2003. Performant Business Services, Inc. is a Nevada corporation founded in 1997. Recovery is a California corporation founded in 1976. Performant Technologies, Inc. is a California corporation that was formed in 2004.
The Company is managed and operated as one business, with a single management team that reports to the Chief Executive Officer.
| (b) | Principles of Consolidation |
The accompanying consolidated financial statements have been prepared in accordance with U.S. Generally Accepted Accounting Principles, or U.S. GAAP. The Company consolidates entities in which it has controlling financial interest, and as of December 31, 2012, all of the Company’s subsidiaries are 100% owned. All significant intercompany balances and transactions have been eliminated in consolidation.
| (c) | Use of Estimates in the Preparation of Consolidated Financial Statements |
The preparation of the consolidated financial statements in conformity with U.S. GAAP, requires management to make certain estimates and assumptions that affect the reported amounts of assets and liabilities, primarily accounts receivable, intangible assets, goodwill, estimated liability for appeals, accrued expenses, and disclosure of contingent assets and liabilities at the date of the consolidated financial statements and the reported amounts of revenues and expenses during the reporting periods. Our actual results could differ from those estimates.
| (d) | Stock Split |
On July 26, 2012, the Company effected a two-for-one stock split of the Company’s shares of Common Stock. Accordingly, all per share amounts, average shares outstanding, shares outstanding, and equity based compensation presented in the consolidated financial statements and notes have been adjusted retroactively to reflect the stock split. Shareholders’ deficit has been retroactively adjusted to give effect to the stock split for all periods presented by reclassifying the par value of the additional shares issued in connection with the stock split to additional paid-in capital. Concurrently with the stock split,
F-7
Table of Contents
the authorized Common Stock was increased from 25,000,000 shares to 60,000,000 shares. On August 15, 2012, the authorized Common Stock was increased to 500,000,000 shares and the authorized preferred stock was increased to 50,000,000 shares.
| (e) | Cash and Cash Equivalents |
Cash and cash equivalents include demand deposits and highly liquid debt instruments with original maturities of three months or less when purchased. These investments can include money market funds that invest in highly liquid U.S. government and agency obligations, certificates of deposit, bankers’ acceptances, and commercial paper.
The Company collects monies on behalf of its clients. Cash is often held on behalf of the clients in various trust accounts and is subsequently remitted to the clients based on contractual agreements. Cash held in these trust accounts for contracting agencies is not included in the Company’s assets (Note 12(a)).
| (f) | Hosted Service Installation and Implementation Deliverables |
In 2008, the Company entered into a long-term contract to provide hosted services to a client beginning in March 2009. The Company determined that certain installation and implementation deliverables were not separate units of accounting within the contract, and should be combined for revenue recognition purposes with the hosted service deliverable. Accordingly, revenue for these contract elements is being taken ratably from the commencement of hosted services in March 2009 through the contract period of March 2018. Additionally, the Company deferred the direct incremental costs associated with the installation and implementation deliverables, with the costs being expensed ratably from the March 2009 commencement of services through March 2018.
| (g) | Property, Equipment, and Leasehold Improvements |
Property, equipment, and leasehold improvements are stated at cost, net of accumulated depreciation. Furniture and equipment are depreciated using the straight-line method over estimated useful lives ranging from 5 to 7 years. Buildings are depreciated using the straight-line method over 31.5 years. Leasehold improvements are amortized using the straight-line method over the shorter of the estimated life of the asset or the remaining term of the lease. Computer software and computer hardware are depreciated using the straight-line method over 3 years and 5 years, respectively.
Maintenance and repairs are charged to expense as incurred. Improvements that extend the useful lives of assets are capitalized.
When property is sold or retired, the cost and the related accumulated depreciation are removed from the consolidated balance sheet and any gain or loss from the transaction is included in the consolidated statements of operations.
| (h) | Goodwill and Other Intangible Assets |
Goodwill represents the excess of purchase price and related costs over the fair value assigned to the net assets of businesses acquired. Goodwill is not amortized, but instead is reviewed for impairment at least annually. Impairment is the condition that exists when the carrying amount of goodwill is not recoverable and its carrying amount exceeds its fair value. In accordance with Accounting Standard Update (ASU) 2011-08, Intangibles—Goodwill and Other (Topic 350): Testing Goodwill for Impairment, the Company performed a qualitative assessment of whether it is more likely than not that goodwill fair value is less than its carrying amount for 2012, and concluded that there was no need to perform an impairment test. The Company performed a qualitative assessment of whether it is more likely than not that goodwill fair value is less than its carrying amount for 2011, and again concluded that there was no need to perform an impairment test. The Company applied impairment tests to its goodwill and determined that no impairment loss had occurred during 2010.
F-8
Table of Contents
Identifiable intangible assets consist of customer contracts and related relationships, a perpetual license, and covenants not to compete. Customer contracts and related relationships are amortized over their estimated useful life of 4 – 20 years. The perpetual license is amortized over its estimated useful life of 5 years.
| (i) | Impairment of Long-Lived Assets |
Long-lived assets are evaluated for impairment whenever events or changes in circumstances indicate that the carrying amount of such assets or intangibles may not be recoverable. Recoverability of assets to be held and used is measured by a comparison of the carrying amount of the assets to future undiscounted net cash flows expected to be generated by the assets. If such assets are considered to be impaired, the impairment to be recognized is measured by the amount by which the carrying amount of the assets exceeds the fair value of the assets. The Company did not recognize an impairment expense for intangible assets in 2012 and 2010. In 2011, the Company recorded $13.4 million of impairment expense to write off the carrying amount of its former trade name, Diversified Collection Services, Inc. (DCS). The Company determined that the DCS trade name would not be used in the future, and retired the trade name intangible asset accordingly.
| (j) | System Developments |
The Company follows the provisions of Financial Accounting Standards Board (FASB) Accounting Standards Update (ASC) Subtopic 350-40, Internal-Use Software, which specifies that costs incurred during the application stage of development should be capitalized. All other costs are expensed as incurred. During 2012, 2011 and 2010, costs of $5.4 million, $2.5 million and $2.1 million respectively, were capitalized for projects in the application stage of development, with depreciation expense of $2.4 million, $2.1 million and $1.5 million respectively, for completed projects.
| (k) | Debt Issuance Costs |
Debt issuance costs represent loan and legal fees paid in connection with the issuance of long-term debt. Debt issuance cost is amortized to interest expense in accordance with key terms of the notes as amended.
| (l) | Revenues, Accounts Receivable, and Estimated Liability for Appeals |
Revenue is recognized upon the collection of defaulted loan and debt payments. Loan rehabilitation revenue is recognized when the rehabilitated loans are sold (funded) by clients. Incentive revenue is recognized upon receipt of official notification of incentive award from customers. Under the Company’s RAC contract with CMS, the Company recognizes revenues when the healthcare provider has paid CMS for a given claim or offset. Providers have the right to appeal a claim and may pursue additional appeals if the initial appeal is found in favor of CMS. The Company accrues an estimated liability for appeals based on the amount of commissions received which are subject to appeal and which the Company estimates are probable of being returned to providers following successful appeal. At December 31, 2012, a total of $5.6 million was presented as an allowance against revenue, representing the Company’s estimate of claims that may be overturned. Of this amount, $1.2 million was related to amounts in accounts receivable and $4.4 million was related to commissions which had already been received. The balances at December 31, 2012 and 2011, were $4.4 million and $0.5 million, respectively, represent the Company’s best estimate of the probable amount of losses related to appeals of claims for which commissions were previously collected. In addition to the $4.4 million amount accrued at December 31, 2012, the Company estimates that it is reasonably possible that it could be required to pay an additional amount up to approximately $1.5 million as a result of potentially successful appeals. To the extent that required payments by the Company exceed the amount accrued, revenues in the applicable period would be reduced by the amount of the excess.
F-9
Table of Contents
For the year ended December 31, 2012, the Company had 5 clients whose individual revenues exceeded 10% of the Company’s total revenues. The dollar amount and percent of total revenue of each of the 5 clients is summarized in the table below (in thousands):
| Rank |
2012 Revenue | Percent of total revenue |
||||||
| 1 |
$ | 54,130 | 25.8 | % | ||||
| 2 |
39,183 | 18.7 | % | |||||
| 3 |
29,027 | 13.8 | % | |||||
| 4 |
25,469 | 12.1 | % | |||||
| 5 |
22,397 | 10.7 | % | |||||
For the year ended December 31, 2011, the Company had 5 clients whose individual revenues exceeded 10% of the Company’s total revenues. The dollar amount and percent of total revenue of each of the 5 clients is summarized in the table below (in thousands):
| Rank |
2011 Revenue | Percent of total revenue |
||||||
| 1 |
$ | 30,732 | 18.9 | % | ||||
| 2 |
28,504 | 17.5 | % | |||||
| 3 |
21,812 | 13.4 | % | |||||
| 4 |
21,549 | 13.2 | % | |||||
| 5 |
17,934 | 11.0 | % | |||||
For the year ended December 31, 2010, the Company had 4 clients whose individual revenues exceeded 10% of the Company’s total revenues. The dollar amount and percent of total revenue of each of the 4 clients is summarized in the table below (in thousands):
| Rank |
2010 Revenue | Percent of total revenue |
||||||
| 1 |
$ | 27,881 | 22.6 | % | ||||
| 2 |
20,776 | 16.8 | % | |||||
| 3 |
17,287 | 14.0 | % | |||||
| 4 |
15,445 | 12.5 | % | |||||
Revenue from the largest three customers was 58%, 50% and 53% of total revenue in 2012, 2011 and 2010, respectively. Accounts receivable due from these three customers were 63%, 25% and 41% of total trade receivables at December 31, 2012, 2011 and 2010, respectively. Trade accounts receivable are recorded at the invoiced amount and do not bear interest. Amounts collected on trade accounts receivable are included in net cash provided by operating activities in the consolidated statements of cash flows. The Company determines the allowance for doubtful accounts by specific identification. Account balances are charged off against the allowance after all means of collection have been exhausted and the potential for recovery is considered remote. The allowance for doubtful accounts was $0.1 million and $0.1 million at December 31, 2012 and 2011, respectively.
| (m) | Legal Expenses |
The Company recognizes legal fees related to litigation as they are incurred.
| (n) | Comprehensive Income |
The Company has no components of comprehensive income other than its net income. Accordingly, comprehensive income is equivalent to net income.
| (o) | Fair Value of Financial Instruments |
The Company’s financial instruments include cash and cash equivalents, accounts receivable, accounts payable and accrued liabilities, short-term debt and long-term debt. The carrying values of
F-10
Table of Contents
cash and cash equivalents, accounts receivable, accounts payable, and accrued liabilities approximate their fair values based on or due to their short-term maturities. The carrying values of short-term debt and long-term debt approximate fair value, in which their variable interest rates approximate market rates.
| (p) | Income Taxes |
The Company accounts for income taxes under the asset-and-liability method. Deferred income tax assets and liabilities are recognized for future tax consequences attributable to differences between the carrying value of assets and liabilities for financial reporting purposes and for taxation purposes. Deferred income tax assets and liabilities are measured using the enacted tax rates expected to apply to taxable income in the years in which those temporary differences are expected to be recovered or settled. The effect of a change in tax rates on deferred income tax assets and liabilities is recognized in income in the period that includes the enactment date. Valuation allowances are established when necessary to reduce deferred tax assets to the amount expected to be realized.
The Company recognizes the effect of income tax positions only if those positions are more likely than not of being sustained. Recognized income tax positions are measured at the largest amount that is greater than 50% likely of being realized. Changes in recognition or measurement are reflected in the period in which the change in judgment occurs.
| (q) | Preferred Stock |
The carrying amounts of preferred stock are periodically increased by amounts representing dividends not currently declared or paid, but which would be payable under certain redemption features. Such increases in carrying amounts are recorded against retained earnings.
| (r) | Stock Options |
The Company accounts for its employee stock-based compensation awards in accordance with FASB ASC Topic 718, Compensation – Stock Compensation. FASB ASC Topic 718 requires that all employee stock-based compensation is recognized as a cost in the financial statements and that for equity-classified awards, such cost is measured at the grant date fair value of the award. The Company estimates grant date fair value using the Black-Scholes-Merton option-pricing model.
FASB ASC Topic 718 also requires that excess tax benefits recognized in equity related to stock option exercises are reflected as financing cash inflows. The Company recognized income tax benefits resulting from the exercise of stock options in 2012, 2011 and 2010 of $0.6 million, $0 million and $0 million, respectively.
| (s) | Earnings per Share |
Basic earnings per share is calculated by dividing net income available to common shareholders by the sum of the weighted average number of common shares outstanding during the period plus the weighted average number of Series A preferred shares outstanding during the period. The Series A shares are included in the basic denominator because they could be converted into common shares for no cash consideration (via conversion units as further described in Note 7), and were thus considered outstanding common shares in computing basic earnings per share. Diluted earnings per share is calculated by dividing net income available to common shareholders by the weighted average number of common shares and dilutive common shares equivalents outstanding during the period. The Company’s common share equivalents consist of stock options.
F-11
Table of Contents
The following table reconciles the basic to diluted weighted average shares outstanding using the treasury stock method (shares in thousands):
| Year Ended December 31, | ||||||||||||
| 2012 | 2011 | 2010 | ||||||||||
| Weighted average shares outstanding—basic |
43,985 | 42,962 | 42,962 | |||||||||
| Dilutive effect of stock options |
3,614 | 2,780 | 2,057 | |||||||||
| Weighted average shares outstanding—diluted |
47,599 | 45,742 | 45,019 | |||||||||
For the year ended December 31, 2012, the Company excluded from the calculation of diluted earnings per share options to purchase 2,364,000 shares because such outstanding options’ combined exercise price, unamortized fair value and excess tax benefits were greater than the average market price of our common shares in each of those periods because their effect would be anti-dilutive (i.e., including such options would result in higher earnings per share).
| (t) | Recent Accounting Pronouncements |
In December 2011, the FASB issued ASU No. 2011-11, Balance Sheet (Topic 210): Disclosures about Offsetting Assets and Liabilities. ASU 2011-11 requires an entity to disclose information about offsetting and related arrangements to enable users of financial statements to understand the effect of those arrangements on its financial position, and to allow investors to better compare financial statements prepared under U.S. GAAP with financial statements prepared under International Financial Reporting Standards (IFRS). The new standards are effective for annual periods beginning January 1, 2013, and interim periods within those annual periods. Retrospective application is required. The Company implemented the provisions of ASU 2011-11 as of January 1, 2013. The Company does not believe its adoption of the new guidance will have an impact on its consolidated financial statement.
In June 2011, the FASB issued ASU 2011-05, Comprehensive Income (Topic 220): Presentation of Comprehensive Income. Under this ASU, an entity will have the option to present the components of net income and comprehensive income in either one or two consecutive financial statements. The ASU eliminates the option in U.S. GAAP to present other comprehensive income in the statement of changes in equity. An entity should apply the ASU retrospectively. For a nonpublic entity, the ASU is effective for fiscal years ending after December 15, 2012, and interim and annual periods thereafter. Early adoption is permitted. In December 2011, the FASB decided to defer the effective date of those changes in ASU 2011-05 that relate only to the presentation of reclassification adjustments in the statement of operations by issuing ASU 2011-12, Comprehensive Income (Topic 220): Deferral of the Effective Date for Amendments to the Presentation of Reclassifications of Items Out of Accumulated Other Comprehensive income in Accounting Standards Update No. 2011-05. The Company adopted this new accounting guidance with no impact to our consolidated financial statements.
In May 2011, the FASB issued ASU 2011-04, Fair Value Measurement (Topic 820): Amendments to Achieve Common Fair Value Measurement and Disclosure Requirements in U.S. GAAP and IFRSs. The new standards do not extend the use of fair value but, rather, provide guidance about how fair value should be applied where it already is required or permitted under IFRS or U.S. GAAP. For U.S. GAAP, most of the changes are clarifications of existing guidance or wording changes to align with IFRS. A nonpublic entity is required to apply the ASU prospectively for annual periods beginning after December 15, 2011. The Company adopted ASU 2011-04 in 2012 with no impact to our consolidated financial statements.
| (u) | Reclassifications |
Certain reclassifications have been made to the 2011 balances to conform to the 2012 presentation. Such reclassifications have no effect on net income or retained earnings as previously reported.
| 2. | Acquisition |
In February 2012, the Company purchased a perpetual software license and computer equipment from HOPS, a non-public Florida company, in a transaction valued at $3.68 million. The purchase agreement
F-12
Table of Contents
calls for a total of $4.0 million in cash payments to be made over an approximate 3 year period, beginning with an initial payment of $0.8 million which was made in February 2012, followed by quarterly payments of $0.3 million. As part of the transaction valuation, these payments were discounted to a present value using an estimate of our incremental borrowing rate.
The HOPS proprietary software platform provides data filtering services for government and commercial health plans to help identify improper payments made to health providers, and enhances our existing service offering in recovery of improper payments.
The purchase is being treated as a business combination for accounting purposes; the following table summarizes the estimated fair values of the assets acquired at the acquisition date (in thousands):
| February 1, 2012 |
||||
| Computer equipment |
$ | 280 | ||
| Perpetual license |
3,250 | |||
| Customer relationships |
150 | |||
|
|
|
|||
| Total identifiable assets acquired |
$ | 3,680 | ||
|
|
|
|||
The acquired intangible assets will be amortized over their estimated useful lives, which are 5 and 4 years for the perpetual license and customer relationships, respectively.
The following represents our pro forma Consolidated Statements of Income as if HOPS had been included in our consolidated results for the years ending December 31, 2012 and 2011 ( in thousands, except for per share data):
| For the year ended December 31, |
||||||||
| 2012 | 2011 | |||||||
| Total revenue |
$ | 211,329 | $ | 164,230 | ||||
|
|
|
|
|
|||||
| Net income available to common shareholders |
$ | 18,751 | $ | 3,715 | ||||
|
|
|
|
|
|||||
| Earnings per share attributable to common shareholders |
||||||||
| Basic |
$ | 0.43 | $ | 0.09 | ||||
|
|
|
|
|
|||||
| Diluted |
$ | 0.39 | $ | 0.08 | ||||
|
|
|
|
|
|||||
| 3. | Property, Equipment, and Leasehold Improvements |
Property, equipment, and leasehold improvements consist of the following at December 31, 2012 and 2011 (in thousands):
| December 31, 2012 |
December 31, 2011 |
|||||||
| Land |
$ | 1,767 | $ | 1,767 | ||||
| Building and leasehold improvements |
5,500 | 4,797 | ||||||
| Furniture, equipment, and automobile |
4,408 | 3,612 | ||||||
| Computer hardware and software |
40,886 | 31,197 | ||||||
|
|
|
|
|
|||||
| 52,561 | 41,373 | |||||||
| Less accumulated depreciation and amortization |
(31,892 | ) | (26,458 | ) | ||||
|
|
|
|
|
|||||
| Property, equipment and leasehold improvements, net |
$ | 20,669 | $ | 14,915 | ||||
|
|
|
|
|
|||||
Depreciation and amortization expense of property, equipment and leasehold improvements was $5.8 million, $4.7 million and $4.2 million for the years ended December 31, 2012, 2011 and 2010, respectively.
F-13
Table of Contents
| 4. | Identifiable Intangible Assets |
Identifiable intangible assets consist of the following at December 31, 2012 and 2011 (in thousands):
| December 31, 2012 |
Gross Amounts |
Accumulated Amortization |
Net | |||||||||
| Amortizable intangibles: |
||||||||||||
| Customer contracts and related relationships |
$ | 62,198 | $ | (28,608 | ) | $ | 33,590 | |||||
| Perpetual license |
3,250 | (596 | ) | 2,654 | ||||||||
|
|
|
|
|
|
|
|||||||
| Total intangible assets |
$ | 65,448 | $ | (29,204 | ) | $ | 36,244 | |||||
|
|
|
|
|
|
|
|||||||
| December 31, 2011 |
Gross Amounts |
Accumulated Amortization |
Net | |||||||||
| Amortizable intangibles: |
||||||||||||
| Customer contracts and related relationships |
$ | 62,046 | $ | (25,530) | $ | 36,516 | ||||||
|
|
|
|
|
|
|
|||||||
| Total intangible assets |
$ | 62,046 | $ | (25,530) | $ | 36,516 | ||||||
|
|
|
|
|
|
|
|||||||
For the years ended December 31, 2012, 2011 and 2010, amortization expense related to intangible assets amounted to $3.7 million, $3.0 million and $3.0, respectively.
The estimated aggregate amortization expense for each of the five following fiscal years is as follows (in thousands):
| Year Ending December 31, |
Amount | |||
| 2013 |
$ | 3,731 | ||
| 2014 |
3,731 | |||
| 2015 |
3,731 | |||
| 2016 |
3,696 | |||
| 2017 |
3,097 | |||
| Thereafter |
18,258 | |||
|
|
|
|||
| Total |
$ | 36,244 | ||
|
|
|
|||
| 5. | Credit Agreement |
On March 19, 2012, the Company recapitalized entering into a credit agreement (the Agreement) consisting of a Term A Loan of $57.0 million, a Term B Loan of $79.5 million, and a revolving credit facility of $11.0 million. In connection with the recapitalization, our old credit facility, scheduled to mature in 2012, was extinguished, and our indebtedness on the old facility was paid in full. As of December 31, 2011, the indebtedness on the old facility consisted of $33.2 million under the Term A-2 Loan, $62 million under the Term B Loan and $8.2 million under the line of credit. On June 28, 2012, the Agreement was amended to increase the Term B Loan to $99 million. Payments under the Agreement are as follows (in thousands):
| Year Ending December 31, |
Amount | |||
| 2013 |
$ | 11,040 | ||
| 2014 |
11,040 | |||
| 2015 |
11,040 | |||
| 2016 |
11,040 | |||
| 2017 |
10,253 | |||
| Thereafter |
93,356 | |||
|
|
|
|||
| Total |
$ | 147,769 | ||
|
|
|
|||
Proceeds from the new Term A, Term B, and revolving credit facility borrowings were used along with $14.5 million of our cash to repay our old notes payable and line of credit in the amount of $103.4 million
F-14
Table of Contents
and to redeem 3,897,000 shares of Series A Convertible Preferred Stock plus accrued dividends for a total of $44.0 million. Fees paid in conjunction with the credit agreement totaled $8.1 million, including an agency fee for $1.5 million to an entity associated with our majority stockholder, and an agreement to grant 215,000 shares of Common Stock valued at approximately $2.8 million to an investment bank acting as advisor.
Proceeds from the additional Term B borrowings were used to redeem the remaining 1,399,000 shares of Series A Convertible Preferred Stock outstanding plus accrued dividends for a total of $16.3 million. Fees paid in conjunction with the credit agreement totaled $0.8 million, including an agency fee for $0.2 million to an entity associated with our majority stockholder. Remaining proceeds of $2.3 million were used along with existing cash to pay off the line of credit balance of $4.5 million.
The Term A Loan is charged interest either at Prime (subject to a 2.50% floor) +4.25% or LIBOR (subject to a 1.50% floor) +5.25%, which was 6.75% at December 31, 2012. The Term A loan requires quarterly payments of $2.5 million beginning in June 2012, with the remaining outstanding principal balance due March 19, 2017. As of December 31, 2012, the Term A loan ending balance, including the current portion was $49.5 million.
The Term B loan is charged interest at Prime +4.75% (subject to a 2.50% floor) or LIBOR (subject to a 1.50% floor) +5.75% which was 7.25% at December 31, 2012. The Term B loan requires quarterly payments of $0.2 million beginning in June 2012, with the outstanding principal balance due March 19, 2018. As of December 31, 2012, the Term B loan ending balance, including the current portion was $98.3 million.
The Company has a line of credit under the Agreement which allows for borrowings of up to $11 million. Borrowings accrue interest at Prime + 4.25% or LIBOR + 5.25%, which was 6.75% at December 31, 2012. Both the Prime and the LIBOR alternatives are subject to minimum rate floors. In addition, a facility fee of 0.5% is assessed on the commitment amount. There were no outstanding borrowings under this line of credit at December 31, 2012, and a letter of credit outstanding in the amount of $1.4 million, leaving remaining borrowing capacity under the line of credit of $9.6 million at December 31, 2012. The line of credit expires in March 19, 2017.
The Agreement contains certain restrictive financial covenants, which require, among other things, that we meet a minimum fixed charge coverage ratio of 1.20 and maximum total debt to EBITDA ratio of 3.25. Additionally, these covenants restrict the Company and its subsidiaries’ ability to incur certain types or amounts of indebtedness, incur liens on certain assets, make material changes in corporate structure or the nature of its business, dispose of material assets, engage in a change in control transaction, make certain foreign investments, enter into certain restrictive agreements, or engage in certain transactions with affiliates. We were in compliance with all such covenants at December 31, 2012.
During our March 19, 2012 recapitalization, debt issuance costs of $5.0 million were capitalized, including $1.5 million of agent fees paid to an entity associated with our majority stockholder, and $0.8 million paid to third parties for legal and other services and a grant of 215,044 shares of Common Stock issued as compensation to an investment bank acting as financial advisor valued at approximately $2.8 million, based upon a price of $13 per share. These costs are being amortized to expense over the life of the new loans.
The Company capitalized an additional $0.8 million related to our June 28, 2012 amendment to the Agreement, which included $0.2 million of agent fees paid to an entity associated with our majority stockholders, and $0.04 million paid to third parties for legal and other services. Debt issuance costs are being amortized to interest expense over the life of the new loans. Accumulated amortization of debt issuance costs amounted to $0.9 million at December 31, 2012.
Debt extinguishment costs of $3.7 million were expensed, including $3.3 million of fees paid to lenders, and $0.3 million of unamortized debt issuance costs associated with the old credit facility.
F-15
Table of Contents
| 6. | Commitments and Contingencies |
The Company leases office facilities and certain equipment. In January 2012, we renewed two of our facilities leases and entered into a new lease agreement for approximately 6,000 square feet in Livermore, California.
Future minimum rental commitments under non-cancelable leases as of December 31, 2012 are as follows (in thousands):
| Year Ending December 31, |
Amount | |||
| 2013 |
$ | 1,740 | ||
| 2014 |
1,769 | |||
| 2015 |
1,409 | |||
| 2016 |
986 | |||
| 2017 |
785 | |||
| Thereafter |
65 | |||
|
|
|
|||
| Total |
$ | 6,754 | ||
|
|
|
|||
Lease expense was $2.4 million, $1.9 million and $1.9 million for the year ended December 31, 2012, 2011 and 2010, respectively.
| 7. | Capital Stock |
Prior to August 15, 2012, the total number of shares of capital stock that the Company has authority to issue is 96,000,000, consisting of 18,000,000 shares of Series A Participating Senior Preferred Stock (Series A Preferred Stock), $0.0001 par value per share (Series A Preferred Stock); 18,000,000 shares of Series B Redeemable Senior Preferred Stock, $0.0001 par value per share (Series B Preferred Stock); and 60,000,000 shares of Common Stock, $0.0001 par value per share. On August 15, 2012, the authorized Common Stock was increased to 500,000,000 shares and the authorized preferred stock was increased to 50,000,000 shares.
| (a) | Series A Preferred Stock |
Issuance—On May 23, 2006, the Company sold 5,295,676 shares of Series A Preferred Stock to shareholders at a price of $5.67 per share, receiving gross proceeds of $30,000,000, and net proceeds of $29,925,000 after issuance costs of $75,000.
Dividends—The holders of Series A Preferred Stock were entitled to receive dividends as declared by the board of directors. The dividends accrued on a daily basis at the rate of 12% per annum on the sum of the Liquidation Value plus accumulated dividends and accrued and unpaid dividends thereon from the date of issuance of the Preferred Stock. As of December 31, 2011, the Company had accrued dividends payable of $28,248,000 recorded as an increase to the Series A Preferred Stock.
Voting—Each share of Series A Preferred Stock entitled the holder to cast a number of votes per share equal to the number of votes that the holder would be entitled to cast assuming that such shares of Series A Preferred Stock had been converted into shares of Common Stock.
Liquidation—In the event of any liquidation, dissolution, or winding up of the Company, before any distribution or payment to holders of Common Stock, but on parity with the holders of Series B Preferred Stock, holders of shares of Series A Preferred Stock were entitled to be paid an amount equal to the Liquidation Value of $5.67 per share plus any accumulated or accrued but unpaid dividends thereon. In addition to the payments set forth above, the holders of shares of Series A Preferred Stock were entitled to participate, on a parity and ratably on a per-share basis with the holders of Common Stock, with respect to all such distributions or payments that the holders of Series A Preferred Stock would have been entitled to receive with respect to the number of shares of Common Stock into which such holders’ shares of Series A Preferred Stock were convertible immediately prior to any relevant record date or payment date in connection with liquidation, dissolution, or winding up, but only to the
F-16
Table of Contents
extent that shares of Common Stock would have participated in such distributions or payments (and such payment shall be junior to all equity securities of the Company that rank senior to the Common Stock, including without limitation the Series B Preferred Stock).
Conversion—The Series A Preferred Stock was convertible into Conversion Units (as defined below), at a rate of one Conversion Unit for one share of Series A Preferred Stock. A Conversion Unit consisted of (i) the number of shares of Common Stock determined by dividing the Liquidation Value of the Series A Preferred Stock by the Conversion Price then in effect (the Common Portion) and (ii) one share of Series B Preferred Stock (the Series B Portion) subject to adjustments. If upon conversion there were any unpaid, accrued, or accumulated dividends due on the shares of Series A Preferred Stock, such dividends continued to be deferred, but were considered unpaid, accrued, or accumulated dividends (as the case may be) due on the Series B Preferred Stock.
| • | Optional conversion—Each share of Series A Preferred Stock was convertible, at the option of the holder thereof, into a Conversion Unit at any time after the date of issuance of such share. |
| • | Automatic conversion—Each share of Series A Preferred Stock automatically could have been converted into Conversion Units on the date specified by written consent or agreement of the holders of a majority of the then outstanding shares of Series A Preferred Stock. |
| • | Conversion price—The initial Conversion Price of the shares issued in May 2006 was $5.67 per share. In order to prevent dilution of the conversion rights granted to the holders of the Series A Preferred Stock, the Conversion Price was subject to adjustment from time to time under certain circumstances. If the Company (i) declared a dividend on the Common Stock payable in shares of its capital stock (including Common Stock), (ii) subdivided the outstanding Common Stock, (iii) combined the outstanding Common Stock into a smaller number of shares, or (iv) issued any shares of its capital stock in a reclassification of the Common Stock, then, in each such case, the Conversion Price was to be proportionately adjusted so that, in connection with a conversion of the shares of Series A Preferred Stock after such date, the holder of shares of Series A Preferred Stock would have been entitled to receive the aggregate number and kind of shares of capital stock, which, if the conversion had occurred immediately prior to such date, the holder would have owned upon such conversion and been entitled to receive by virtue of such dividend, subdivision, combination, or reclassification. |
| (b) | Redemption of Series A Preferred Stock |
On March 19, 2012, the Company recapitalized. As part of the recapitalization, 3,897,000 shares of Series A Convertible Preferred Stock were converted into conversion units, which consisted of one share of Series B Preferred Stock and one share of Common Stock. The Series B Preferred shares plus accrued dividends were redeemed for cash of $44 million, and 3,897,000 shares of Common Stock were issued to the holders of the redeemed Series A Convertible Preferred Stock.
In June 2012, the remaining 1,399,000 shares of Series A Convertible Preferred Stock were converted into conversion units of one share of Series B Preferred Stock and one share of Common Stock. The shares Series B Preferred Stock plus accrued dividends were redeemed for cash of $16.3 million and 1,399,000 shares of Common Stock were issued to the holders of the redeemed Series A Convertible Preferred Stock.
| (c) | Issuance of Shares of Common Stock as Compensation |
As part of the March 19, 2012 recapitalization, the Company issued to its financial advisor as compensation in connection with the debt portion of the recapitalization 215,000 shares of Common Stock valued at approximately $2.8 million based upon a price of $13 per share. This amount represents debt issuance costs and is being amortized to expense over the 5 to 6 year life of the loans described in Note 5.
F-17
Table of Contents
| (d) | Initial Public Offering |
In August 2012, the Company completed its initial public offering (IPO) in which we issued and sold 1,924,000 shares of Common Stock at a public offering price of $9.00 per share. The Company received net proceeds of $12.6 million after deducting underwriter discounts and commissions of $1.0 million and other offering expenses of approximately $3.6 million. In addition, a financial advisor to the Company was paid $0.9 million through the issuance of 103,500 shares of Common Stock valued at $9.00 per share.
| 8. | Stock-based Compensation |
| (a) | Stock Options |
The Company has established the 2004 DCS Holdings Stock Option Plan, the DCS Holdings, Inc. 2004 Equity Incentive Plan (Performant Financial Corporation is the new name of DCS Holdings, Inc.), the Performant Financial Corporation 2007 Stock Option Plan, and the Performant Financial Corporation 2012 Stock Incentive Plan (the Plans). Under the terms of the 2004 DCS Holdings Stock Option Plan, stock options may be granted for up to 4,000,000 shares of the Company’s authorized but unissued Common Stock. The 2004 DCS Holdings Stock Option Plan was terminated on the completion of the Company’s initial public offering in August 2012. No shares of our common stock are available under our 2004 Stock Option Plan other than for satisfying exercises of stock options granted under this plan prior to termination.
Under the terms of the DCS Holdings, Inc. 2004 Equity Incentive Plan, incentive and nonqualified stock options, stock bonuses, and rights to acquire restricted stock may be granted for up to 3,600,000 shares of the Company’s authorized but unissued Common Stock. Options granted under the DCS Holdings, Inc. 2004 Equity Incentive Plan generally vest over a four-year period. The Company’s DCS Holdings, Inc. 2004 Equity Incentive Plan was terminated on the completion of its initial public offering in August 2012. No shares of our common stock are available under our 2004 Equity Incentive Plan other than for satisfying exercises of stock options granted under this plan prior to termination.
Under the terms of the Performant Financial Corporation 2007 Stock Option Plan, incentive and nonqualified stock options may be granted for up to 4,000,000 shares of the Company’s authorized but unissued Common Stock. Options granted under the Performant Financial Corporation 2007 Stock Option Plan generally vest over a five-year period. Performant Financial Corporation 2007 Stock Option Plan was terminated on the completion of its initial public offering in August 2012. No shares of our common stock are available under our 2007 Stock Option Plan other than for satisfying exercises of stock options granted under this plan prior to termination.
The terms of the Performant Financial Corporation 2012 Stock Incentive Plan provides for the granting of incentive stock options within the meaning of Section 422 of the Code to employees and the granting of nonstatutory stock options, restricted stock, stock appreciation rights, stock unit awards and cash-based awards to employees, non-employee directors and consultants. The Company has reserved 4,300,000 shares of common stock under the 2012 Plan. Options granted under the Performant Financial Corporation 2012 Stock Incentive Plan generally vest over a five-year period.
The exercise price of incentive stock options shall generally not be less than 100% of the fair market value of the Common Stock subject to the option on the date that the option is granted. The exercise price of nonqualified stock options shall generally not be less than 85% of the fair market value of the Common Stock subject to the option on the date that the option is granted. Options issued under the Plans have a maximum term of 10 years and vest over schedules determined by the board of directors. Options issued under the Plans generally provide for immediate vesting of unvested shares in the event of a sale of the Company.
Total stock-based compensation expense charged as salaries and benefits expense in the consolidated statements of operations was $1.6 million, $0.1 million and $0.6 million for the years ended December 31, 2012, 2011, and 2010, respectively.
F-18
Table of Contents
The following table sets forth a summary of our stock option activity for the year ended December 31:
| Outstanding Options |
Weighted average exercise price per share |
Weighted average remaining contractual life (Years) |
Aggregate Instrinsic Value (in thousands) |
|||||||||||||
| Outstanding at December 31, 2009 |
5,443,500 | $ | 0.61 | 6.90 | ||||||||||||
| Granted |
202,000 | 1.50 | ||||||||||||||
| Forfeited |
(134,750 | ) | 0.56 | |||||||||||||
| Exercised |
— | — | ||||||||||||||
|
|
|
|
|
|||||||||||||
| Outstanding at December 31, 2010 |
5,510,750 | 0.64 | 6.00 | |||||||||||||
| Granted |
180,000 | 5.50 | ||||||||||||||
| Forfeited |
(25,282 | ) | 0.74 | |||||||||||||
| Exercised |
(718 | ) | 0.50 | |||||||||||||
|
|
|
|
|
|||||||||||||
| Outstanding at December 31, 2011 |
5,664,750 | 0.80 | 5.20 | |||||||||||||
| Granted |
2,549,109 | 10.32 | ||||||||||||||
| Forfeited |
(19,077 | ) | 7.99 | |||||||||||||
| Exercised |
(285,058 | ) | 0.61 | |||||||||||||
|
|
|
|
|
|||||||||||||
| Outstanding at December 31, 2012 |
7,909,724 | $ | 3.85 | 5.89 | $ | 49,410 | ||||||||||
|
|
|
|
|
|
|
|||||||||||
| Vested or expected to vest(1) at December 31, 2012 |
7,514,238 | $ | 3.66 | 5.64 | $ | 48,387 | ||||||||||
|
|
|
|
|
|
|
|||||||||||
| Exercisable at December 31, 2012 |
4,854,960 | $ | 0.64 | 3.86 | $ | 45,927 | ||||||||||
|
|
|
|
|
|
|
|||||||||||
| (1) | Options expected to vest reflect an estimated forfeiture rate. |
The weighted-average grant-date exercise price of stock options granted during the years ended December 31, 2012, 2011 and 2010 was $10.32, $5.50 and $1.50, respectively, per share. The aggregate intrinsic value of our stock options (the amount by which the market price of the stock on the date of exercise exceeded the exercise price of the option) exercised during the years ended December 31, 2012, 2011 and 2010, was $2.9 million, $0 million and $0 million, respectively. At December 31, 2012, 2011, and 2010, there was $12.0 million, $0.6 million and $0.4 million, respectively, of unrecognized stock-based compensation expense related to non-vested stock-based compensation arrangements, which the Company expects to recognize over a weighted-average period of 4.21 years as stock-based compensation expense.
Net cash proceeds from the exercise of stock options were $0.2 million, $0 million and $0 million during 2012, 2011 and 2010, respectively. For the years ended December 31, 2012, 2011 and 2010, we realized a $0.6 million, $0 million and $0 million tax benefit from the exercise of stock options, respectively.
The fair value of each option grant was estimated using the Black-Scholes option pricing model. Expected volatilities are calculated based on the historical volatility data of comparable peer companies over a term comparable to the expected term of the options issued. The expected term of the award is determined based on the average of the vesting term and the contractual term. Management monitors share option exercise and employee termination patterns to estimate forfeiture rates within the valuation model. Separate groups of employees that have similar groups of employees with similar historical exercise behavior are considered separately for valuation purposes.
F-19
Table of Contents
We estimated the fair value of options granted using a Black-Scholes option pricing model with the following assumptions:
| For the Year Ended December 31, | ||||||||||||
| 2012 | 2011 | 2010 | ||||||||||
| Expected volatility |
48.3% | 39.8% | 40.6% | |||||||||
| Expected dividends |
0.0 | 0.0 | 0.0 | |||||||||
| Expected term (years) |
6.5 | 6.3 | 6.3 | |||||||||
| Risk-free interest rate |
1.01% | 1.2% | 2.8% | |||||||||
| Weighted-average estimated fair value of options granted during the year |
$ | 5.22 | $ | 2.23 | $ | 0.66 | ||||||
Valuation and Amortization Method – The Company estimates the fair value of stock options granted using the Black-Scholes-Merton option pricing model. The fair value is then amortized on a straight line basis over the requisite service periods of the awards, which is generally the vesting period. Stock options typically have a ten year life from the grant date and vesting periods of four to five years. The fair value of the Company’s common stock is based on the market price of the stock on the date of grant.
Expected Term – The Company’s expected term represents the period that the Company’s stock-based awards are expected to be outstanding. For awards granted subject only to service vesting requirements, the Company utilizes the simplified method under the provisions of FASB ASC 718-10-S99-1 (Staff Accounting Bulletin No. 107) for estimating the expected term of the stock-based award.
Expected Volatility – Because there is insufficient history of the Company’s stock price returns, the Company lacks sufficient historical volatility data for its equity awards. Accordingly, the Company calculates the expected volatility using comparable peer companies over a term comparable to the expected term of the options issued.
Expected Dividend – The Company has never paid dividends on its common shares and currently does not intend to do so. Accordingly, the dividend yield percentage is zero for all periods.
Risk-Free Interest Rate – The risk-free interest rate used in the Black Scholes valuation method is based on the U.S. Treasury constant maturity interest rate whose term is consistent with the expected life of our stock options.
| (b) | Restricted Stock |
Option Agreements issued under the 2004 DCS Holdings Stock Option Plan allow for the participants to exercise options whether or not vesting has occurred, provided that the participants enter into a restricted stock agreement. The restricted stock agreement is to specify that the stock issued for unvested options will continue vesting, with the unvested shares subject to repurchase at the lower of original cost and fair market value.
In January 2005, two executives exercised a portion of their options, including unvested options, by entering into restricted stock agreements with the Company. The restricted stock agreements allow for the executives to receive dividend payments, subject to forfeiture if the executives leave the Company prior to the vesting of the restricted shares. On February 4, 2005, forfeitable dividends of $1 million were paid on the executives’ unvested restricted shares. This amount has been recorded as “due from stockholders” in the equity caption of the consolidated balance sheet, and is being amortized into compensation expense as the underlying unvested restricted shares vest. Compensation expense associated with the forfeitable dividends received on unvested restricted shares was $0 million, $0 million and $0.1 million in 2012, 2011 and 2010, respectively.
F-20
Table of Contents
| 9. | Employee Benefit Plan |
The Company has a 401(k) Salary Deferral Plan (the Plan) covering all full-time employees who have met certain service requirements. Employees may contribute a portion of their salary up to the maximum limit established by the Internal Revenue Code for such plans. Employer contributions are discretionary. No matching contributions were made during 2012, 2011 and 2010.
| 10. | Income Taxes |
The Company’s income tax expense (benefit) consists of the following (in thousands):
| 2012 | 2011 | 2010 | ||||||||||
| Current: |
||||||||||||
| Federal |
$ | 15,142 | $ | 14,053 | $ | 5,500 | ||||||
| State |
3,470 | 3,103 | 1,132 | |||||||||
|
|
|
|
|
|
|
|||||||
| 18,612 | 17,156 | 6,632 | ||||||||||
|
|
|
|
|
|
|
|||||||
| Deferred: |
||||||||||||
| Federal |
$ | (1,599 | ) | $ | (7,350 | ) | $ | (172 | ) | |||
| State |
(227 | ) | (2,290 | ) | 204 | |||||||
|
|
|
|
|
|
|
|||||||
| (1,826 | ) | (9,640 | ) | 32 | ||||||||
|
|
|
|
|
|
|
|||||||
| Total Expense (Benefit) |
$ | 16,786 | $ | 7,516 | $ | 6,664 | ||||||
|
|
|
|
|
|
|
|||||||
A reconciliation of the income tax expense calculated using the applicable federal statutory rates to the actual income tax expense for the years ended December 31, 2012, 2011 and 2010 is as follows:
| 2012 | 2011 | 2010 | ||||||||||
| Federal income at the statutory rate |
35% | 35% | 35% | |||||||||
| State income tax, net of federal benefit |
5% | 3% | 5% | |||||||||
| Permanent differences |
2% | 1% | 2% | |||||||||
| Other |
0% | -1% | -2% | |||||||||
|
|
|
|
|
|
|
|||||||
| 42% | 38% | 40% | ||||||||||
|
|
|
|
|
|
|
|||||||
F-21
Table of Contents
The following table summarizes the components of the Company’s deferred tax assets and liabilities as of December 31, 2012, and 2011 (in thousands):
| 2012 | 2011 | |||||||
| Deferred tax assets: |
||||||||
| Bad debt reserve |
$ | 26 | $ | 30 | ||||
| Vacation accrual |
909 | 315 | ||||||
| Remeasurement expense nonqualified stock options |
1,767 | 1,137 | ||||||
| Amortization of deferred finance costs |
3,082 | 1,822 | ||||||
| Acquisition costs |
197 | 229 | ||||||
| Bonus accrual |
— | 483 | ||||||
| State tax deferral |
1,373 | 1,041 | ||||||
| Stock option compensation |
— | 690 | ||||||
| Deferred revenue |
91 | 1,284 | ||||||
| State tax credits |
566 | 386 | ||||||
| Estimated liability for appeals |
1,260 | 366 | ||||||
| Other |
82 | 559 | ||||||
|
|
|
|
|
|||||
| 9,353 | 8,342 | |||||||
| Valuation allowance |
(351 | ) | (148 | ) | ||||
|
|
|
|
|
|||||
| 9,002 | 8,194 | |||||||
|
|
|
|
|
|||||
| Deferred tax liabilities: |
||||||||
| Identifiable intangible assets |
(13,007 | ) | (14,307 | ) | ||||
| Book versus tax depreciation |
(3,446 | ) | (3,029 | ) | ||||
| Amortization of deferred finance costs |
— | (135 | ) | |||||
| Other |
(22 | ) | (22 | ) | ||||
|
|
|
|
|
|||||
| (16,475 | ) | (17,493 | ) | |||||
|
|
|
|
|
|||||
| Net deferred tax liabilities |
$ | (7,473 | ) | $ | (9,299 | ) | ||
|
|
|
|
|
|||||
The Company believes that it is more likely than not that the results of future operations will generate sufficient taxable income to realize the deferred tax assets, except for certain state tax credits. Income tax expense is allocated to the subsidiaries included in the consolidated tax return on the basis of the subsidiaries’ stand-alone tax provision.
The Company has a valuation allowance of approximately $0.4 million as of December 31, 2012 related to California enterprise zone tax credits for which it is not more likely than not that the tax benefit will be realized. The total amount of the valuation allowance represented includes increases from the amount recorded as of December 31, 2011 due to the generation of additional tax credits in 2012, for which it is not more likely than not that the tax benefit will be realized.
The Company has state tax credits of $0.6 million which can be carried forward indefinitely. The Company has state net operating loss carryforwards of $0.4 million which expire in 2020. The following table reconciles the Company’s unrecognized tax benefits as of December 31, 2012 from its unrecognized tax benefits as of December 31, 2011 (in thousands):
| Unrecognized tax benefits balance at December 31, 2011 |
$ | — | ||
| Increase related to prior year tax positions |
115 | |||
| Decrease related to prior year tax positions |
— | |||
| Increase related to current year tax positions |
164 | |||
| Settlements |
— | |||
| Lapse of statute of limitations |
— | |||
|
|
|
|||
| Unrecognized tax benefits balance at December 31, 2012 |
$ | 279 | ||
|
|
|
F-22
Table of Contents
At December 31, 2012 and 2011, we had approximately $0.3 million and $0 million of unrecognized tax benefits, respectively. We do not expect any significant change in unrecognized tax benefits during the next twelve months. The Company records interest expense and penalties related to unrecognized tax benefits in selling, general, and administrative expenses. The amount of accrued interest was not material at December 31, 2012 and 2011, respectively. No penalties were recognized in 2012 or accrued at December 31, 2012 and 2011, respectively. Unrecognized tax benefits of approximately $0.3 million which, if recognized, would favorably affect the Company’s effective income tax rate.
The Company files federal and state income tax returns. For years before 2008, the Company is no longer subject to federal or state tax examinations.
| 11. | Related Party Transactions |
Our notes payable, both before and after the recapitalization of March 19, 2012, are held by a number of lenders, some of whom also invested in our stock. As a result, these entities are considered related parties. Interest expense under these arrangements totaled $11.1 million, $12.3 million and $13.2 million for the years ended December 31, 2012, 2011 and 2010, respectively, and the debt extinguishment expense associated with the recapitalization totaled $3.3 million for the year ended December 31, 2012.
In an agreement dated April 13, 2012, the Company and an affiliate of Parthenon Capital Partners terminated an existing advisory services agreement, which called for quarterly payments of $0.1 million. As part of the April 13, 2012 termination agreement, the Company agreed to pay Parthenon Capital Partners $1.3 million in equal quarterly installments of $0.1 million beginning in April 2012, provided that the remaining balance will become due and payable immediately upon the closing of an IPO or the sale of the Company. The Company paid two quarterly installments of $0.1 million and paid the remaining balance of $1.1 million on August 15, 2012, the date the IPO closed. In addition, the agreement specifies that the affiliate will be due a fee equal to 1% of the aggregate gross proceeds of an IPO offering or 1% of the aggregate consideration paid in connection with the sale of the Company, as applicable. The Company expensed and paid $0.9 million to Parthenon Capital Partners in August 2012 upon successful closing of the IPO.
| 12. | Other Commitments and Contingencies |
| (a) | Trust Funds |
The Company collects principal and interest payments and collection costs on defaulted loans for various contracting agencies. Cash collections for some of the Company’s customers are held in trust in bank accounts controlled by the Company. The Company remits trust funds to the contracting agencies on a regular basis. The amount of cash held in trust and the related liability are separated from and not included in the Company’s assets and liabilities. Cash held in trust for customers totaled $1.4 million and $1.8 million at December 31, 2012 and 2011, respectively.
| (b) | Litigation |
The Company, during the ordinary course of its operations, has been named in various legal suits and claims, several of which are still pending. In the opinion of management and the Company’s legal counsel, such legal actions will not have a material effect on the Company’s financial position or results of operations or cash flows.
| 13. | Subsequent Events |
In January 2013, the Company completed a secondary offering in which selling stockholders sold 9,200,000 shares of common stock at a public offering price of $10.65 per share. The Company did not receive any proceeds from the sale of the shares by the selling stockholders. The Company paid the related offering expenses.
F-23
Table of Contents
SCHEDULE II – VALUATION AND QUALIFYING ACCOUNTS
For the years ended December 31, 2012, 2011 and 2010
Allowance for doubtful accounts (in thousands):
| Description |
Balance at Beginning of Period |
Additions Charged against Revenue |
Recoveries | Charge-offs | Balance at End of Period |
|||||||||||||||
| 2012 |
$ | 77 | — | 2 | (14 | ) | $ | 65 | ||||||||||||
| 2011 |
$ | 45 | 28 | 14 | (10 | ) | $ | 77 | ||||||||||||
| 2010 |
$ | 221 | 37 | — | (213 | ) | $ | 45 | ||||||||||||
Estimated allowance and liability for appeals – RAC Contract (in thousands):
| Description |
Balance at Beginning of |
Additions Charged against Revenue |
Appeals found in Providers Favor |
Balance at End of Period |
||||||||||||
| 2012 |
$ | 934 | 8,589 | (3,946 | ) | $ | 5,577 | * | ||||||||
| 2011 |
$ | 101 | 1,743 | (910 | ) | 934 | * | |||||||||
| 2010 |
$ | — | 101 | — | 101 | * | ||||||||||
| * | Includes $1,199, $484 and $101 related to the estimated allowance for appeals that apply to uncollected accounts receivable as of 2012, 2011 and 2010, respectively. |
F-24
Table of Contents
Table of Contents
Part II
INFORMATION NOT REQUIRED IN PROSPECTUS
| Item 13. | Other Expenses of Issuance and Distribution |
The following table sets forth the various expenses expected to be incurred by the Registrant in connection with the sale and distribution of the securities being registered hereby. All amounts are estimated except the SEC registration fee and the Financial Industry Regulatory Authority filing fee.
| SEC registration fee |
$ | 10,460 | ||
| Financial Industry Regulatory Authority filing fee |
* | |||
| Blue Sky fees and expenses |
* | |||
| Accounting fees and expenses |
* | |||
| Legal fees and expenses |
* | |||
| Printing and engraving expenses |
* | |||
| Registrar and Transfer Agent’s fees |
* | |||
| Miscellaneous fees and expenses |
* | |||
|
|
|
|||
| Total |
* | |||
|
|
|
|||
| * | To be filed by amendment |
| Item 14. | Indemnification of Directors and Officers |
Section 102 of the DGCL allows a corporation to eliminate the personal liability of directors of a corporation to the corporation or its stockholders for monetary damages for breach of fiduciary duty as a director, except where the director breached the duty of loyalty, failed to act in good faith, engaged in intentional misconduct or knowingly violated a law, authorized the payment of a dividend or approved a stock repurchase in violation of the DGCL or obtained an improper personal benefit.
Section 145 of the DGCL provides, among other things, that we may indemnify any person who was or is a party or is threatened to be made a party to any threatened, pending or completed action, suit or proceeding—other than an action by or in the right of the Registrant—by reason of the fact that the person is or was a director, officer, agent or employee of the Registrant, or is or was serving at our request as a director, officer, agent or employee of another corporation, partnership, joint venture, trust or other enterprise against expenses, including attorneys’ fees, judgments, fines and amounts paid in settlement actually and reasonably incurred by the person in connection with such action, suit or proceeding. The power to indemnify applies (a) if such person is successful on the merits or otherwise in defense of any action, suit or proceeding, or (b) if such person acting in good faith and in a manner he or she reasonably believed to be in the best interest, or not opposed to the best interest, of the Registrant, and with respect to any criminal action or proceeding had no reasonable cause to believe his or her conduct was unlawful. The power to indemnify applies to actions brought by or in the right of the Registrant as well but only to the extent of defense expenses, including attorneys’ fees but excluding amounts paid in settlement, actually and reasonably incurred and not to any satisfaction of judgment or settlement of the claim itself, and with the further limitation that in such actions no indemnification shall be made in the event of any adjudication of liability to the Registrant, unless the court believes that in light of all the circumstances indemnification should apply.
Section 174 of the DGCL provides, among other things, that a director, who willfully or negligently approves of an unlawful payment of dividends or an unlawful stock purchase or redemption, may be held liable for such actions. A director who was either absent when the unlawful actions were approved or dissented at the
II-1
Table of Contents
time, may avoid liability by causing his or her dissent to such actions to be entered in the books containing minutes of the meetings of the board of directors at the time such action occurred or immediately after such absent director receives notice of the unlawful acts.
The Registrant’s amended and restated bylaws, attached as Exhibit 3.2(b) hereto, provide that the Registrant shall indemnify its directors and executive officers to the fullest extent not prohibited by the DGCL or any other applicable law. In addition, the Registrant has entered into separate indemnification agreements, attached as Exhibit 10.1 hereto, with its directors and officers which would require the Registrant, among other things, to indemnify them against certain liabilities which may arise by reason of their status or service as directors or officers to the fullest extent not prohibited by law. These indemnification provisions and the indemnification agreements may be sufficiently broad to permit indemnification of the Registrant’s officers and directors for liabilities, including reimbursement of expenses incurred, arising under the Securities Act. The Registrant also intends to maintain director and officer liability insurance, if available on reasonable terms.
The form of Underwriting Agreement, to be attached as Exhibit 1.1 hereto, provides for indemnification by the Underwriters of us and our officers and directors for certain liabilities, including liabilities arising under the Securities Act, and affords certain rights of contribution with respect thereto.
| Item 15. | Recent Sales of Unregistered Securities |
Since May 1, 2009, the Registrant has sold the following unregistered securities:
(1) In August 2009, the Registrant granted options under the 2007 Stock Option Plan to purchase 800,000 common shares to officers and employees at a price of $1.175 per share for an aggregate purchase price of $940,000.
(2) In February 2010, the Registrant granted options under the 2007 Stock Option Plan to purchase 10,000 common shares to employees at a price of $1.50 per share for an aggregate purchase price of $15,000.
(3) In October 2011, the Registrant granted options under the 2007 Stock Option Plan to purchase 50,000 common shares to directors at a price of $5.25 per share for an aggregate purchase price of $262,500.
(4) In November and December 2011, the Registrant granted options under the 2007 Stock Option Plan to purchase 130,000 common shares to employees and directors at a price of $5.60 per share for an aggregate purchase price of $728,000.
(5) In March 2012, the Registrant granted options under the 2007 Stock Option Plan to purchase 100,000 common shares to employees at a price of $5.65 per share for an aggregate purchase price of $565,000.
(6) In March 2012, the Registrant issued an aggregate of 215,044 shares of common stock with a deemed value of $1,215,000 to FTP Securities LLC as consideration for financial services rendered.
(7) In August 2012, the Registrant issued an aggregate of 103,500 shares of common stock with a deemed value of $931,500 to FTP Securities LLC as consideration for financial services rendered.
No underwriters were involved in the foregoing sales of securities. The issuances of the securities described above were deemed to be exempt from registration under the Securities Act in reliance on Rule 701 promulgated under Section 3(b) of the Securities Act or on Section 4(2) of the Securities Act. The recipients of securities in each such transaction represented their intention to acquire the securities for investment only and not with a view to or for sale in connection with any distribution thereof and appropriate legends were affixed to the stock certificates and option agreements issued in such transactions.
II-2
Table of Contents
| Item 16. | Exhibits and Financial Statement Schedules |
| (a) | Exhibits |
The following exhibits are included herein or incorporated herein by reference:
| Exhibit |
Description | |
| 1.1 | Form of Underwriting Agreement | |
| 3.1 | Restated Certificate of Incorporation of Registrant (incorporated by reference to Exhibit 3.1(b) to the Company’s Registration Statement on Form S-1/A filed July 23, 2012) | |
| 3.2 | Amended and Restated Bylaws of Registrant (incorporated by reference to Exhibit 3.2(b) to the Company’s Registration Statement on Form S-1/A filed July 23, 2012) | |
| 4.2 | Amended and Restated Registration Rights Agreement, dated as of August 15, 2012, among the Registrant and the persons listed thereon (incorporated by reference to Exhibit 4.2 to the Company’s Registration Statement on Form S-1/A filed July 23, 2012) | |
| 5.1* | Opinion of Pillsbury Winthrop Shaw Pittman LLP | |
| 10.1 | Form of Indemnification Agreement between the Registrant and its officers and directors (incorporated by reference to Exhibit 10.1 to the Company’s Registration Statement on Form S-1/A filed July 30, 2012) | |
| 10.2 | 2004 Equity Incentive Plan and form of agreements thereunder (incorporated by reference to Exhibit 10.2 to the Company’s Registration Statement on Form S-1 filed July 3, 2012) | |
| 10.3 | 2004 DCS Holdings Stock Option Plan and form of agreements thereunder (incorporated by reference to Exhibit 10.3 to the Company’s Registration Statement on Form S-1 filed July 3, 2012) | |
| 10.4 | 2007 Stock Option Plan and form of agreements thereunder (incorporated by reference to Exhibit 10.4 to the Company’s Registration Statement on Form S-1 filed July 3, 2012) | |
| 10.5 | Recovery Audit Contractor contract by and between Diversified Collection Services, Inc. and Center for Medicare and Medicaid Services dated as of October 3, 2008, as amended (incorporated by reference to Exhibit 10.5 to the Company’s Registration Statement on Form S-1/A filed July 23, 2012) | |
| 10.6 | Credit Agreement, dated as of March 19, 2012, by and among DCS Business Services, Inc., the Lenders party Hereto, Madison Capital Funding LLC, and ING Capital (incorporated by reference to Exhibit 10.6 to the Company’s Registration Statement on Form S-1/A filed July 23, 2012) | |
| 10.7 | Form of Change of Control Agreement, as amended (incorporated by reference to Exhibit 10.7 to the Company’s Registration Statement on Form S-1/A filed July 30, 2012) | |
| 10.8 | Employment Agreement between the Registrant and Lisa Im, dated as of April 15, 2012, as amended (incorporated by reference to Exhibit 10.8 to the Company’s Registration Statement on Form S-1/A filed July 23, 2012) | |
| 10.9 | Employment Agreement between the Registrant and Jon D. Shaver dated as of March 31, 2003, as amended (incorporated by reference to Exhibit 10.9 to the Company’s Registration Statement on Form S-1/A filed July 23, 2012) | |
| 10.10 | Repurchase Agreement between the Registrant and Lisa C. Im dated as of July 3, 2012 (incorporated by reference to Exhibit 10.10 to the Company’s Registration Statement on Form S-1 filed July 3, 2012) | |
| 10.11 | Repurchase Agreement between the Registrant and Jon D. Shaver dated as of July 3, 2012 (incorporated by reference to Exhibit 10.11 to the Company’s Registration Statement on Form S-1 filed July 3, 2012) | |
| 10.12 | Director Nomination Agreement between the Registrant and Parthenon DCS Holdings, LLC dated as of July 20, 2012 (incorporated by reference to Exhibit 10.12 to the Company’s Registration Statement on Form S-1/A filed July 23, 2012) | |
II-3
Table of Contents
| Exhibit |
Description | |
| 10.13 | Advisory Services Agreement between Diversified Collection Services, Inc. and Parthenon Capital, LLC dated as of January 8, 2004, as amended (incorporated by reference to Exhibit 10.13 to the Company’s Registration Statement on Form S-1/A filed July 23, 2012) | |
| 10.14 | Termination of the Advisory Services Agreement between Diversified Collection Services, Inc. and Parthenon Capital, LLC dated as of January 8, 2004, as amended, dated as of April 13, 2012 (incorporated by reference to Exhibit 10.14 to the Company’s Registration Statement on Form S-1/A filed July 23, 2012) | |
| 10.15 | 2012 Stock Incentive Plan (incorporated by reference to Exhibit 10.15 to the Company’s Registration Statement on Form S-1/A filed July 23, 2012) | |
| 21.1 | List of Subsidiaries (incorporated by reference to Exhibit 21 to the Company’s Annual Report on Form 10-K for the year ended December 31, 2012) | |
| 23.1 | Consent of KPMG LLP, Independent Registered Public Accounting Firm | |
| 23.2 | Consent of Pillsbury Winthrop Shaw Pittman LLP (included in Exhibit 5.1) | |
| 24.1 | Power of Attorney (see page II-6 to this Registration Statement on Form S-1) | |
| 101.INS* | XBRL Instance Document | |
| 101.SCH* | XBRL Taxonomy Extension Scheme | |
| 101.CAL* | XBRL Taxonomy Extension Calculation Linkbase | |
| 101.DEF* | XBRL Taxonomy Extension Definition Linkbase Document | |
| 101.LAB* | XBRL Taxonomy Extension Label Linkbase | |
| 101.PRE* | XBRL Taxonomy Extension Presentation Linkbase | |
| * | To be filed by amendment. |
| (b) | Financial Statement Schedules. |
Financial statement schedule II is included on page F-24. All other schedules are omitted because they are not required, or not applicable or the information is included in the consolidated financial statements or notes thereto.
| Item 17. | Undertakings |
Insofar as indemnification for liabilities arising under the Securities Act may be permitted to directors, officers and controlling persons of the registrant pursuant to the foregoing provisions, or otherwise, the registrant has been advised that in the opinion of the Securities and Exchange Commission such indemnification is against public policy as expressed in the Act and is, therefore, unenforceable. In the event that a claim for indemnification against such liabilities (other than the payment by the registrant of expenses incurred or paid by a director, officer or controlling person of the registrant in the successful defense of any action, suit or proceeding) is asserted by such director, officer or controlling person in connection with the securities being registered, the registrant will, unless in the opinion of its counsel the matter has been settled by controlling precedent, submit to a court of appropriate jurisdiction the question whether such indemnification by it is against public policy as expressed in the Act and will be governed by the final adjudication of such issue.
The undersigned registrant hereby undertakes that:
| (1) | For purposes of determining any liability under the Securities Act, the information omitted from the form of prospectus filed as part of this registration statement in reliance upon Rule 430A and |
II-4
Table of Contents
| contained in a form of prospectus filed by the registrant pursuant to Rule 424(b)(1) or (4) or 497(h) under the Securities Act shall be deemed to be part of this registration statement as of the time it was declared effective. |
| (2) | For the purpose of determining any liability under the Securities Act, each post-effective amendment that contains a form of prospectus shall be deemed to be a new registration statement relating to the securities offered therein, and the offering of such securities at that time shall be deemed to be the initial bona fide offering thereof. |
II-5
Table of Contents
SIGNATURES
Pursuant to the requirements of the Securities Act of 1933, the Registrant has duly caused this Registration Statement to be signed on its behalf by the undersigned, thereunto duly authorized in the City of Livermore, State of California, on the 10th day of April, 2013.
| PERFORMANT FINANCIAL CORPORATION | ||
| By |
/s/ Lisa C. Im | |
| Lisa C. Im Chief Executive Officer | ||
POWER OF ATTORNEY
KNOW ALL MEN BY THESE PRESENTS, that each person whose signature appears below constitutes and appoints Lisa C. Im and Hakan L. Orvell and each of them, his or her true and lawful attorneys in fact and agents, each with full power of substitution and resubstitution, for him or her and in his or her name, place and stead, in any and all capacities, to sign any and all amendments, including post-effective amendments, to this Registration Statement, and any registration statement relating to the offering covered by this Registration Statement and filed pursuant to Rule 462(b) under the Securities Act of 1933, and to file the same, with exhibits thereto and other documents in connection therewith, with the SEC, granting unto said attorneys-in-fact and agents, and each of them, full power and authority to do and perform each and every act and thing requisite and necessary to be done, as fully to all intents and purposes as he or she might or could do in person, hereby ratifying and confirming all that each of said attorneys in fact and agents or their substitute or substitutes may lawfully do or cause to be done by virtue hereof.
Pursuant to the requirements of the Securities Act of 1933, this Registration Statement has been signed below by the following persons in the capacities and on the dates indicated.
| Name |
Title |
Date | ||
| /s/ Lisa C. Im Lisa C. Im |
Chief Executive Officer (Principal Executive Officer) and Director | April 10, 2013 | ||
| /s/ Hakan L. Orvell Hakan L. Orvell |
Chief Financial Officer (Principal Financial Officer and Principal Accounting Officer) | April 10, 2013 | ||
| /s/ Dr. John D. Shaver Dr. Jon D. Shaver |
Chairman of the Board and Director | April 10, 2013 | ||
| /s/ Todd R. Ford Todd R. Ford |
Director | April 10, 2013 | ||
| /s/ Brian P. Golson Brian P. Golson |
Director | April 10, 2013 | ||
| /s/ William D. Hansen William D. Hansen |
Director | April 10, 2013 | ||
| /s/ William C. Kessinger William C. Kessinger |
Director | April 10, 2013 | ||
| /s/ Jeffrey S. Stein Jeffrey S. Stein |
Director | April 10, 2013 | ||
II-6
Table of Contents
EXHIBIT INDEX
| Exhibit |
Description | |
| 1.1 | Form of Underwriting Agreement | |
| 3.1 | Restated Certificate of Incorporation of Registrant (incorporated by reference to Exhibit 3.1(b) to the Company’s Registration Statement on Form S-1/A filed July 23, 2012) | |
| 3.2 | Amended and Restated Bylaws of Registrant (incorporated by reference to Exhibit 3.2(b) to the Company’s Registration Statement on Form S-1/A filed July 23, 2012) | |
| 4.2 | Amended and Restated Registration Rights Agreement, dated as of August 15, 2012, among the Registrant and the persons listed thereon (incorporated by reference to Exhibit 4.2 to the Company’s Registration Statement on Form S-1/A filed July 23, 2012) | |
| 5.1* | Opinion of Pillsbury Winthrop Shaw Pittman LLP | |
| 10.1 | Form of Indemnification Agreement between the Registrant and its officers and directors (incorporated by reference to Exhibit 10.1 to the Company’s Registration Statement on Form S-1/A filed July 30, 2012) | |
| 10.2 | 2004 Equity Incentive Plan and form of agreements thereunder (incorporated by reference to Exhibit 10.2 to the Company’s Registration Statement on Form S-1 filed July 3, 2012) | |
| 10.3 | 2004 DCS Holdings Stock Option Plan and form of agreements thereunder (incorporated by reference to Exhibit 10.3 to the Company’s Registration Statement on Form S-1 filed July 3, 2012) | |
| 10.4 | 2007 Stock Option Plan and form of agreements thereunder (incorporated by reference to Exhibit 10.4 to the Company’s Registration Statement on Form S-1 filed July 3, 2012) | |
| 10.5 | Recovery Audit Contractor contract by and between Diversified Collection Services, Inc. and Center for Medicare and Medicaid Services dated as of October 3, 2008, as amended (incorporated by reference to Exhibit 10.5 to the Company’s Registration Statement on Form S-1/A filed July 23, 2012) | |
| 10.6 | Credit Agreement, dated as of March 19, 2012, by and among DCS Business Services, Inc., the Lenders party Hereto, Madison Capital Funding LLC, and ING Capital (incorporated by reference to Exhibit 10.6 to the Company’s Registration Statement on Form S-1/A filed July 23, 2012) | |
| 10.7 | Form of Change of Control Agreement, as amended (incorporated by reference to Exhibit 10.7 to the Company’s Registration Statement on Form S-1/A filed July 30, 2012) | |
| 10.8 | Employment Agreement between the Registrant and Lisa Im, dated as of April 15, 2012, as amended (incorporated by reference to Exhibit 10.8 to the Company’s Registration Statement on Form S-1/A filed July 23, 2012) | |
| 10.9 | Employment Agreement between the Registrant and Jon D. Shaver dated as of March 31, 2003, as amended (incorporated by reference to Exhibit 10.9 to the Company’s Registration Statement on Form S-1/A filed July 23, 2012) | |
| 10.10 | Repurchase Agreement between the Registrant and Lisa C. Im dated as of July 3, 2012 (incorporated by reference to Exhibit 10.10 to the Company’s Registration Statement on Form S-1 filed July 3, 2012) | |
| 10.11 | Repurchase Agreement between the Registrant and Jon D. Shaver dated as of July 3, 2012 (incorporated by reference to Exhibit 10.11 to the Company’s Registration Statement on Form S-1 filed July 3, 2012) | |
| 10.12 | Director Nomination Agreement between the Registrant and Parthenon DCS Holdings, LLC dated as of July 20, 2012 (incorporated by reference to Exhibit 10.12 to the Company’s Registration Statement on Form S-1/A filed July 23, 2012) | |
Table of Contents
| Exhibit |
Description | |
| 10.13 | Advisory Services Agreement between Diversified Collection Services, Inc. and Parthenon Capital, LLC dated as of January 8, 2004, as amended (incorporated by reference to Exhibit 10.13 to the Company’s Registration Statement on Form S-1/A filed July 23, 2012) | |
| 10.14 | Termination of the Advisory Services Agreement between Diversified Collection Services, Inc. and Parthenon Capital, LLC dated as of January 8, 2004, as amended, dated as of April 13, 2012 (incorporated by reference to Exhibit 10.14 to the Company’s Registration Statement on Form S-1/A filed July 23, 2012) | |
| 10.15 | 2012 Stock Incentive Plan (incorporated by reference to Exhibit 10.15 to the Company’s Registration Statement on Form S-1/A filed July 23, 2012) | |
| 21.1 | List of Subsidiaries (incorporated by reference to Exhibit 21 to the Company’s Annual Report on Form 10-K for the year ended December 31, 2012) | |
| 23.1 | Consent of KPMG LLP, Independent Registered Public Accounting Firm | |
| 23.2 | Consent of Pillsbury Winthrop Shaw Pittman LLP (included in Exhibit 5.1) | |
| 24.1 | Power of Attorney (see page II-6 to this Registration Statement on Form S-1) | |
| 101.INS* | XBRL Instance Document | |
| 101.SCH* | XBRL Taxonomy Extension Scheme | |
| 101.CAL* | XBRL Taxonomy Extension Calculation Linkbase | |
| 101.DEF* | XBRL Taxonomy Extension Definition Linkbase Document | |
| 101.LAB* | XBRL Taxonomy Extension Label Linkbase | |
| 101.PRE* | XBRL Taxonomy Extension Presentation Linkbase | |
| * | To be filed by amendment. |