Attached files
| file | filename |
|---|---|
| 8-K - FORM 8-K - EXELON GENERATION CO LLC | d517754d8k.htm |
 Wolfe Trahan Power & Gas Deep Dive Conference
Houston, TX
Joe Nigro, SVP Portfolio Strategy
Ed Quinn, SVP Wholesale Trading & Origination
April 11, 2013
Exhibit 99.1 |
 Cautionary Statements Regarding Forward Looking Information
Wolfe Trahan Power & Gas Deep Dive Conference
1
This presentation contains certain forward-looking statements within the
meaning of the Private Securities Litigation Reform Act of 1995, that
are subject to risks and uncertainties. The factors that could cause
actual results to differ materially from the forward-looking
statements made by Exelon Corporation, Commonwealth Edison Company, PECO
Energy Company, Baltimore Gas and Electric Company and Exelon Generation
Company, LLC (Registrants) include those factors discussed herein, as
well as the items discussed in (1) Exelon’s 2012 Annual Report on
Form 10-K in (a) ITEM 1A. Risk Factors, (b) ITEM 7.
Management’s Discussion and Analysis of Financial Condition and
Results of Operations and (c) ITEM 8. Financial Statements and
Supplementary Data: Note 19; and (2) other factors discussed in filings with the
SEC by the Registrants. Readers are cautioned not to place undue reliance on
these forward-looking statements, which apply only as of the date of
this presentation. None of the Registrants undertakes any obligation to
publicly release any revision to its forward-looking statements to
reflect events or circumstances after the date of this presentation.
|
 Conventional
Generation
Fuels
Retail
Renewable
Generation
Electric &
Gas Utilities
Beyond The
Meter
Presence across the entire energy value chain
Unique Combination of Scale, Scope and Flexibility to Invest
Across The Value Chain with Metrics Oriented Operational Model
Wolfe Trahan Power & Gas Deep Dive Conference
2
Exelon Generation Components
•
Leading competitive energy provider in the U.S.
•
Constellation’s retail business serves more than
100,000 business and public sector customers
and approximately 1 million residential
customers
o
Wide range of products and services,
including load response, energy efficiency
and distributed solar
•
Top-notch portfolio and risk management
capabilities
•
35,000 megawatts
(1)
of diverse generation
across 22 states and Canada
•
One of the largest and best-managed nuclear
fleets in the world (approximately 19,000
megawatts)
(1)
•
Ten consecutive years with nuclear capacity
factor over 92%
•
One of the nation’s cleanest fleets as measured
by CO2, SO2 and NOx intensity
Constellation
Power Generation
(1)
Includes ~2,000 megawatts from Exelon Generation’s investment in CENG, a
joint venture with EDF. |
 Wolfe Trahan Power & Gas Deep Dive Conference
3
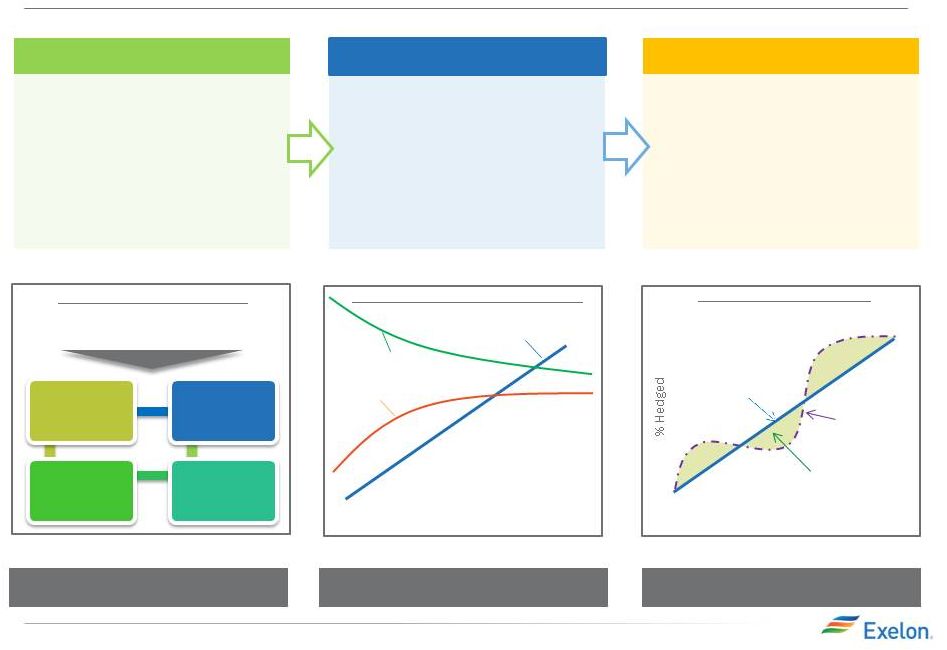
Portfolio Management Strategy
Protect Balance Sheet
Ensure Earnings Stability
Create Value
Exercising Market Views
Purely ratable
Actual hedge %
Market views on timing, product
allocation and regional spreads
reflected in actual hedge %
High End of Profit
Low End of Profit
% Hedged
Open Generation
with LT Contracts
Portfolio Management &
Optimization
Portfolio Management Over Time
Align Hedging & Financials
Establishing Minimum Hedge Targets
Strategic Policy Alignment
•Aligns hedging program with
financial policies and financial
outlook
•Establish minimum hedge targets
to meet financial objectives of the
company (dividend, credit rating)
•Hedge enough commodity risk to
meet future cash requirements
under a stress scenario
Three-Year Ratable Hedging
•
Ensure stability in near-term cash
flows and earnings
•
Disciplined approach to hedging
•
Tenor aligns with customer
preferences and market liquidity
•
Multiple channels to market that
allow us to maximize margins
•
Large open position in outer years
to benefit from price upside
Bull / Bear Program
•Ability to exercise fundamental
market views to create value within
the ratable framework
•Modified timing of hedges versus
purely ratable
•Cross-commodity hedging (heat
rate positions, options, etc.)
•Delivery locations, regional and
zonal spread relationships
Credit Rating
Capital &
Operating
Expenditure
Dividend
Capital
Structure |
 Creating Value in a Low Commodity Price Environment
Wolfe Trahan Power & Gas Deep Dive Conference
4
•
The
competitive
advantage
of
our
platform
is
the
scale
and
scope
of the
business across the energy value chain
•
Exelon is well positioned for any power market recovery
Market Forces
Customer
Focused
•
Deregulation of non-competitive states
•
Hyper competitive retail market
Constellation’s platform provides opportunities to create value in this
low commodity price environment
RGGI = Regional Greenhouse Gas Initiative
Constellation Actions
•
New product and service bundles
•
Cross-selling products
•
Disciplined pricing
•
Regulatory advocacy
•
Flexible hedging strategy
•
Selection of products (i.e. sell gas
instead of power)
•
Regulatory advocacy
•
Portfolio optimization (short, medium
and
long
term)
–
physical presence
provides increased optimization
opportunities
•
Effective channel management
•
EPA Regulation
•
Natural gas price
•
Power demand
•
Power market design (ERCOT and PJM)
•
PTC (Production Tax Credit)
•
Subsidized generation
•
RGGI Proposed Changes
•
Technological Innovation
Generation
Focused |
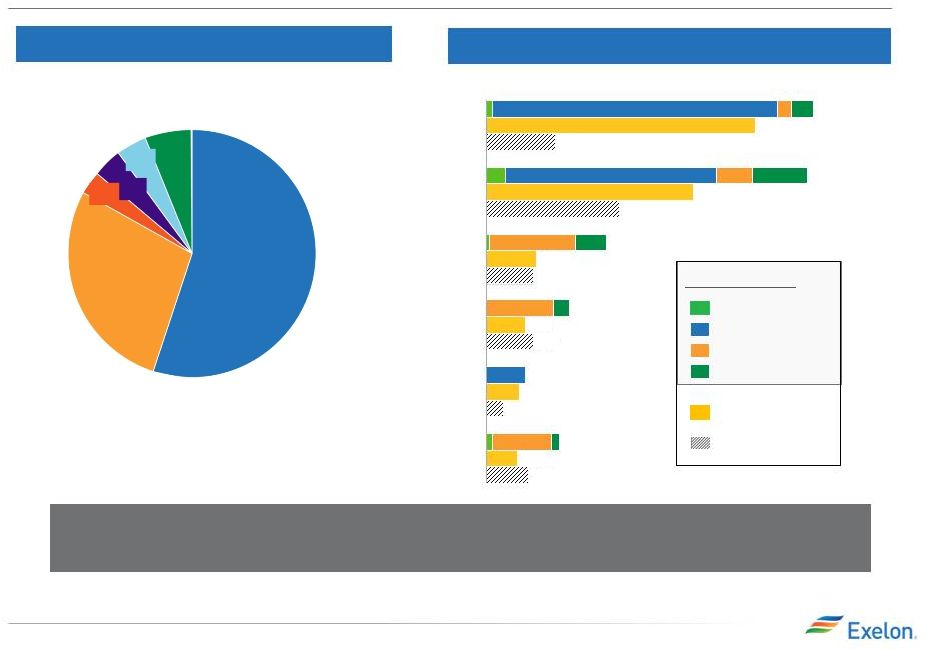 (1) Owned and contracted generation capacity converted from MW to MWh
assuming 100% capacity factor for all technology types, except for renewable capacity which is shown at estimated capacity factor.
Generation Fleet Overview
Wolfe Trahan Power & Gas Deep Dive Conference
5
Owned Generation (Technology Type)
Generation
and
Load
Match
(2013
TWh)
(1,2)
Multiple paths to market available to hedge the ~35,000 MW fleet
that has
both technological and regional diversification
New York
New England
ERCOT
MidAtlantic
116
MidWest
118
Renewables
Baseload
Intermediate
Peaking
Expected Load
Expected Generation
Generation capacity
43
30
26
14
15
6
12
17
14
17
18
48
75
25
97
11
South/West/
Canada
(2) Expected generation and load shown in the chart above will not tie
out with load volume and ExGen disclosures. Load shown above does not include indexed products and generation reflects a net owned
and contracted position. Estimates as of 9/30/2012.
Hydro
6%
Wind/Solar/Other
4%
Coal
4%
Oil
3%
Gas
28%
Nuclear
55% |
 Market Update
Wolfe Trahan Power & Gas Deep Dive Conference
6
2015 Henry Hub
$4.30
$4.23
3/31/2013
12/31/2012
2015 PJM-W ATC
$41.43
$39.17
2015 NiHub ATC
$33.72
$31.87
2015
Gross
Margin
Sensitivities
(1)
($M)
Henry Hub
+ $1/Mmbtu
$590
-
$1/Mmbtu
($520)
NiHub ATC
+ $5/MWh
$410
-
$5/MWh
($410)
PJM-W ATC
+ $5/MWh
$260
-
$5/MWh
($250)
2015 Price Change
ATC = Around the Clock.
(1)
Sensitivity data as of
12/31/12. (2) Uses midpoint of hedge percentage provided in 4Q12 earnings release (data as of 12/31/12).
9.8
9.6
9.4
7.8
7.6
0.0
3/31/13
3/1/13
2/1/13
1/1/13
9.6
7.8
9.3
7.5
PJM W
NiHub
26.5%
62.5%
93.5%
34.5%
67.5%
98.5%
2015
2014
2013
Mid-Atlantic
Midwest
2015 ATC Heat Rate – 1Q13
%
of Expected Generation Hedged
(2) |
 Other Constellation Businesses
7
•
Provides strong returns ( >12% IRR)
•
$140M (~50% utilized) Reserve Based Lending
(RBL) facility in place
•
Receives off-balance sheet treatment from
S&P
•
Provides valuable market intelligence in complex
natural gas markets
•
266 Bcfe of net proved reserves as of 12/31/12
Presence and experience across the value chain allows Constellation to offer
customers multiple products to manage their energy risk
•
Retail Gas:
•
All States are competitive
•
~430 Bcf projected to be served in 2013
•
Month to month customers, with high retention
rates
•
Wholesale Gas:
•
Expand presence to complement power assets
•
Portfolio Size: 5 Bcf wholesale storage,
200,000 MMBtus per day of term transport
and over 1.5 Bcf/day of plant supply
•
2013 market size of 5.5 GW estimated to grow 1-2
GW per year for the next 5 years
•
Focus on states with established markets in place
and where there is potential for new incentives
•
Pursue opportunities in non-Solar REC markets
where there is increased interest in solar
•
~155 MW in operation or under construction
(excludes Antelope Valley Solar Ranch facility)
•
Load Response:
•
~2 GW of load response under contract
•
Roughly 100 GW total market
•
Energy Efficiency:
•
Over 4,000 projects implemented to date
•
Focus on government, education,
healthcare and multi-family housing
sectors
Upstream E&P Assets
Retail and Wholesale Gas
Solar
Energy Efficiency and Load Response
E&P = Exploration and Production. REC = Renewable Energy
Credit. Wolfe Trahan Power & Gas Deep Dive Conference
|
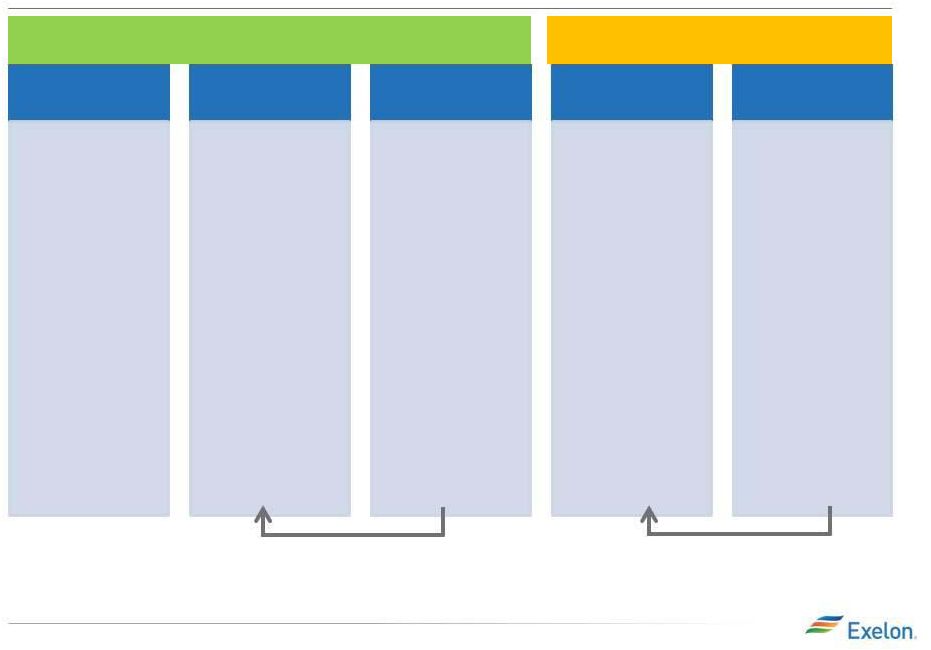 8
Components of Gross Margin Categories
Margins move from new business to MtM of hedges over
the course of the year as sales are executed
Margins move from “Non power new business”
to
“Non power executed”
over the course of the year
Gross margin linked to power production and sales
Gross margin from
other business activities
Open Gross
Margin
MtM of
Hedges
(2)
“Power”
New
Business
“Non Power”
Executed
“Non Power”
New Business
•
Generation Gross
Margin at current
market prices,
including capacity
and ancillary
revenues, nuclear
fuel amortization
and fossils fuels
expense
•
Exploration and
Production
•
Power Purchase
Agreement (PPA)
Costs and
Revenues
•
Provided at a
consolidated level
for all regions
(includes hedged
gross margin for
South, West and
Canada
(1)
)
•
Mark to Market
(MtM) of power,
capacity and
ancillary hedges,
including cross
commodity, retail
and wholesale load
transactions
•
Provided directly at
a consolidated
level for five major
regions. Provided
indirectly for each
of the five major
regions via
Effective Realized
Energy Price
(EREP), reference
price, hedge %,
expected
generation
•
Retail, Wholesale
planned electric
sales
•
Portfolio
Management new
business
•
Mid marketing new
business
•
Retail, Wholesale
executed gas sales
•
Load Response
•
Energy Efficiency
•
BGE Home
•
Distributed Solar
•
Retail, Wholesale
planned gas sales
•
Load Response
•
Energy Efficiency
•
BGE Home
•
Distributed Solar
•
Portfolio
Management /
origination fuels
new business
•
Proprietary
trading
(3)
Wolfe Trahan Power & Gas Deep Dive Conference
(1) Hedged gross margins for South, West and Canada region will be included
with Open Gross Margin, and no expected generation, hedge %, EREP or reference prices provided for this region.
(2) MtM of hedges provided directly for the five larger regions. MtM of hedges
is not provided directly at the regional level but can be easily estimated using EREP, reference price and hedged MWh.
(3) Proprietary trading gross margins will remain within “Non Power”
New Business category and not move to “Non Power” Executed category.
|