Attached files
| file | filename |
|---|---|
| 8-K - FORM 8-K - CONSUMERS ENERGY CO | d518798d8k.htm |
Exhibit 99.1
CMS ENERGY
Midwest Utilities Seminar
April 10, 2013
Cross Winds® Energy Park
Gas Combined Cycle Plant
Consumers Smart Energy Program
CMS ENERGY
This presentation is made as of the date hereof and contains “forward-looking statements” as defined in Rule 3b-6 of the
Securities Exchange Act of 1934, as amended, Rule 175 of the Securities Act of 1933, as amended, and relevant legal decisions. The forward-looking statements are subject to risks and uncertainties. They should be read in conjunction with “FORWARD-LOOKING STATEMENTS AND INFORMATION” and “RISK FACTORS” sections of CMS Energy’s and Consumers Energy’s Form 10-K for the year ended December 31 and as updated in subsequent 10-Qs. CMS Energy’s and Consumers Energy’s “FORWARD-LOOKING STATEMENTS AND INFORMATION” and “RISK FACTORS” sections are incorporated herein by reference and discuss important factors that could cause CMS Energy’s and Consumers Energy’s results to differ materially from those anticipated in such statements. CMS Energy and Consumers Energy undertake no obligation to update any of the information presented herein to reflect facts, events or circumstances after the date hereof.
The presentation also includes non-GAAP measures when describing CMS Energy’s results of operations and financial performance. A reconciliation of each of these measures to the most directly comparable GAAP measure is included in the appendix and posted on our website at www.cmsenergy.com.
CMS Energy provides financial results on both a reported (Generally Accepted Accounting Principles) and adjusted (non-GAAP) basis. Management views adjusted earnings as a key measure of the company’s present operating financial performance, unaffected by discontinued operations, asset sales, impairments, regulatory items from prior years, or other items. Certain of these items have the potential to impact, favorably or unfavorably, the company’s reported earnings in 2013. The company is not able to estimate the impact of these matters and is not providing reported earnings guidance.
1
CMS ENERGY
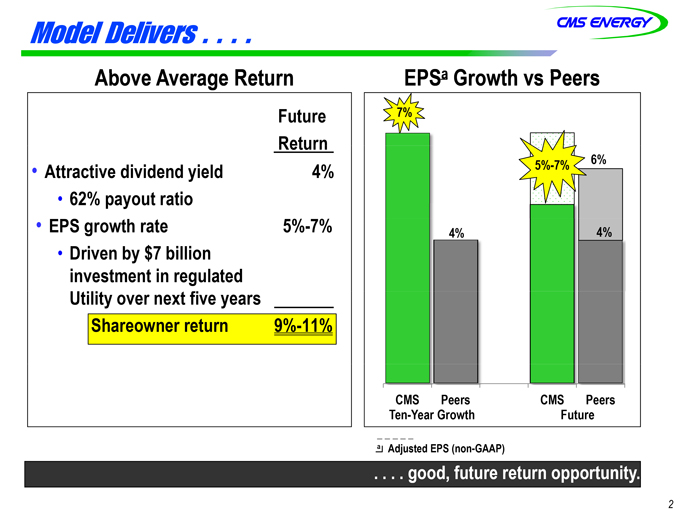
Model Delivers. . . .
Above Average Return
Future
Return
Attractive dividend yield 4%
62% payout ratio
EPS growth rate
5%-7%
Driven by $7 billion investment in regulated Utility over next five years
Shareowner return 9%-11%
EPSa Growth vs Peers
7% 5%-7% 6%
5% 4% 4%
CMS
Peers
CMS
Peers
Ten-Year Growth
Future
a Adjusted EPS (non-GAAP)
. . . . good, future return opportunity.
2
CMS ENERGY
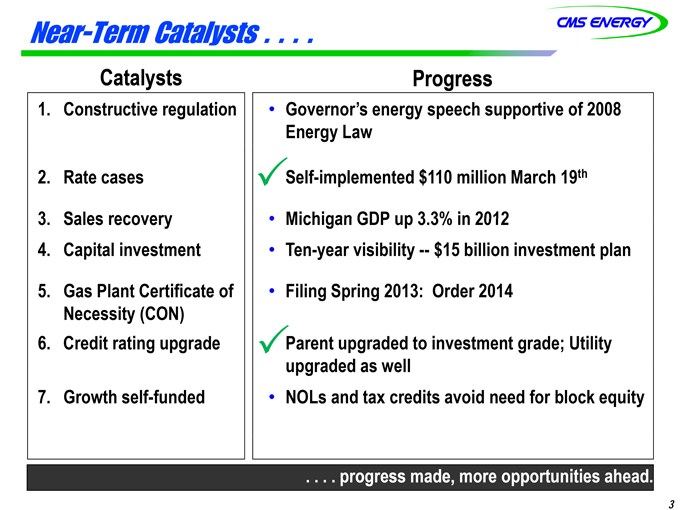
Near-Term Catalysts….
Catalysts
1. Constructive regulation
2. Rate cases
3. Sales recovery
4. Capital investment
5. Gas Plant Certificate of Necessity (CON)
6. Credit rating upgrade
7. Growth self-funded
Progress
• Governor’s energy speech supportive of 2008 Energy Law
Self-implemented $110 million March 19th
• Michigan GDP up 3.3% in 2012
• Ten-year visibility — $15 billion investment plan
• Filing Spring 2013: Order 2014
Parent upgraded to investment grade; Utility upgraded as well
• NOLs and tax credits avoid need for block equity
. . . . progress made, more opportunities ahead.
3
CMS ENERGY
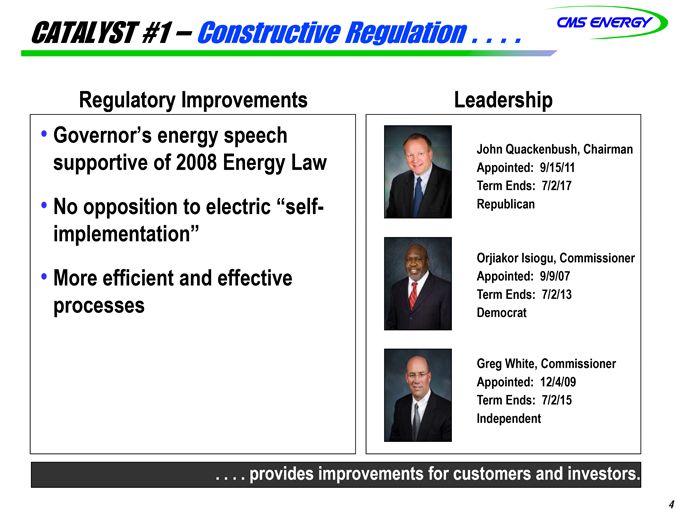
CATALYST #1 – Constructive Regulation . . . .
Regulatory Improvements
• Governor’s energy speech supportive of 2008 Energy Law
• No opposition to electric “self-implementation”
• More efficient and effective processes
Leadership
John Quackenbush, Chairman
Appointed: 9/15/11
Term Ends: 7/2/17
Republican
Orjiakor Isiogu, Commissioner
Appointed: 9/9/07
Term Ends: 7/2/13
Democrat
Greg White, Commissioner
Appointed: 12/4/09
Term Ends: 7/2/15
Independent
. . . . provides improvements for customers and investors.
4
CMS ENERGY
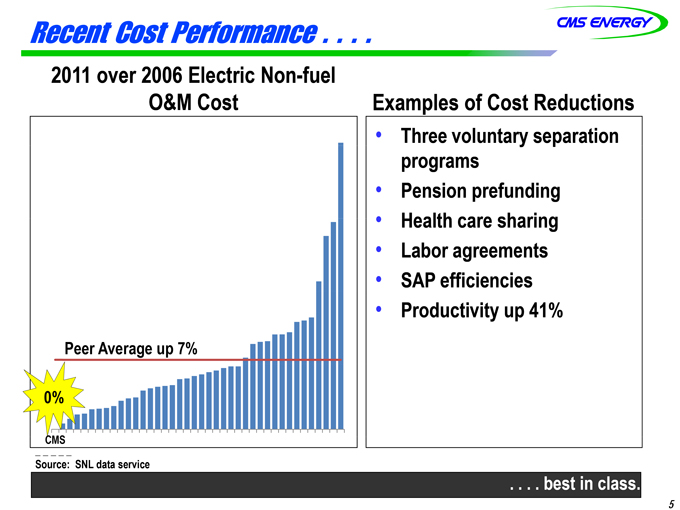
Recent Cost Performance . . . .
2011 over 2006 Electric Non-fuel O&M Cost
Peer Average up 7%
0%
CMS
Examples of Cost Reductions
• Three voluntary separation programs
• Pension prefunding
• Health care sharing
• Labor agreements
• SAP efficiencies
• Productivity up 41%
Source: SNL data service
. . . . best in class.
5
CMS ENERGY
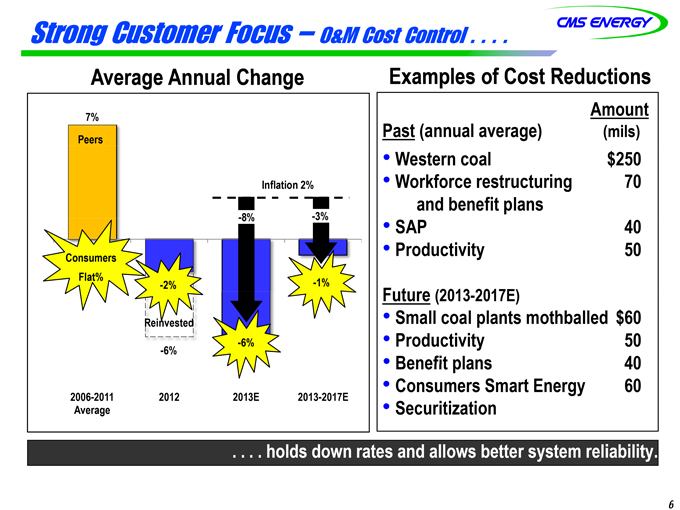
Strong Customer Focus – O&M Cost Control . . . .
Average Annual Change
7%
Peers
Inflation 2%
-8%
-3%
Consumers
Flat%
-2%
-1%
Reinvested
-6%
-6%
2006-2011
2012
2013E
2013-2017E
Average
Examples of Cost Reductions
Amount
Past (annual average)
(mils)
Western coal
$250
Workforce restructuring and benefit plans
70
SAP
40
Productivity
50
Future (2013-2017E)
Small coal plants mothballed $60
Productivity
50
Benefit plans
40
Consumers Smart Energy
60
Securitization
. . . . holds down rates and allows better system reliability.
6
CMS ENERGY
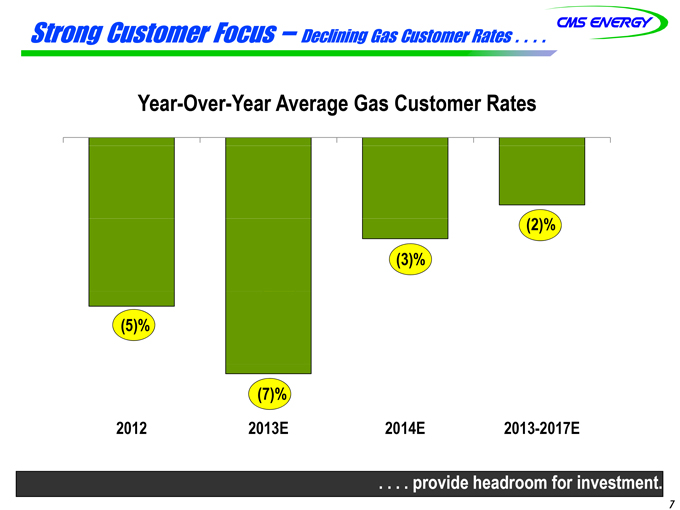
Strong Customer Focus — Declining Gas Customer Rates . . . .
Year-Over-Year Average Gas Customer Rates
(2)%
(3)%
(5)%
(7)%
2012
2013E
2014E
2013-2017E
. . . . provide headroom for investment.
7
CMS ENERGY
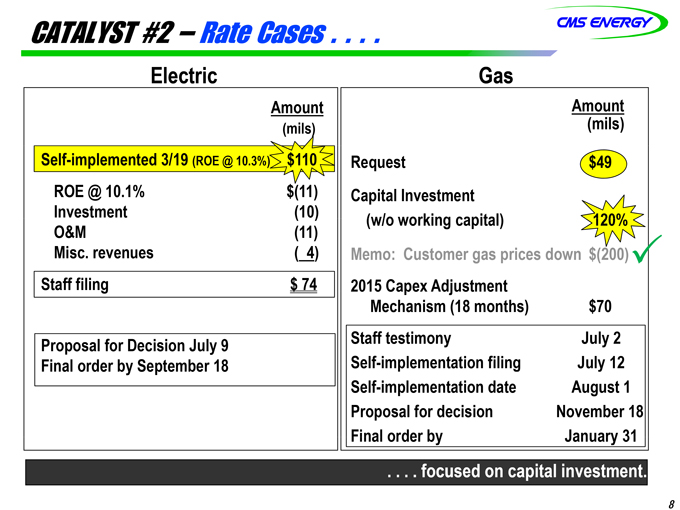
CATALYST #2 – Rate Cases . . . .
Electric
Amount
(mils)
Self-implemented 3/19 (ROE @ 10.3%)
$110
ROE @ 10.1%
$(11)
Investment
(10)
O&M
(11)
Misc. revenues
( 4)
Staff filing
$ 74
Proposal for Decision July 9
Final order by September 18
Gas
Amount
(mils)
Request $49
Capital Investment (w/o working capital) 120%
Memo: Customer gas prices down $(200)
2015 Capex Adjustment Mechanism (18 months) $70
Staff testimony July 2
Self-implementation filing July 12
Self-implementation date August 1
Proposal for decision November 18
Final order by January 31
. . . . focused on capital investment.
8
CMS ENERGY
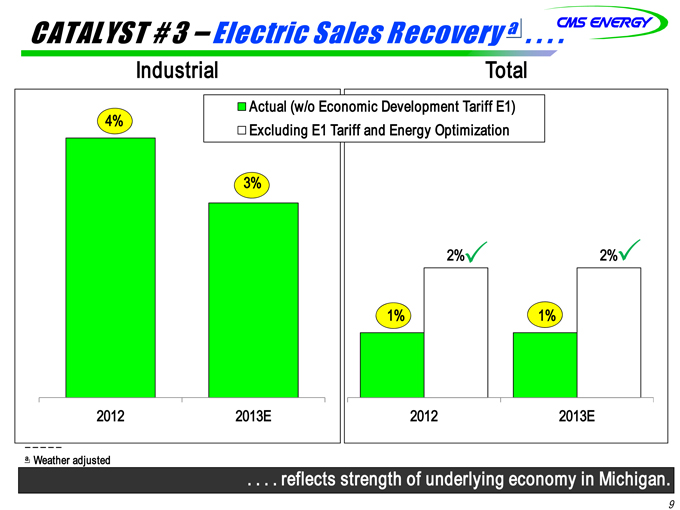
CATALYST #3 – Electric Sales Recovery a . . . .
Industrial
Total
Actual (w/o Economic Development Tariff E1)
4%
Excluding E1 Tariff and Energy Optimization
3%
2%
2%
1%
1%
2012
2013E
2012
2013E
_ _ _ _ _
a Weather adjusted
. . . . reflects strength of underlying economy in Michigan.
9
CMS ENERGY
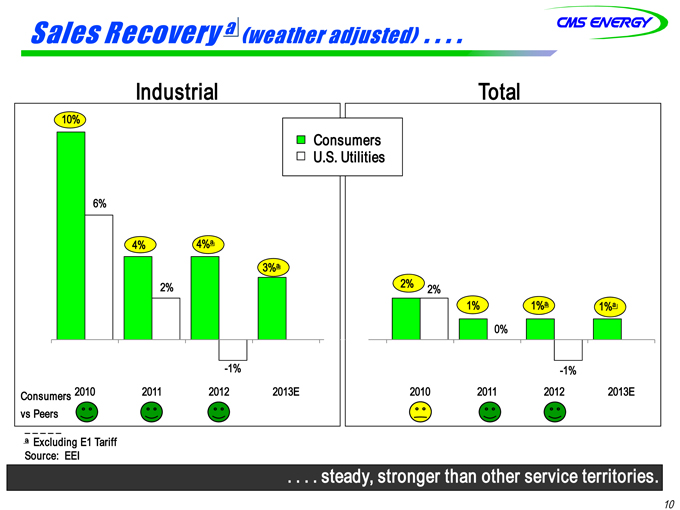
Sales Recovery a
(weather adjusted) . . . .
Industrial
Total
10%
Consumers
U.S. Utilities
6%
4%
4%a
3%a
2%
2%
2%
1%
1%a
1%a
0%
-1%
-1%
Consumers 2010
2011
2012
2013E
2010
2011
2012
2013E
vs Peers
_ _ _ _ _
a Excluding E1 Tariff Source: EEI
. . . . steady, stronger than other service territories.
10
CMS ENERGY
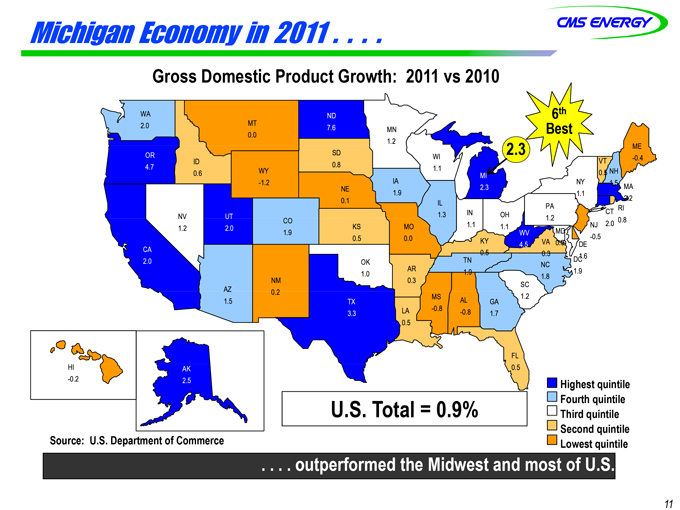
Michigan Economy in 2011 . . . .
Gross Domestic Product Growth: 2011 vs 2010
WA
MT ND
2.0 7.6
MN
6th Best
0.0
1.2
SD 2.3 ME
WI -0.4
ID VT
0.8
WY 1.1 NH
0.6 MI 0.5
-1.2 IA NY 1.5
NE 2.3 MA
1.9 1.1
0.1 2.2
IL PA
RI
1.3 IN OH CT
NV UT 1.2 0.8
CO 2.0
KS MO 1.1 1.1 NJ
1.2 2.0 MD
1.9 WV
0.5 0.0 -0.5
KY VA 0.9 DE
4.5
0.5
0.3 1.6
OK TN DC
NC
AR 1.9 1.9
1.0 1.8
NM 0.3
SC
AZ 0.2 MS 1.2
1.5 TX AL GA
LA -0.8 -0.8
3.3 1.7
0.5
FL
HI AK 0.5
OR 4.7 CA 2.0
-0.2 2.5 Highest quintile
U.S. Total = 0.9% Fourth quintile
Third quintile
Second quintile
Source: U.S. Department of Commerce Lowest quintile
. . . . outperformed the Midwest and most of U.S.
11
CMS ENERGY
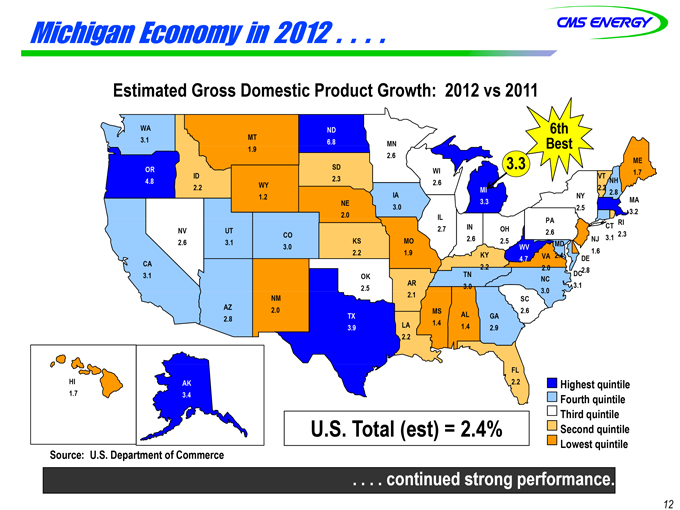
Michigan Economy in 2012 . . . .
Estimated Gross Domestic Product Growth: 2012 vs 2011
WA ND 6th 3.1 MT
1.9 6.8 MN Best 2.6
SD 3.3 ME OR WI 1.7 ID 2.3 VT
4.8 2.6 NH 2.2 WY 2.2 MI 2.8 1.2 IA NY
NE 3.0 3.3 MA 2.5 2.0 3.2 IL PA
RI 2.7 IN OH CT
NV UT 2.6 2.3 CO 3.1 KS MO 2.6 2.5 NJ
2.6 3.1 MD 3.0 WV
2.2 1.9 1.6 KY VA 2.4 DE
4.7 CA 2.2
2.0 2.8 3.1 OK TN DC
NC
AR 3.0 3.1 2.5 2.1 3.0
NM SC AZ 2.0 2.6 MS AL
2.8 TX 1.4 GA 3.9 LA 1.4 2.9 2.2
FL
HI AK 2.2 Highest quintile
1.7 3.4
Fourth quintile Third quintile
U.S. Total (est) = 2.4% Second quintile
Source: U.S. Department of Commerce Lowest quintile
. . . . continued strong performance.
12
CMS ENERGY
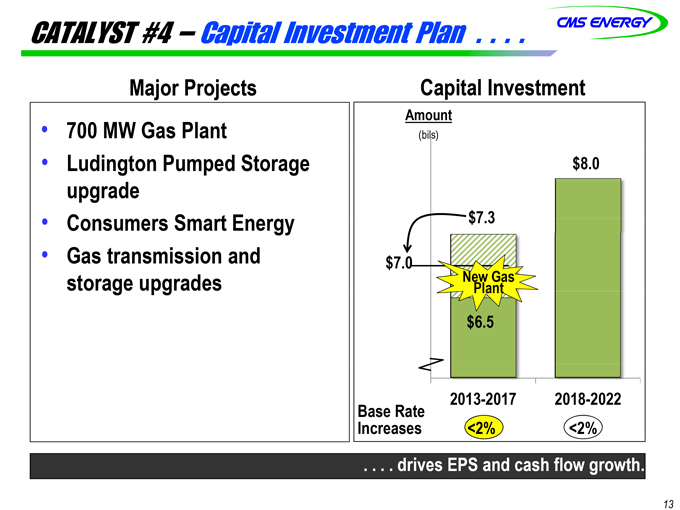
CATALYST #4 – Capital Investment Plan . . . .
Major Projects
• 700 MW Gas Plant
• Ludington Pumped Storage upgrade
• Consumers Smart Energy
• Gas transmission and storage upgrades
Capital Investment
Amount
(bils)
$8.0
$7.3
$7.0
New Gas
Plant
$6.5
2013-2017
2018-2022
Base Rate
Increases
<2%
<2%
. . . . drives EPS and cash flow growth.
13
CMS ENERGY
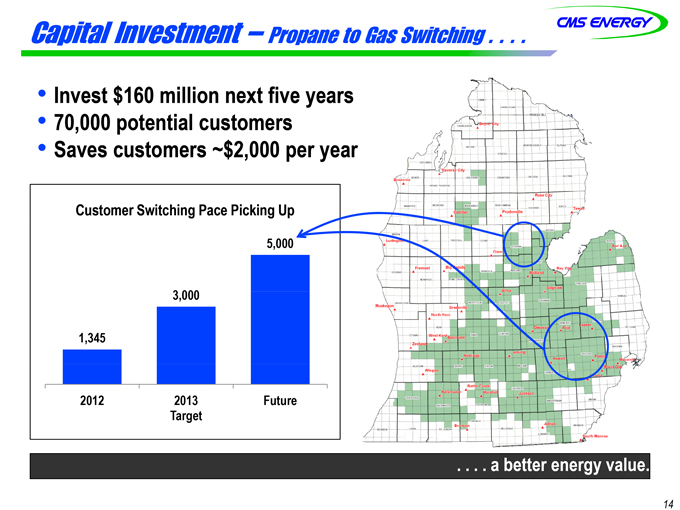
Capital Investment – Propane to Gas Switching . . . .
• Invest $160 million next five years
• 70,000 potential customers
• Saves customers ~$2,000 per year
Customer Switching Pace Picking Up
5,000 3,000 1,345
2012 2013 Future Target
. . . . a better energy value.
14
CMS ENERGY
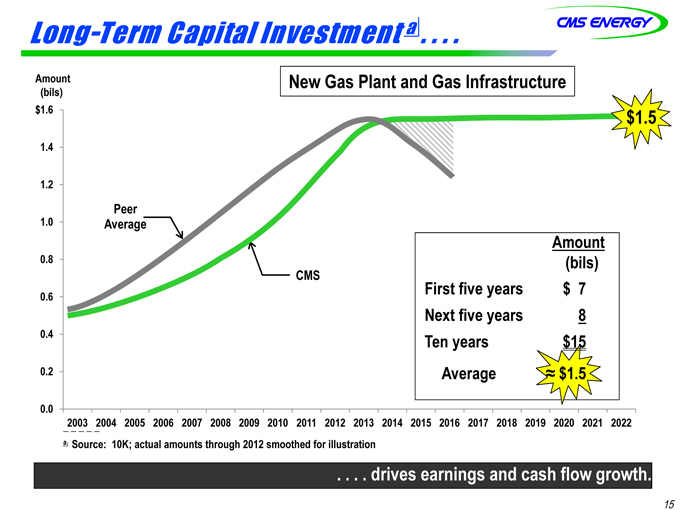
Long-Term Capital Investment a . . . .
Amount New Gas Plant and Gas Infrastructure
(bils) $1.6 $1.5 1.4
1.2
Peer 1.0 Average
Amount 0.8 (bils)
CMS
First five years $ 7
0.6
Next five years 8 0.4 Ten years $15 0.2 Average ≈$1.5
0.0
2003 2004 2005 2006 2007 2008 2009 2010 2011 2012 2013 2014 2015 2016 2017 2018 2019 2020 2021 2022
a Source: 10K; actual amounts through 2012 smoothed for illustration
. . . . drives earnings and cash flow growth.
15
CMS ENERGY
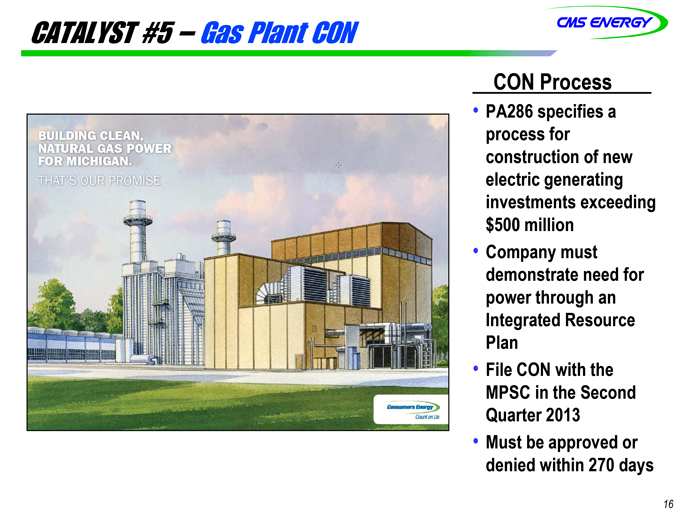
CATALYST #5 – Gas Plant CON
BUILDING CLEAN, NATURAL GAS POWER FOR MICHIGAN.
THAT’S OUR PROMISE
CON Process
• PA286 specifies a process for construction of new electric generating investments exceeding $500 million
• Company must demonstrate need for power through an Integrated Resource Plan
• File CON with the MPSC in the Second Quarter 2013
• Must be approved or denied within 270 days
16
CMS ENERGY
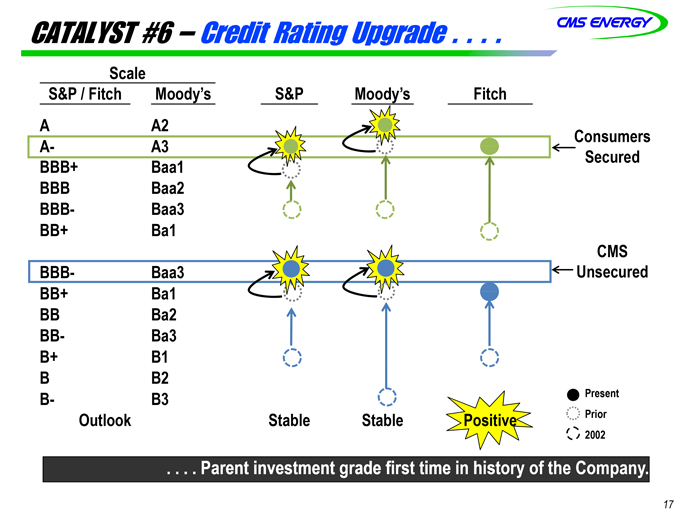
CATALYST #6 – Credit Rating Upgrade . . . .
Scale
S&P / Fitch
Moody’s
S&P
Moody’s
Fitch
A
A2
A-
A3
Consumers
BBB+
Baa1
Secured
BBB
Baa2
BBB-
Baa3
BB+
Ba1
CMS
BBB-
Baa3
Unsecured
BB+
Ba1
BB
Ba2
BB-
Ba3
B+
B1
B
B2
B-
B3
Present
Outlook
Stable
Stable
Positive
Prior
2002
. . . . Parent investment grade first time in history of the Company.
17
CMS ENERGY
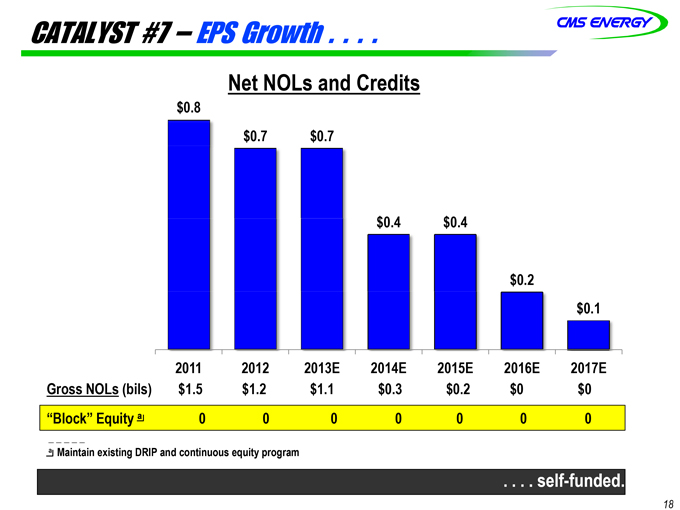
CATALYST #7 – EPS Growth . . . .
Net NOLs and
Credits
$0.8
$0.7
$0.7
$0.4
$0.4
$0.2
$0.1
2011
2012
2013E
2014E
2015E
2016E
2017E
Gross NOLs (bils)
$1.5
$1.2
$1.1
$0.3
$0.2
$0
$0
“Block” Equity a
0
0
0
0
0
0
0
a Maintain existing DRIP and continuous equity program
. . . . self-funded.
18
CMS ENERGY
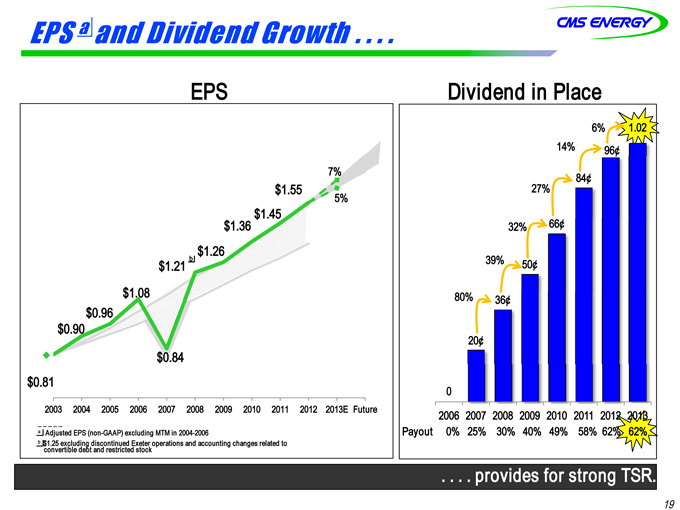
EPS a and Dividend Growth . . . .
EPS
Dividend in Place
6%
1.02
14%
96¢
7%
84¢
$1.55
27%
5%
$1.45
$1.36
32%
66¢
$1.26
$1.21 b
39%
50¢
$1.08
80%
36¢
$0.96
$0.90
20¢
$0.84
$0.81
0
2003 2004 2005 2006 2007 2008 2009 2010 2011 2012 2013E Future
2006
2007
2008
2009
2010
2011
2012
2013
a Adjusted EPS (non-GAAP) excluding MTM in 2004-2006
Payout
0%
25%
30%
40%
49%
58%
62%
62%
b $1.25 excluding discontinued Exeter operations and accounting changes related to convertible debt and restricted stock
. . . . provides for strong TSR.
19
CMS ENERGY
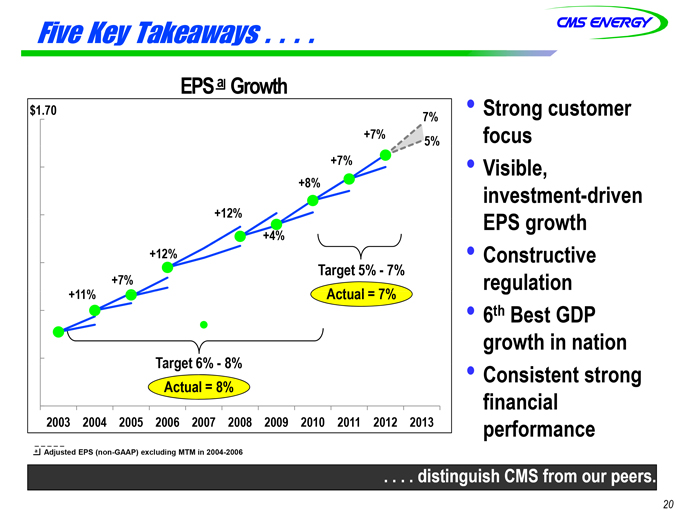
Five Key Takeaways . . . .
EPS a Growth
$1.70
Strong customer
7%
+7%
5%
focus
+7%
Visible,
+8%
investment-driven
+12%
EPS growth
+4%
+12%
Constructive
Target 5% - 7%
+7%
regulation
+11%
Actual = 7%
6th Best GDP
growth in nation
Target 6% - 8%
Consistent strong
Actual = 8%
financial
2003 2004
2005
2006 2007 2008 2009
2010
2011 2012
2013
performance
a Adjusted EPS (non-GAAP) excluding MTM in 2004-2006
. . . . distinguish CMS from our peers.
20

APPENDIX
CMS ENERGY
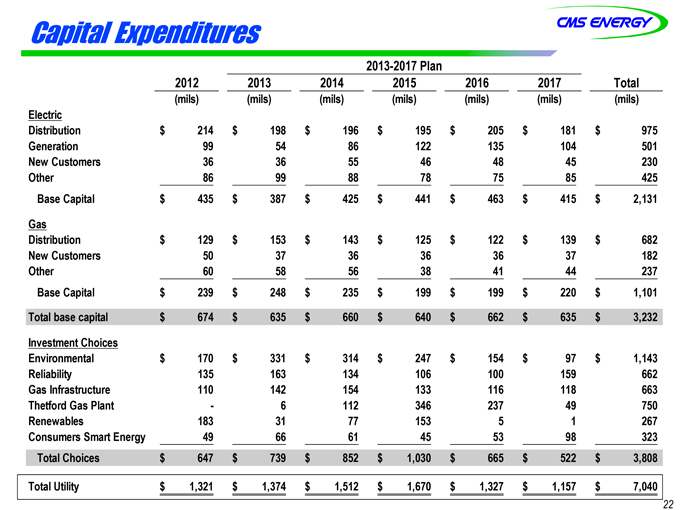
Capital Expenditures
2013-2017 Plan
2012
2013
2014
2015
2016
2017
Total
(mils)
(mils)
(mils)
(mils)
(mils)
(mils)
(mils)
Electric
Distribution
$214
$198
$196
$195
$205
$181
$975
Generation
99
54
86
122
135
104
501
New Customers
36
36
55
46
48
45
230
Other
86
99
88
78
75
85
425
Base Capital
$435
$387
$425
$441
$463
$415
$2,131
Gas
Distribution
$129
$153
$143
$125
$122
$139
$682
New Customers
50
37
36
36
36
37
182
Other
60
58
56
38
41
44
237
Base Capital
$239
$248
$235
$199
$199
$220
$1,101
Total base capital
$674
$635
$660
$640
$662
$635
$3,232
Investment Choices
Environmental
$170
$331
$314
$247
$154
$97
$1,143
Reliability
135
163
134
106
100
159
662
Gas Infrastructure
110
142
154
133
116
118
663
Thetford Gas Plant
-
6
112
346
237
49
750
Renewables
183
31
77
153
5
1
267
Consumers Smart Energy
49
66
61
45
53
98
323
Total Choices
$647
$739
$852
$1,030
$665
$522
$3,808
Total Utility
$1,321
$1,374
$1,512
$1,670
$1,327
$1,157
$7,040
22
CMS ENERGY
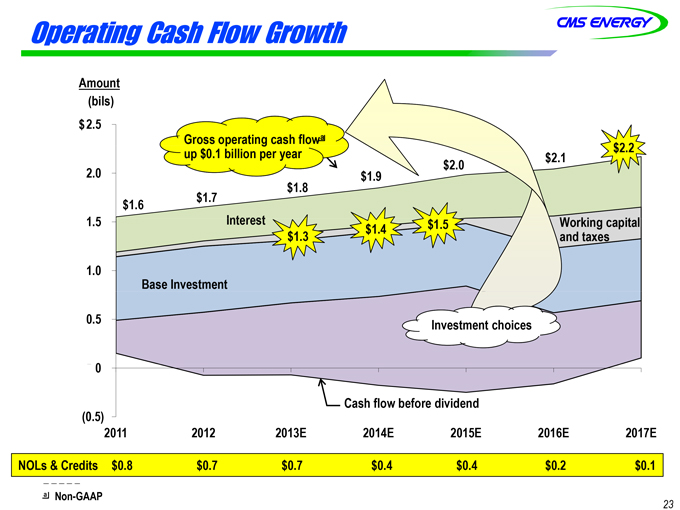
Operating Cash Flow Growth
Amount
(bils)
$2.5
Gross operating cash flow a
up $0.1 billion per year
$2.2
$2.1
2.0
$2.0
$1.9
$1.8
$1.6
$1.7
1.5
Interest
$1.4
$1.5
Working capital and
$1.3
taxes
1.0
Base Investment
0.5
Investment choices
0
Cash flow before dividend
(0.5)
2011
2012
2013E
2014E
2015E
2016E
2017E
NOLs & Credits
$0.8
$0.7
$0.7
$0.4
$0.4
$0.2
$0.1
a Non-GAAP
23
CMS ENERGY
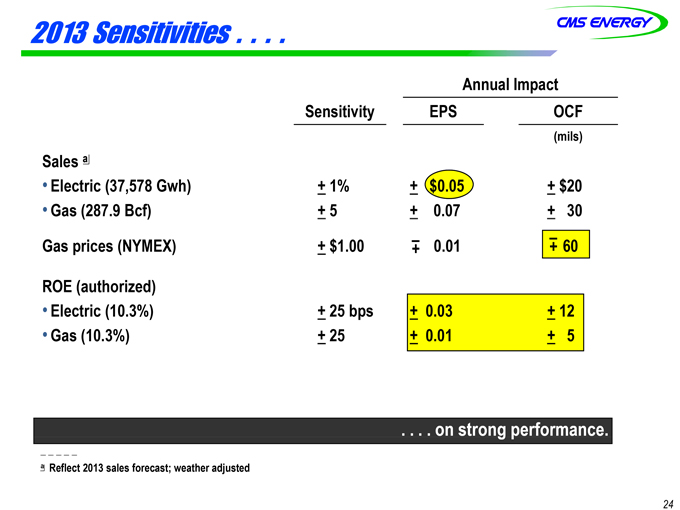
2013 Sensitivities . . . .
Annual Impact
Sensitivity EPS OCF (mils)
Sales a
• Electric (37,578 Gwh) ± 1% ± $0.05 ± $20
• Gas (287.9 Bcf) ± 5 ± 0.07 ± 30
Gas prices (NYMEX) ± $1.00 -+ 0.01 -+ 60
ROE (authorized)
• Electric (10.3%) ± 25 bps ± 0.03 ± 12
• Gas (10.3%) ± 25 ± 0.01 ± 5
. . . . on strong performance.
_ _ _ _ _
a Reflect 2013 sales forecast; weather adjusted
24
GAAP Reconciliation
CMS ENERGY CORPORATION
Earnings Per Share By Year GAAP Reconciliation
(Unaudited)
| 2003 |
2004 |
2005 |
2006 |
2007 |
2008 |
2009 |
2010 |
2011 |
2012 |
|||||||||||||||||||||||||||||||
| Reported earnings (loss) per share - GAAP |
($ | 0.30 | ) | $ | 0.64 | ($ | 0.44 | ) | ($ | 0.41 | ) | ($ | 1.02 | ) | $ | 1.20 | $ | 0.91 | $ | 1.28 | $ | 1.58 | $ | 1.42 | ||||||||||||||||
| After-tax items: |
||||||||||||||||||||||||||||||||||||||||
| Electric and gas utility |
0.21 | (0.39 | ) | — | — | (0.07 | ) | 0.05 | 0.33 | 0.03 | 0.00 | 0.17 | ||||||||||||||||||||||||||||
| Enterprises |
0.74 | 0.62 | 0.04 | (0.02 | ) | 1.25 | (0.02 | ) | 0.09 | (0.03 | ) | (0.11 | ) | (0.01 | ) | |||||||||||||||||||||||||
| Corporate interest and other |
0.16 | (0.03 | ) | 0.04 | 0.27 | (0.32 | ) | (0.02 | ) | 0.01 | * | (0.01 | ) | * | ||||||||||||||||||||||||||
| Discontinued operations (income) loss |
(0.16 | ) | 0.02 | (0.07 | ) | (0.03 | ) | 0.40 | ( | *) | (0.08 | ) | 0.08 | (0.01 | ) | (0.03 | ) | |||||||||||||||||||||||
| Asset impairment charges, net |
— | — | 1.82 | 0.76 | 0.60 | — | — | — | — | — | ||||||||||||||||||||||||||||||
| Cumulative accounting changes |
0.16 | 0.01 | — | — | — | — | — | — | — | — | ||||||||||||||||||||||||||||||
| Adjusted earnings per share, including MTM - non-GAAP |
$ | 0.81 | $ | 0.87 | $ | 1.39 | $ | 0.57 | $ | 0.84 | $ | 1.21 | (a) | $ | 1.26 | $ | 1.36 | $ | 1.45 | $ | 1.55 | |||||||||||||||||||
| Mark-to-market impacts |
0.03 | (0.43 | ) | 0.51 | ||||||||||||||||||||||||||||||||||||
| Adjusted earnings per share, excluding MTM - non-GAAP |
NA | $ | 0.90 | $ | 0.96 | $ | 1.08 | NA | NA | NA | NA | NA | NA | |||||||||||||||||||||||||||
| * | Less than $500 thousand or $0.01 per share. |
| (a) | $1.25 excluding discontinued Exeter operations and accounting changes related to convertible debt and restricted stock. |
2003-12 EPS
CMS Energy
Reconciliation of Gross Operating Cash Flow to GAAP Operating Activities
(unaudited)
(mils)
| 2011 |
2012 |
2013 |
2014 |
2015 |
2016 |
2017 |
||||||||||||||||||||||
| Consumers Operating Income + Depreciation & Amortization |
$ | 1,527 | $ | 1,635 | $ | 1,735 | $ | 1,821 | $ | 1,948 | $ | 2,011 | $ | 2,113 | ||||||||||||||
| Enterprises Project Cash Flows |
24 | 17 | 20 | 29 | 37 | 44 | 56 | |||||||||||||||||||||
| Gross Operating Cash Flow |
$ | 1,551 | $ | 1,652 | $ | 1,755 | $ | 1,850 | $ | 1,985 | $ | 2,055 | $ | 2,169 | ||||||||||||||
| Other operating activities including taxes, interest payments and working capital |
(382 | ) | (411 | ) | (405 | ) | (400 | ) | (435 | ) | (805 | ) | (819 | ) | ||||||||||||||
| Net cash provided by operating activities |
$ | 1,169 | $ | 1,241 | $ | 1,350 | $ | 1,450 | $ | 1,550 | $ | 1,250 | $ | 1,350 | ||||||||||||||
2011-17 OCF
CMS Energy
2012 Reconciliation of Gross Operating Cash Flow to GAAP Operating Activities
(unaudited)
(mils)
| 2012 |
||||
| Consumers Operating Income + Depreciation & Amortization |
$ | 1,635 | (a) | |
| Enterprises Project Cash Flows |
17 | |||
| Gross Operating Cash Flow |
$ | 1,652 | ||
| Other operating activities including taxes, interest payments and working capital |
(411 | ) | ||
| Net cash provided by operating activities |
$ | 1,241 | ||
| (a) | Excludes impact of $59 million electric decoupling write off |
2012 OCF