Attached files
| file | filename |
|---|---|
| 8-K - FORM 8-K - HomeStreet, Inc. | hmstform8-kupdated4q12inve.htm |

MANAGEMENT UPDATE Fourth Quarter & Year-End 2012 NASDAQ:HMST 1
Important Disclosures Forward-Looking Statements In accordance with the Private Securities Litigation Reform Act of 1995, we caution you that we may make forward-looking statements about our future financial performance and business in this presentation that are subject to many risks and uncertainties. These forward-looking statements are based on our management's and other experts’ current expectations, beliefs, projections, future plans and strategies, anticipated events or trends and similar expressions concerning matters that are not historical facts, as well as a number of assumptions concerning future events. These statements are subject to risks, uncertainties, assumptions and other important factors set forth in our SEC filings, including but not limited to our 2012 Annual Report on Form 10-K and our various Quarterly Reports on Form 10-Q. Many of these factors are beyond our control. Such factors could cause actual results to differ materially from the results discussed or implied in the forward-looking statements. For instance, our ability to expand our banking operations geographically and across market sectors, grow our franchise and capitalize on market opportunities may be limited due to future risks and uncertainties. Actual results may fall materially short of our expectations and projections, and we may change our plans or take additional actions that differ in material ways from our current intentions. Accordingly, you should not rely unduly on forward-looking statements. All forward looking statements are based on information available to the Company as of the date hereof, and we cannot undertake to update or revise any forward looking statements, for any reason. Basis of Presentation of Financial Data Unless noted otherwise in this presentation, all reported financial data is being presented as of the period ending December 31, 2012. Non-GAAP Financial Measures Information on any non-GAAP financial measures referenced in today’s presentation, including a reconciliation of those measures to GAAP measures, may also be found in our SEC filings and in the earnings release available on our web site. 2

Established Pacific Northwest Franchise • 92-year diversified financial services company headquartered in Seattle • $2.63 billion institution with 22 retail branches and 27 stand-alone lending centers • Full-service commercial bank and diversified lender • $1.98 billion in deposits 3 HomeStreet retail branches (22) HomeStreet stand-alone lending centers (24) • Attractive PNW demographics ‒ Population growth ‒ Household/business formation ‒ Employment base, job creation ‒ Concentration of large high-growth employers ‒ Housing recovery State # of Branches Washington 33 Oregon 7 Hawaii 5 Idaho 3 California 1
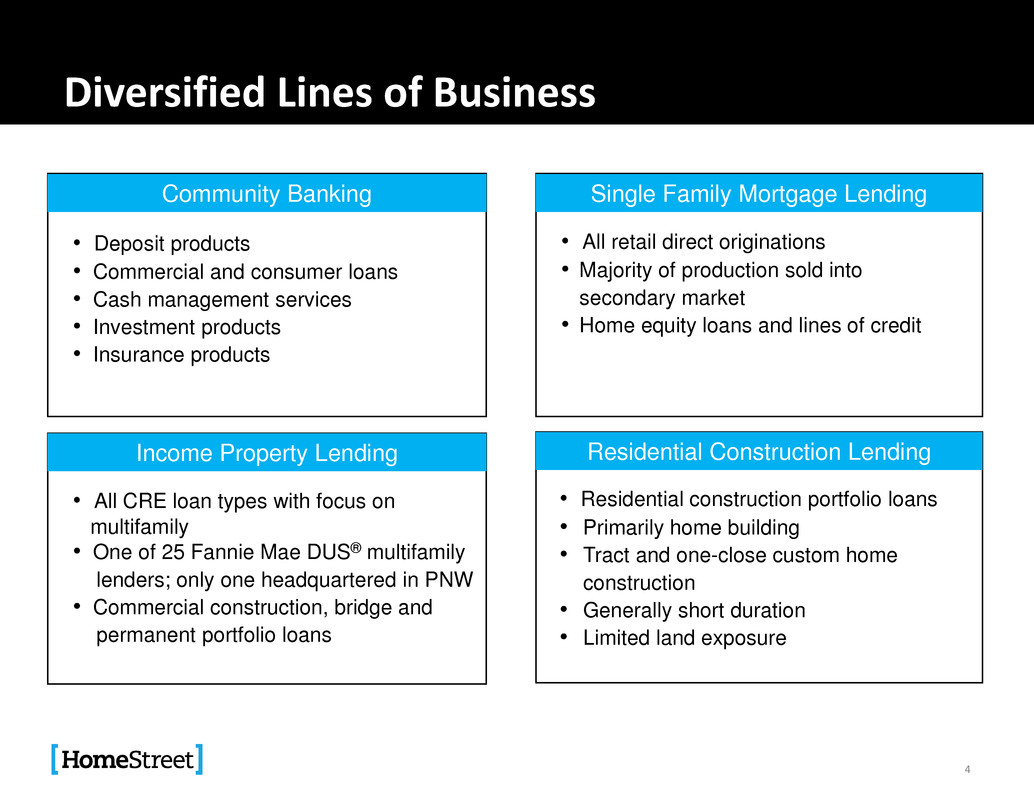
Diversified Lines of Business 4 Community Banking • Deposit products • Commercial and consumer loans • Cash management services • Investment products • Insurance products Single Family Mortgage Lending • All retail direct originations • Majority of production sold into secondary market • Home equity loans and lines of credit Income Property Lending Residential Construction Lending • All CRE loan types with focus on multifamily • One of 25 Fannie Mae DUS® multifamily lenders; only one headquartered in PNW • Commercial construction, bridge and permanent portfolio loans • Residential construction portfolio loans • Primarily home building • Tract and one-close custom home construction • Generally short duration • Limited land exposure

Recent Developments • Dividend of $0.11 per share declared to shareholders of record as of April 11, 2013, to be paid on April 22, 2013 • Opened two new bank branches in fourth quarter: − Lynnwood, WA, in November − Fremont neighborhood of Seattle, WA, in December • Selected as Seattle Seahawks/Seattle Sounders new banking partner • FDIC and WDFI terminated HomeStreet Bank's Memorandum of Understanding in December 2012 • Federal Reserve’s board of governors terminated Company’s regulatory order on March 26, 2013 5

2012 Results of Operations ROAA 3.46% 3.43% 0.70% ROAE 32.80% 39.18% 23.52% Net Interest Margin 3.06% 2.89% 2.36% Operating Efficiency Ratio (1) 61.81% 58.01% 66.04% Tier 1 Leverage Ratio (Bank) 11.78% 6.04% (3) Total Risk-Based Capital (Bank) 19.31% 11.15% (3) 6 For the three months ended Dec. 31, 2012 2012 2011 Net interest income $ 16,591 $ 60,743 $ 48,494 Provision for loan losses 4,000 11,500 3,300 Noninterest income 71,720 237,534 97,205 Noninterest expense 55,754 183,105 126,494 Net income before taxes 28,557 103,672 15,905 Income taxes 7,060 21,546 (214) Net income $ 21,497 $ 82,126 $ 16,119 Diluted EPS $ 1.46 $ 5.98 N/M (2) For the three months ended (1) See Appendix for reconciliation of non-GAAP financial measures (2) Not meaningful due to 2012 IPO (3) At Dec. 31, 2011
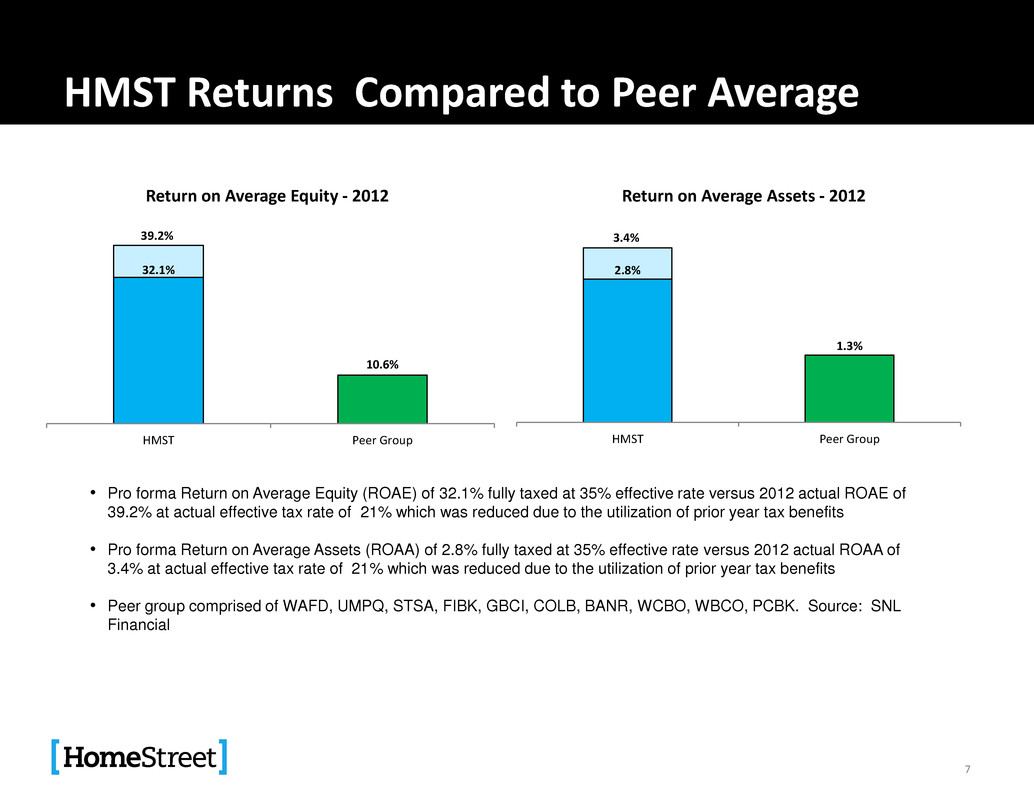
HMST Returns Compared to Peer Average 7 • Pro forma Return on Average Equity (ROAE) of 32.1% fully taxed at 35% effective rate versus 2012 actual ROAE of 39.2% at actual effective tax rate of 21% which was reduced due to the utilization of prior year tax benefits • Pro forma Return on Average Assets (ROAA) of 2.8% fully taxed at 35% effective rate versus 2012 actual ROAA of 3.4% at actual effective tax rate of 21% which was reduced due to the utilization of prior year tax benefits • Peer group comprised of WAFD, UMPQ, STSA, FIBK, GBCI, COLB, BANR, WCBO, WBCO, PCBK. Source: SNL Financial 32.1% 10.6% 39.2% HMST Peer Group Return on Average Equity - 2012 2.8% 1.3% 3.4% HMST Peer Group Return on Average Assets - 2012
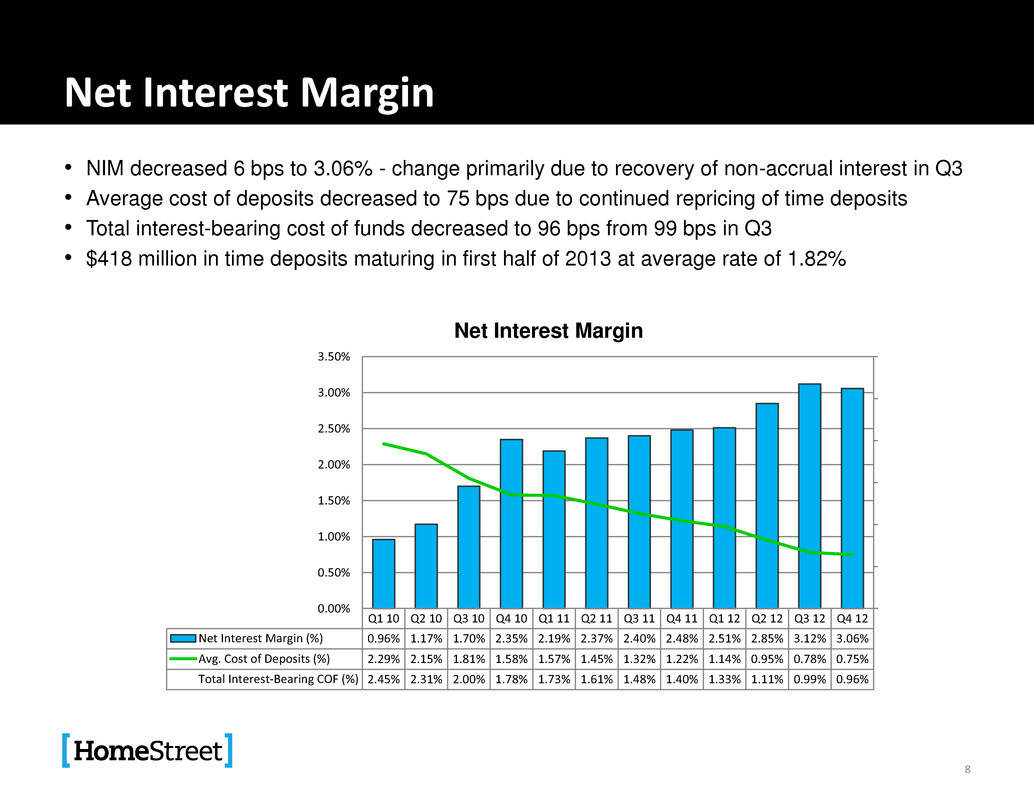
Net Interest Margin • NIM decreased 6 bps to 3.06% - change primarily due to recovery of non-accrual interest in Q3 • Average cost of deposits decreased to 75 bps due to continued repricing of time deposits • Total interest-bearing cost of funds decreased to 96 bps from 99 bps in Q3 • $418 million in time deposits maturing in first half of 2013 at average rate of 1.82% 8 Q1 10 Q2 10 Q3 10 Q4 10 Q1 11 Q2 11 Q3 11 Q4 11 Q1 12 Q2 12 Q3 12 Q4 12 Net Interest Margin (%) 0.96% 1.17% 1.70% 2.35% 2.19% 2.37% 2.40% 2.48% 2.51% 2.85% 3.12% 3.06% Avg. Cost of Deposits (%) 2.29% 2.15% 1.81% 1.58% 1.57% 1.45% 1.32% 1.22% 1.14% 0.95% 0.78% 0.75% Total Interest-Bearing COF (%) 2.45% 2.31% 2.00% 1.78% 1.73% 1.61% 1.48% 1.40% 1.33% 1.11% 0.99% 0.96% 0.00% 0.50% 1.00% 1.50% 2.00% 2.50% 3.00% 3.50% Net Interest Margin

Interest-Earning Assets • Higher net interest income reflects an increase in earning assets and continued improvement in asset yields • Total average interest-earning assets increased nearly $57 million to $2.24 billion in Q4 • Total average interest-earning assets increased due to higher mortgage production volume and higher average balance of loans held for sale • Average asset yield decreased to 3.82% in Q4 from 3.94% in Q3 9 Avg. Yield 3.73% 3.67% 3.79% 3.94% 3.82% 3.00% 3.20% 3.40% 3.60% 3.80% 4.00% 0.0 0.5 1.0 1.5 2.0 2.5 Q4 11 Q1 12 Q2 12 Q3 12 Q4 12 $ i n bi ll io n s Interest-Earning Assets Cash & Cash Equivalents Investment Securities Loans Held for Sale Loans Held for Investment Average Yield

Improving Composition of Deposits • Total deposits of $1.98 billion at December 31, 2012 • Transaction and savings deposits grew $17 million in Q4 and $272 million in 2012 to equal 53% of total deposits, compared to approximately 39% at the end of 2011 • Time deposits decreased $29 million in Q4 and $378 million in 2012 • Two new retail branches opened in Greater Seattle metropolitan market in Q4 2012; four new branch openings planned for 2013 10 5% 8% 10% 14% 27% 31% 39% 53% 68% 61% 51% 33% Q4 09 Q4 10 Q4 11 Q4 12 Composition of Deposits Mortgage Svcg. Escrow Accts. & Other Transaction & Savings Deposits Time Deposits

Noninterest Income • Noninterest income increased 144% to $237.5 million for full-year 2012, compared to $97 million for 2011, driven by increased mortgage loan origination and sale revenue • 2012 Noninterest Income/Total Average Assets of 9.9% vs. peers of 0.8% (1) 11 (1) Peer group comprised of WAFD, UMPQ, STSA, FIBK, GBCI, COLB, BANR, WCBO, WBCO, PCBK (Source: SNL) Q4 11 Q1 12 Q2 12 Q3 12 Q4 12 Noninterest Income $27,543 $40,097 $56,743 $68,976 $71,720 $0 $10,000 $20,000 $30,000 $40,000 $50,000 $60,000 $70,000 Noninterest Income ($ in thousands)
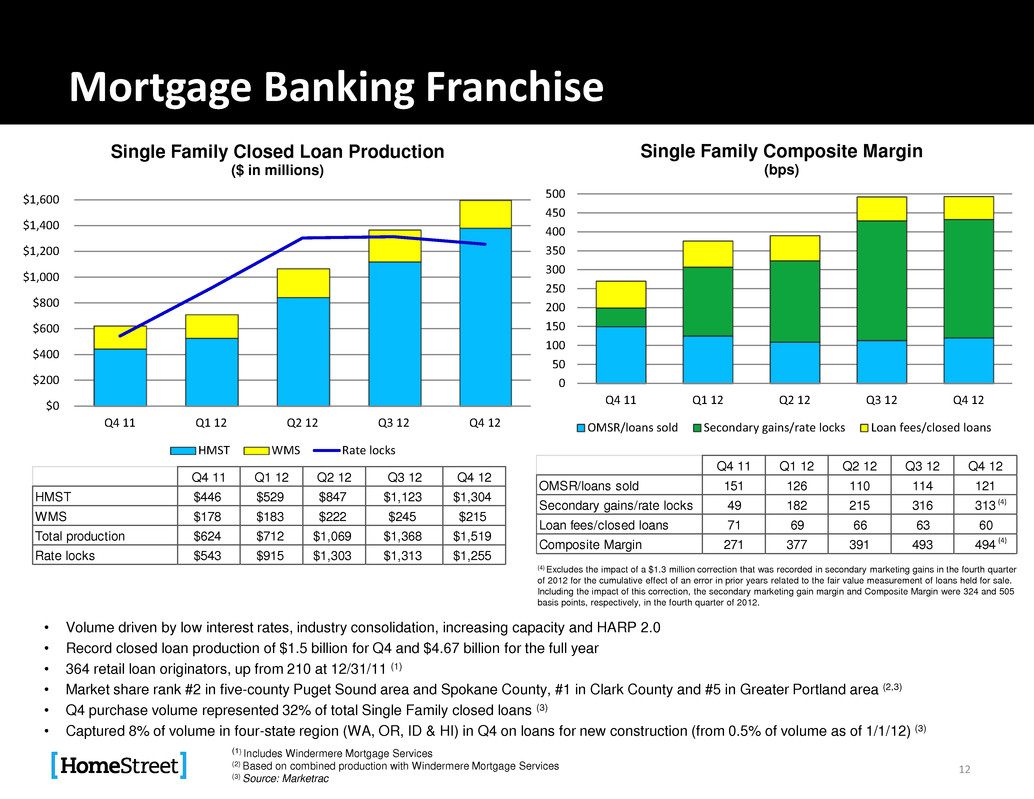
Mortgage Banking Franchise • Volume driven by low interest rates, industry consolidation, increasing capacity and HARP 2.0 • Record closed loan production of $1.5 billion for Q4 and $4.67 billion for the full year • 364 retail loan originators, up from 210 at 12/31/11 (1) • Market share rank #2 in five-county Puget Sound area and Spokane County, #1 in Clark County and #5 in Greater Portland area (2,3) • Q4 purchase volume represented 32% of total Single Family closed loans (3) • Captured 8% of volume in four-state region (WA, OR, ID & HI) in Q4 on loans for new construction (from 0.5% of volume as of 1/1/12) (3) 12 (1) Includes Windermere Mortgage Services (2) Based on combined production with Windermere Mortgage Services (3) Source: Marketrac $0 $200 $400 $600 $800 $1,000 $1,200 $1,400 $1,600 Q4 11 Q1 12 Q2 12 Q3 12 Q4 12 Single Family Closed Loan Production ($ in millions) HMST WMS Rate locks Bps Q4 11 Q1 12 Q2 12 Q3 12 Q4 12 HMST $446 $529 $847 $1,123 $1,304 WMS $178 $183 $222 $245 $215 Total production $624 $712 $1,069 $1,368 $1,519 Rate locks $543 $915 $1,303 $1,313 $1,255 4 1 Q1 12 Q2 12 Q3 12 Q4 12 OMSR/loans sold 15 126 110 114 121 Secondary gains/rate locks 49 182 215 316 313 Loan fees/closed loans 71 69 66 63 60 Composite Margin 271 377 391 493 494 (4) Excludes the impact of a $1.3 million correction that was recorded in secondary marketing gains in the fourth quarter of 2012 for the cumulative effect of an error in prior years related to the fair value measurement of loans held for sale. Including the impact of this correction, the secondary marketing gain margin and Composite Margin were 324 and 505 basis points, respectively, in the fourth quarter of 2012. (4) (4) 0 50 100 150 200 250 300 350 400 450 500 Q4 11 Q1 12 Q2 12 Q3 12 Q4 12 Single Family Composite Margin (bps) OMSR/loans sold Secondary gains/rate locks Loan fees/closed loans
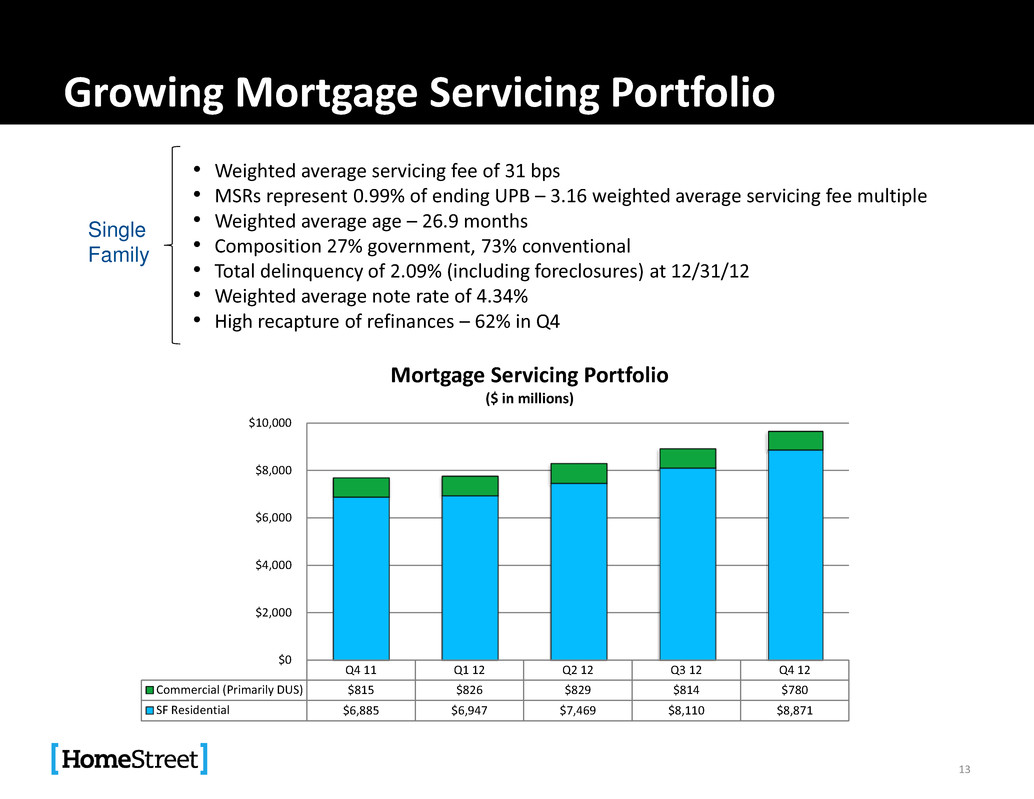
Growing Mortgage Servicing Portfolio • Weighted average servicing fee of 31 bps • MSRs represent 0.99% of ending UPB – 3.16 weighted average servicing fee multiple • Weighted average age – 26.9 months • Composition 27% government, 73% conventional • Total delinquency of 2.09% (including foreclosures) at 12/31/12 • Weighted average note rate of 4.34% • High recapture of refinances – 62% in Q4 13 Single Family Q4 11 Q1 12 Q2 12 Q3 12 Q4 12 Commercial (Primarily DUS) $815 $826 $829 $814 $780 SF Residential $6,885 $6,947 $7,469 $8,110 $8,871 $0 $2,000 $4,000 $6,000 $8,000 $10,000 Mortgage Servicing Portfolio ($ in millions)

Noninterest Expense • 2012 operating efficiency ratio of 58.01% (1) • Noninterest expense will continue to vary based on headcount and mortgage origination revenue 14 (1) See Appendix for reconciliation of non-GAAP financial measures Q4 11 Q1 12 Q2 12 Q3 12 Q4 12 FDIC assessments $1,256 $1,240 $717 $794 $803 Legal, consulting, occupancy, IT $6,255 $4,303 $5,132 $6,071 $6,780 OREO $3,748 $2,520 $6,049 $348 $1,169 General & administrative $6,182 $5,273 $6,725 $7,033 $8,322 Salaries & related costs $16,462 $21,351 $28,224 $31,573 $38,680 Total Expenses $33,903 $34,687 $46,847 $45,819 $55,754 Headcount 613 821 913 998 1099 Operating efficiency ratio 74.78% 60.77% 57.03% 53.18% 61.81% 0 200 400 600 800 1000 1200 $0 $10,000 $20,000 $30,000 $40,000 $50,000 $60,000 Noninterest Expense ($ in thousands) Headcount
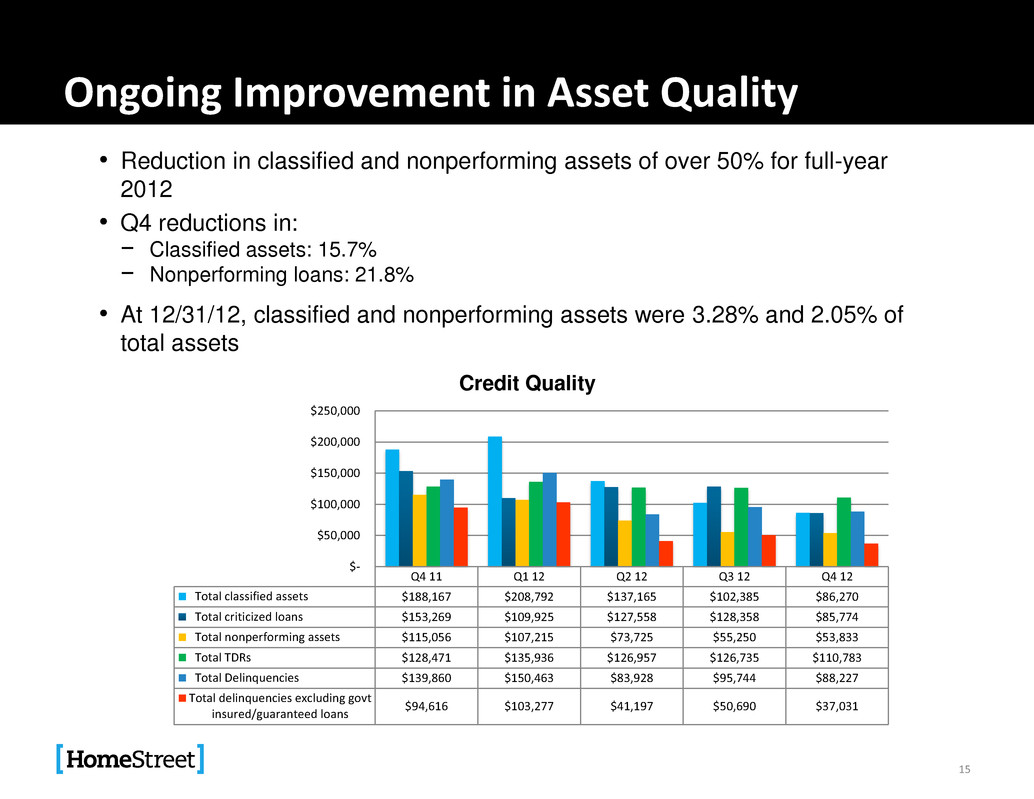
Ongoing Improvement in Asset Quality 15 • Reduction in classified and nonperforming assets of over 50% for full-year 2012 • Q4 reductions in: − Classified assets: 15.7% − Nonperforming loans: 21.8% • At 12/31/12, classified and nonperforming assets were 3.28% and 2.05% of total assets Q4 11 Q1 12 Q2 12 Q3 12 Q4 12 Total classified assets $188,167 $208,792 $137,165 $102,385 $86,270 Total criticized loans $153,269 $109,925 $127,558 $128,358 $85,774 Total nonperforming assets $115,056 $107,215 $73,725 $55,250 $53,833 Total TDRs $128,471 $135,936 $126,957 $126,735 $110,783 Total Delinquencies $139,860 $150,463 $83,928 $95,744 $88,227 Total delinquencies excluding govt insured/guaranteed loans $94,616 $103,277 $41,197 $50,690 $37,031 $- $50,000 $100,000 $150,000 $200,000 $250,000 Credit Quality
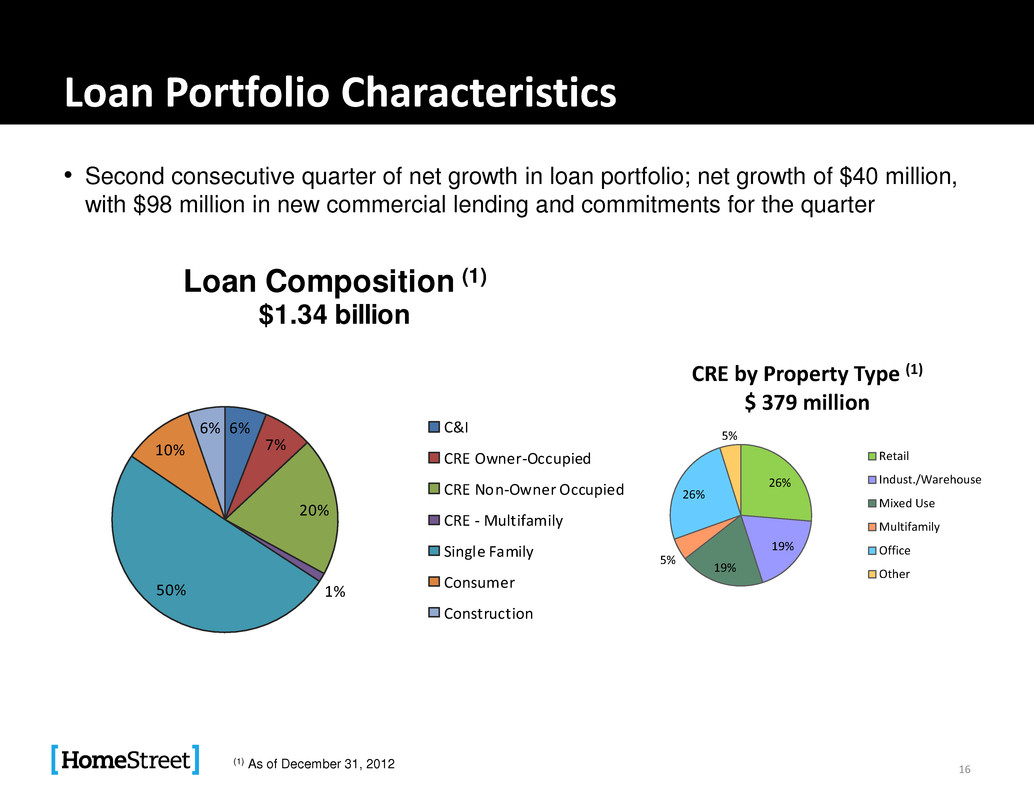
Loan Portfolio Characteristics • Second consecutive quarter of net growth in loan portfolio; net growth of $40 million, with $98 million in new commercial lending and commitments for the quarter 16 (1) As of December 31, 2012 26% 19% 19% 5% 26% 5% CRE by Property Type (1) $ 379 million Retail Indust./Warehouse Mixed Use Multifamily Office Other 6% 7% 20% 1%50% 10% 6% Loan Composition (1) $1.34 billion C&I CRE Owner-Occupied CRE Non-Owner Occupied CRE - Multifamily Single Family Consumer Construction
Long-Term Growth Strategies • Diversify revenue to grow non-mortgage banking income ‒ Organic growth opportunities driven by attractive market demographics Expand commercial and consumer banking activities o Commercial: lending, deposits, cash management, investments, insurance o Consumer: mortgage loans, deposits, investments, insurance Expand multifamily mortgage banking, primarily through Fannie Mae DUS® program Grow portfolio lending – C&I, Commercial Real Estate and Construction ‒ Potential growth through acquisition of smaller in-market and near-market institutions • Continue opportunistic expansion (market share and footprint) of Single Family mortgage banking activities 17
Why HomeStreet? • Established and expanding community bank with strong ties in the Pacific Northwest and Hawaii • Leading regional Single Family mortgage lender and only Fannie Mae DUS® Multifamily lender headquartered in the Northwest • Focus on growth of commercial banking and expansion of traditional portfolio lending business lines to balance mortgage income • Superior returns on equity due to high noninterest income 18

. Managing Through the Mortgage Market Transition 19
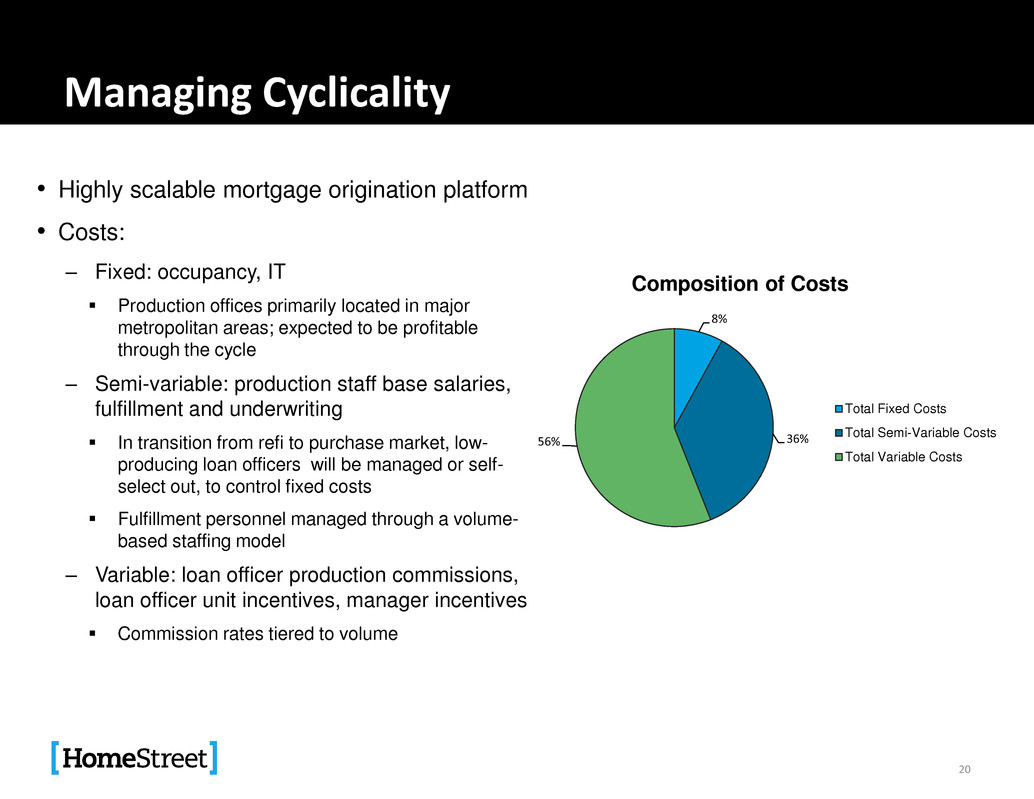
Managing Cyclicality • Highly scalable mortgage origination platform • Costs: ‒ Fixed: occupancy, IT Production offices primarily located in major metropolitan areas; expected to be profitable through the cycle ‒ Semi-variable: production staff base salaries, fulfillment and underwriting In transition from refi to purchase market, low- producing loan officers will be managed or self- select out, to control fixed costs Fulfillment personnel managed through a volume- based staffing model ‒ Variable: loan officer production commissions, loan officer unit incentives, manager incentives Commission rates tiered to volume 20 8% 36% 56% Composition of Costs Total Fixed Costs Total Semi-Variable Costs Total Variable Costs
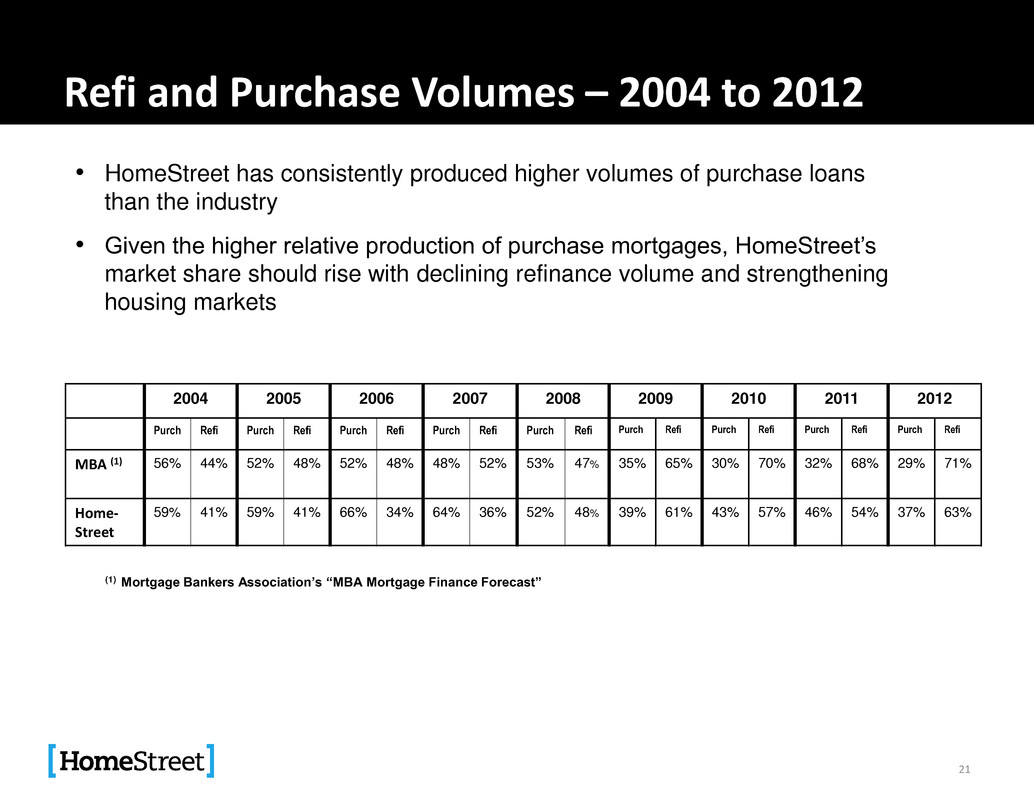
Refi and Purchase Volumes – 2004 to 2012 2004 2005 2006 2007 2008 2009 2010 2011 2012 Purch Refi Purch Refi Purch Refi Purch Refi Purch Refi Purch Refi Purch Refi Purch Refi Purch Refi MBA (1) 56% 44% 52% 48% 52% 48% 48% 52% 53% 47% 35% 65% 30% 70% 32% 68% 29% 71% Home- Street 59% 41% 59% 41% 66% 34% 64% 36% 52% 48% 39% 61% 43% 57% 46% 54% 37% 63% 21 • HomeStreet has consistently produced higher volumes of purchase loans than the industry • Given the higher relative production of purchase mortgages, HomeStreet’s market share should rise with declining refinance volume and strengthening housing markets (1) Mortgage Bankers Association’s “MBA Mortgage Finance Forecast”

Strategy: Build on Best-in-Breed Strengths and Market Position • Retain existing offices and open more offices with expanded footprint. HomeStreet is attractive employer based on company’s strong regional platform, quality and profitability: ‒ Top-tier compensation plans for high volume originators ‒ Reliable fulfillment and high quality sales support Timely closings on purchases Production assistant program ‒ Complete menu of products, including “one-step” construction-to-permanent loans, portfolio products and focused builder-takeout marketing program 24% of purchase volume was generated by builder-takeout lending program in 2012 ‒ Market-leading pricing for all loan types ‒ Individualized marketing support, including Customer Relationship Management technology • Scalable, efficient and customer-friendly servicing platform ‒ Best-in-class servicing customer retention -- #1 among 16 peers (MGIC National Peer Group) 22

Retail Origination Model • HomeStreet has 100% retail production – no third party correspondent or broker origination • Since 2000, national mortgage originations by channel have changed significantly: Market Share (1) 2000 2012 Retail 38% 60% Broker 28% 11% Correspondent 34% 29% • Advantages of Retail Channel: ‒ Higher retail origination and funding fees offset higher production costs ‒ Better credit performance; lower compliance risk ‒ As a retail originator and direct seller to the GSEs, HomeStreet operates without credit or pricing overlays necessary for brokers and correspondents (1) Inside Mortgage Finance: Originations by Production Channel: Revised March 1, 2013 23

2013-2014 MBA Forecast • MBA forecasts 2013 as a transition year, leading to a stronger purchase market and reduced refinance activity (1) MBA Mortgage Finance Forecast, March 22, 2013 24 0 0.1 0.2 0.3 0.4 0.5 0.6 0.7 0.8 0.9 0 100 200 300 400 500 600 3Q11 4Q11 1Q12 2Q12 3Q12 4Q12 1Q13 2Q13 3Q13 4Q13 1Q14 2Q14 3Q14 4Q14 MBA Origination Forecast (1): Purchase vs. Refi ($B) Orig, Purchase- Actual Orig, Purchase- MBA FCST Orig, Refi- Actual Orig, Refi- MBA FCST Origination Refi %- Actual Origination Refi%- MBA FCST

Sustaining Mortgage Production Volumes Through a Changing Market – Scenario Analysis • Growth strategy is defensive and offensive: ‒ Protect existing market share by retaining highest-performing lending officers ‒ Continue to hire top performers in our target market areas focused on purchase mortgages ‒ Grow new house purchase market share through our builder-takeout lending program • Scenario Analysis Assumptions: ‒ MBA Mortgage Finance Forecast dated March 22, 2013 ‒ Actual 2012 and 2013-2014 loan production staff hiring scenario ‒ Estimated loans per producer adjusted to reflect MBA market forecast 25 2012 Actual Loan Producers Growth: 94 or 53% increase 2013 Growth Scenario Loan Producers Growth Projection: 144 or 53% Increase 2014 Growth Scenario Loan Producers Growth Projection: 144 or 35% Increase Expected reduction in production volumes for existing loan producing staff is offset through growth of Loan Producers, resulting in more moderate effect of the changing market in the near term and overall volume growth prospects in the longer term.

26 Appendix

Management Team 27 Executive Joined Company Years in Industry Relevant Experience Mark K. Mason Director, Vice Chairman, President and Chief Executive Officer September 2009 27 • Seasoned banking executive with demonstrated success implementing turnaround and growth strategies • Former Chairman and CEO of Fidelity Bank Cory D. Stewart Executive Vice President, Chief Accounting Officer March 2012 13 • Extensive experience in finance, accounting and enterprise risk management roles in the financial industry including at Washington Mutual • MBA, CPA, CFA charter holder Darrell van Amen Executive Vice President, Chief Investment Officer March 2003 24 • Manages bank’s MSR and pipeline risk, secondary marketing and investment portfolio • Formerly with Royal Bank of Canada and Old Kent Financial Jay C. Iseman Executive Vice President, Chief Credit Officer August 2009 22 • Significant experience in credit administration and special assets for Bank of America and Key Bank • Chairs Bank Loan Committee
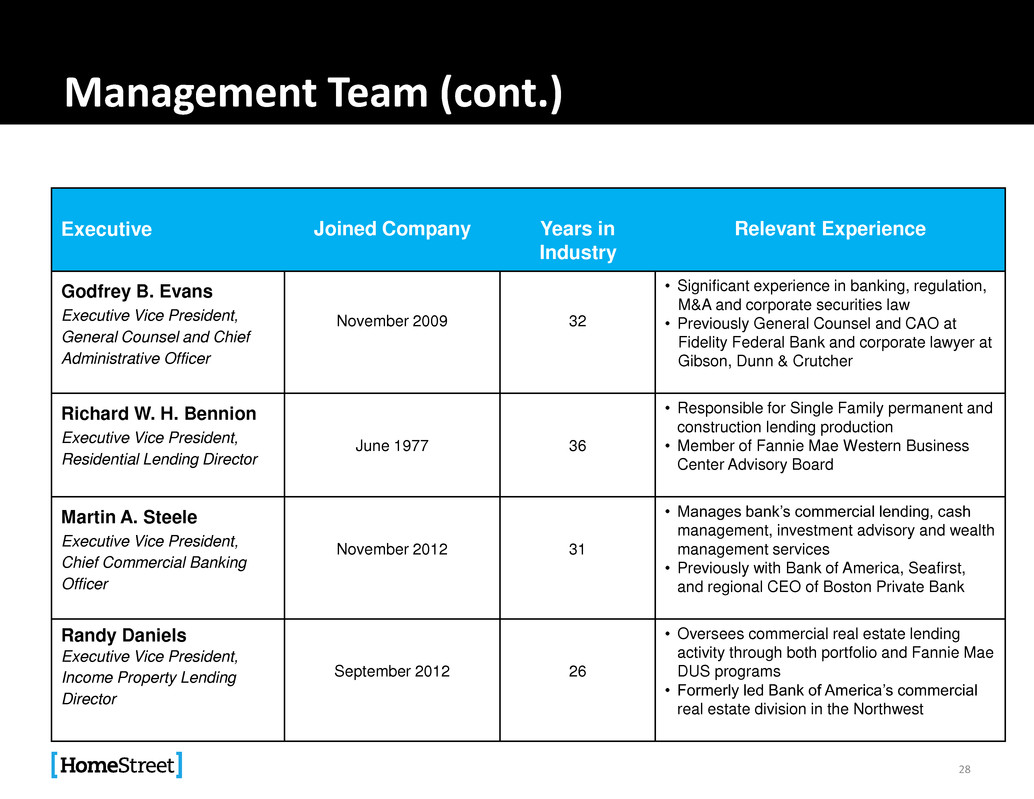
Management Team (cont.) 28 Executive Joined Company Years in Industry Relevant Experience Godfrey B. Evans Executive Vice President, General Counsel and Chief Administrative Officer November 2009 32 • Significant experience in banking, regulation, M&A and corporate securities law • Previously General Counsel and CAO at Fidelity Federal Bank and corporate lawyer at Gibson, Dunn & Crutcher Richard W. H. Bennion Executive Vice President, Residential Lending Director June 1977 36 • Responsible for Single Family permanent and construction lending production • Member of Fannie Mae Western Business Center Advisory Board Martin A. Steele Executive Vice President, Chief Commercial Banking Officer November 2012 31 • Manages bank’s commercial lending, cash management, investment advisory and wealth management services • Previously with Bank of America, Seafirst, and regional CEO of Boston Private Bank Randy Daniels Executive Vice President, Income Property Lending Director September 2012 26 • Oversees commercial real estate lending activity through both portfolio and Fannie Mae DUS programs • Formerly led Bank of America’s commercial real estate division in the Northwest

Basel III 29 Estimated Capital Ratios under Basel III – December 31, 2012 Well-Capitalized Minimum Under Current Rules Pro forma Basel III (2) Under Current Rules Pro forma Basel III (2,3) Tier 1 Leverage 5.0% 11.8% 10.4% 12.6% 11.0% Total Risk-Based Capital 10.5% (1) 19.3% 13.8% 16.0% 11.8% HomeStreet Bank HomeStreet, Inc. (1) Ratio includes 2.5% Capital Conservation Buffer required by Basel III for unrestricted payments of dividends, share buybacks and discretionary bonus payments (2) Risk-weighted assets do not include the impact of first payment default reps and warranties on Single Family loan sales (3) Does not reflect the phase-out over ten years of $60 million of Trust Preferred Securities under the current Basel III proposal

Non-GAAP Reconciliation 30 Three Months Ended ($ in millions) 12/31/2012 9/30/2012 6/30/2012 3/31/2012 12/31/2011 Noninterest expense $55.8 $45.8 $46.8 $34.7 $33.9 Less: OREO expense 1.2 0.3 6.0 2.5 3.7 Adjusted noninterest expense $54.6 $45.5 $40.8 $32.2 $30.2 Net interest income before provisions 16.6 16.5 14.8 12.8 12.8 Noninterest income 71.7 69.0 56.7 40.1 27.5 Adjusted operating revenue $88.3 $85.5 $71.5 $52.9 $40.3 Operating efficiency ratio 61.8% 53.2% 57.0% 60.8% 74.8% Efficiency ratio 63.1% 53.6% 65.5% 65.5% 84.1%
