Attached files
| file | filename |
|---|---|
| 8-K - FORM 8-K - ABRAXAS PETROLEUM CORP | axas8k040813.htm |

Canaccord Genuity Road Show
April 2013
Exhibit 99.1
2
The information presented herein may contain predictions, estimates and other
forward-looking statements within the meaning of Section 27A of the Securities
Act of 1933 and Section 21E of the Securities Exchange Act of 1934. Although
the Company believes that its expectations are based on reasonable
assumptions, it can give no assurance that its goals will be achieved.
forward-looking statements within the meaning of Section 27A of the Securities
Act of 1933 and Section 21E of the Securities Exchange Act of 1934. Although
the Company believes that its expectations are based on reasonable
assumptions, it can give no assurance that its goals will be achieved.
Important factors that could cause actual results to differ materially from those
included in the forward-looking statements include the timing and extent of
changes in commodity prices for oil and gas, the need to develop and replace
reserves, environmental risks, competition, government regulation and the
ability of the Company to meet its stated business goals.
included in the forward-looking statements include the timing and extent of
changes in commodity prices for oil and gas, the need to develop and replace
reserves, environmental risks, competition, government regulation and the
ability of the Company to meet its stated business goals.
Forward-Looking Statements

3
Ø Exposure to "core" acreage in U.S. oil resource plays
Ø Significant, low-cost exposure to other emerging NAM oil resource plays
Premier
Position
Position
Value +
Growth
Growth
Ø Low decline legacy production provides solid foundation
Ø “Manufacturing” model in repeatable resource plays leads to visible growth
Proven
Operator
Operator
Ø Deep technical and geological / geophysical staff
Ø Company owned rig in Bakken + pad drilling = efficient, low cost operator
Oil
Weighted
Weighted
Ø 66% crude oil and liquids weighted by reserves(1)
Ø Nearly 100% of 2013E capital directed towards growing production from oil resource plays
(1) On reserve basis as of 12/31/12
Experienced
Leadership
Leadership
Ø Senior management with 32 average years of industry experience
Ø Highly qualified directors with significant energy industry and board experience
Abraxas Highlights

4
Headquarters........................ San Antonio
Employees............................... 101
Shares outstanding(1)……......... 92.7mm
Market cap(2) ……………………... $214mm
Bank debt net of cash(3)………. $111mm
PV-10(4)……………………………….. $316.9
mm
mm
(1) As of 3/31/13
(2) As of 3/31/13
(3) As of 12/31/12
(4) As of 12/31/12 Uses 12/31/12 SEC Pricing of $95.14/bbl oil and $2.86/mcf gas
(5) Based on December 31, 2012 reserves and annualized daily net production for the quarter ended December 21, 2012
EV/BOE(2,4)………………………… $11.19
Proved Reserves(4).…………..... 30.1mmboe
% Oil/Liquids……………… ~66%
% Proved developed….. ~48%
Production(3).……………………… 4,147boepd
R/P Ratio(5)………………………… 19.9x
2013E CAPEX………………………. $70mm
NASDAQ: AXAS
Corporate Profile

5
Proved Reserves (mmboe): 30.1
• Proved Developed: 48%
• Liquids: 66%
Abraxas Petroleum Corporation
Alberta, Canada
Williston:
Bakken / Three Forks
Powder River Basin:
Niobrara, Turner
Midland/Eastern Shelf:
Emerging Cline, Wolfcamp
Eagle Ford Shale
CBP: Conventional
Delaware Basin:
Montoya/Devonian/Miss Gas,
Shallow Oil, Emerging Hz. Oil
Shallow Oil, Emerging Hz. Oil
Rocky Mountain
Gulf Coast
Permian Basin
Canada
Pekisko
Eastern Shale
Basin: Duvernay
Basin: Duvernay
High Quality Assets
Core
Non
Core
Core
WolfBone
Uinta / Wind River /
Green River Dry Gas
Green River Dry Gas

6
Production(2) - 4,147 boepd
(1) Net proved reserves as of December 31, 2012
(2) Daily net production for the quarter ended December 31, 2012
Reserve / Production Summary
High-quality, Long-Lived, Oil Weighted Assets
High-quality, Long-Lived, Oil Weighted Assets

7
(1) Proved, Probable, Possible PV-10 based off December 31, 2012 reserves and SEC pricing of $95.13/bbl oil and $2.86/mcf gas
(2) Building, Rig & Other PP&E (workover rigs, misc equipment, etc) based off net book value as of December 31, 2012.
(3) Tax assessment of AXAS surface ownership in 162 acres Coke, TX; 613 acres Scurry, TX. Purchase price of AXAS 1,769 acres in San Patricio, TX; 12,178 acres Pecos, TX; 582 acres McKenzie, ND & Condos; 50 acres DeWitt, TX.
(4) Bank debt as of 12/31/12. WC Deficit as of 12/30/12 - excludes derivative assets and liabilities
Base NAV

8
II. Executing Our Plan

9
Strategic Plan
(1) Excluding building mortgage and rig loan which are secured by the building and rig, respectively. EBITDA definition per bank loan agreement (excludes Rig EBITDA)

10
Strategic Plan - Successful Execution
(1) As of 12/31/2011
(2) Excluding building mortgage and rig loan which are secured by the building and rig, respectively. EBITDA definition per bank loan agreement (excludes Rig EBITDA)
(3) Net of Nordheim divestitures

11
Budget Changes
§ Company has narrowed drilling focus to two core oily areas: Bakken and Eagle Ford
§ Company focus on Bakken and Eagle Ford oil consistent with industry activity and asset quality
§ “Held-by-production” positions in Permian and Powder River Basin provide medium-to-longer term flexibility
($ in millions)

12
Non-Op Bakken Divestiture Plan
§ On February 20, 2013, Abraxas announced that it had
retained E-Spectrum Advisors (an affiliate of Energy
Spectrum Advisors Inc.) to market its non-operated
Bakken and Three Forks assets in North Dakota and
Montana
retained E-Spectrum Advisors (an affiliate of Energy
Spectrum Advisors Inc.) to market its non-operated
Bakken and Three Forks assets in North Dakota and
Montana
§ Asset Details:
▫ >14,000 net acres in Billings, Burke, Divide, Dunn,
McKenzie, Stark and Williams Counties, ND and
Richland, Roosevelt and Sheridan Counties, MT
McKenzie, Stark and Williams Counties, ND and
Richland, Roosevelt and Sheridan Counties, MT
▫ 99% of acreage is held-by-production
▫ ~400 boepd
▫ Diverse and experienced operator base including:
Oasis Petroleum, Continental, ExxonMobil / XTO /
Denbury, Whiting, Fidelity E&P, Hess, Statoil /
Brigham, Citation, Petro-Hunt and others.
Oasis Petroleum, Continental, ExxonMobil / XTO /
Denbury, Whiting, Fidelity E&P, Hess, Statoil /
Brigham, Citation, Petro-Hunt and others.
§ If the Company is successful in achieving an acceptable
price for these assets, the proceeds will be used to pay
down the Company’s revolver and redeployed into its
core operated Bakken and Eagle Ford assets
price for these assets, the proceeds will be used to pay
down the Company’s revolver and redeployed into its
core operated Bakken and Eagle Ford assets
Overview
Asset Map

13
Liquidity and Long-Term Debt
§ YE-12 credit facility availability of $37 million ($113 million drawn on$150 million line), plus $2mm cash = $39mm liquidity
▫ Wall Street median consensus 2013E outspend of ~$27mm
▫ Liquidity coverage 1.5x
§ Credit facility recently raised to $155 million
§ Company plans to continue to pay down credit facility borrowings using divestiture proceeds
▫ $2.9mm received in March 2013 Oil & Gas Clearinghouse Auction; remaining Oklahoma dry gas properties and additional royalty interests in ND
and MT to be auctioned in May
and MT to be auctioned in May
▫ Ongoing non-op Bakken acreage process
Liquidity Bridge: 1/1/2012 to 4/5/2013
(1) Based on Wall Street median estimates
Outlook
|
($ in millions)
|
Jan 1, 2012
|
|
Mar 31, 2012
|
|
Jun 30, 2012
|
|
Sep 30, 2012
|
|
Dec 31, 2012
|
|
Apr 5, 2013
|
||||||
|
Credit Facility Line
|
|
$125
|
|
|
$125
|
|
+15
|
$140
|
|
|
$140
|
|
+10
|
$150
|
|
+5
|
$155
|
|
Less: Borrowings
|
|
115
|
|
|
115
|
|
+10
|
125
|
|
+9
|
134
|
|
-21
|
113
|
|
NA
|
|
|
Availability
|
|
$10
|
|
|
$10
|
|
+5
|
$15
|
|
-9
|
$6
|
|
+31
|
$37
|
|
NA
|
|
|
Plus: Cash
|
|
-
|
|
|
-
|
|
|
0
|
|
+3
|
3
|
|
-1
|
2
|
|
NA
|
|
|
Liquidity
|
|
$10
|
|
|
$10
|
|
+5
|
$15
|
|
-6
|
$9
|
|
+30
|
$39
|
|
NA
|
|
§ Sold Alberta Basin properties and
Nordheim Eagle Ford interest for
~$22mm
Nordheim Eagle Ford interest for
~$22mm
§ Removed $10mm capex /quarter
limitation
limitation
§ Negative current ratio /
covenant waiver
covenant waiver
§ $12.4mm gas hedge monetization during
quarter
quarter
§ Negative current ratio / covenant waiver
§ Implementation of $10mm capex /
quarter restriction and $7.5mm liquidity
quarter restriction and $7.5mm liquidity
§ Borrowing base raised to $155
mm
mm
§ Removed $7.5mm liquidity
covenant and Raven debt from all
debt calculations
covenant and Raven debt from all
debt calculations
14
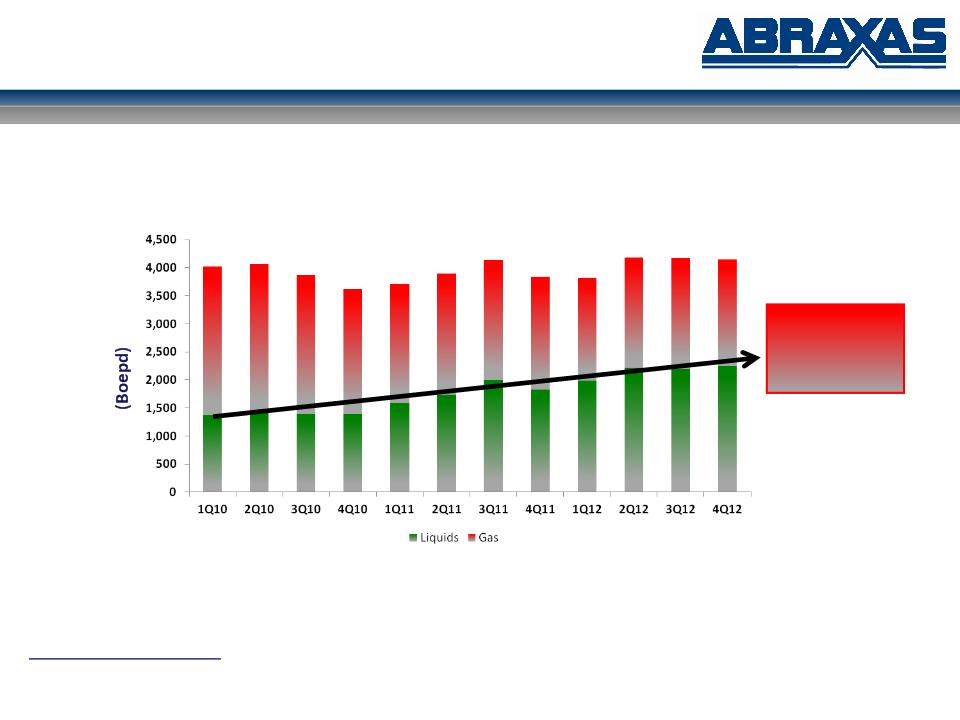
(1) Includes AXAS’ share of Blue Eagle’s production (50% in Q1 and Q2 2011, 41% in Q3 2011 and 35% in Q4 2011, Q1 2012 and Q2 2012)
Oil/NGL % 34% 35% 36% 39% 43% 44% 48% 48% 52% 53% 53% 54%
Production Net to AXAS(1)
65% Liquids
Growth Since
1Q10
Growth Since
1Q10
Refocusing on Oil and Liquids
15
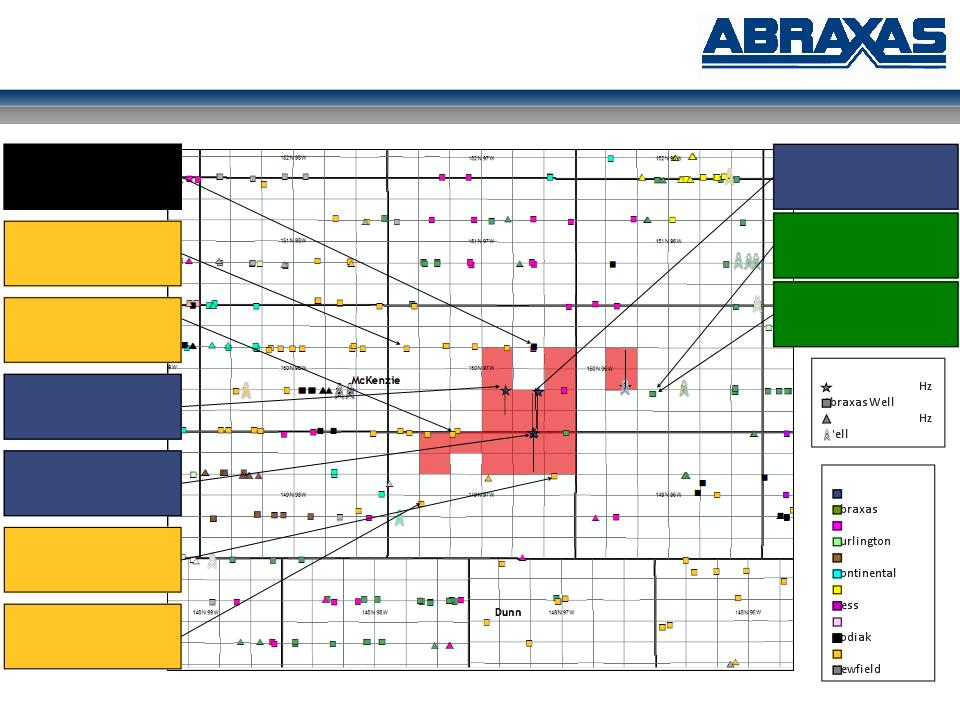
Bakken / Three Forks
Positioned in a Core Area (NorthFork)
Positioned in a Core Area (NorthFork)
Operator
Petro-Hunt
QEP
Slawson
SM
XTO
Other
Symbology
Hz
Permit
Permit
Hz
Rig
Rig
SM
Nelson 15-11H
20 Stages
24-hr IP rate: 994 bbl/d, 1,417 mcf/d
XTO
Lund 26-18SH
22 Stages
24-hr IP rate: 1,252 bbl/d, 2,300
mcf/d
mcf/d
Abraxas
Stenehjem 27-34-1H
17 Stages
24-hr IP rate: 862 bbl/d, 1,365 mcf/d
Abraxas
Jore Federal 2-11-3H
35 Stages
24-hr IP rate: 761 bbl/d, 1,759 mcf/d
XTO
Badlands Federal 21X-13
24 Stages
24-hr IP rate: 1,029 bbl/d, 1,458
mcf/d
mcf/d
XTO
Mariana Trust 12X-20H
Recently Completed
Results Pending
Abraxas
Ravin 26-35-1H
23 Stages
24-hr IP rate: 1,008 bbl/d, 1,342 mcf/d
Burlington
Morgan 21-28MBH-2NH
13 Stages
24-hr IP rate: 2,004 bbl/d, 3,328 mcf/d
Burlington
Kirkland 21-28MBH
12 Stages
24-hr IP rate: 2,325 bbl/d, 4,411 mcf/d
___________________________________
Source: HPDI. Horizontal wells drilled since 1/2010
XTO
Lundin 11-4SH
16 Stages
24-hr IP rate: 878 bbl/d, 1,535 mcf/d

16
Bakken / Three Forks
Positioned in a Core Area (Harding)
Positioned in a Core Area (Harding)
Operator
Whiting
XTO
Zavanna
Zenergy
Other
Symbology
Hz
Permit
Permit
Hz
Rig
Rig
Zenergy
Cayko 22-27H
30 Stages
24-hr IP Rate: 923 bbl/d, 767 mcf/d
Zenergy
Helm 19-30HTF
30 Stages
24-hr IP Rate: 758 bbl/d, 766 mcf/d
Zenergy
Flynn 33-34TF H
Recently Completed
Results Pending
Whiting
Langwald 31-17-1H
Recently Completed
Results Pending
Whiting
Miller 34-8-1H
Recently Completed
Results Pending
Brigham (Statoil)
Sundheim 26-35 2H
Recently Completed
Results Pending
Brigham (Statoil)
Sundheim 26-35-1H
Recently Completed
Results Pending
___________________________________
Source: HPDI. Horizontal wells drilled since 1/2010

17
Focused on successful execution of long lateral horizontals:
§ Reducing costs with pad operations
§ Maintain flexibility & consistency with Company owned drill rig
and in-house team
and in-house team
§ Maintain lateral in the target zone to ensure effective depletion
§ Plug and Perf a large number of stages to maximize drainage
§ Flow back prudently to avoid damaging the formation
The Lillibridge Completion in the North Fork Area
|
Well
|
Objective
|
Lat. Length
|
Stages
|
30-day IP (boepd)
|
Well Cost ($mm)
|
Status
|
|
Ravin 26-35 1H
|
Three Forks
|
10,000
|
23
|
391
|
$13.0
|
Producing
|
|
Stenehjem 27-34 1H
|
Middle Bakken
|
6,000
|
17
|
688
|
$11.5
|
Producing
|
|
Jore Federal 2-11 3H
|
Three Forks
|
10,000
|
35
|
510
|
$8.7
|
Producing
|
|
Ravin 26-35 2H
|
Middle Bakken
|
10,000
|
16
|
421
|
$10.5(1)
|
Producing
|
|
Ravin 26-35 3H
|
Middle Bakken
|
10,000
|
26
|
NA
|
$10.4(1)
|
Significantly outperforming
|
|
Lillibridge 4H
|
Three Forks
|
8,472
|
28
|
NA
|
NA
|
TD/Cased - 50 ft flare through target
|
|
Lillibridge 3H
|
Middle Bakken
|
10,000
|
28
|
NA
|
NA
|
TD/Cased
|
|
Lillibridge 1H, 2H
|
MB, TF
|
10,000
|
28
|
NA
|
NA
|
Intermediate Casing set
|
Bakken / Three Forks
Focused on Execution
Focused on Execution
(1) Does not deduct settlement with third party service provider

18
Bakken / Three Forks
Outperforming Type Curve (NorthFork)
Outperforming Type Curve (NorthFork)
|
Single Well Economics
|
|
|
EUR (Mboe)
|
~462
|
|
Commodity
Split |
80% oil
8% NGLs
11% gas
|
|
D&C Cost
|
$8.5mm
|
|
Type Curve Parameters
|
|
|
di (%)
|
99
|
|
b
|
1.5
|
|
dm (%)
|
7
|
|
GOR (scf/bbl)
|
1,150
|

19
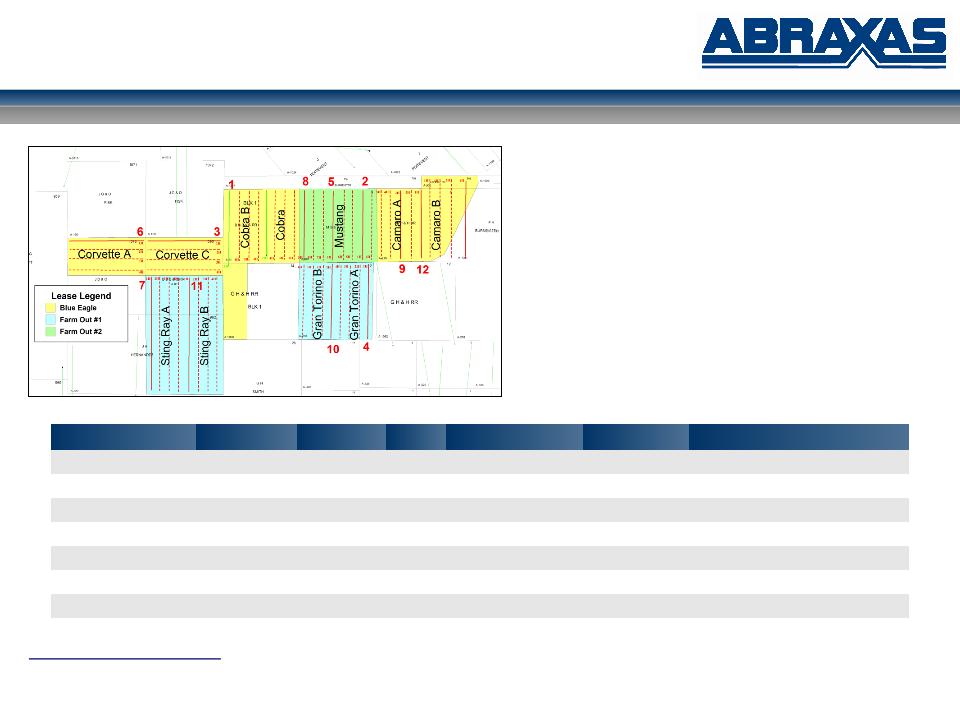
Eagle Ford
Positioned in a Core Area (WyCross)
Positioned in a Core Area (WyCross)
Operator
EOG
Murphy
Swift
Talisman
Other
Symbology
Hz
Permit
Permit
Hz
Rig
Rig
Carrizo
J Rayes B Unit 11H
17 Stages
24-hr IP rate: 626 bbl/d, 624 mcf/d
Carrizo
J Rayes 21H
22 Stages
24-hr IP rate: 879 bbl/d, 276 mcf/d
EOG
San Miguel B Unit 4H
5,845 ft Lateral
24-hr IP rate: 1,213 bbl/d, 495
mcf/d
mcf/d
EOG
Four K Partners 2H
4,736 ft Lateral
24-hr IP rate: 973 bbl/d, 429 mcf/d
Comstock
Cutter Creek 1H
17 Stage Buda completion
24-hr IP rate: 575 bbl/d, 188 mcf/d
Comstock
Cutter Creek 2H
16 Stages
24-hr IP rate: 471 bbl/d, 422 mcf/d
Comstock
Cutter Creek A 1H
15 Stages
24-hr IP rate: 696 bbl/d, 413 mcf/d
Abraxas
Cobra B 1H
19 Stages
24-hr IP rate: 907 bbl/d, 308 mcf/d
Abraxas
Cobra 1H
18 Stages
24-hr IP rate: 1,050 bbl/d, 696 mcf/d
Abraxas
Mustang 1H
19 Stages
24-hr IP rate: 1,086 bbl/d, 689 mcf/d
Chesapeake
Peeler MCM E 3H
6,238 ft Lateral
24-hr IP rate: 857 bbl/d, 164 mcf/d
Chesapeake
Peeler MCM D 4H
6,217 ft Lateral
24-hr IP rate: 694 bbl/d, 924 mcf/d
___________________________________
Source: HPDI. Horizontal wells drilled since 1/2010
20
Eagle Ford
Outperforming Type Curve (WyCross)
Outperforming Type Curve (WyCross)
Focused on aggressive completions on long horizontals:
§ Continuous drilling program with same rig crew
§ Intense focus on Geosteering each well in zone
§ Plug & perf completion with aggressive frac technique
§ Continuously correlate results to identify frac points and
maximize completion
maximize completion
§ Restrict choke on flowback to minimize reservoir damage and
extend life of well
extend life of well
|
Well
|
Objective
|
Lat. Length
|
Stages
|
30-day IP (boepd)
|
Well Cost ($mm)
|
Status
|
|
Cobra 1H
|
Eagle Ford
|
5,000
|
18
|
957
|
$10.1
|
Producing
|
|
Cobra B 1H
|
Eagle Ford
|
5,000
|
19
|
592
|
$6.6
|
Producing
|
|
Mustang 1H
|
Eagle Ford
|
5,000
|
19
|
1,152
|
$8.3
|
Producing
|
|
Corvette C 1H
|
Eagle Ford
|
5,000
|
20
|
867
|
$6.1
|
Producing
|
|
Gran Torino A 1H
|
Eagle Ford
|
5,000
|
21
|
790
|
$7.0
|
Producing
|
|
Mustang 3H
|
Eagle Ford
|
5,000
|
18
|
NA
|
$6.2
|
Outperforming Type Curve
|
|
Mustang 2H
|
Eagle Ford
|
5,000
|
~19
|
NA
|
NA
|
Completing
|
|
Sting Ray A 1H
|
Eagle Ford
|
7,500
|
~28
|
NA
|
NA
|
Drilling
|

21
Eagle Ford
Outperforming Type Curve
Outperforming Type Curve
|
Single Well Economics
|
|
|
EUR (Mboe)
|
~575
|
|
Commodity
Split |
70% oil
11% NGLs
20% gas
|
|
D&C Cost
|
$7.0mm
|
|
Type Curve Parameters
|
|
|
di (%)
|
99.11
|
|
b
|
1.3
|
|
dm (%)
|
7
|
|
GOR (scf/bbl)
|
1,000
|

22
Abraxas’ “Hidden” Gas Portfolio
§ Three Primary Regions (Trends): South Texas (Edwards), Delaware Basin (Montoya, Devonian),
PRB (Turner)
PRB (Turner)
§ Previously booked PUDs now PRUDs - Edwards & Delaware Basin
▫ 23 gross / 18.6 net identified locations
▫ $87.9 million of net investment
▫ 57.6 net bcfe
▫ Assumed F&D = $1.53
§ Total identified total natural gas resource potential (PUD/PRUD/PSUD)
▫ 124 gross / 63 net identified locations
▫ $339+ million of net investment
▫ 128.1+ net bcfe
▫ Assumed F&D = $2.65

23
Additional Development Areas

24
Appendix

25
Converse / Niobrara Counties, Wyoming
§ Gross / Net Acres:
▫ 29,170 / 21,540
▫ Primarily in Converse & Niobrara Counties
▫ ~4,300 net acres in Campbell County
▫ ~90% held by production
§ Historical Activity:
▫ 13 wells (2000 - 2011)
▫ 8 horizontal / 5 vertical
§ Recent Activity:
▫ Hedgehog State 16-2H (Crossbow)
▫ Cum production (11 mos): 112.8 MBoe
▫ 49% Oil / NGLs
Brooks Draw:
Sage Grouse 3H:
(Cum Oil 25 MBbl / 50 MBbl EUR)
Prairie Falcon 3H (Niobrara)
Recent Industry Activity:
74 Permits
8 Completions
Porcupine Field:
Hedgehog State 16-2H (Turner)
PRB - Stacked Pay Opportunities

26
Spires Ranch (Nolan County)
§5,640 gross/net acres; 920 HBPd
§Monitoring industry activity
§Geologic evaluation
§Logged shales through Spires 89 1H
Millican Reef (Coke County)
§6,725 gross/net acres
§Monitoring industry activity
§Geologic evaluation
Permian Basin - Emerging Hz

27
EOG Strikes Oil in Duvernay's East Shale Basin
“New public data for EOG’s Duvernay horizontal at 1-20-38-28W4 showed a peak calendar
-day rate to date of 239 boe/d for December. Oil comprised 88% of the wellhead
production stream…We believe there is a possibility EOG is restricting rates or testing the
well, meaning it could be producing the well intermittently through the months.
-day rate to date of 239 boe/d for December. Oil comprised 88% of the wellhead
production stream…We believe there is a possibility EOG is restricting rates or testing the
well, meaning it could be producing the well intermittently through the months.
The reported rates are in the ballpark of our Eagle Ford West oil type curve peak rate of
~300 boe/d. Under Crown royalties, the Eagle Ford West type curve results in a break-even
price of $82/boe and a per-well NPV of $1 million, assuming a $9 million well cost.”
~300 boe/d. Under Crown royalties, the Eagle Ford West type curve results in a break-even
price of $82/boe and a per-well NPV of $1 million, assuming a $9 million well cost.”
-- ITG, February 7, 2013
Alberta, Canada: Eastern Shale Basin
Recently Drilled
Neighboring Well
Neighboring Well
Duvernay:
§ Net Acres: 42,880 (100% WI)
▫ Crown: 32 Sections; five year leases
▫ Farm-out/option: 35 Sections; three year term
§ Represents a continuous, self sourced resource contained in a shaley organic rich low
permeability reservoir
permeability reservoir
§ Shale assessment and productivity expectations developed based on a review of
analogues (i.e. Eagle Ford, Kaybob, Pembina/ Willesden Green)
analogues (i.e. Eagle Ford, Kaybob, Pembina/ Willesden Green)
§ All critical shale parameters point to the Duvernay being an excellent source and
reservoir rock
reservoir rock
§ Available rock and completion data point to Canaxas lands containing volatile oil
hydrocarbons in place
hydrocarbons in place
Planned Activity:
§ Drill vertical pressure test
Canada - Duvernay

28
Canada - Duvernay

29
Edwards (South Texas)
§PDP: 10.3 bcfe (net)
§ Nordheim 2H: 7.0 bcfe gross
§ Keuster 1H: 10.5 bcfe gross
§ Previous risked offsetting PUD locations: 27.9 bcfe (net)
§ 11 gross / 7 net locations dropped to PRUD (SEC 5 year rule)
§7 gross / 5 net locations drilled / completed, yet to be frac’d: unbooked
§Edwards economics
§ New drill: $7.0 million well / 4.0 bcfe EUR / F&D $1.73/mcfe
§ 20% ROR at $4.30/mcfe realized price
§ Refrac: $0.7 million well / 0.5 bcfe EUR / F&D $1.40/mcfe
§ 20% ROR at $1.98/mcfe realized price
Montoya / Devonian (Delaware Basin, West Texas)
§PDP 28.0 bcfe (net)
§ Caprito 98 98 01U Devonian: 39.0 bcfe gross
§ Howe GU 5 1 Devonian: 31.7 bcfe gross
§Previous risked offsetting PUD locations: 29.7 bcfe (net)
§ 12 gross/ 6 net locations dropped to PRUD (SEC 5 year rule)
§Montoya economics
§ $5.0 million well / 6.6 bcfe EUR / F&D $.75/mcfe
§ 20% ROR at $3.16/mcfe realized price
§Devonian economics
§ $5.8 million well / 7.6 bcfe EUR / F&D $0.76/mcfe
§ 20% ROR at $2.51/mcfe realized price
Other
§Eagle Ford Shale, Yoakum: 1,908 net acres / ~24 net locations, unbooked
§PRB, Turner (~50% gas): 2 gross (1.7 net) PUD / 50 gross (13 net) PRUD locations,
40.6 bcfe (net)
40.6 bcfe (net)
§Delaware Basin, Hudgins Ranch: 3 gross / 2.6 net PSUD locations, 9.1 bcfe (net)
§Delaware Basin, Nine Mile Draw: 40 gross / 31 net PSUD locations, 18.0 bcfe (net)
§Wind River, Cow Hollow Field: 5 gross / .06 net PRUD locations, 0.7 bcfe (net)
§Williston Basin, Red River: 1 gross / .8 net PRUD location, 2.1 bcfe (net)
§Uinta, Chapita Wells, unbooked
(1) Net of purchase price adjustments
(2) PV10 calculated using strip pricing as of 5/1/12 = $2.29
2012 Ward County Acquisition
§Acquisition of Partners’ Interests in West Texas
§ Purchase Price $6.7mm(1)
§ PDP PV -15 $6.7mm(2)
§ Production 1,440 mcfepd
§ Reserves 7.613 bcfe
§ Production $4,650/mcfe/day
§ Reserves: $.88/mcfe
Abraxas’ “Hidden” Gas Portfolio

30
NASDAQ: AXAS