Attached files
| file | filename |
|---|---|
| 8-K - FORM 8-K - MOSAIC CO | d515712d8k.htm |
| EX-99.1 - TRANSCRIPT OF CONFERENCE CALL OF THE MOSAIC COMPANY - MOSAIC CO | d515712dex991.htm |
 The Mosaic Company
Earnings
Conference
Call
–
3rd
Quarter
Fiscal
2013
March 28, 2013
Jim Prokopanko, President and Chief Executive Officer
Larry
Stranghoener,
Executive
Vice
President
and
Chief
Financial
Officer
Laura Gagnon, Vice President Investor Relations
Exhibit 99.2 |
 Safe Harbor Statement
This presentation contains forward-looking statements within the meaning of
the Private Securities Litigation Reform
Act
of
1995.
Such
statements
include,
but
are
not
limited
to,
statements
about
future
financial
and
operating results. Such statements are based upon the current beliefs and
expectations of The Mosaic Company’s management and are subject to
significant risks and uncertainties. These risks and uncertainties include but are
not limited to the predictability and volatility of, and customer expectations
about, agriculture, fertilizer, raw material, energy and transportation
markets that are subject to competitive and other pressures and economic and
credit market conditions; the level of inventories in the distribution channels
for crop nutrients; changes in foreign currency and exchange rates;
international trade risks; changes in government policy; changes in environmental
and other governmental regulation, including greenhouse gas regulation,
implementation of the numeric water quality standards for the discharge of
nutrients into Florida waterways or possible efforts to reduce the flow of
excess
nutrients
into
the
Mississippi
River
basin
or
the
Gulf
of
Mexico;
further
developments
in
judicial
or
administrative proceedings, or complaints that Mosaic’s operations are
adversely impacting nearby business operations or properties; difficulties
or delays in receiving, increased costs of or challenges to necessary
governmental permits or approvals or increased financial assurance requirements;
resolution of global tax audit activity; the effectiveness of the
Company’s processes for managing its strategic priorities; the ability of Mosaic,
Ma’aden and SABIC to agree upon definitive agreements relating to the
prospective joint venture for the Wa’ad Al Shamal
Phosphate
Project,
the
final
terms
of
any
such
definitive
agreements,
the
ability
of
the
joint
venture
to
obtain project financing in acceptable amounts and upon acceptable terms, the
future success of current plans for the
joint
venture
and
any
future
changes
in
those
plans;
adverse
weather
conditions
affecting
operations
in
Central
Florida or the Mississippi River basin or the Gulf Coast of the United States, and
including potential hurricanes, excess rainfall or drought; actual costs of
various items differing from management’s current estimates, including,
among others, asset retirement, environmental remediation, reclamation or other
environmental regulation, or Canadian resources taxes and royalties;
accidents and other disruptions involving Mosaic’s operations, including
brine inflows at its Esterhazy, Saskatchewan potash mine and other potential mine
fires, floods, explosions, seismic events or releases of hazardous or
volatile chemicals, as well as other risks and uncertainties reported from
time to time in The Mosaic Company’s reports filed with the Securities and Exchange Commission. Actual
results may differ from those set forth in the forward-looking statements.
2 |
 Third Quarter Financial Highlights
$0.81 Reported EPS
$0.88* Adjusted, excluding notable items
$2.2 billion
$419 million
* See reconciliation on page 17
0
0
Net Sales
Phosphates
Potash
$1,502
$758
$216
$197
Operating Earnings
3 |
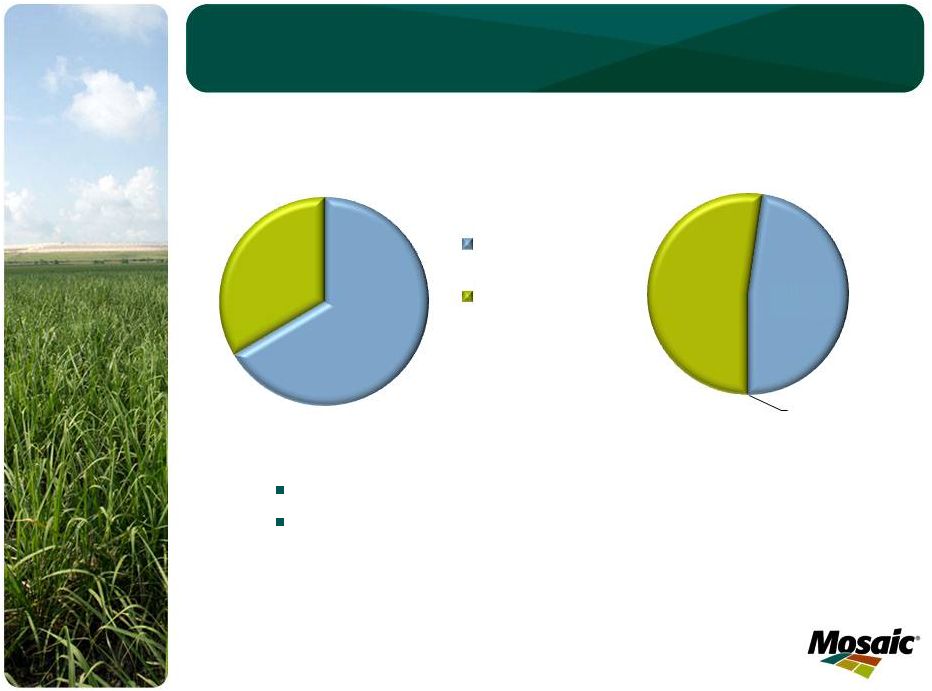
 •
Pent up demand with 2012
US Corn exports down
52% year over year
•
The likely case builds back
one-half of the inventory
drawdown this year
•
Long-term outlook remains
strongly positive
Commodity Prices Likely to Remain Elevated
Considerations
606
579
493
406
468
461
425
436
512
568
545
531
495
Mil Tonnes
World Grain & Oilseed Stocks
Source: USDA and Mosaic
4 |
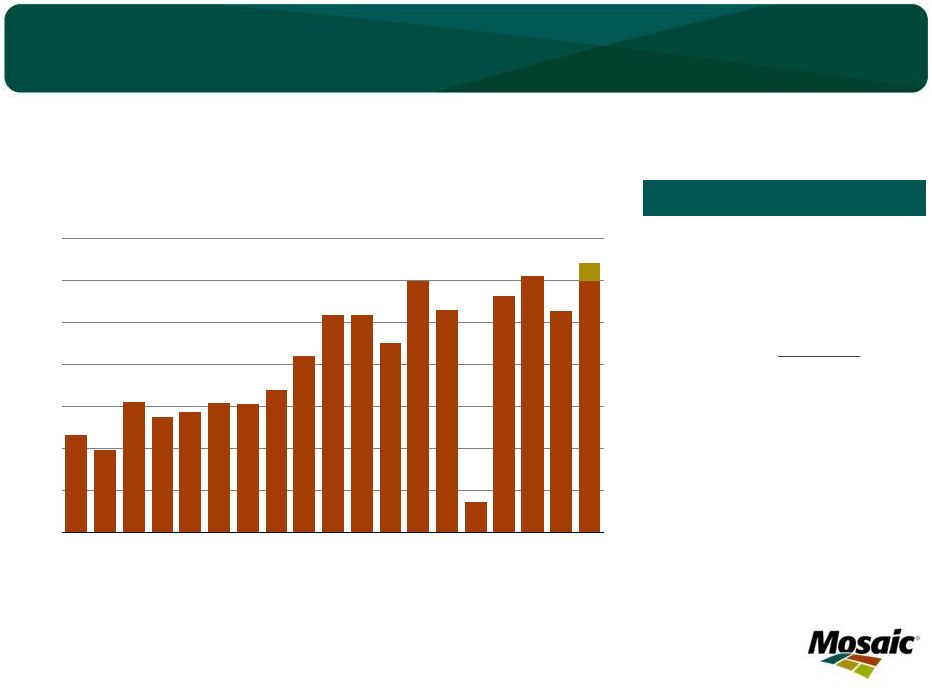 •
Better than expected
baseload demand from
China and India:
•
China imports of ~4.5
mmt
in
FH
2013
•
India imports of 4.0-
4.5 mmt in CY 2013
•
Positive prospects in nearly
all other regions
2013 K Shipments on Track with Forecasts
2013 Potash Shipments
55
52
29
53
56
51
55-57
25
30
35
40
45
50
55
60
95
96
97
98
99
00
01
02
03
04
05
06
07
08
09
10
11
12E
13F
Mil Tonnes
KCl
World Potash Shipments
Source: Fertecon and Mosaic
5 |
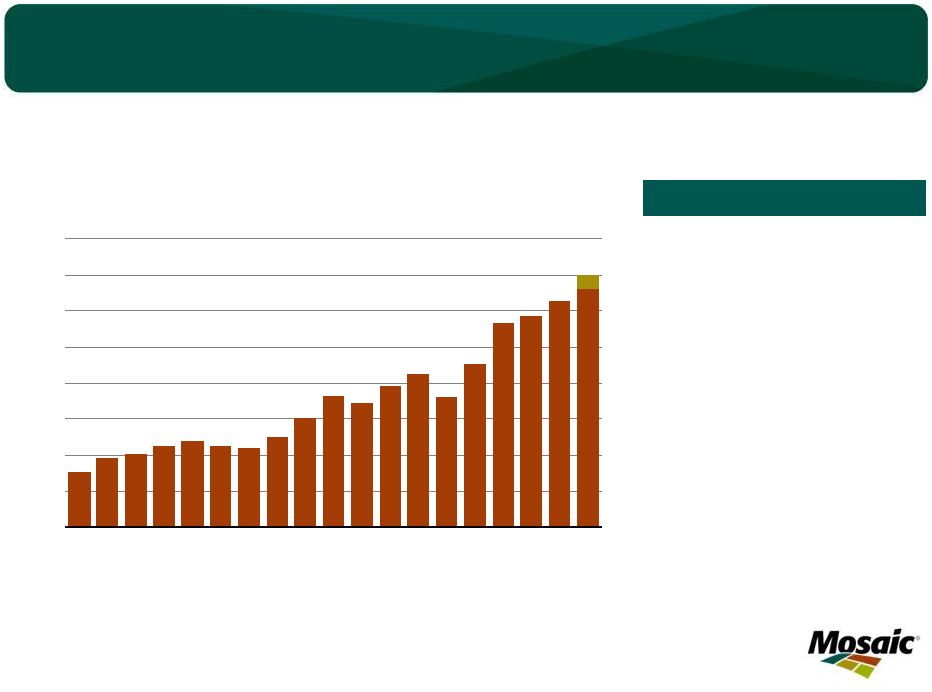 •
Strong Western
Hemisphere demand with
rising prices
•
India not back in the
market until end of fiscal
2013
2013 P Shipments on Track with Forecasts
51
48
53
58
59
61
63-65
30
35
40
45
50
55
60
65
70
95
96
97
98
99
00
01
02
03
04
05
06
07
08
09
10
11
12E13F
Mil Tonnes
DAP/MAP/MES/TSP
Source: Fertecon and Mosaic
Global Phosphate Product Shipments
2013 Phosphate Shipments
6 |
 Ma’aden Joint Venture
•
Aligns with our growth strategy
•
Attractive returns on invested capital
•
Low-cost producer
•
Logistically advantaged to Asian countries
•
Opportunity to participate in future projects
•
Diversifies sources of phosphate rock
7 |
 Financial Results Review |
 9
Unchanged Capital Priorities
Maintain Investment Grade Rating
Improve Balance Sheet Structure
Less cash
More debt
Ample capacity for share repurchases
Use of Cash: Priorities
Finance Organic Growth & Maintain Dividend
Strategic Investments
Additional Returns to Shareholders
Class A share resolution unlikely until later
in the summer |
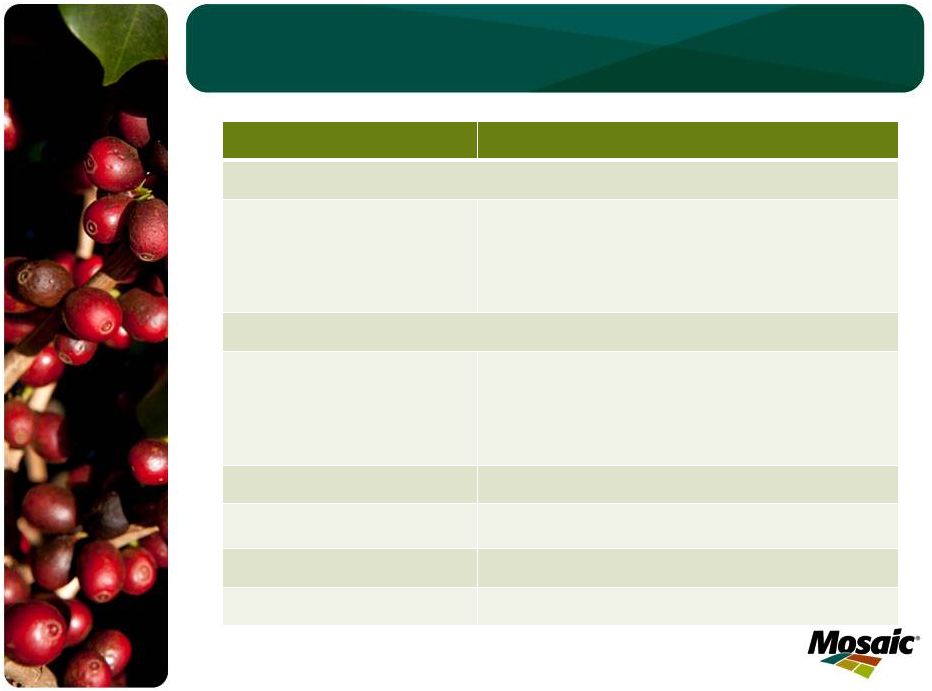 Financial Guidance Summary
Category
Guidance –
Fiscal 2013
Potash
Q4
Sales
volume
2.3
–
2.6
million
tonnes
Q4
MOP
selling
price
$350
-
$380
per
tonne
Q4 Operating rate above 85 percent
Q4
Gross
margin
rate
in
range
of
40
-
45%
Phosphates
Q4 Sales volume 2.6 -
2.9 million tonnes
Q4
DAP
selling
price
$475
-
$505
per
tonne
Q4 Operating rate above 85 percent
Q4 Gross margin rate flat to Q3’FY13
Capital Expenditures
$1.5
-
$1.6
billion
Canadian Resource Taxes
and Royalties
$270
-
$330
million
SG&A
$420
-
$440
million
Effective Tax Rate*
Mid 20-percent range
* For the second half of fiscal 2013
10 |
 |
 Third Quarter Financial Performance
In millions, except per share amounts
Three Months Ended
February 28,
2013
February 29,
2012
Net Sales
$2,241
$2,190
Gross Margin
$568
$522
% of net sales
25%
24%
Net Earnings
$345
$273
% of net sales
15%
13%
Diluted EPS
$0.81
$0.64
Effective Tax Rate
24.0%
24.5%
Cash Flow Provided by Operations
$371
$405
Cash and Cash Equivalents
$3,323
$3,202
12 |
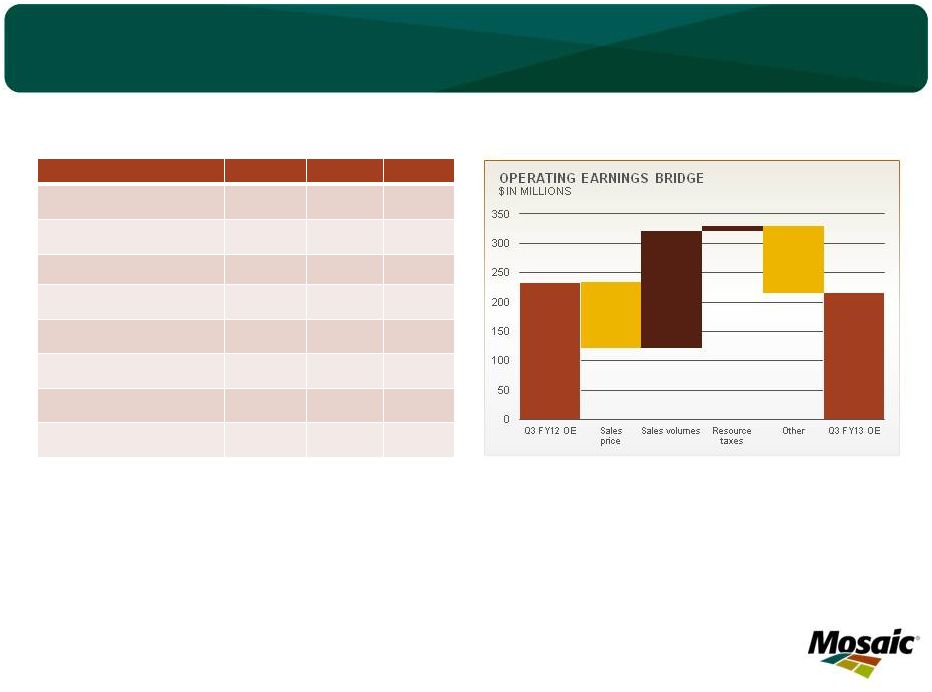 Potash Segment Highlights
In millions, except MOP price
Q3 FY13
Q2 FY13
Q3 FY12
Net sales
$758
$780
$553
Gross Margin
$308
$355
$270
Percent of net sales
41%
46%
49%
Operating earnings
$216
$316
$234
Sales volumes
1.8
1.5
1.1
Production volume
2.0
1.8
1.8
Production operating rate
78%
76%
79%
Avg MOP selling price
$385
$443
$453
Third quarter highlights:
1. Gross margin rate reflects lower average MOP selling price, unfavorable
$24 impact of mark to market of derivatives, and higher depreciation expense
and increased labor expenses in preparation of new capacity ramp-up.
2. Operating earnings include a $42 million charge related to the settlement
of potash anti-trust litigation. 13 |
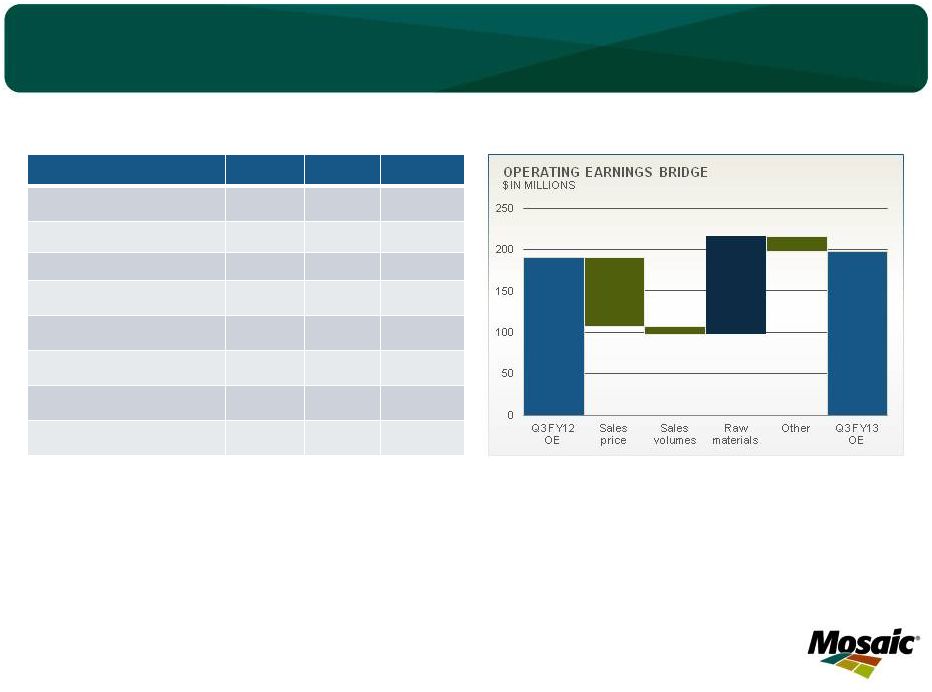 Phosphates Segment Highlights
In millions, except DAP price
Q3 FY13
Q2 FY13
Q3 FY12
Net sales
$1,502
$1,762
$1,652
Gross Margin
$266
$318
$259
Percent of net sales
18%
18%
16%
Operating earnings
$197
$245
$190
Sales volumes
2.6
3.0
2.6
NA production volume
(a)
2.1
2.1
2.0
Finished product operating rate
87%
86%
81%
Avg DAP selling price
$496
$544
$536
(a)
Includes crop nutrient dry concentrates and animal feed ingredients
Third quarter highlights:
1. Year over year improvement in gross margin rate reflects lower raw
material costs, partially offset by lower finished phosphate product
prices. 2. Operating earnings include a $10 million asset retirement
obligation charge. 14 |
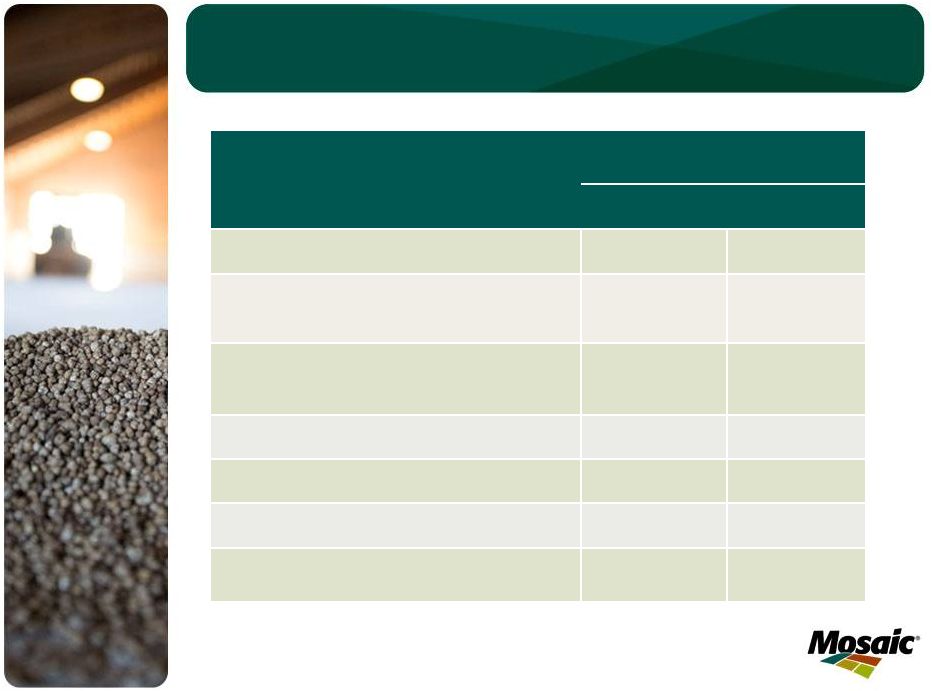
 Raw
Material Cost Detail Mosaic is currently implementing a new inventory valuation
system. After implementation, Mosaic expects to include this information in
its performance data disclosures. Q3 FY13
Percent
Ammonia ($/MT)
Realized in COGS
$540
Average Purchase Price
$663
Sulfur ($/LT)
Realized in COGS
$181
Average Purchase Price
$173
Phosphate rock (used in production)
('000 metric tonnes)
US mined rock
3,137
88%
Purchased Miski Mayo rock
296
8%
Other purchased rock
144
4%
Total
3,577
100%
Average cost / tonne consumed rock
$65
15 |
 Earnings
Sensitivity
to
Key
Drivers
(a)
FY13 Q3
Actual
Change
FY13 Q3
Margin %
Actual
% Impact on
Segment
Margin
Pre-Tax
Impact
EPS
Impact
Marketing
MOP Price ($/tonne)
(b)
$385
$50
40.7%
10.6%
$80
$0.14
Potash Volume
(million tonnes)
1.8
0.5
40.7%
16.9%
$128
$0.23
DAP Price ($/tonne)
$496
$50
17.7%
8.0%
$120
$0.21
Phosphate Volume
(million tonnes)
2.6
0.5
17.7%
5.1%
$76
$0.14
Raw Materials
Sulfur ($/lt)
$181
$50
17.7%
3.3%
$49
$0.09
Ammonia ($/tonne)
$540
$50
17.7%
1.8%
$26
$0.05
(a)
These factors do not change in isolation; actual results could vary from the above
estimates (b)
Assumes no change to KMAG pricing
16 |
 Adjusted Earnings Reconciliation
Reconciliation of Net Income Attributable to Mosaic to Non-GAAP Adjusted Net
Income Attributable to Mosaic and Earnings per Share
17
Three months ended
February 28, 2013
(in millions, except per share amounts)
Net earnings attributable to Mosaic as reported
344.6
Pre-tax adjustments:
Potash antitrust settlement
41.8
Potash unrealized loss on derivatives in cost of goods sold
24.1
Foreign currency transaction gain
(32.3)
Phosphates ARO revision for closed facilities
10.0
Total pre-tax adjustments
43.6
Income tax effect of adjustments*
(10.9)
Non-GAAP adjusted net income attributable to Mosaic
377.3
Non-GAAP adjusted diluted earnings per share attributable to Mosaic
0.88
Weighted average common shares used in computing diluted earnings per share
427.1
* Estimated annual effective tax rate of 25% based on our guidance.
$
$
$
We report our financial results in conformity with U.S. generally accepted accounting principles
("GAAP"). However, we are providing non-GAAP adjusted net income and
non-GAAP adjusted earnings per share because certain items are customarily excluded by analyst in published estimates and
management believes, for purposes of comparability to financial performance in other periods and to
evaluate the Company's trends, that excluding the effects of these items is appropriate.
The adjusted amounts are not measures of financial performance under GAAP.
Adjusted net income and adjusted net income per diluted share should not be considered in isolation or
as a substitute for net income or earnings per diluted share, income from operations, cash
provided by operating activities or other income, profitability, cash flow or liquidity measures prepared under
U.S. GAAP. Because adjusted net income and adjust net income per diluted share exclude some but
not all items that affect net income and may vary among companies, the adjusted net income and
adjusted net income per diluted share amounts presented may not be comparable to similarly titled
measures of other companies.
|