Attached files
| file | filename |
|---|---|
| 8-K - 8-K - EP Energy LLC | a13-9421_18k.htm |
Exhibit 99.1
|
|
EP Energy’s Wolfcamp Evolution Richard Little Vice President-Southern Division EP Energy April 3, 2013 |
|
|
Cautionary Statement Regarding Forward-Looking Statements This presentation includes certain forward-looking statements and projections of EP Energy LLC (“EP Energy”). EP Energy has made every reasonable effort to ensure that the information and assumptions on which these statements and projections are based are current, reasonable, and complete. However, a variety of factors could cause actual results to differ materially from the projections, anticipated results or other expectations expressed, including, without limitation, the supply and demand for oil, natural gas and NGLs; EP Energy’s ability to meet production volume targets; the uncertainty of estimating proved reserves and unproved resources; the future level of service and capital costs; the availability and cost of financing to fund future exploration and production operations; the success of drilling programs with regard to proved undeveloped reserves and unproved resources; EP Energy’s ability to comply with the covenants in various financing documents; EP Energy’s ability to obtain necessary governmental approvals for proposed E&P projects and to successfully construct and operate such projects; actions by the credit rating agencies; credit and performance risk of EP Energy’s lenders, trading counterparties, customers, vendors and suppliers; changes in commodity prices and basis differentials for oil and natural gas; general economic and weather conditions in geographic regions or markets served by EP Energy, or where operations of EP Energy are located, including the risk of a global recession and negative impact on natural gas demand; the uncertainties associated with governmental regulation, including any potential changes in federal and state tax laws and regulation; political and currency risks associated with international operations of EP Energy; competition; and other factors described in EP Energy’s Securities and Exchange Commission filings. While EP Energy makes these statements and projections in good faith, neither EP Energy nor its management can guarantee that anticipated future results will be achieved. Reference must be made to those filings for additional important factors that may affect actual results. EP Energy assumes no obligation to publicly update or revise any forward-looking statements made herein or any other forward-looking statements made by EP Energy, whether as a result of new information, future events, or otherwise. Certain of the production information in this presentation includes the production attributable to EP Energy’s 48.8 percent interest in Four Star Oil and Gas Company (“Four Star”). In addition, the proved reserves attributable to its interest in Four Star represent estimates prepared by EP Energy and not those of Four Star. This presentation presents certain production and reserves-related information on an "equivalency" basis. Equivalent volumes are computed with oil and natural gas liquid quantities converted to Mcf at a ratio of one Bbl to six Mcf, and natural gas converted to barrels at a ratio of six Mcf to one Bbl. These conversions are based on energy equivalency conversion methods primarily applicable at the burner tip and do not represent value equivalencies at the wellhead. Although these conversion factors are industry accepted norms, they are not reflective of price or market value differentials between product types. This presentation also refers to the non-GAAP term EBITDAX, which the company defines as net income plus interest and debt expense, income taxes and depreciation, depletion and amortization and exploration expenses. |
|
|
EP Energy’s Story |
|
|
Purpose: What We Do At EP Energy, we have a passion for finding and producing the oil and natural gas that enriches people's lives |
|
|
Vision: Where We're Going |

|
|
Values: How We Behave |

|
|
Strategy: How We'll Get There Invest Execute Focus Foster to improve efficiency and maximize returns. in repeatable programs with significant project inventory. on assets that fit and divest of those that do not. A culture of high performance, high energy, and growth. |
|
|
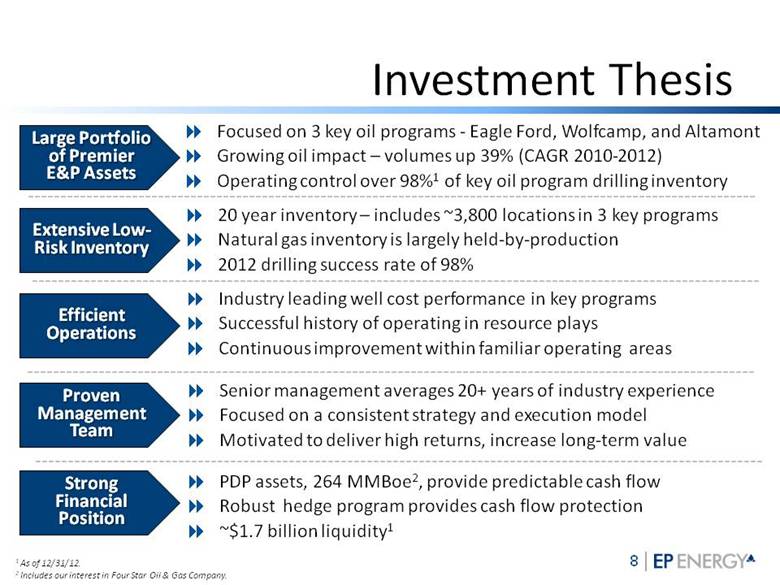
Investment Thesis Focused on 3 key oil programs - Eagle Ford, Wolfcamp, and Altamont Growing oil impact – volumes up 39% (CAGR 2010-2012) Operating control over 98%1 of key oil program drilling inventory 20 year inventory – includes ~3,800 locations in 3 key programs Natural gas inventory is largely held-by-production 2012 drilling success rate of 98% 1 As of 12/31/12. 2 Includes our interest in Four Star Oil & Gas Company. Large Portfolio of Premier E&P Assets Industry leading well cost performance in key programs Successful history of operating in resource plays Continuous improvement within familiar operating areas PDP assets, 264 MMBoe2, provide predictable cash flow Robust hedge program provides cash flow protection ~$1.7 billion liquidity1 Senior management averages 20+ years of industry experience Focused on a consistent strategy and execution model Motivated to deliver high returns, increase long-term value Strong Financial Position Proven Management Team Extensive Low-Risk Inventory Efficient Operations |
|
|
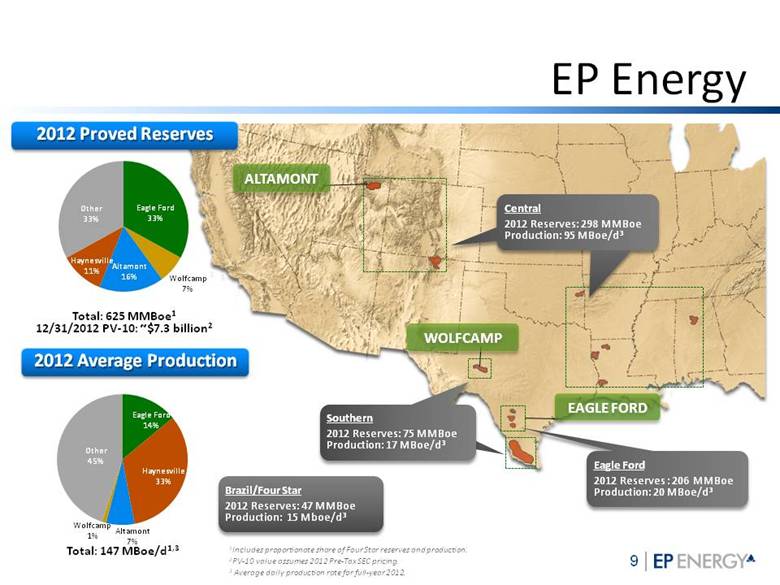
EP Energy EAGLE FORD ALTAMONT WOLFCAMP Southern 2012 Reserves: 75 MMBoe Production: 17 MBoe/d3 Brazil/Four Star 2012 Reserves: 47 MMBoe Production: 15 Mboe/d3 Eagle Ford 2012 Reserves : 206 MMBoe Production: 20 MBoe/d3 2012 Proved Reserves Total: 625 MMBoe1 12/31/2012 PV-10: ~$7.3 billion2 Total: 147 MBoe/d1,3 2012 Average Production Eagle Ford 33% Wolfcamp 7% Other 33% Other 45% Eagle Ford 14% Haynesville 33% Altamont 7% Wolfcamp 1% Haynesville 11% 1Includes proportionate share of Four Star reserves and production. 2PV-10 value assumes 2012 Pre-Tax SEC pricing. 3 Average daily production rate for full-year 2012. |
|
|
20+ Year Inventory Note: As of 12/31/12, includes PUD locations and PUD reserves in resource potential Key Programs Drilling Locations Eagle Ford 1,176 Wolfcamp 1,292 Altamont 1,386 Total 3,854 ALTAMONT WOLFCAMP EAGLE FORD Total resource potential 1.6 billion BOE ~ 70% located in these 3 programs |
|
|
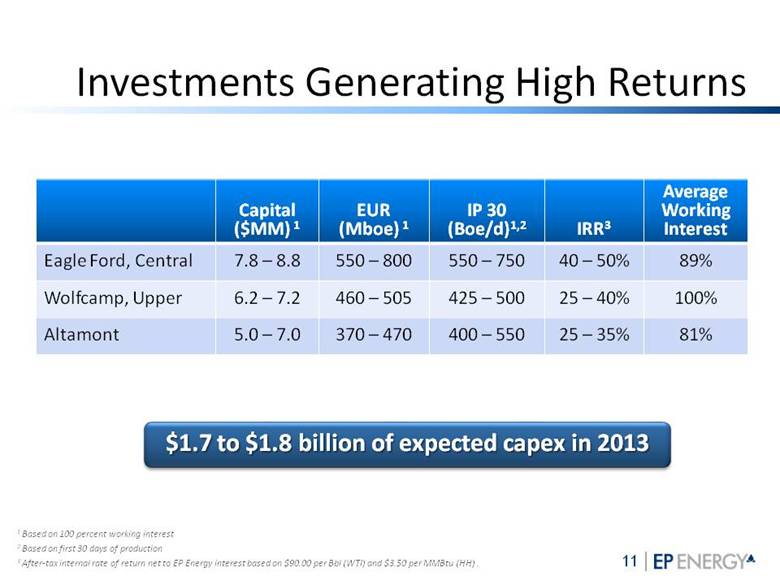
Investments Generating High Returns Capital ($MM) 1 EUR (Mboe) 1 IP 30 (Boe/d)1,2 IRR3 Average Working Interest Eagle Ford, Central 7.8 – 8.8 550 – 800 550 – 750 40 – 50% 89% Wolfcamp, Upper 6.2 – 7.2 460 – 505 425 – 500 25 – 40% 100% Altamont 5.0 – 7.0 370 – 470 400 – 550 25 – 35% 81% 1 Based on 100 percent working interest 2 Based on first 30 days of production 3 After-tax internal rate of return net to EP Energy interest based on $90.00 per Bbl (WTI) and $3.50 per MMBtu (HH) . $1.7 to $1.8 billion of expected capex in 2013 |
|
|
2013 Capital Budget Estimated Allocation Entirely focused on high return oil programs $1.7 – $1.8 billion Eagle Ford Wolfcamp Altamont Other |
|
|
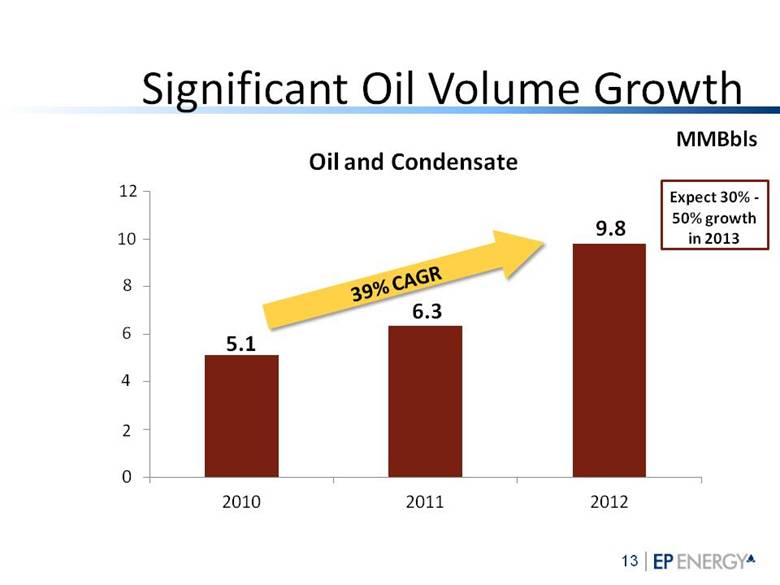
Significant Oil Volume Growth 5.1 6.3 9.8 MMBbls Oil and Condensate 39% CAGR Expect 30% - 50% growth in 2013 2 4 6 8 10 12 0 2010 2011 2012 |
|
|
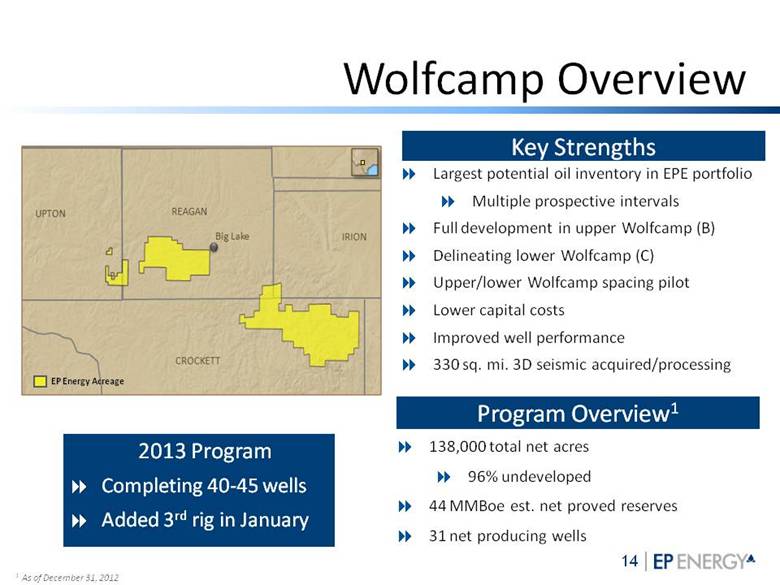
Wolfcamp Overview 1 As of December 31, 2012 Key Strengths Program Overview1 Largest potential oil inventory in EPE portfolio Multiple prospective intervals Full development in upper Wolfcamp (B) Delineating lower Wolfcamp (C) Upper/lower Wolfcamp spacing pilot Lower capital costs Improved well performance 330 sq. mi. 3D seismic acquired/processing 138,000 total net acres 96% undeveloped 44 MMBoe est. net proved reserves 31 net producing wells 2013 Program Completing 40-45 wells Added 3rd rig in January EP Energy Acreage |
|
|
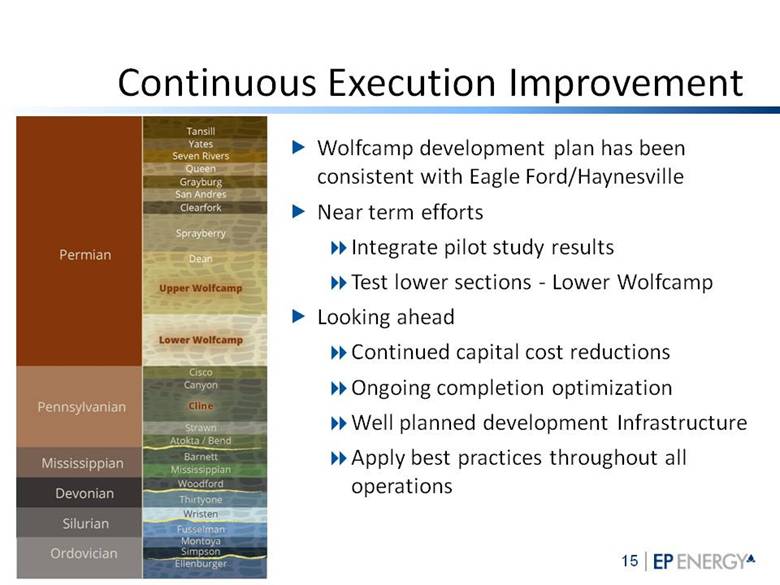
Continuous Execution Improvement Wolfcamp development plan has been consistent with Eagle Ford/Haynesville Near term efforts Integrate pilot study results Test lower sections - Lower Wolfcamp Looking ahead Continued capital cost reductions Ongoing completion optimization Well planned development Infrastructure Apply best practices throughout all operations |
|
|
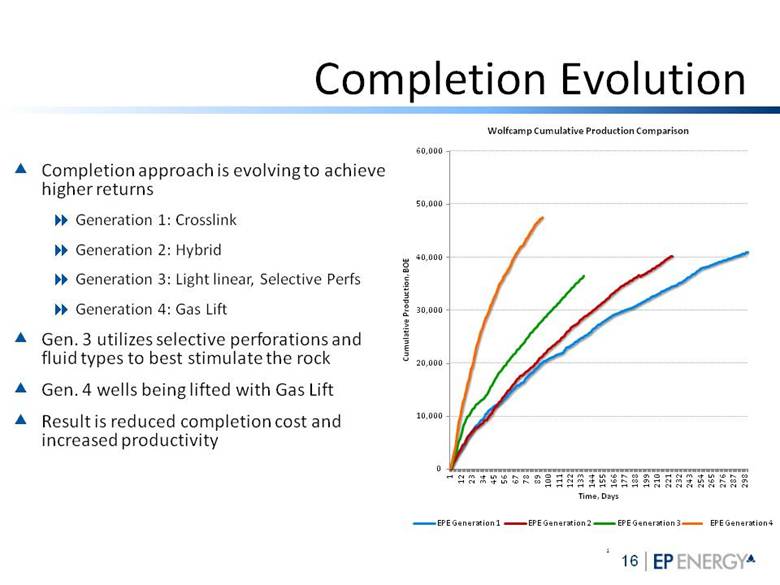
Completion Evolution 1 Completion approach is evolving to achieve higher returns Generation 1: Crosslink Generation 2: Hybrid Generation 3: Light linear, Selective Perfs Generation 4: Gas Lift Gen. 3 utilizes selective perforations and fluid types to best stimulate the rock Gen. 4 wells being lifted with Gas Lift Result is reduced completion cost and increased productivity EPE Generation 4 |
|
|
Total well cost reduced from 2012 to 2013 YTD Drilling longer laterals and completing more stages Days spud to TD continue to drop Completions stages per day continue to increase Individual well performance continues to improve from well to well Type curve continues to be validated by production Justifiable range for recoverable reserves per well is tightening Supported by early reservoir simulation models Operational Overview |
|
|
Utilization of science, technology, and experience has enhanced EPE performance to date and will continue to help guide future execution Timing key in understanding reservoir characteristics and key production drivers Whole cores, extensive logging suites 3D Seismic interpretation Micro-seismic interpretation Reservoir Modeling Multiple studies done to determine optimum landing zone, completion design, flowback program, etc. Ramp in activity to follow delineation of secondary objectives and acquisition of 3D seismic Create a development plan that allows for both optimized completions and cost savings from shared infrastructure. Operational Overview |
|
|
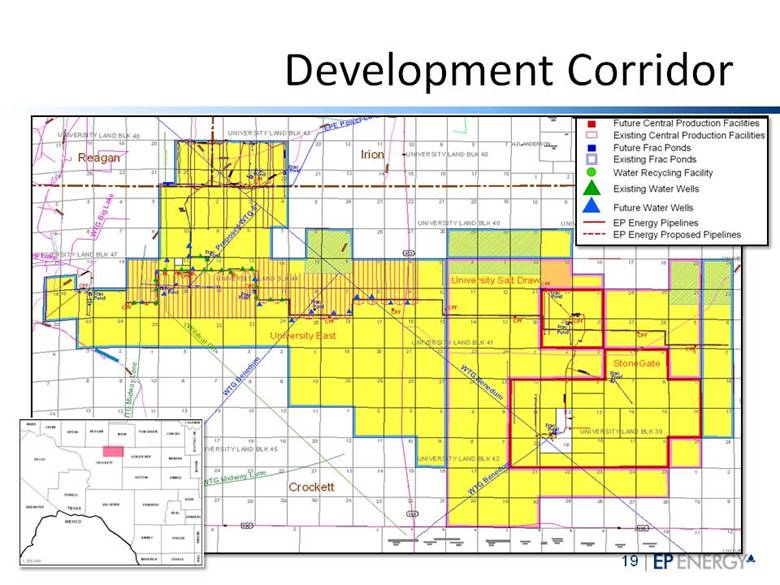
Development Corridor |
|
|
EP Energy-Building on Success |
|
|
Successful 2012 PV10 Value of $7.3 billion + 4% Oil reserves of 261 MMBbl +43% Total production of 147 MBoe/d + 5% Oil production of 27 MBbl/d +55% Increase from 2011 Delivered outstanding returns from capital program |
|
|
Building Premium Valuation Execution Capital program Cost control Base production optimization Running room Repeatable, multi-year inventory Quality assets in the right places Profitability Strong investment returns Expanding margins Growing cash flows Consistent performance Focused on growing production, cash flows, and reserves |
|
|
EP Energy’s Wolfcamp Evolution Richard Little Vice President-Southern Division EP Energy April 3, 2013 |